Abstract
Fisheries using bottom-towed fishing gears are a localised pressure that causes physical disturbance to the seabed habitats. To meet the requirements of ecosystem-based fisheries management, it is essential to have high-resolution remote electronic monitoring fisheries data with appropriate spatial resolution to evaluate the direct impact of fishing activities. The resolution of the fishery data must align with both the spatial operational characteristics of the fishery and the conservation objectives under review, such as habitat and species distribution. Here we show how Black Box (BB) data logging actual fishing activity locations can be used to assess the direct footprint of bivalve fishing on eelgrass meadows. Our findings demonstrated that i) Actual logged fishing tracks (BB data) can document no overlap with known observations of eelgrass meadows, while low-resolution fisheries data (VMS data) showed an overlap with eelgrass meadows. Furthermore, the VMS data from a few vessels showed 2.5 greater overlap with areas assessed as suitable for eelgrass compared to actual tracks logged by the BB from the entire fleet. These findings emphasise the importance of equipping fishing vessels with electronic monitoring systems that capture actual fishing activity locations. This enables us to accurately track the areas impacted by fisheries, and when combined with high-resolution habitat monitoring, it facilitates ecosystem-based fishery management and ensures the achievement of nature conservation goals.
1 Introduction
Over the past 20 years, fisheries management has evolved from species-based management approaches focused on the protection of specific stocks to ecosystem-based management incorporating environmental and ecological impacts of the fisheries (Zacharias and Roff, 2000; Borja, 2005; Roberts et al., 2005; Pedersen et al., 2009; Townsend et al., 2019). Human activities affecting the marine environment should be balanced between nature protection and economic activities (Smith and Wilen, 2003; Douvere, 2008; Suuronen et al., 2010; Halpern et al., 2012), to ensure that human activities do not pose significant risks to the marine ecosystem and thus ensure a legitimate use of the sea (Smith et al., 2016). Fisheries have direct, indirect, and cumulative impacts on marine ecosystem, including habitats, species diversity, and productivity (Jennings and Kaiser, 1998; Moritz et al., 2015; de Juan et al., 2018). Fishing with bottom-towed gear abrades the seabed, affecting different habitats and their diverse associated sedentary and mobile benthic species (Dayton et al., 1995; Jennings and Kaiser, 1998; Smith et al., 2016). Fisheries monitoring and detailed mapping of benthic habitats are essential for assessing impacts of fisheries using bottom-towed gear (Reiss et al., 2015; Kaiser et al., 2016; Amoroso et al., 2018; Rowlands et al., 2019; van der Reijden et al., 2021) and thus to be able to implement systematic and integrated ecosystem-based fisheries management (Gislason et al., 2000; Dickey-Collas et al., 2022) to achieve biodiversity and biodiversity management objectives; for example, the Kunming-Montreal Global Biodiversity Framework, the EU Marine Strategy Framework Directive (MSFD) (2008/56/EC), and the EU Water Frame Directive (WFD) (2000/60/EC). The MSFD and WFD addresses the pressures imposed by human activity on the sea and specifies the ‘integrity of the seabed’ as a criterion for ‘good environmental status’ (GES) to ensure that critical ecosystem goods and services are not adversely affected. More specifically, the WFD defines GES as a situation where identified bioindicators only deviate slightly from undisturbed conditions. For Danish coastal waters, the eelgrass depth limit is identified as one of the useful bioindicator of water quality in the WFD. Obstacles to the assessment of fisheries impact on ecosystems are often the lack of high-resolution data for quantitative assessment of activities (Lambert et al., 2012; Sköld et al., 2018), poor mapping of benthic habitats or an overlap of fisheries and other existing basin-scale pressures, such as eutrophication (McLaverty et al., 2020) or natural disturbances, for example, bottom water current speed, salinity, habitat specific and seasonal conditions (Sciberras et al., 2013; Szostek et al., 2016; Nielsen et al., 2023).
Data sources for assessment of fisheries footprint include Vessel Monitoring System (VMS), Automatic Identification System (AIS), and other Electronic Monitoring systems (EM) (Eigaard et al., 2017; Dunn et al., 2018; James et al., 2018; Li et al., 2021). VMS and AIS data are proven to be effective in monitoring fishing efforts (Zhang et al., 2016; Holmes et al., 2020) and can be used to study fishing activities, such as quantifying trawling intensity and tracking trawl paths (Deng et al., 2011; Gerritsen and Lordan, 2011). In addition, the combination of VMS data with logbook records provides information on the catch and gear, enabling a detailed analysis of catch and effort distribution (Hintzen et al., 2012; Russo et al., 2014; Mendo et al., 2024). However, it is often difficult to estimate the fishing activities of small-scale fleets; as in the EU, only vessels with a length >10 m must fill a logbook, and only vessels >12 m is required to use VMS (2009/1224/EC; Pedersen et al., 2009; Rijnsdorp et al., 2020). As a result, there is limited information on fishing effort, fishing gear use, locations of fishing operations, catches, and landings, and therefore insufficient information for sustainable management of small-scale fishing fleets or evaluation of their impact on marine ecosystems (Dalskov et al., 2021). This is problematic as this fleet is mostly active in coastal waters where vulnerable habitats like eelgrass meadows are found. In recent years, electronic monitoring systems with cameras and gear sensors, or the use of tablets and mobile phones for electronic reporting or monitoring, have been deployed around the world to improve regulatory compliance and provide documentation of small-scale fishing practices (Dalskov et al., 2021; ICES, 2023), as well as developing procedures to classify fishing activities in small-scale fisheries by analysing fishing behaviour using high resolution data (Behivoke et al., 2021; Rufino et al., 2023) to support full digital traceability along the fishing and aquaculture) supply chain (2023/2842/EU).
In this study, the Black Box electronic monitoring system (BB) is demonstrated to be an effective tool for documenting individual fishing activities to support an ecosystem-based management and ensure nature conservation objectives. The BB system records bivalve fishing activities by high-resolution spatiotemporal data (10 seconds and 10 m of space recording) and sensor-registered fishing activity location (individual dredge tracks). The analyses are performed on BB data from blue mussel fishery in a coastal area in Denmark to evaluate the fishery footprint in relation to the known and potential (future) distribution of eelgrass meadows to comply with the objectives of GES according to the EU WFD.
2 Methods
2.1 Description of the Danish bivalve fishery
Danish bivalve fishing is a small-scale vessel fishery (SSF) that operates with a vessel size <16 m and close to the shoreline on a single day basis. The target species are blue mussel (Mytilus edulis), common cockle (Cerastoderma edule), and European flat oyster (Ostrea edulis), where European flat oyster and common cockle are caught only in Limfjorden (Figure 1). The Limfjorden is the main bivalve fishing area in Denmark and furthermore also the main area for aquaculture production of both suspended and on-bottom cultivation of blue mussels.
Figure 1
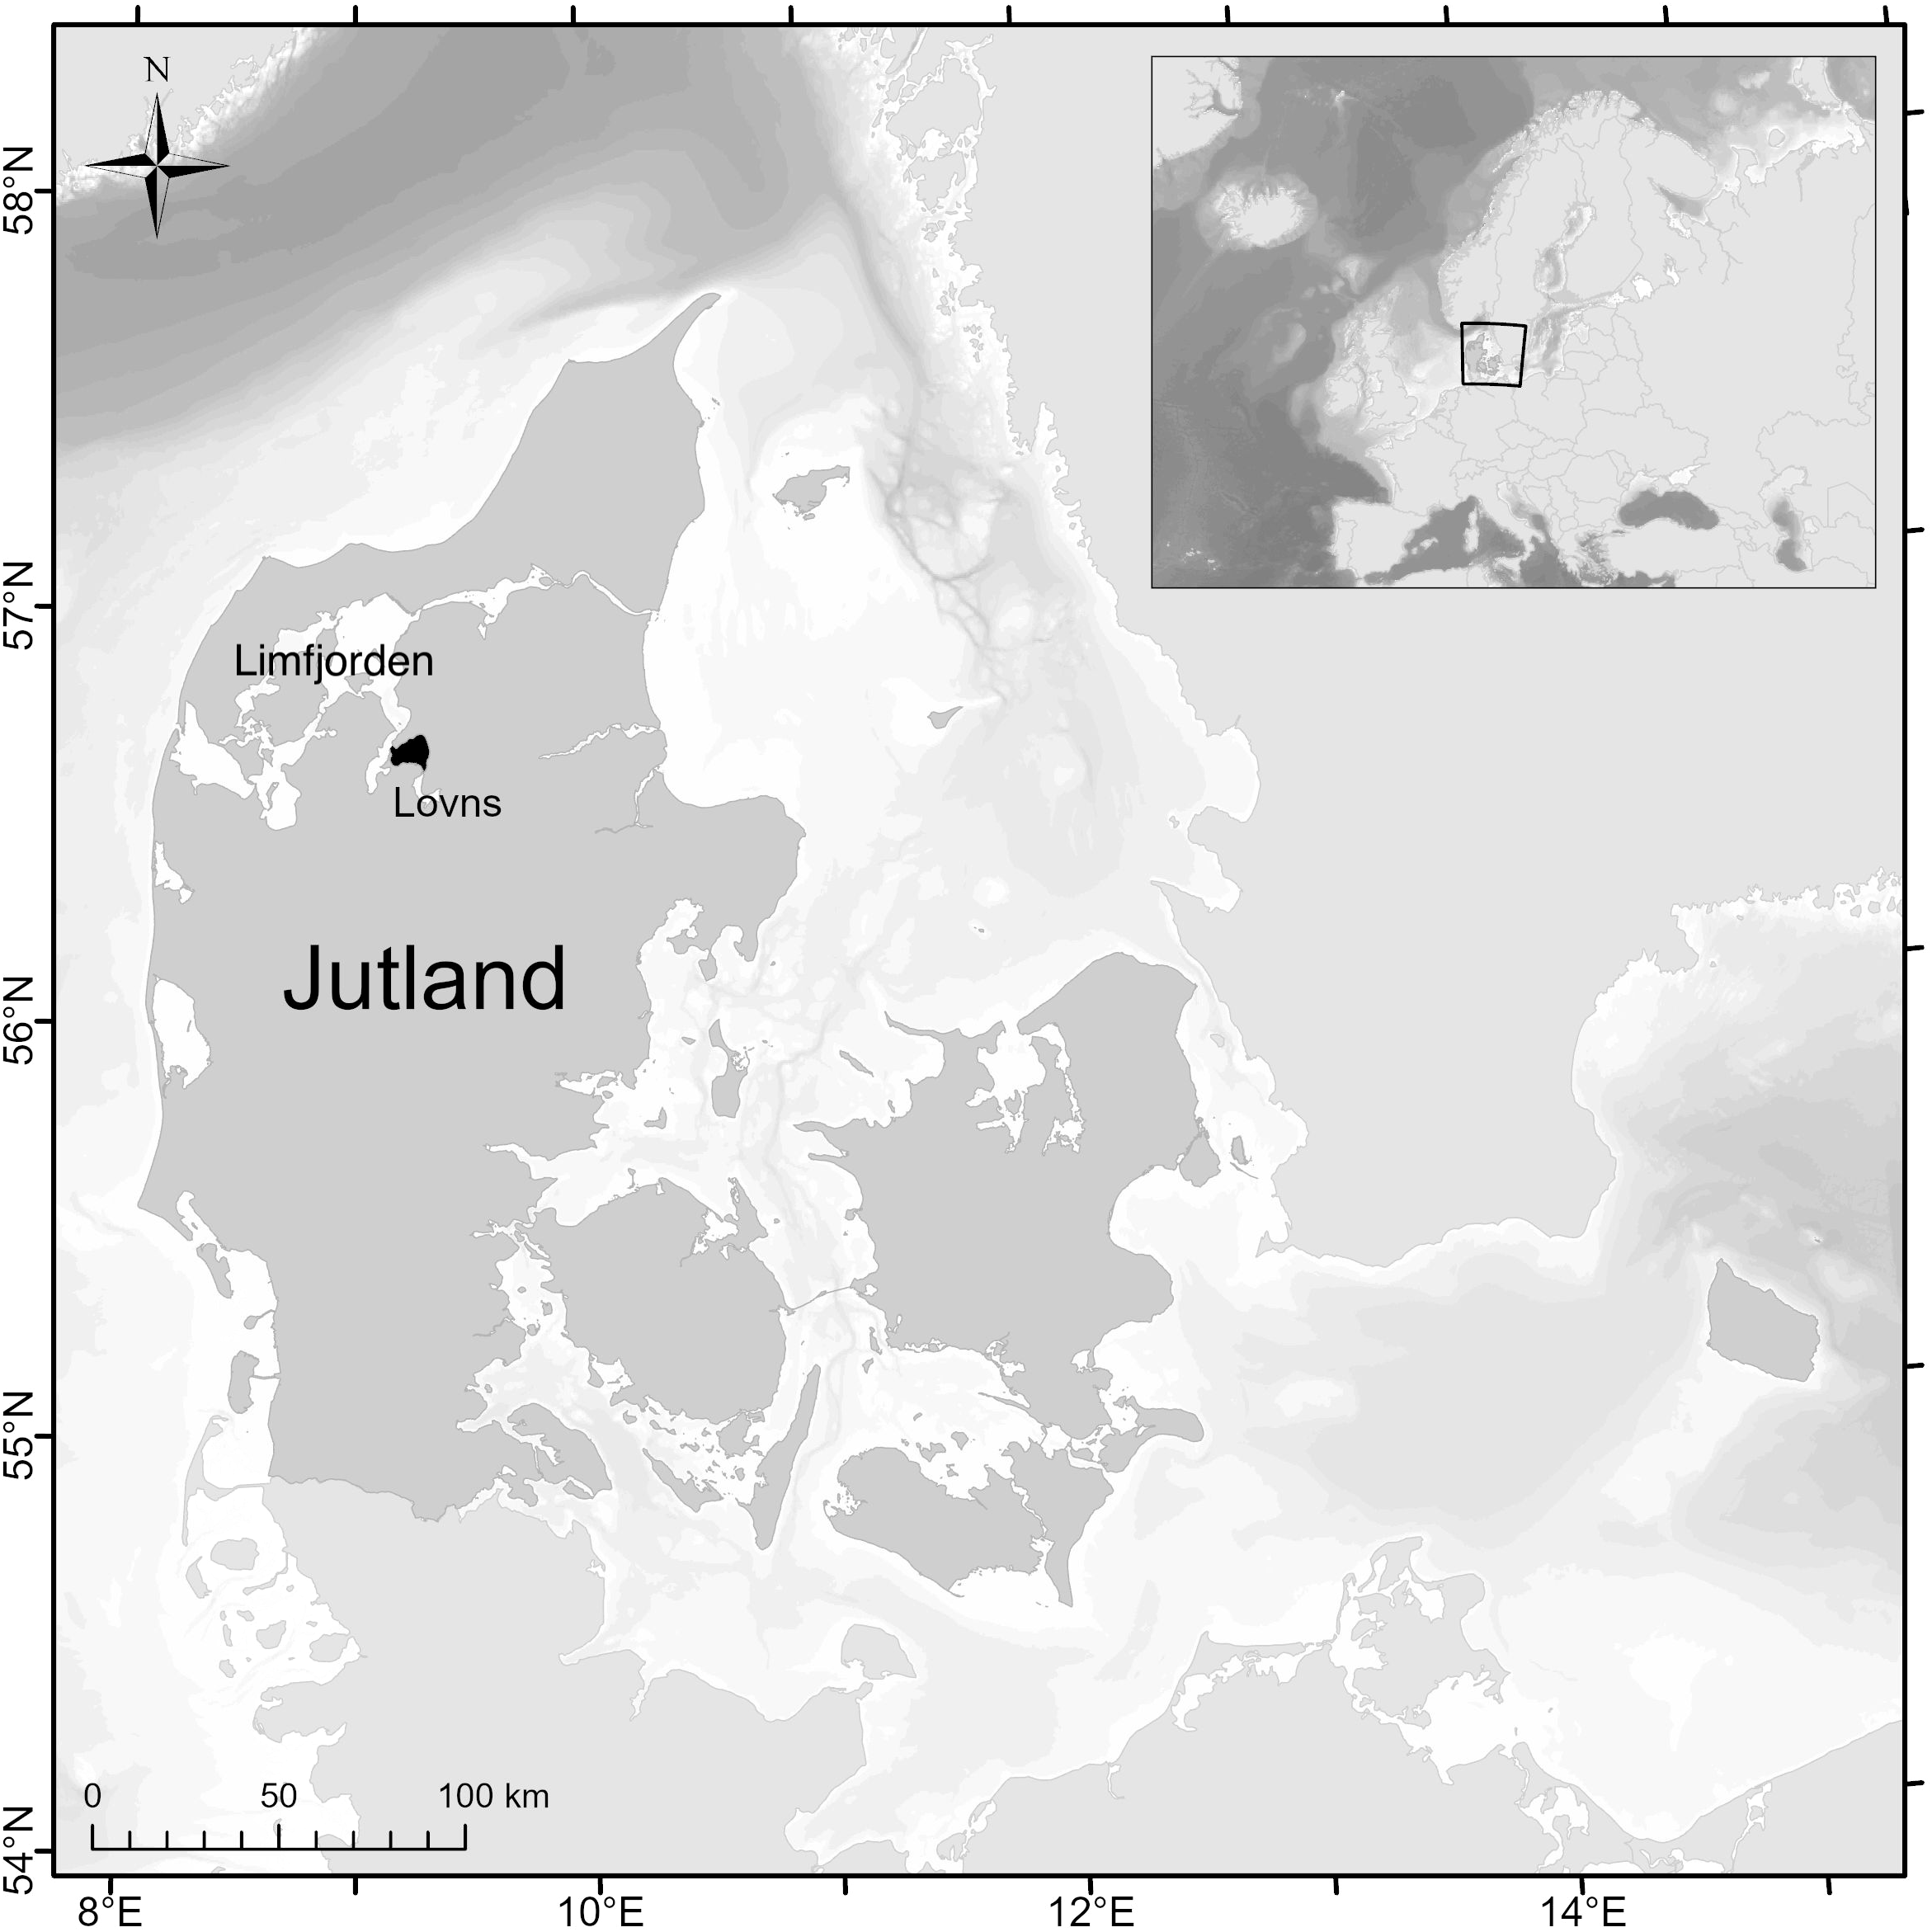
Map of Denmark. Indicating the main area (Limfjorden) where bivalve fishery is taken place and the location of the study area, Lovns Bredning.
In Limfjorden, blue mussels are fished using a light mussel dredge that is 1.5 m wide (Frandsen et al., 2015) with each vessel carrying two or four dredges. The fishing activities are conducted at a speed generally ranging from two to four knots, lasting generally <10 minutes, which creates dredge tacks between 300 to 600 meters. The Danish bivalve fishery operates under a one-year fishing season requiring renewal of licenses every year. In the Limfjorden, the blue mussel fishing season runs from the first Sunday in September to the first Sunday in July the year after.
All Danish bivalve fishing vessels must have an electronic monitoring system installed (Black Box, see details below) and fill a fishing logbook of their operations in accordance with the Council Regulation (EC) 1224/2009 and the Commission Implementing Regulation (EU) 404/2011.
2.2 The black box electronic monitoring system
Since autumn 2012, all Danish bivalve fishing vessels have been obliged to install and use a black box (BB). The BB (Black Box R2, Anchor Lab, Denmark) monitor fishing effort by logging vessel position, speed every 10 seconds and measure winch activity to exactly determine fishing activity location. The BB system consists of a geographic positioning system (GPS) to record vessel location (accuracy of 2 m under optimal conditions and 10 m under less optimal conditions), inductive proximity sensors (winch rotation) to record start and end of fishing activities, and on-board hard drives to record data (Figure 2). Data are recorded and stored internally until they are automatically transferred wirelessly to a centralised data storage at the Danish Fisheries Agency via Wi-Fi or cellular network when the vessel is within a covered zone (For more details, see Dalskov et al., 2021). The BB data offers both higher temporal and spatial resolution for fisheries data than VMS, which is limited in Denmark to hourly polling, and AIS, which usually reports from seconds to minutes during transport but lacks monitoring of fishing activity, as the BB system records through winch rotation sensors. The data derived from BB offers precise information regarding fishing activity location and it is unnecessary to speed filter the data to distinguish between activities such as fishing or steaming, unlike VMS and AIS. The BB data facilitates the analysis of the impact of mobile bottom-contacting fishing gears on seafloor habitats with considerably finer spatial detail than what is achievable with VMS and AIS data, due to its high spatio-temporal resolution of actual logged fishing activity locations.
Figure 2
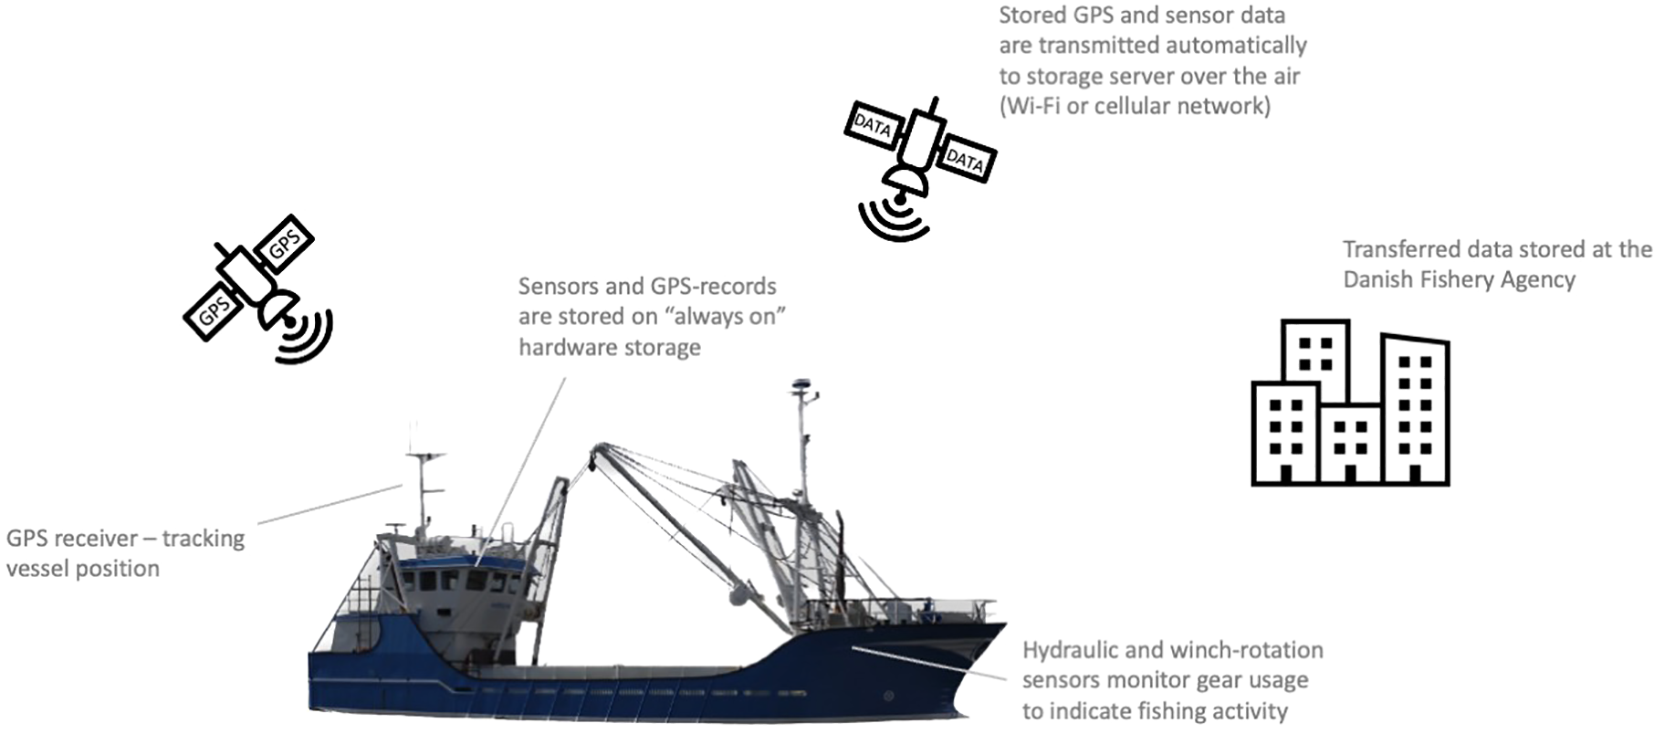
Schematic overview of the electronic Black Box monitoring system, mounted on all Danish bivalve fishing vessels.
2.3 Quality assurance of black box data by the Danish fisheries agency
All uploaded BB data were accessible from the central data storage of the Danish Fisheries Agency. The Danish Fisheries Agency carries out quality assurance of the BB data using the Black Box Analyzer software (Anchor Lab, Denmark). The BB Analyzer provides an overview by visualising the data collected during a fishing trip (Figure 3) and is used to assess fishing activities through three criteria. The first requirement is rotation in the winch sensors, where winch movement in the same direction (clockwise or counterclockwise) for a predefined time of 30 seconds indicate the beginning or end of fishing, as it takes >30 seconds for the dredges to reach the seabed or return to the vessel, respectively. If a vessel has two winches, only a single set of fishing activities was defined after comparing the estimated fishing time for each of the winches. The second criterion is sailing speed where speed between 1.5–4 knots indicate fishing and the third criterion, a fishing time of minimum one minute. Ultimately, the above procedure results in a list of fishing activities that include the start and stop time for each dredge track and was associated with an identification of which points constitute the dredge track (yellow tracks in Figure 3). The Danish Fishery Agency manually checks each fishing trip before the quality-assured BB data are transferred to The Technical University of Denmark (DTU) for further analysis. The process of manual checks is time-intensive, with estimates suggesting that the Danish Fishery Agency consumes the equivalent of seven months of annual salary (See Dalskov et al., 2021 for details). Nevertheless, these checks have been prioritized by the authorities to minimize inaccuracies in the BB datasets. The manual checks identify errors, for example, the absence of counterclockwise winch activity (indicating stop of fishing activity), where the end of the track was then manually defined based on the speed profile as fishing activities are easy to identify in the BB Analyzer software (indicated by yellow arrows in Figure 3). This study includes quality assured BB data from 2013-2021 (nine years) for Lovns Bredning (Lovns Broad) where bivalve fishing was allowed within this period.
Figure 3
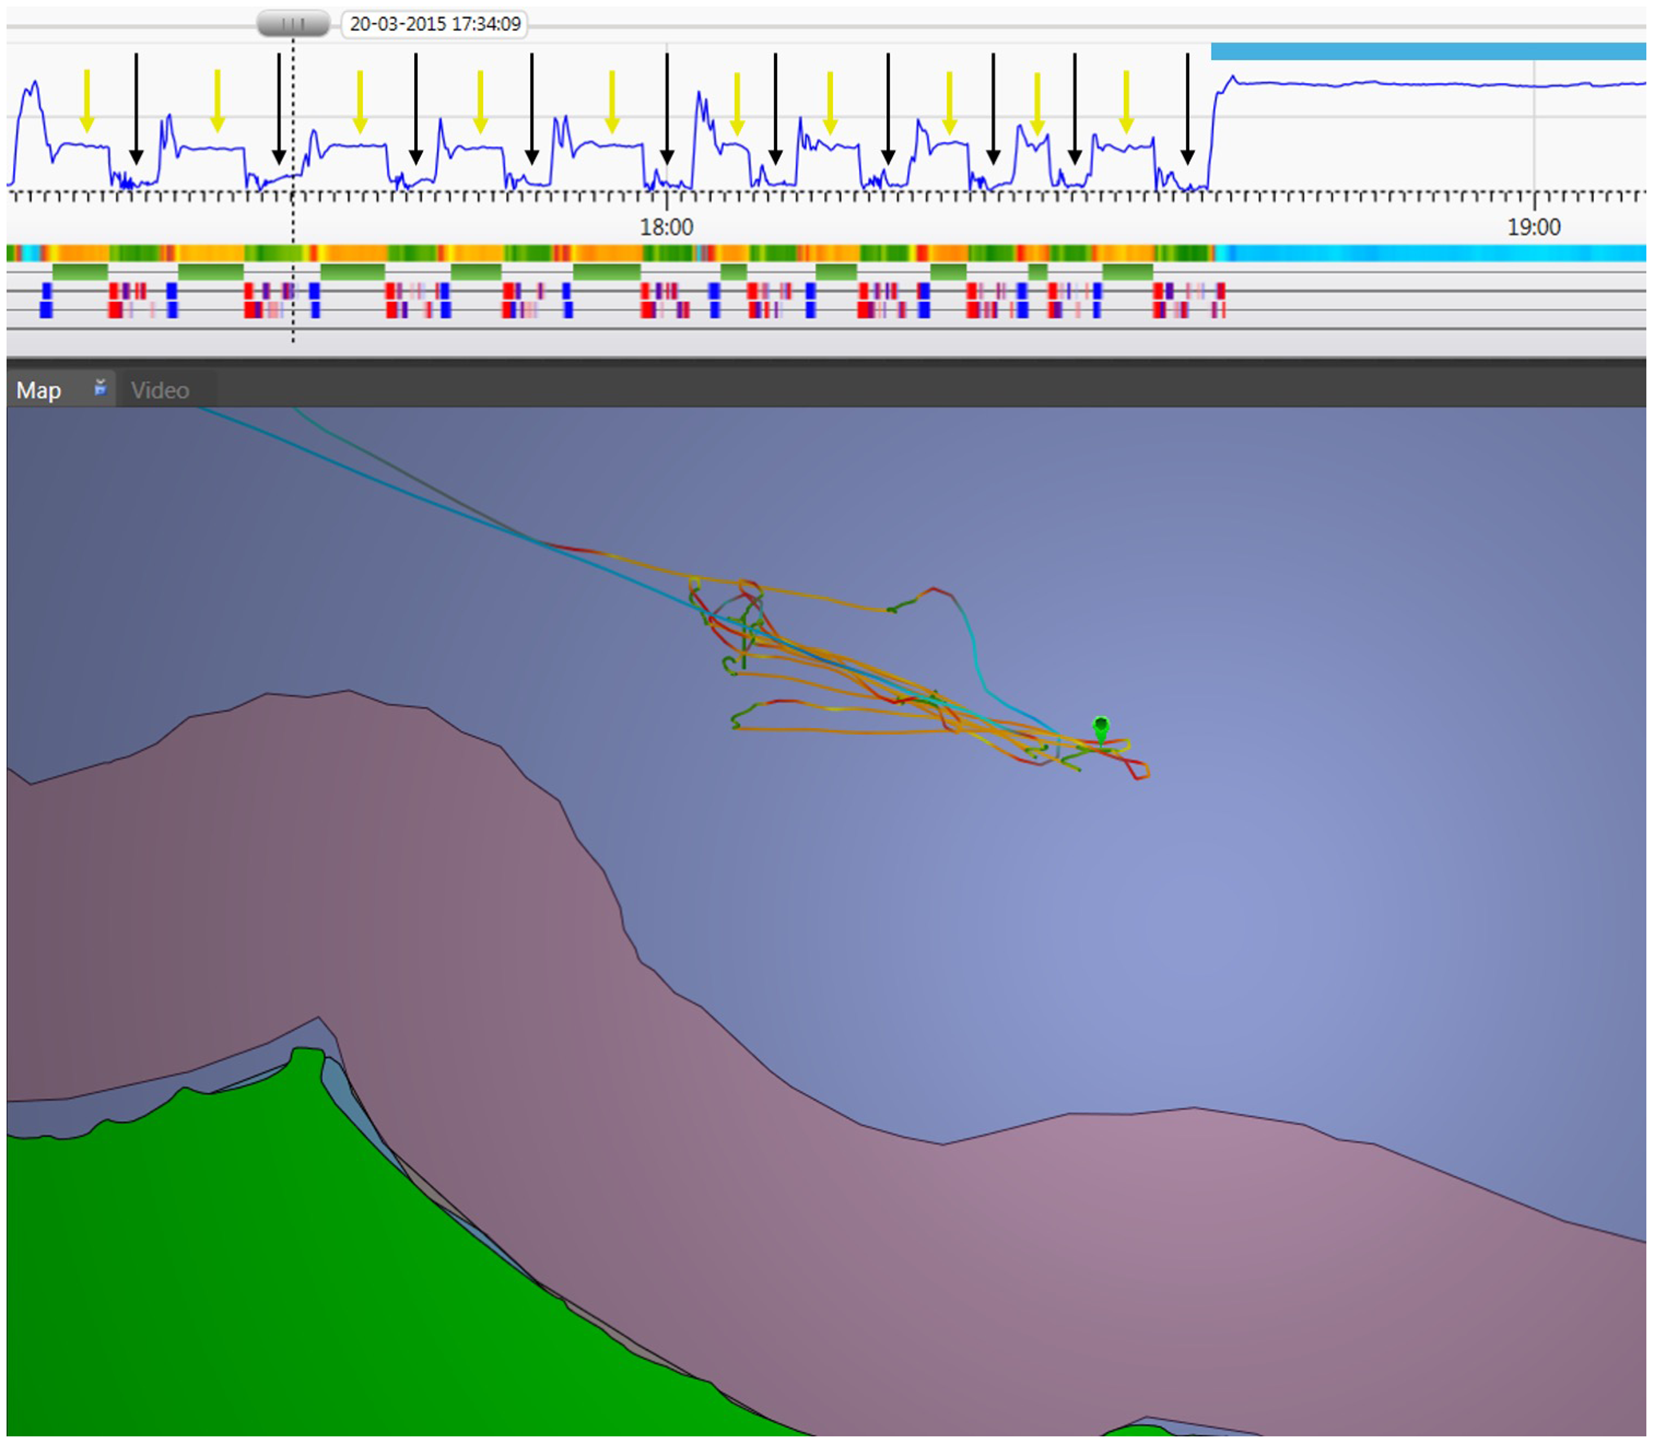
A screen dump from the Black Box analyzer software visualising dredge tracks (yellow lines on the map and marked with ten yellow arrows at the top timeline), the instant speed (blue line at the top timeline), which is reduced during fishing compared to steaming (marked by horizontal light blue line at the top timeline), and the winch sensor activities (the start of fishing is indicated by blue squares, and the end of fishing is indicated by red squares for each winch on the top timeline. Cleaning of the catches is marked with ten black arrows in the top timeline. Source: Danish Fisheries Agency.
2.4 From GPS tracking to fishing effort
Black-box data and logbook information were combined to determine the gear configuration (size of the dredge; number of dredges) for each dredge track. The dredge track was used to generate the areas affected by fishing by placing flat buffers around it, reflecting the actual design of the dredges. Prior to any further analysis, dredge tracks incl. buffers were filtered in R (R Core Team, 2023) by DTU for invalid tracks defined as tracks either of <30 m or >5 km, a duration of <80 sec or >30 min, on land or outside mussel production areas.
2.5 Assessing the footprint of blue mussel fishery on eelgrass meadows using VMS or BB data
Lovns Bredning is located in the southeast part of the Limfjorden (Figure 1) and is an important area for blue mussel seed fishery used in bottom cultivation in other areas of the Limfjorden. Lovns Bredning is a shallow eutrophic brackish estuary, with an average depth of 4 m, salinity of ˜20 PSU and an area of 68.9 km2. The latest evaluation conducted by the Danish Environmental Protection Agency rated the ecological status of Lovns Bredning as ‘bad’, the lowest of the five categories established by the WFD. To be able to estimate the actual benthic footprint of fishing on eelgrass meadows, which was selected as the most vulnerable benthic habitat potentially affected by bivalve fishery, both data on fishing effort and the distribution of eelgrass meadows are required.
Since 2011, a detailed annual video survey of eelgrass has been conducted in Lovns Bredning (24 transects, consisting of six stations of each 90 m, total of 144 stations). For this analysis, eelgrass data from 2019 was used to assess potential overlap with existing eelgrass distribution in Lovns Bredning. According to WFD, any activity within a water body is prohibited if it impedes the attainment of ‘GES’ for that water body. Consequently, protection from fishing is needed for existing eelgrass meadows, as well as areas with a high probability of future eelgrass colonisation. This protection may be achieved through i) the implementation of measures such as establishing a fixed eelgrass depth limit, thereby restricting any other activities in water depths shallower than this threshold, or ii) by closing off areas with a high probability of eelgrass colonisation while allowing activities such as fishing in other areas. The last method will require an adaptive management approach in areas that have not obtained ‘GES’ as environmental conditions improve, e.g., for eelgrass improved light conditions. To identify potential ‘eelgrass colonisation areas’, which required mussel fishing closure, a GIS-based site selection model was used, which forecasts areas with a high probability of eelgrass colonisation in Lovns Bredning (for details, see Canal-Verges et al., 2016; Nielsen et al., 2021). For the 2020/2021 fishing season, the areas with known eelgrass meadows and modelled areas suitable for eelgrass (potential distribution) in Lovns Bredning were updated and new modelled areas for the potential establishment of eelgrass were identified and closed for mussel fishing from September 2020 and onwards.
From 2013 to 2020, BB data of the fishing effort of 23 mussel fishing vessels and VMS data with a temporal resolution of 1 h of the 12 vessels that also had VMS, were used to assess the fishing footprints on known eelgrass meadows and the areas predicted by the model with potential for eelgrass establishment. The impact of fisheries on eelgrass meadows, both known (2019 distribution) and potential distribution, was assessed on different spatio-temporal scales using fisheries data from vessels equipped with BB+VMS or solely BB during 2013-2020.
The highest spatio-temporal resolution, represented as BB polygons, was from vessels with BB data. For the years 2013-2020, the cumulative overlap with both known and modelled eelgrass meadows was estimated as the direct area (m2) overlap between dredge tracks (incl. buffers) and either known eelgrass meadows or the modelled eelgrass areas. Medium data resolution used black box data (incl. buffer) processed to a square resolution of 100 x 100 m (BB squares). This resolution was chosen due to the minimum fishing time of 80 sec (Section 2.4) corresponding to a dredge track length of approximately 100 m. The BB square analysis of fishing footprints was estimated according to the methodology defined by Eigaard et al. (2016, 2017) as the swept area within a square for the 2013–2020 period multiplied by the eelgrass proportion within that square (swept area x percentage of eelgrass within the cell). The medium data resolution was selected to mimic the resolution of AIS data (high temporal resolution of records from seconds to minutes but no records of exact fishing activity locations) as AIS data are unavailable. The lowest spatio-temporal resolutions were from vessels using VMS data (VMS squares). Here, the hourly VMS data points were merged with logbook data based on timestamp and vessel identifier, and fishing activities (gear deployment) were determined from gear-specific speed-profiles. The swept area was then estimated from the VMS data point processed into the 100 x 100 m square resolution and multiplied by the eelgrass proportion in each square (cell area x percentage of eelgrass within the cell).
3 Results
3.1 Assessment and distribution of fishing activities
The individual dredge tracks generated by BB data provide high-resolution maps of fishing activities and an accurate representation of the area affected by the fisheries. The bivalve fishery often takes place in distinct areas with overlapping dredge tracks within and between years and have a highly heterogeneous spatial distribution within Lovns Bredning (Figure 4).
Figure 4
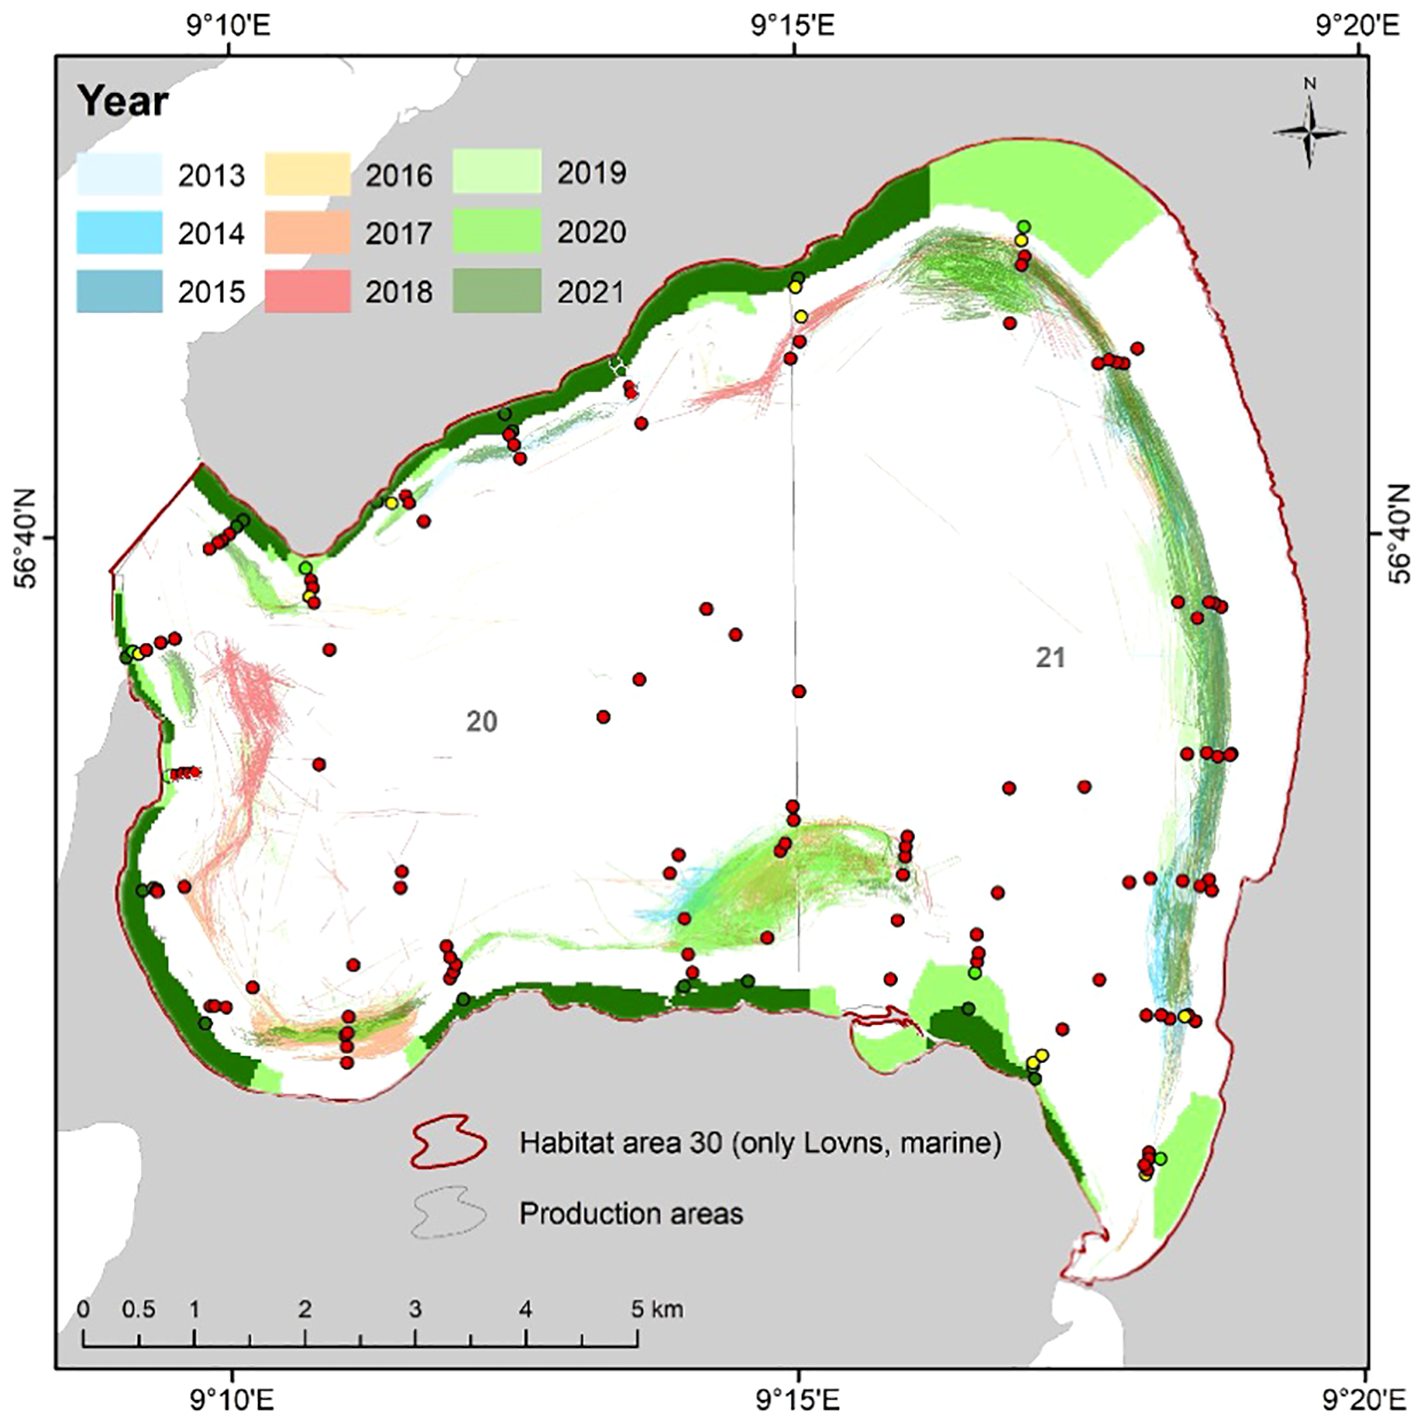
Area affected by blue mussel fishery in Lovns Bredning assessed by BB data per year within the period 2013–2021 and known (2019) eelgrass distribution. Circles represent point observations of eelgrass from the video survey (Red = no eelgrass, yellow = single seedlings, light green = small patches and dark green = dense meadows). Light and dark green areas show interpolations of eelgrass patches and eelgrass beds, respectively. The red line indicates the marine habitat area, whereas the grey line shows the separation of the two (20 and 21) food safety mussel production areas.
3.2 Importance of spatio-temporal scale to assess the footprint of fishery in eelgrass meadows
The footprint of the fishery on the known (2019) distribution of eelgrass meadows in Lovns Bredning showed generally no overlap with existing beds using the actual dredge tracks (BB polygons) (Figure 4). The grid cell analysis using BB data (covering 23 vessels) or VMS data (accounting for 12 vessels of these vessels) showed overlaps with known eelgrass meadows of 0.01 and 0.05 km2, respectively (Table 1). This demonstrates that fishing activities have a greater estimated overlap with eelgrass meadows when the fishery data has a coarser spatial resolution (BB-squares), which increases further by low temporal data resolution (VMS-squares).
Table 1
| Data type | Known (2019) eelgrass distribution (km2) | Potential (modelled) distribution of eelgrass (km2) |
|---|---|---|
| VMS squares | 0.05 | 3.29 |
| BB squares | 0.01 | 2.11 |
| BB polygons | No overlap | 1.94 |
The cumulative overlap (km2) between the fishing activities (2013-2020) of the actual eelgrass distribution in 2019 and the suitable areas for the eelgrass (potential distribution) in Lovns Bredning evaluated using data with different spatial resolution.
VMS data in 100 x 100 m squares; BB data in squares of 100 x 100 m; and overlap of actual dredge tracks (incl. buffers) from BB polygons.
To estimate if previous fishing activities have occurred in newly closed areas, an analysis was carried out using BB data or VMS data. Analysis of the cumulative overlap of blue mussel fishery activities from 2013 to 2020 within the new areas, where fishing became prohibited, showed a greater overlap (3.29 km2) when using low-resolution VMS squares compared to using high-resolution BB squares or BB polygons (Table 1). The BB squares (2.11 km2) resulted in approximately 9% higher overlap with areas suitable for eelgrass compared to the actual dredge tracks (BB polygons, 1.94 km2). The visualisation of the different methods (VMS squares, BB squares and BB polygons) exemplified with the year 2018 with a relatively large fishing activity in the area display some interesting trends. The comparison of the VMS squares (Figure 5 top) and the BB squares (Figure 5 middle) clearly shows fewer VMS data points due to only 12 vessels having a VMS installed, and lower data resolution of fishing activities (1 h resolution) compared to the BB squares. Consequently, the areal distribution of the fishery in 2018 in Lovns Bredning would be underestimated if only VMS data were available. On the contrary, the overlap between fishing activities and potential eelgrass areas is approximately 2.5 times greater for VMS squares compared to BB squares and BB polygons (Figure 6), illustrating the challenge of assessing the fishery footprint in benthic habitats using low-resolution fishery data. Comparing the two analyses using BB data (squares and polygons) shows that even though high-resolution fishery data are available, data treatment using squares instead of actual fishing tracks results in an estimated larger area being affected by the fishery (Figure 5 middle and bottom). However, the overlap between fishing activities in 2018 and potential eelgrass areas is only slightly higher using the BB squares (0.44 km2) instead of BB polygons (0.41 km2) (Figure 6).
Figure 5
The swept area dredged in 2018 in Lovns Bredning using VMS squares (top) or black box squares (middle) and actual dredge tracks (incl. buffers) from BB polygons (bottom). The green areas in each figure show known (2019) distribution and potential eelgrass colonisation areas.
Figure 6
The overlap (km2) between fishing activities in 2018 and areas with actual and potential eelgrass in Lovns Bredning assessed by either VMS squares, BB squares or BB polygons (see text for further explanation).
4 Discussion
We have demonstrated that recording the precise locations of fishing activities offer a more accurate method for evaluating how small-scale fisheries overlap with sensitive habitats. This is key information in evaluating the impact of fisheries using bottom-towed gear on marine ecosystems, thus enhancing and fostering adaptive ecosystem-based fisheries management. This is particularly vital in coastal areas, where actual fishing activity lasts only a few minutes (e.g., <10 minutes per track) and often assessments must frequently consider various human-induced pressures alongside diverse nature conservation goals.
4.1 Localised distribution of fishing activities and cumulative area impacted
Accurate data-based documentation of fishing is a key element in studies on fishing on benthic habitats, e.g., Bastardie et al. (2015) and to our knowledge, the Black Box system in the Danish bivalve fishery is the only system used in EU fisheries that provides high-resolution spatio-temporal mapping of actual bottom fishing activity locations. The BB data provide information on individual bivalve fishing tracks, which combined with information from the individual vessel logbook on gear can be used to document the areal distribution of the fishery. Like other studies using vessel monitoring fishery data (Jennings and Lee, 2012; Eigaard et al., 2016, 2017; Amoroso et al., 2018), the effort of the fishery was highly concentrated in a smaller proportion of the total area. Furthermore, the BB data can also provide estimations of total area affected (km2) by single vessels or the entire fishing fleet per year or cumulatively over multiple years, as well as fisheries statistics e.g., track length and Catch Per Unit Effort (CPUE). Integrating high spatio-temporal resolution fishery data with logbook records opens further possibilities for ecosystem-based management by evaluating the fishery’s impact on mapped habitats. This approach is valuable for fishery management (Campbell et al., 2014; Nielsen et al., 2021) and nature conservation efforts. It is particularly pertinent to fisheries using bottom-towed gear, as it aids in verifying compliance with conservation goals by detailing the spatial distribution and overlaps of the fishery with benthic habitats. Moreover, it can serve as a tool for enforcing regulations, such as monitoring fishing in marine protected areas or illegal fishing in prohibited areas but can also identify important fishing grounds. Although BB data analysis provides high-resolution mapping of fishing activities, technical problems such as incorrect logging of GPS position (e.g., single point logged or position on land), or failure in winch sensor activities still occur. Thus, the Danish authorities have implemented manual quality assurance of data to ensure the most accurate areal distribution of the fishery. However, depending on the specific management requirements and the need for accurate datasets, manual checks can be substituted by using automatic processes identifying fishing activities not included or excluding invalid dredge tracks, thereby optimising the data quality process and reducing costs. This will make the BB system more applicable to include in monitoring large-scale fisheries, where thousands of vessels need to be evaluated and manual checks will become extremely time-consuming and costly.
4.2 Fishery footprint assessments impacted by spatial data resolution
Assessing the fishing footprint using VMS data is known to be influenced by the analytical methods applied, for example, track reconstruction and grid-cell resolution, which can lead to underestimation of fishing on benthic communities (Lambert et al., 2012). Our analysis based on VMS squares shows an estimated cumulative footprint of 3.29 km2 of fishing activities in areas suitable for eelgrass meadows (potential distribution), while the estimated footprints were reduced with ˜35% and ˜40% when using the high-resolution BB squares or BB polygons, respectively (Table 1). A similar analysis based on the known eelgrass distribution did not show overlap when using actual dredge tracks (BB polygons) and smaller overlaps of 0.01 and 0.05 km2 when using BB squares and VMS squares, respectively. This shows that low resolution of fishery data often results in an overestimation of the footprint of the fishery, especially for aggregating species, where the footprint is often localised and therefore can go from zero to multiple overlaps within a few hundred metres. Consequently, the aggregation of even high-resolution BB data in squares, especially with large squares, result in an estimated higher fishery footprint, as conservation features e.g., habitats, are often distributed on smaller scales (Pedersen et al., 2009). Adequate estimates of the fishery footprint are especially challenging in coastal areas with small-scale vessel fisheries (SSF) due to insufficient information on fishing activities and, therefore, lacking as a support in ecosystem-based fishery management (Dalskov et al., 2021). If only VMS and/or AIS data are available for coastal SSF, the estimation of the fishery footprint is often challenged by: i) the fishing operations are relatively short in distance and duration, ii) potential mismatch of the time resolution of electronic monitoring system with for example 1 h pings and the fishing activity of minutes for each fishing track, which require data filtering to separate fishing activities from steaming e.g. by speed or develop workflow to identify individual vessel trips and infer fishing activities (Rufino et al., 2023), iii) low spatial and temporal logging frequency of the vessels position, and iv) no registration of actual fishing activity location e.g., winch rotations. Furthermore, often only few vessels if any of the entire SSF fleet in an area uses VMS and consequently the data input is provided by few vessels, increasing the risk of either underestimation (few pings) or overestimations (large squares) of the fishery footprint. When using high-resolution BB data, information on each individual dredge track combined with more specific details on gear type, width, and numbers for each vessel provides adequate estimates of fishing footprint, which can be visualised and quantified (Figures 5, 6). Implementing the BB system on vessels using other mobile bottom-towed fishing gear, such as trawls or beam trawls, will provide more accurate estimates and probably also reduce the estimated footprint of the fishery on benthic habitats compared to other electronic monitoring fishery data (VMS and AIS). Therefore, high spatio-temporal resolution BB data can assist in evaluating and maintaining coastal fishing activities by providing quantitative insights of the fishery footprint and enhance the protection of vulnerable habitats.
4.3 Contribution to EU obligations for remote electronic monitoring of SSF
As of January 2024, new EU regulations for fishery control mandated that all EU fishing vessels, as well as non-EU vessels operating in EU waters, to use VMS and submit catch reports electronically, regardless of their size. Small-scale fisheries were granted a grace period until 2028 to adapt and comply with these new requirements (EU regulation 2023/2842). The reinforcement of installation of VMS on all fishing vessels will support SSF fisheries management, especially if combined with development of workflow to identify individual vessel trips and infer fishing activities, adapted to different fishing fleets (Rufino et al., 2023; Mendo et al., 2024). However, as demonstrated in this study, electronic monitoring systems like the BB system, equipped with inductive proximity sensors, deliver the most accurate and detailed mapping of individual fishing tracks, significantly enhancing fisheries control and surveillance of the fisheries with bottom-towed gears and can protect sensitive benthic habitats such as eelgrass meadows. Multiple electronic monitoring systems are available, and responsibility falls on the individual EU member states to select and implement the appropriate system to enhance management practices. These high-resolution data obtained from electronic monitoring systems are essential for advancing reliable methods to assess fishing footprint, guiding future decision-making and enhance ecosystem-based management to meet conservation objectives.
Statements
Data availability statement
The raw data supporting the conclusions of this article will be made available by the authors, without undue reservation.
Author contributions
PN: Writing – original draft, Data curation, Methodology, Validation, Investigation, Conceptualization, Funding acquisition, Writing – review & editing. JO: Visualization, Writing – review & editing, Software, Formal analysis, Data curation, Methodology. KG: Visualization, Validation, Software, Writing – review & editing, Methodology. JP: Project administration, Writing – review & editing, Supervision, Conceptualization, Resources, Funding acquisition.
Funding
The author(s) declare financial support was received for the research and/or publication of this article. Multiple research projects funded by the European Maritime and Fisheries Fund have contributed to data collection and data analysis.
Acknowledgments
Special recognition is given to the Danish Fishery Agency for their invaluable contributions to data quality assurance.
Conflict of interest
The authors declare that the research was conducted in the absence of any commercial or financial relationships that could be construed as a potential conflict of interest.
Generative AI statement
The author(s) declare that no Generative AI was used in the creation of this manuscript.
Any alternative text (alt text) provided alongside figures in this article has been generated by Frontiers with the support of artificial intelligence and reasonable efforts have been made to ensure accuracy, including review by the authors wherever possible. If you identify any issues, please contact us.
Publisher’s note
All claims expressed in this article are solely those of the authors and do not necessarily represent those of their affiliated organizations, or those of the publisher, the editors and the reviewers. Any product that may be evaluated in this article, or claim that may be made by its manufacturer, is not guaranteed or endorsed by the publisher.
References
1
Amoroso R. O. Pitcher C. R. Rijnsdorp A. D. McConnaughey R. A. Parma A. M. Suuronen P. et al . (2018). Bottom trawl fishing footprints on the world’s continental shelves. Proc. Natl. Acad. Sci. U.S.A.115, E10275–E10282. doi: 10.1073/PNAS.1802379115/SUPPL_FILE/PNAS.1802379115.SAPP.PDF
2
Bastardie F. Nielsen J. R. Eigaard O. R. Fock H. O. Jonsson P. Bartolino V. (2015). Competition for marine space: modelling the Baltic Sea fisheries and effort displacement under spatial restrictions. ICES J. Mar. Sci.72, 824–840. doi: 10.1093/ICESJMS/FSU215
3
Behivoke F. Etienne M. P. Guitton J. Randriatsara R. M. Ranaivoson E. Léopold M. (2021). Estimating fishing effort in small-scale fisheries using GPS tracking data and random forests. Ecol. Indic.123, 107321. doi: 10.1016/J.ECOLIND.2020.107321
4
Borja Á. (2005). The European water framework directive: A challenge for nearshore, coastal and continental shelf research. Cont. Shelf Res.25, 1768–1783. doi: 10.1016/J.CSR.2005.05.004
5
Campbell M. S. Stehfest K. M. Votier S. C. Hall-Spencer J. M. (2014). Mapping fisheries for marine spatial planning: Gear-specific vessel monitoring system (VMS), marine conservation and offshore renewable energy. Mar. Policy45, 293–300. doi: 10.1016/j.marpol.2013.09.015
6
Canal-Verges P. Petersen J. K. Rasmussen E. K. Erichsen A. Flindt M. R. (2016). Validating GIS tool to assess eelgrass potential recovery in the Limfjorden (Denmark). Ecol. Modell.338, 135–148. doi: 10.1016/j.ecolmodel.2016.04.023
7
Dalskov J. Glemarec G. Kindt-Larsen L. Kroner A.-M. Nielsen P. (2021). Workshop on electronic technologies for fisheries Part III: Systems adapted for smallscale vessels ( European Parliament). Available online at: https://orbit.dtu.dk/en/publications/workshop-on-electronic-technologies-for-fisheries-part-iii-system (Accessed March 16, 2023).
8
Dayton P. K. Thrush S. F. Agardy M. T. Hofman R. J. (1995). Environmental effects of marine fishing. Aquat. Conserv.5, 205–232. doi: 10.1002/AQC.3270050305
9
de Juan S. Subida M. D. Gelcich S. Fernandez M. (2018). Ecosystem health in coastal areas targeted by small-scale artisanal fisheries: Insights on monitoring and assessment. Ecol. Indic.88, 361–371. doi: 10.1016/J.ECOLIND.2018.01.054
10
Deng R. Dichmont C. Milton D. Haywood M. Vance D. Hall N. et al . (2011). Can vessel monitoring system data also be used to study trawling intensity and population depletion? The example of Australia’s northern prawn fishery. Canadian Journal of Fisheries and Aquatic Sciences62, 611–622. doi: 10.1139/F04-219
11
Dickey-Collas M. Link J. S. Snelgrove P. Roberts J. M. Anderson M. R. Kenchington E. et al . (2022). Exploring ecosystem-based management in the North Atlantic. J. Fish Biol.101, 342–350. doi: 10.1111/JFB.15168
12
Douvere F. (2008). The importance of marine spatial planning in advancing ecosystem-based sea use management. Mar. Policy32, 762–771. doi: 10.1016/J.MARPOL.2008.03.021
13
Dunn D. C. Jablonicky C. Crespo G. O. McCauley D. J. Kroodsma D. A. Boerder K. et al . (2018). Empowering high seas governance with satellite vessel tracking data. Fish Fisheries19, 729–739. doi: 10.1111/FAF.12285
14
Eigaard O. R. Bastardie F. Breen M. Dinesen G. E. Hintzen N. T. Laffargue P. et al . (2016). Estimating seabed pressure from demersal trawls, seines, and dredges based on gear design and dimensions. ICES J. Mar. Sci.73, i27–i43. doi: 10.1093/icesjms/fsv099
15
Eigaard O. R. Bastardie F. Hintzen N. T. Buhl-Mortensen L. Buhl-Mortensen P. Catarino R. et al . (2017). The footprint of bottom trawling in European waters: Distribution, intensity, and seabed integrity. ICES J. Mar. Sci.74, 847–865. doi: 10.1093/icesjms/fsw194
16
Frandsen R. P. Eigaard O. R. Poulsen L. K. Tørring D. Stage B. Lisbjerg D. et al . (2015). Reducing the impact of blue mussel (Mytilus edulis) dredging on the ecosystem in shallow water soft bottom areas. Aquat. Conserv25 (2), 162–173. doi: 10.1002/aqc.2455
17
Gerritsen H. Lordan C. (2011). Integrating vessel monitoring systems (VMS) data with daily catch data from logbooks to explore the spatial distribution of catch and effort at high resolution. ICES J. Mar. Sci.68, 245–252. doi: 10.1093/ICESJMS/FSQ137
18
Gislason H. Sinclair M. Sainsbury K. O’ R. Gislason B. Sinclair H. et al . (2000). Symposium overview: incorporating ecosystem objectives within fisheries management. ICES J. Mar. Sci.57, 468–475. doi: 10.1006/JMSC.2000.0741
19
Halpern B. S. Diamond J. Gaines S. Gelcich S. Gleason M. Jennings S. et al . (2012). Near-term priorities for the science, policy and practice of Coastal and Marine Spatial Planning (CMSP). Mar. Policy36, 198–205. doi: 10.1016/J.MARPOL.2011.05.004
20
Hintzen N. T. Bastardie F. Beare D. Piet G. J. Ulrich C. Deporte N. et al . (2012). VMStools: Open-source software for the processing, analysis and visualisation of fisheries logbook and VMS data. Fish Res., 115–116, 31–33. doi: 10.1016/J.FISHRES.2011.11.007
21
Holmes S. Natale F. Gibin M. Guillen J. Alessandrini A. Vespe M. et al . (2020). Where did the vessels go? An analysis of the EU fishing fleet gravitation between home ports, fishing grounds, landing ports and markets. PloS One15, e0230494. doi: 10.1371/JOURNAL.PONE.0230494
22
ICES (2023). Workshop on Small Scale Fisheries and Geo-Spatial Data 2 (WKSSFGEO2). ICES Scientific Report, 5, 49–105. doi: 10.17895/ICES.PUB.22789475.V1
23
James M. Mendo T. Jones E. L. Orr K. McKnight A. Thompson J. (2018). AIS data to inform small scale fisheries management and marine spatial planning. Mar. Policy91, 113–121. doi: 10.1016/J.MARPOL.2018.02.012
24
Jennings S. Kaiser M. J. (1998). The effects of fishing on marine ecosystems. Adv. Mar. Biol.34, 201–352. doi: 10.1016/S0065-2881(08)60212-6
25
Jennings S. Lee J. (2012). Defining fishing grounds with vessel monitoring system data. ICES J. Mar. Sci.69, 51–63. doi: 10.1093/ICESJMS/FSR173
26
Kaiser M. J. Hilborn R. Jennings S. Amaroso R. Andersen M. Balliet K. et al . (2016). Prioritization of knowledge-needs to achieve best practices for bottom trawling in relation to seabed habitats. Fish Fisheries17, 637–663. doi: 10.1111/FAF.12134
27
Lambert G. I. Jennings S. Hiddink J. G. Hintzen N. T. Hinz H. Kaiser M. J. et al . (2012). Implications of using alternative methods of vessel monitoring system (VMS) data analysis to describe fishing activities and impacts. ICES J. Mar. Sci.69, 682–693. doi: 10.1093/ICESJMS/FSS018
28
Li X. L. Xiao Y. Su F. Wu W. Zhou L. (2021). AIS and VBD data fusion for marine fishing intensity mapping and analysis in the northern part of the South China Sea. ISPRS Int. J. Geo Inform.10, 277. doi: 10.3390/IJGI10050277
29
McLaverty C. Eigaard O. R. Dinesen G. E. Gislason H. Kokkalis A. Erichsen A. C. et al . (2020). Using high-resolution fisheries data to assess the effects of bivalve dredging on benthic communities in stressed coastal systems. Mar. Ecol. Prog. Ser.642, 21–38. doi: 10.3354/meps13330
30
Mendo T. Mujal-Colilles A. Stounberg J. Glemarec G. Egekvist J. Mugerza E. et al . (2024). A workflow for standardizing the analysis of highly resolved vessel tracking data. ICES J. Mar. Sci.81, 390–401. doi: 10.1093/ICESJMS/FSAD209
31
Moritz C. Gravel D. Savard L. McKindsey C. W. Brethes J. C. Archambault P. (2015). No more detectable fishing effect on Northern Gulf of St Lawrence benthic invertebrates. ICES J. Mar. Sci.72, 2457–2466. doi: 10.1093/ICESJMS/FSV124
32
Nielsen P. Nielsen M. M. McLaverty C. Kristensen K. Geitner K. Olsen J. et al . (2021). Management of bivalve fisheries in marine protected areas. Mar. Policy124, 104357. doi: 10.1016/J.MARPOL.2020.104357
33
Nielsen J. R. Vastenhoud B. M. J. Bossier S. Møhlenberg F. Christensen A. Diekman R. et al . (2023). Impacts of habitat-specific benthic fishing compared to those of short-term induced variability by environmental drivers in a turbulent Baltic Sea environment. Fish Res.257, 106514. doi: 10.1016/J.FISHRES.2022.106514
34
Pedersen S. A. Fock H. O. Sell A. F. (2009). Mapping fisheries in the German exclusive economic zone with special reference to offshore Natura 2000 sites. Mar. Policy33, 571–590. doi: 10.1016/j.marpol.2008.12.007
35
R Core Team . (2023). R: A Language and Environment for Statistical Computing. R Foundation for Statistical Computing, Vienna, Austria. Available online at: https://www.r-project.org/.
36
Reiss H. Birchenough S. Borja A. Buhl-Mortensen L. Craeymeersch J. Dannheim J. et al . (2015). Benthos distribution modelling and its relevance for marine ecosystem management. ICES J. Mar. Sci.72, 297–315. doi: 10.1093/ICESJMS/FSU107
37
Rijnsdorp A. D. Hiddink J. G. van Denderen P. D. Hintzen N. T. Eigaard O. R. Valanko S. et al . (2020). Different bottom trawl fisheries have a differential impact on the status of the North Sea seafloor habitats. ICES J. Mar. Sci.77, 1772–1786. doi: 10.1093/icesjms/fsaa050
38
Roberts C. M. Hawkins J. P. Gell F. R. (2005). The role of marine reserves in achieving sustainable fisheries. Philos. Trans. R. Soc. B: Biol. Sci.360, 123–132. doi: 10.1098/RSTB.2004.1578
39
Rowlands G. Brown J. Soule B. Boluda P. T. Rogers A. D. (2019). Satellite surveillance of fishing vessel activity in the Ascension Island Exclusive Economic Zone and Marine Protected Area. Mar. Policy101, 39–50. doi: 10.1016/j.marpol.2018.11.006
40
Rufino M. M. Mendo T. Samarão J. Gaspar M. B. (2023). Estimating fishing effort in small-scale fisheries using high-resolution spatio-temporal tracking data (an implementation framework illustrated with case studies from Portugal). Ecol. Indic.154, 110628. doi: 10.1016/J.ECOLIND.2023.110628
41
Russo T. D’Andrea L. Parisi A. Cataudella S. (2014). VMSbase: an R-package for VMS and logbook data management and analysis in fisheries ecology. PloS One9, e100195. doi: 10.1371/JOURNAL.PONE.0100195
42
Sciberras M. Hinz H. Bennell J. Jenkins S. Hawkins S. Kaiser M. (2013). Benthic community response to a scallop dredging closure within a dynamic seabed habitat. Mar. Ecol. Prog. Ser.480, 83–98. doi: 10.3354/MEPS101
43
Sköld M. Göransson P. Jonsson P. Bastardie F. Blomqvist M. Agrenius S. et al . (2018). Effects of chronic bottom trawling on soft-seafloor macrofauna in the Kattegat. Mar. Ecol. Prog. Ser.586, 41–55. doi: 10.3354/MEPS12434
44
Smith C. J. Papadopoulou K. N. Barnard S. Mazik K. Elliott M. Patrício J. et al . (2016). Managing the marine environment, conceptual models and assessment considerations for the European marine strategy framework directive. Front. Mar. Sci.3. doi: 10.3389/fmars.2016.00144
45
Smith M. D. Wilen J. E. (2003). Economic impacts of marine reserves: the importance of spatial behavior. J. Environ. Econ. Manage46, 183–206. doi: 10.1016/S0095-0696(03)00024-X
46
Suuronen P. Jounela P. Tschernij V. (2010). Fishermen responses on marine protected areas in the Baltic cod fishery. Mar. Policy34, 237–243. doi: 10.1016/J.MARPOL.2009.07.001
47
Szostek C. L. Murray L. G. Bell E. Rayner G. Kaiser M. J. (2016). Natural vs. fishing disturbance: drivers of community composition on traditional king scallop, Pecten maximus, fishing grounds. ICES J. Mar. Sci.73, i70–i83. doi: 10.1093/ICESJMS/FSV152
48
Townsend H. Harvey C. J. deReynier Y. Davis D. Zador S. G. Gaichas S. et al . (2019). Progress on implementing ecosystem-based fisheries management in the United States through the use of ecosystem models and analysis. Front. Mar. Sci.6. doi: 10.3389/FMARS.2019.00641/BIBTEX
49
van der Reijden K. J. Govers L. L. Koop L. Damveld J. H. Herman P. M. J. Mestdagh S. et al . (2021). Beyond connecting the dots: A multi-scale, multi-resolution approach to marine habitat mapping. Ecol. Indic.128, 107849. doi: 10.1016/J.ECOLIND.2021.107849
50
Zacharias M. A. Roff J. C. (2000). A hierarchical ecology approach to conserving marine biodiversity. Conserv. Biol.14, 1327–1334. doi: 10.1046/J.1523-1739.2000.99191.X
51
Zhang S. Jin S. Zhang H. Fan W. Tang F. Yang S. (2016). Distribution of bottom trawling effort in the Yellow Sea and East China Sea. PloS One11, e0166640. doi: 10.1371/JOURNAL.PONE.0166640
Summary
Keywords
ecosystem-based fisheries management, bivalve fishery, eelgrass meadows, fishing pressure, bottom-towed gear, protection of marine environment
Citation
Nielsen P, Olsen J, Geitner K and Petersen JK (2025) The dual purpose of high spatiotemporal resolution of electronic monitoring data in fisheries: sustain fisheries and enhance protection of sensitive habitats. Front. Mar. Sci. 12:1697026. doi: 10.3389/fmars.2025.1697026
Received
01 September 2025
Accepted
08 October 2025
Published
22 October 2025
Volume
12 - 2025
Edited by
Morten Omholt Alver, Norwegian University of Science and Technology, Norway
Reviewed by
Asuncion Bina De Guzman, Independent Researcher, Naawan, Philippines; Ulla Fernandez-Arcaya, Instituto Español de Oceanografía, Spain
Updates
Copyright
© 2025 Nielsen, Olsen, Geitner and Petersen.
This is an open-access article distributed under the terms of the Creative Commons Attribution License (CC BY). The use, distribution or reproduction in other forums is permitted, provided the original author(s) and the copyright owner(s) are credited and that the original publication in this journal is cited, in accordance with accepted academic practice. No use, distribution or reproduction is permitted which does not comply with these terms.
*Correspondence: Pernille Nielsen, peniel@aqua.dtu.dk
Disclaimer
All claims expressed in this article are solely those of the authors and do not necessarily represent those of their affiliated organizations, or those of the publisher, the editors and the reviewers. Any product that may be evaluated in this article or claim that may be made by its manufacturer is not guaranteed or endorsed by the publisher.