Abstract
Leatherback turtles (Dermochelys coriacea) are highly migratory and globally distributed, yet exhibit low overall genetic diversity. Currently, the species is divided into seven Regional Management Units (RMUs), and significant gaps remain in understanding genetic connectivity within the Indo-Pacific, particularly the Northeast Indian Ocean. Here, we investigate the genetic diversity and population structure of leatherback turtles sampled from five nesting sites in Sumatra, Indonesia. Using mitochondrial DNA (mtDNA) control region sequences from 57 individuals, we identified eight haplotypes, including one novel variant, with Sumatra exhibiting the highest haplotype (h = 0.786) and nucleotide diversity (π = 0.0040) among regional rookeries. There was a lack of significant stock structure based on our haplotype frequency data among rookeries in Sumatra (p>0.05). Phylogenetic and haplotype network analyses revealed that Sumatra contains lineages from both Indian and West Pacific Ocean clades, suggesting its role as a genetic bridge between these populations. Our results on population genetic structure support the recognition of Sumatra as a distinct Management Unit (MU), separate from other Northeast Indian Ocean populations. Our findings highlight the need to refine existing RMU boundaries and prioritize conservation actions in Sumatra to preserve its unique genetic composition and enhance connectivity across the Indo-Pacific.
1 Introduction
Leatherback turtles (Dermochelys coriacea Vandelli, 1761) are highly migratory species with a global distribution and capable of travelling over 10,000 km from foraging grounds to natal rookeries across vast oceanic ranges (Dutton et al., 2007; Shillinger et al., 2008; Benson et al., 2011; Seminoff et al., 2012). Despite their extensive distribution, leatherbacks exhibit remarkably low genetic diversity, as revealed by mitochondrial DNA sequence data across global nesting populations (Komoroske et al., 2017; Vargas et al., 2019; Wongfu et al., 2022; Piboon et al., 2025; Toha et al., 2025). The low genetic diversity, relative to other species of sea turtles, is believed to be the result of a global genetic bottleneck that occurred in leatherbacks during the Pleistocene glaciation (Dutton et al., 1999), which is also evident in the nuclear genome (Bentley et al., 2023). Nevertheless, genetic studies have demonstrated significant regional differentiation, with nesting populations across the Atlantic, Eastern Pacific, and Western Pacific exhibiting variation in mitochondrial haplotypes (Dutton et al., 1999, 2013; Vargas et al., 2019).
Leatherback nesting populations, typically associated with specific nesting beaches or rookeries, can form demographically and genetically distinct stocks known as Management Units (MUs) (Komoroske et al., 2017). MUs are defined based on significant differences in mitochondrial haplotype and/or nuclear allele frequencies, and usually comprise one or more geographically discrete rookeries that serve as the fundamental units for population-level conservation (Moritz, 1994; Wallace et al., 2023; Piboon et al., 2025; Toha et al., 2025). The Atlantic leatherback populations offer a well-established example, having been extensively characterized through broad geographic sampling and genetic data from both mitochondrial and nuclear markers (Dutton et al., 2013; Vargas et al., 2019). Moreover, limited samples from Malaysia suggest that the Indo-Pacific genetic stock is distinct from the Western Pacific stock (Dutton et al., 2007; Toha et al., 2025), while limited data from the Indian Ocean show that mtDNA haplotypes found in Thailand and the Great Nicobar Island, India, have also been found in South Africa, the Western Pacific, and the Atlantic (Shanker et al., 2011; Wongfu et al., 2022). This highlights a major gap in our understanding of leatherback turtle phylogeography, particularly in the under-sampled region linking the Indian Ocean and West Pacific, where population structure and lineage connectivity remain poorly resolved. In contrast, MU delineation in the Indo-Pacific remains limited by sparse sampling across key rookeries. Understanding levels of genetic connectivity among rookeries is also important, as it informs whether populations function independently or as part of broader demographic networks, information essential for identifying migratory corridors and conservation priorities. In the Pacific, studies have revealed clear genetic differentiation between Eastern and Western Pacific leatherback populations, with Papua populations forming a distinct MU (Dutton et al., 2007; Toha et al., 2025), while tagging and satellite data have demonstrated connectivity between nesting beaches and distant foraging grounds (Benson et al., 2007, 2011; Hitipeuw et al., 2007). These findings have been instrumental in establishing international agreements to reduce regional fisheries bycatch and protect critical habitats (Dutton et al., 1999, 2007, 2013; Hitipeuw et al., 2007; Stewart and Dutton, 2011; Prosdocimi et al., 2014; Vargas et al., 2019). Similarly, studies of olive ridley (Lepidochelys olivacea Eschscholtz, 1829), hawksbill (Eretmochelys imbricata Linnaeus, 1766), and green turtles (Chelonia mydas Linnaeus, 1758) in the Indo-Pacific have revealed strong genetic structuring and phylogeographic breaks, including MU boundaries and barriers between Eastern and Western populations despite overlapping foraging grounds, highlighting limited female-mediated gene flow (Vargas et al., 2016; Nishizawa et al., 2018; Madduppa et al., 2021; Ng et al., 2024; Sani et al., 2024).
At a broader scale, Regional Management Units (RMUs) encompass multiple MUs and are delineated based on shared genetic composition, ecological traits, and geography (Wallace et al., 2010). The RMU framework identifies groups of conspecific marine turtles sharing habitats, bridging species and rookery levels, while supporting holistic conservation strategies across life stages and regions (Wallace et al., 2023). Currently, seven leatherback RMUs have been identified globally: Northwest Atlantic, Southwest Atlantic, Southeast Atlantic, Southwest Indian, Northeast Indian, West Pacific, and East Pacific. While the RMU framework has been instrumental in prioritizing conservation actions, certain regions remain poorly studied (Komoroske et al., 2017; Wallace et al., 2011, 2023). Among these, the Southeast Atlantic and Northeast Indian Ocean RMUs have limited genetic data, which poses challenges in identifying population dynamics and conservation priorities (Dutton et al., 1999, 2013; Bowen and Karl, 2007; Vargas et al., 2019). The Northeast Indian Ocean RMU, in particular, remains one of the least studied globally, with significant gaps in knowledge regarding its population structure and connectivity (Hamann et al., 2010; Wallace et al., 2023, 2025). Sumatra, considered to be part of the Northeast Indian Ocean RMU, hosts several rookeries that have only recently been monitored (Wallace et al., 2023, 2025). At least 15 leatherback turtle nesting sites have been identified along the west coast of Sumatra, with two relative focal points in the provinces of Aceh and West Sumatra (Maslim and Farajallah, 2016; As-singkily et al., 2025a; As-singkily, et al. 2025b; Toha et al., 2025). These rookeries, alongside those in Thailand, Sri Lanka, and the Andaman and Great Nicobar Islands, are vital for understanding population dynamics within this understudied RMU (Hamann et al., 2006). Since 2012, local community groups, supported by government and non-governmental organizations, have been monitoring these sites to collect data on nesting activities, hatching success rates, and threats to these sites (Maslim and Farajallah, 2016). Surveys indicate that nesting density is low and scattered throughout Sumatra. Furthermore, Sumatra’s nesting populations face considerable challenges, including habitat degradation due to coastal development, nest predation, and bycatch in fisheries, similar to threats faced by other leatherback turtle populations worldwide (Witt et al., 2011; Tomillo et al., 2012; Roe et al., 2013; Reavis et al., 2022). Sumatra’s rookeries could provide important genetic data that might reveal connectivity with other populations within Indonesia and globally. Understanding Sumatra’s role within the regional and global leatherback turtle network will support more informed, regionally tailored conservation planning in the Northeast Indian Ocean.
Here, we investigated the genetic diversity and population structure of leatherback turtles across five rookeries in Sumatra. We address the following specific research questions: (1) What is the genetic diversity of leatherback turtles in Sumatra’s recently identified rookeries? (2) How many distinct breeding populations do these rookeries represent? and (3) What is the genetic connectivity among Sumatran nesting beaches and between Sumatran populations and other leatherback populations in the Indian Ocean and West Pacific regions?
2 Materials and methods
2.1 Sample collection
Tissue samples were collected from five leatherback turtle nesting sites in the provinces of Aceh and West Sumatra, Indonesia (Figure 1), during two nesting seasons: February to May 2022 and November 2022 to May 2023. Skin biopsies were obtained following the protocol described by Dutton and Stewart (2013), modified to use a sterile 4 mm biopsy punch to collect a small section of epidermal tissue from the dorsal surface of the front flipper of adult females. Sampling was performed immediately after egg-laying to minimize disturbance during oviposition. For hatchlings, tissue samples were collected opportunistically from fresh dead individuals salvaged from hatched nests during routine nest excavations, ensuring that no live animals were harmed. A total of 57 tissue samples were collected, comprising 23 dead hatchlings from 23 confirmed distinct nests across five nesting sites, and 34 samples from distinct adult females. Most adult females were individually identified using PIT tags, except for two samples from Panga, which were taken from different individuals, one from a deceased female and one from a nesting female. Hatchling samples were collected either in different nesting seasons or outside the typical renesting interval of 8–12 days from the females (Harris et al., 2015), to minimize the chance of sampling related individuals (Figure 1; Supplementary Table S1). However, for a few nests found without a corresponding identified female, the possibility of overlap cannot be completely excluded. All samples were preserved in DNA/RNA Shield (Zymo Research) and stored at –20°C prior to DNA extraction.
Figure 1
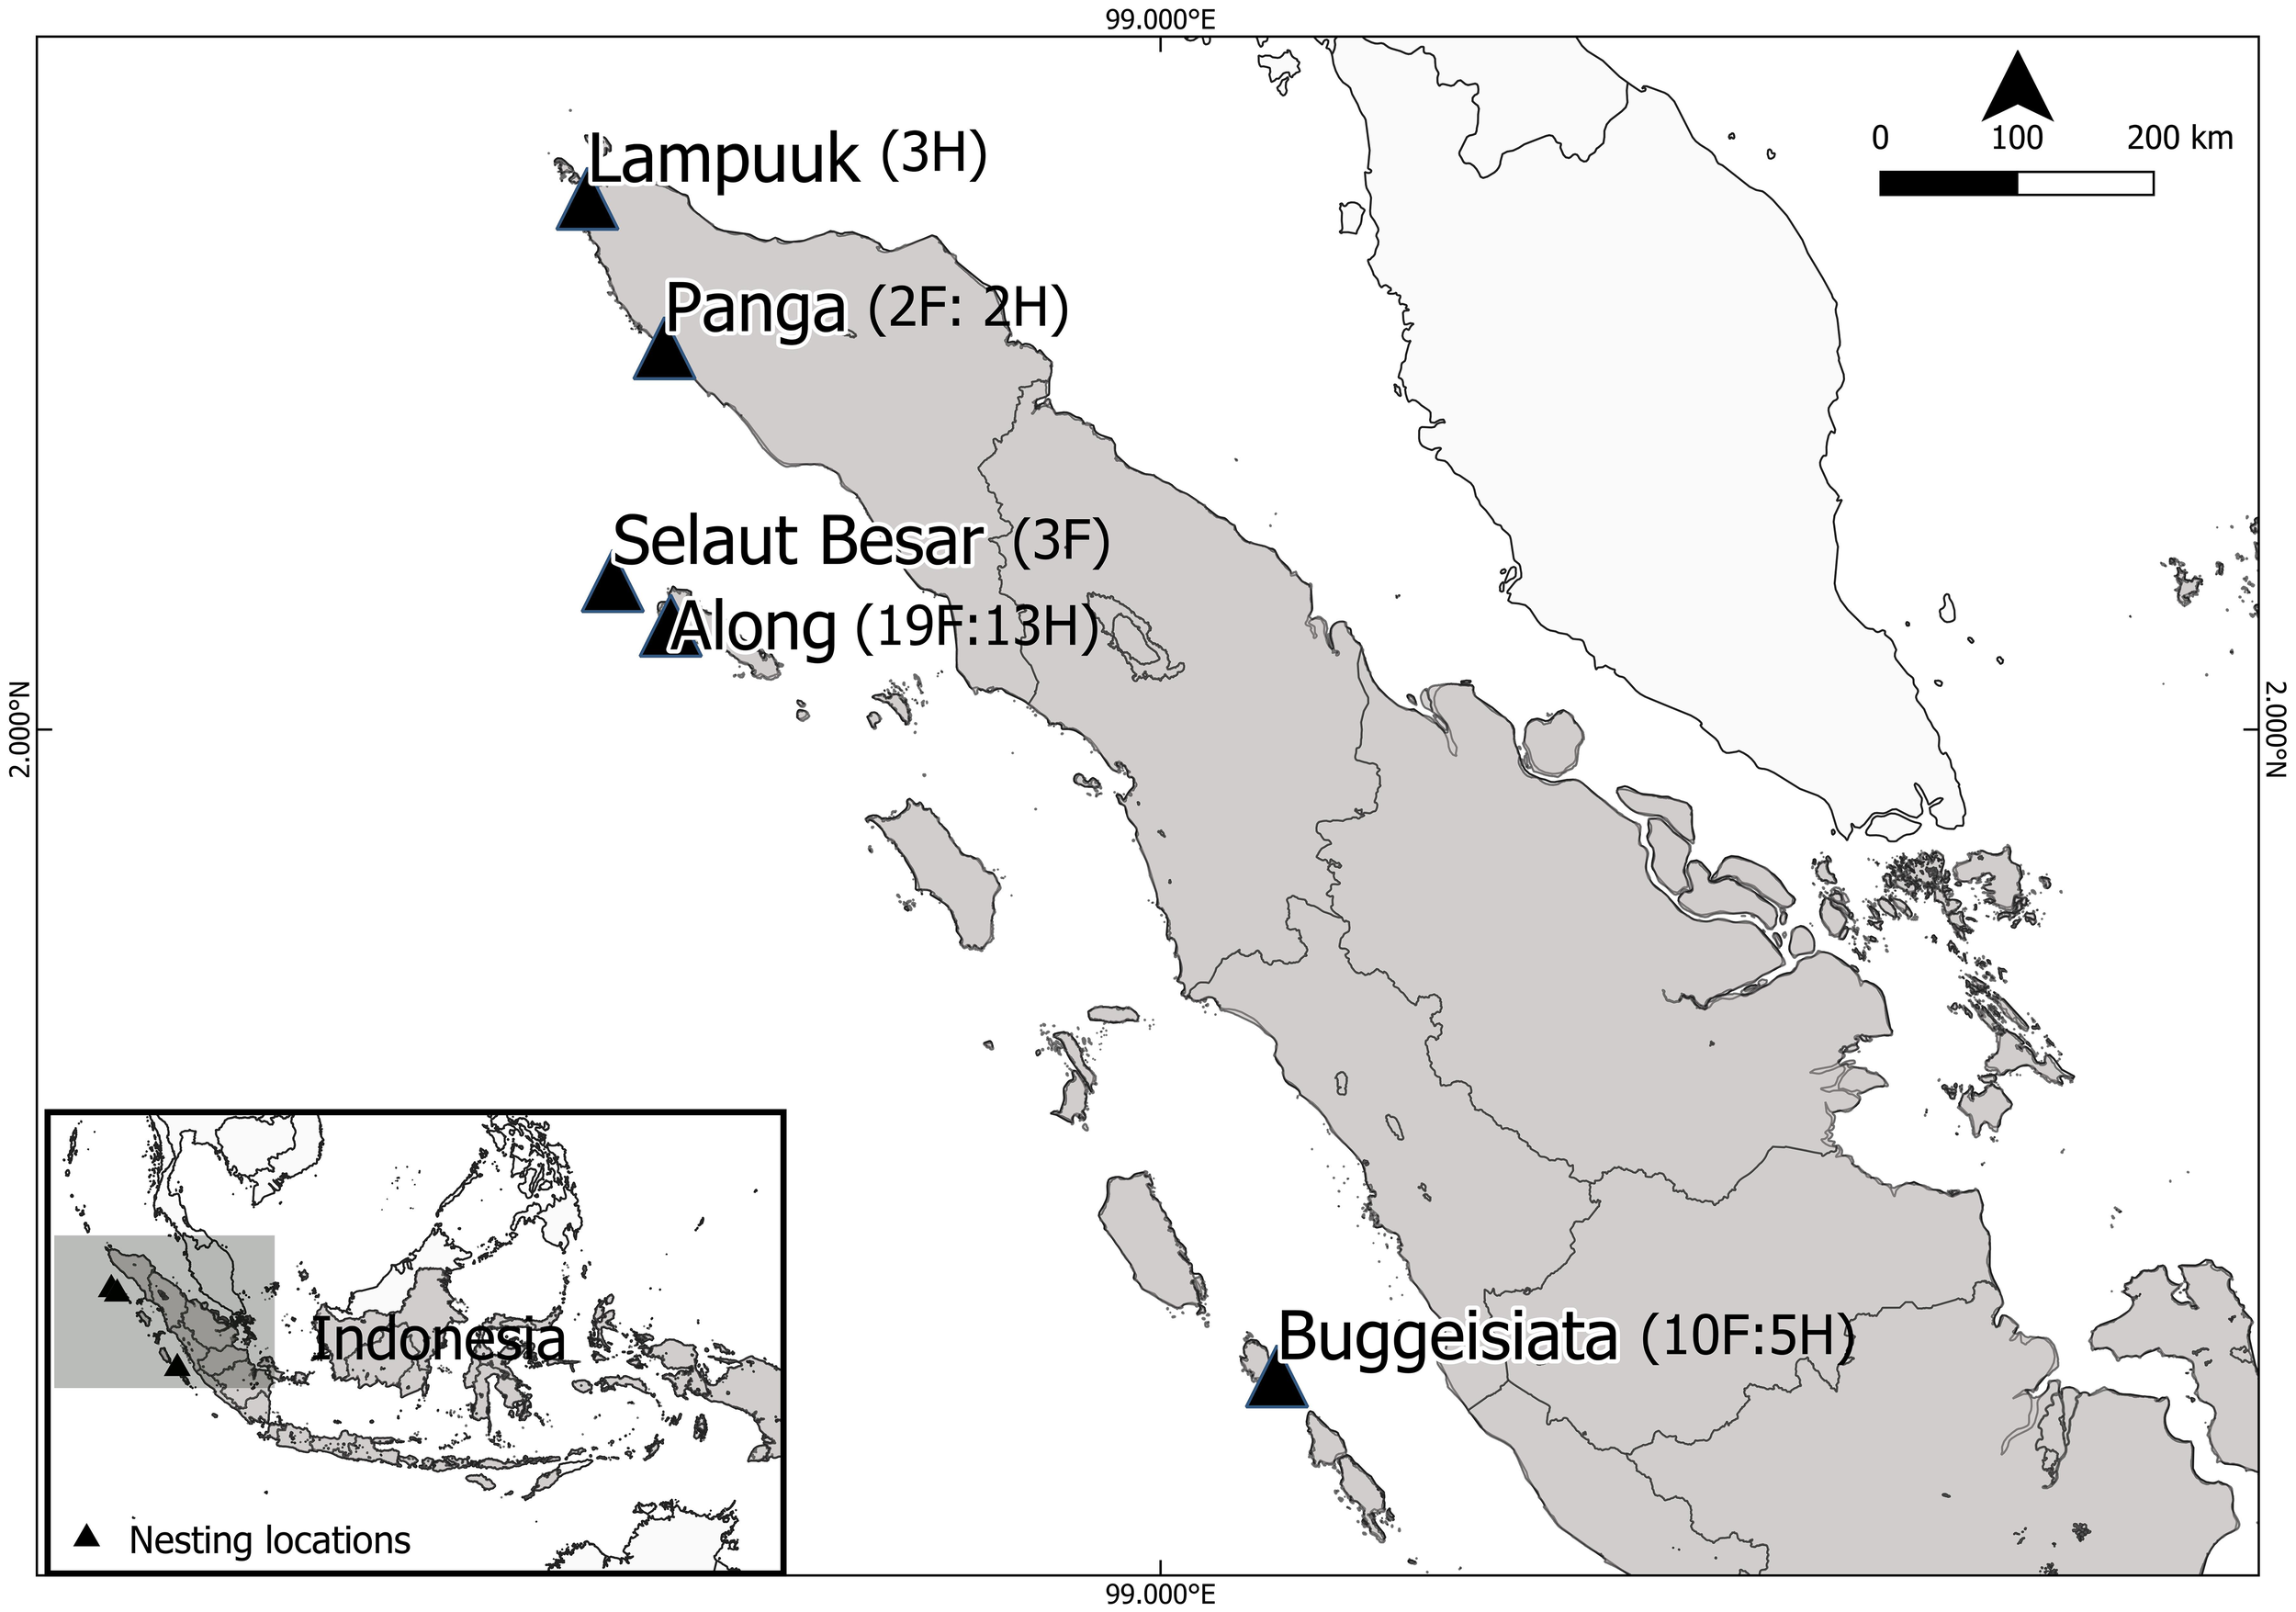
Map of Sumatra, Indonesia, showing five leatherback turtle nesting locations along the west coast where tissue samples were collected: Lampuuk, Panga, Selaut Besar, Along, and Buggeisiata. Numbers in parentheses indicate the number of females (F) and hatchlings (H) collected at each site (see Supplementary Table S1).
2.2 DNA extraction and amplification
DNA was extracted from tissue samples using the DNeasy Blood & Tissue Kit (Qiagen Inc.), following the manufacturer’s protocol. The mitochondrial DNA (mtDNA) control region was amplified using the forward primer LCM15382 (5′-GCTTAACCCTAAAGCATTGG-3′) and the reverse primer H950g (5′-GTCTCGGATTTAGGGGTTTG-3′) (Abreu-Grobois et al., 2006). PCR reactions were performed in a total volume of 20 µL, comprising 10 µL of Phire Master Mix (Thermo Scientific), 0.2 µL of each primer, 7.6 µL of nuclease-free water, and 2 µL of DNA template.
Amplification was carried out in a thermal cycler under the following conditions: an initial denaturation at 98 °C for 5 minutes; followed by 35 cycles of denaturation at 98 °C for 10 seconds, annealing at 58 °C for 10 seconds, and extension at 72 °C for 10 seconds; with a final extension step at 72 °C for 5 minutes. The expected amplicon size was approximately 800 bp. PCR products were visualized on a 1.3% agarose gel to confirm successful amplification. Successfully amplified products were sequenced using Sanger sequencing, carried out by Eurofins Genomics.
2.3 Data analysis
Forward and reverse sequence reads were trimmed to 763 bp and assembled into consensus sequences (n = 57) using Geneious Prime version 2024.0.7 (https://www.geneious.com). Sequence alignment was performed using MUSCLE in MEGA 11 version 11.0.13 (Tamura et al., 2021). Haplotype identification and the calculation of haplotype diversity (h) and nucleotide diversity (π) were conducted using DnaSP version 6.12.03 (Rozas et al., 2017). Identified haplotypes were verified through BLAST searches (Camacho et al., 2023) against the NCBI nucleotide (nt) database to determine whether they matched published sequences or represented novel variants. Putative novel variants were also compared to unpublished reference data and assigned a haplotype based on nomenclature as described by Dutton et al. (2013). Published haplotype diversity (h) and nucleotide diversity (π) data from other West Pacific (Malaysia, Papua Barat [Indonesia], Papua New Guinea, and the Solomon Islands) and Indian Ocean populations (Thailand, Great Nicobar, and South Africa) were included for comparative analysis with the Sumatra dataset (Dutton et al., 2007, 2013; Shanker et al., 2011; Wongfu et al., 2022).
Phylogenetic analysis of leatherback turtle haplotypes from the Indian Ocean and West Pacific regions, including haplotypes from Sumatra identified in this study and previous studies (Dutton et al., 2007, 2013; Shanker et al., 2011; Wongfu et al., 2022), was performed using the MrBayes 3.2.6 plugin in Geneious Prime, with 10,000,000 MCMC iterations for each tree and the first 100,000 iterations discarded as burn-in (Ronquist et al., 2012). The resulting tree was visualized and annotated using FigTree (Rambaut, 2024). A median-joining haplotype network was constructed using PopART version 3 (Bandelt et al., 1999; Leigh and Bryant, 2015) to show patterns of genetic variation among haplotypes from Sumatra and other populations from the Indian Ocean, and West Pacific.
Population structure was assessed through pairwise FST comparisons, pairwise exact tests of population differentiation, and analysis of molecular variance (AMOVA) (Excoffier et al., 1992) in RStudio, employing the poppr, ape, and hierfstat packages (Goudet, 2005; Kamvar et al., 2014; Paradis and Schliep, 2019). We first assessed genetic structure within Sumatra across five nesting beaches. Due to limited sample sizes in Lampuuk, Panga, and Selaut Besar, beaches were grouped based on geographic proximity: Lampuuk and Panga were combined, Selaut Besar and Along were grouped together, and Buggeisiata was treated as a separate group. We also evaluated population differentiation between two broader geographic regions within Sumatra (Aceh and West Sumatra), before extending the analysis to assess regional genetic structure between Sumatra and other Indo-Pacific populations. AMOVA significance values were estimated using 10,000 permutations, while exact tests of population differentiation were conducted using 100,000 permutations (Dutton et al., 2013). Additionally, a geographic map was generated using QGIS version 3.18.1 (http://www.qgis.org) to illustrate the distribution of haplotype diversity across Sumatra and comparative sites in the Indian Ocean and West Pacific regions.
3 Results
3.1 Genetic diversity
A total of eight haplotypes (Dc1.1, Dc1.4, Dc1.6, Dc1.7, Dc4.1, Dc5.1, Dc9.1, and Dc24.1) were identified in leatherback turtle populations across Sumatra, including one novel haplotype (Dc24.1) not previously reported in existing databases (Table 1). This novel haplotype differs from Dc4.1 by a single base pair at position 212 and was detected exclusively in an adult female at Panga (Supplementary Table S2). In addition, we also found that across Sumatra populations, haplotype Dc1.4 was the most frequently observed, accounting for 36.84% of populations (Supplementary Table S2). Despite the small sample size from Panga (n = 4), three different haplotypes were detected, including the novel Dc24.1. By contrast, all four samples from Lampu’uk shared a single haplotype (Dc1.4), reflecting low haplotypic diversity at this site.
Table 1
| Population | n | Haplotypes | Number of haplotypes | Haplotype diversity (h) | Nucleotide diversity (π) | |||||||||||||
|---|---|---|---|---|---|---|---|---|---|---|---|---|---|---|---|---|---|---|
| Dc1.1 | Dc1.4 | Dc1.6 | Dc1.7 | Dc4.1 | Dc5.1 | Dc6.1 | DC8.1 | Dc9.1 | Dc13.1 | Dc14.1 | Dc18.1 | Dc20.1 | Dc24.1 | |||||
| Sumatra_Panga | 4 | 0 | 2 | 0 | 0 | 0 | 0 | 0 | 0 | 1 | 0 | 0 | 0 | 0 | 1 | 3 | 0.833 | 0.0039 |
| Sumatra_Lampu’uk | 3 | 0 | 0 | 0 | 0 | 0 | 3 | 0 | 0 | 0 | 0 | 0 | 0 | 0 | 0 | 1 | 0 | 0 |
| Sumatra_Selaut Besar | 3 | 0 | 3 | 0 | 0 | 0 | 0 | 0 | 0 | 0 | 0 | 0 | 0 | 0 | 0 | 1 | 0 | 0 |
| Sumatra_Along | 32 | 3 | 9 | 2 | 1 | 9 | 2 | 0 | 0 | 6 | 0 | 0 | 0 | 0 | 0 | 7 | 0.829 | 0.0039 |
| Sumatra_Buggeisiata | 15 | 0 | 7 | 0 | 0 | 1 | 4 | 0 | 0 | 3 | 0 | 0 | 0 | 0 | 0 | 4 | 0.714 | 0.0043 |
| Total Sumatra | 57 | 3 | 21 | 2 | 1 | 10 | 9 | 0 | 0 | 10 | 0 | 0 | 0 | 0 | 1 | 8 | 0.786 | 0.0040 |
| Great Nicobar* | 131 | 57 | 0 | 0 | 0 | 24 | 37 | 0 | 0 | 13 | 0 | 0 | 0 | 0 | 0 | 4 | 0.693 | 0.0038 |
| Thailand** | 14 | 10 | 3 | 0 | 0 | 0 | 0 | 0 | 0 | 0 | 1 | 0 | 0 | 0 | 0 | 3 | 0.474 | 0.0006 |
| Malaysia*** | 9 | 3 | 0 | 0 | 0 | 2 | 3 | 0 | 1 | 0 | 0 | 0 | 0 | 0 | 0 | 4 | 0.806 | 0.0019 |
| South Africa**** | 41 | 34 | 7 | 0 | 0 | 0 | 0 | 0 | 0 | 0 | 0 | 0 | 0 | 0 | 0 | 2 | 0.290 | 0.0004 |
| Papua Barat (JY)***** | 299 | 2 | 12 | 2 | 0 | 5 | 11 | 1 | 7 | 253 | 0 | 4 | 1 | 1 | 0 | 11 | 0.280 | 0.0049 |
| Papua Barat (JS)***** | 127 | 1 | 6 | 0 | 0 | 5 | 5 | 0 | 2 | 103 | 0 | 4 | 1 | 0 | 0 | 9 | 0.340 | 0.0045 |
| Papua New Guinea*** | 18 | 1 | 0 | 0 | 0 | 1 | 1 | 0 | 0 | 15 | 0 | 0 | 0 | 0 | 0 | 4 | 0.314 | 0.0014 |
| Solomon Islands** * | 48 | 2 | 0 | 0 | 0 | 1 | 1 | 1 | 3 | 40 | 0 | 0 | 0 | 0 | 0 | 6 | 0.305 | 0.0011 |
Haplotype frequency, nucleotide diversity and haplotype diversity of the leatherback turtle populations in Sumatra and regions in the Indian Ocean and West Pacific.
data from Shanker et al., 2011*, Wongfu et al., 2022**, Dutton et al., 2007***, 2013****, Toha et al., 2025*****
Genetic diversity patterns varied across Sumatra populations, with the Along exhibiting the highest haplotype diversity (h = 0.829), while the greatest nucleotide diversity (π = 0.0043) was observed at Buggeisiata. When comparing genetic diversity across the Indian Ocean and West Pacific regions, the Sumatra population exhibited the highest values, with a nucleotide diversity of π = 0.0040 and haplotype diversity of h = 0.786. Only the population from Malaysia showed a slightly higher haplotype diversity (h = 0.806), although that population is now considered extinct.
3.2 Genetic structure and population connectivity within Sumatra
The AMOVA results indicated no genetic structure among the five nesting beaches in Sumatra, with all genetic variation occurring within populations. When grouped into three geographic clusters (Lampu’uk & Panga, Along & Selaut Besar, and Buggeisiata), variation among groups was slightly negative (–1.61%), and variation within populations accounted for 101.61% of the total. Similarly, grouping into two broader regions (Aceh and West Sumatra) yielded –3.37% variation among groups and 103.37% within populations (Supplementary Table S3). In addition, Pairwise FST comparisons and exact tests between Aceh and West Sumatra showed no significant differentiation (FST = –0.0337, p > 0.05), and all pairwise FST values among the three grouped sites were close to zero or negative and non-significant (Supplementary Table S4). Furthermore, across the Sumatra rookeries, the distribution of haplotypes was largely overlapping, with Dc1.4 occurring at all sites and other haplotypes (e.g., Dc1.1, Dc1.6, Dc4.1, Dc5.1) found at multiple locations. These results indicate a lack of population genetic structuring among the sampled beaches in Sumatra. Therefore, for subsequent regional analyses, all samples from Sumatra were considered into a single group (Indonesia-Sumatra).
3.3 Genetic structure and connectivity of the Sumatra population and other populations in the Indian Ocean and West Pacific
The genetic relationships between the Sumatra population (IDN-SUM) and other leatherback turtle populations across the Indo-Pacific reveal a distinct pattern of structure and connectivity (Table 2). Pairwise FST analysis shows that IDN-SUM is significantly differentiated from all other populations (P < 0.001), with the highest FST value is 0.451. The strongest genetic differentiation is observed between IDN-SUM and South Africa (FST = 0.320) and the West Pacific populations, including Papua Barat (FST = 0.451), Papua New Guinea (FST = 0.240), and the Solomon Islands (FST = 0.309), indicating limited gene flow between Sumatra and these rookeries. In contrast, genetic differentiation between IDN-SUM and populations in the Northeast Indian Ocean, specifically Nicobar (FST = 0.061) and Malaysia (FST = 0.072), is lower, suggesting genetic connectivity. However, despite these lower FST values, differentiation remains statistically significant, and the absolute values exceed the commonly used threshold of 0.05 for detecting biologically meaningful structure in marine turtle populations. In addition, the differentiation from Thailand (FST = 0.318) also shows a regional substructure within the Northeast Indian Ocean. Hierarchical AMOVA results further support this pattern (Supplementary Table S3). When populations were grouped into five—Southwest Indian Ocean, Northeast Indian Ocean 1 (Thailand), Northeast Indian Ocean 2 (Malaysia and Nicobar), Sumatra, and West Pacific (Papua Barat, Papua New Guinea, Solomon Islands)—the proportion of genetic variation among groups was highest (FCT = 0.5081). This was greater than in the alternative 4-group model, where Sumatra was grouped with Malaysia and Nicobar as part of Northeast Indian Ocean 2 (FCT = 0.4884).
Table 2
| SAF | NIC | THAI | MAL | IDN-SUM | IDN-PA | PNG | SOL | |
|---|---|---|---|---|---|---|---|---|
| South Africa | <0.0001 | 0.25802 | <0.0001 | <0.0001 | <0.0001 | <0.0001 | <0.0001 | |
| Nicobar | 0.36175*** | <0.0001 | 0.12106 | <0.0001 | <0.0001 | <0.0001 | <0.0001 | |
| Thailand | -0.02828n/s | 0.31836*** | 0.00563 | <0.0001 | <0.0001 | <0.0001 | <0.0001 | |
| Malaysia | 0.72231*** | -0.02853n/s | 0.56731** | 0.00501 | <0.0001 | <0.0001 | <0.0001 | |
| Indonesia-Sumatra | 0.32006*** | 0.06067*** | 0.23953*** | 0.07219** | <0.0001 | <0.0001 | <0.0001 | |
| Indonesia-Papua Barat | 0.74936*** | 0.48857*** | 0.74015*** | 0.61826*** | 0.45101*** | 0.4749 | 0.1440 | |
| Papua New Guinea | 0.82986*** | 0.30474*** | 0.75533*** | 0.46044*** | 0.23981*** | -0.02224n/s | 0.6904 | |
| Solomon Islands | 0.80923*** | 0.35386*** | 0.76380*** | 0.56045*** | 0.30927*** | -0.00532n/s | -0.03435n/s | |
Pairwise FST (below diagonal) and P-value values (above diagonal) of exact tests of population differentiation based on haplotype frequencies among leatherback rookeries in the Indian Ocean and West Pacific.
(n/s = p>0.05, * = p<0.05, ** = p<0.01, *** p<0.001).
The Median-joining haplotype network (Figure 2) and phylogenetic tree (Supplementary Figure S1) reveal three main haplogroups anchored by haplotypes Dc1.1, Dc4.1, and Dc9.1. The first haplogroup is centered around Dc1.1, a common and widespread haplotype found in the Atlantic and Indian Oceans, including South Africa. The second haplogroup comprises several closely related haplotypes clustered around Dc4.1, which is widespread in the Pacific and separated by one to two mutational steps from other Pacific-associated haplotypes. A third haplogroup consists of haplotypes derived from Dc9.1, which is also broadly distributed in the Pacific and Indian Oceans and connected to multiple minor variants. This clustering pattern is further supported by the haplotype frequency map (Figure 3), where Sumatra exhibits a distinct mix of Indian and Pacific haplotypes.
Figure 2
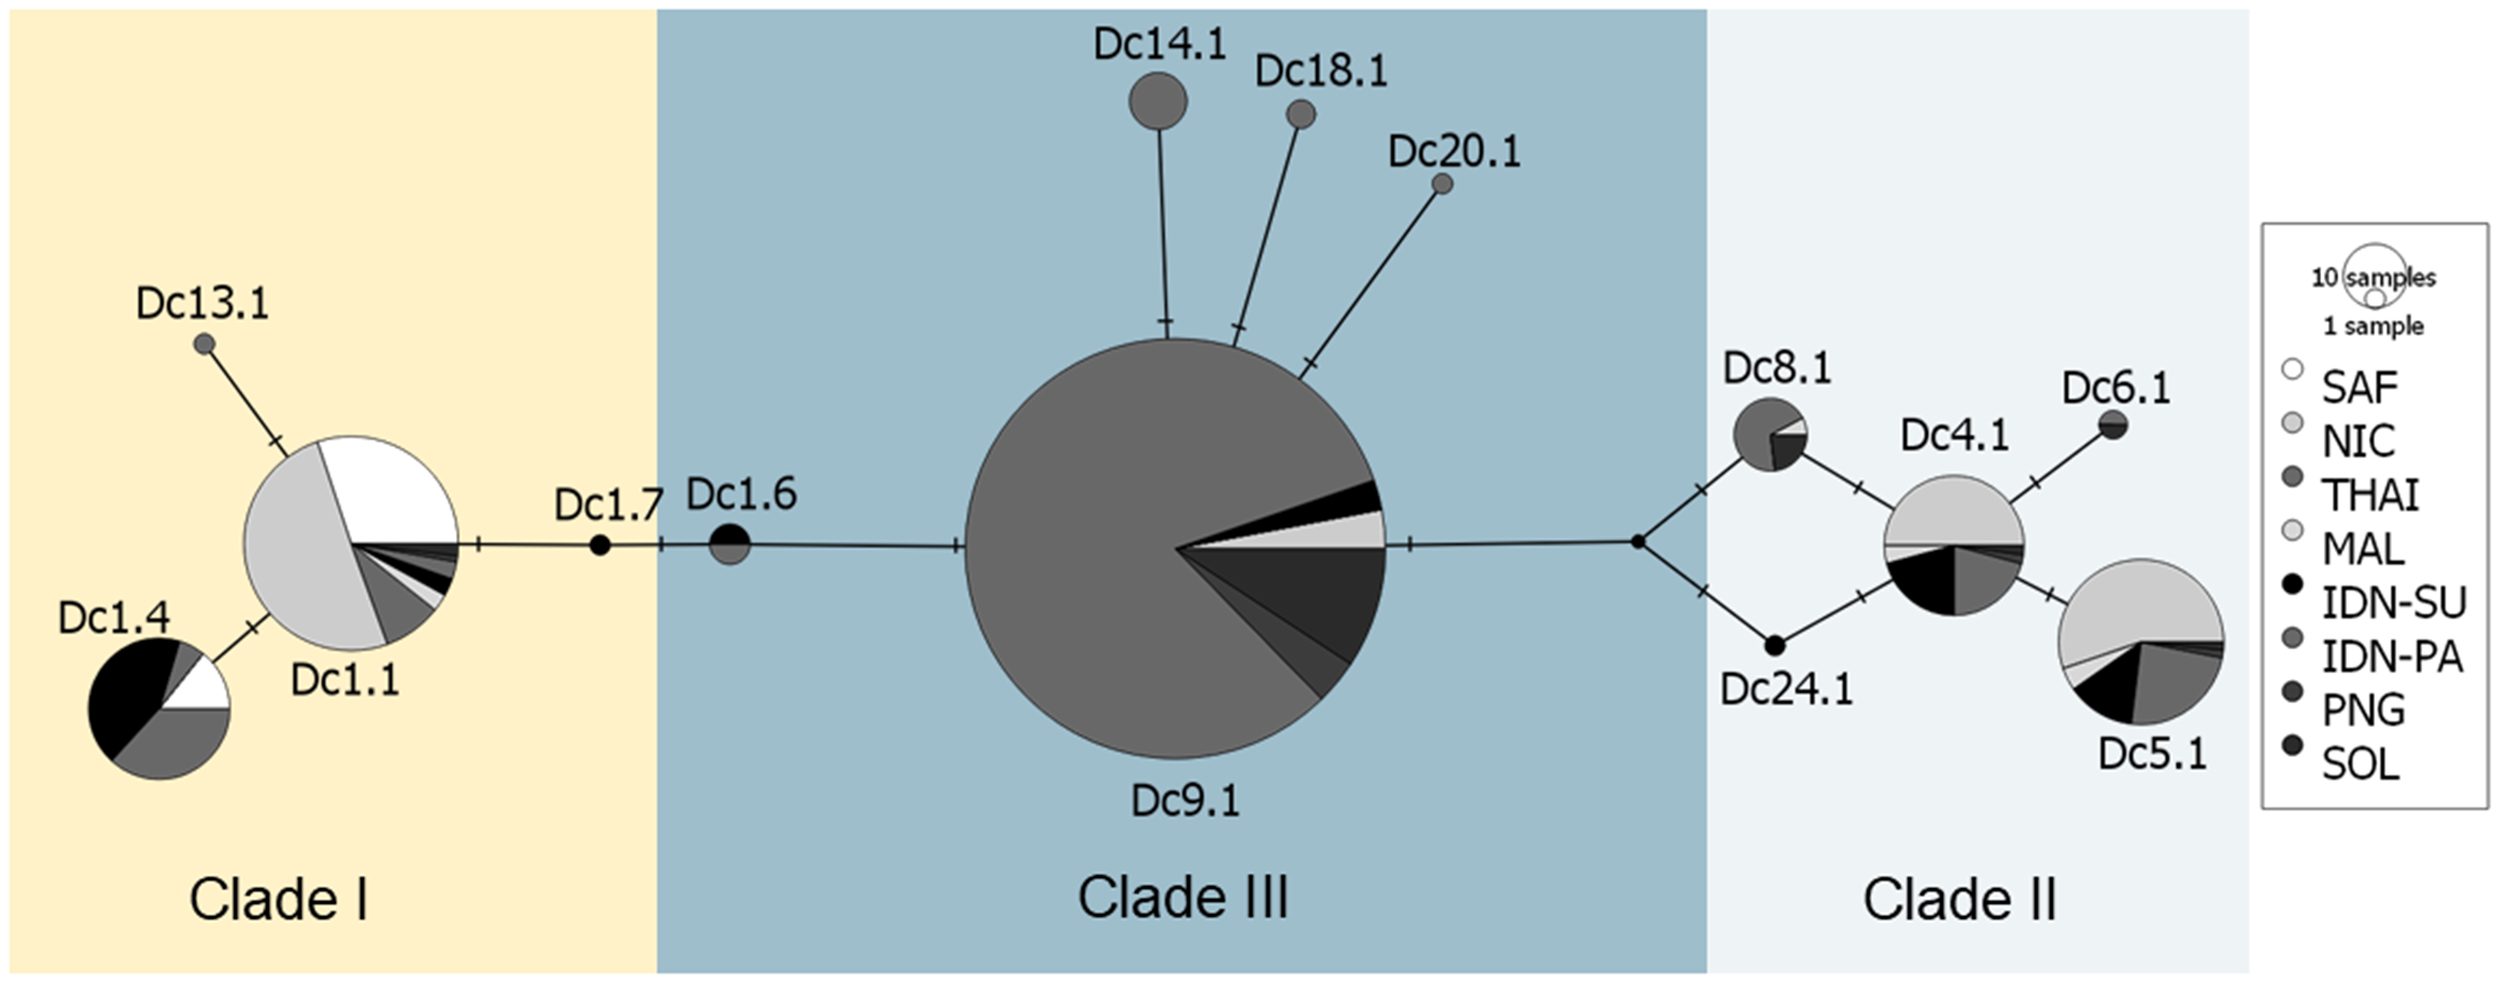
Median-joining haplotype network of leatherback turtle populations across the Indian Ocean and West Pacific regions, based on mitochondrial control region haplotypes (763 bp). Each circle represents a unique haplotype, with its size proportional to the number of individuals sharing that haplotype. Mutational steps between haplotypes are represented by the number of connecting lines. Colors indicate nesting sites, as shown in the legend. The three major clades—Clade I (Dc1.1), Clade II (Dc4.1), and Clade III (Dc9.1)—are delineated by shaded areas based on network topology, mutational distances of ≥4 mutational steps, and geographic clustering. Clades II and III are predominantly composed of haplotypes found in the West Pacific and Indian Ocean, while Clade I is predominantly Atlantic and Indian Ocean lineages. The Sumatra population (black) contains haplotypes from all three clades, highlighting its position as a genetic bridge across the Indian Ocean and West Pacific.
Figure 3
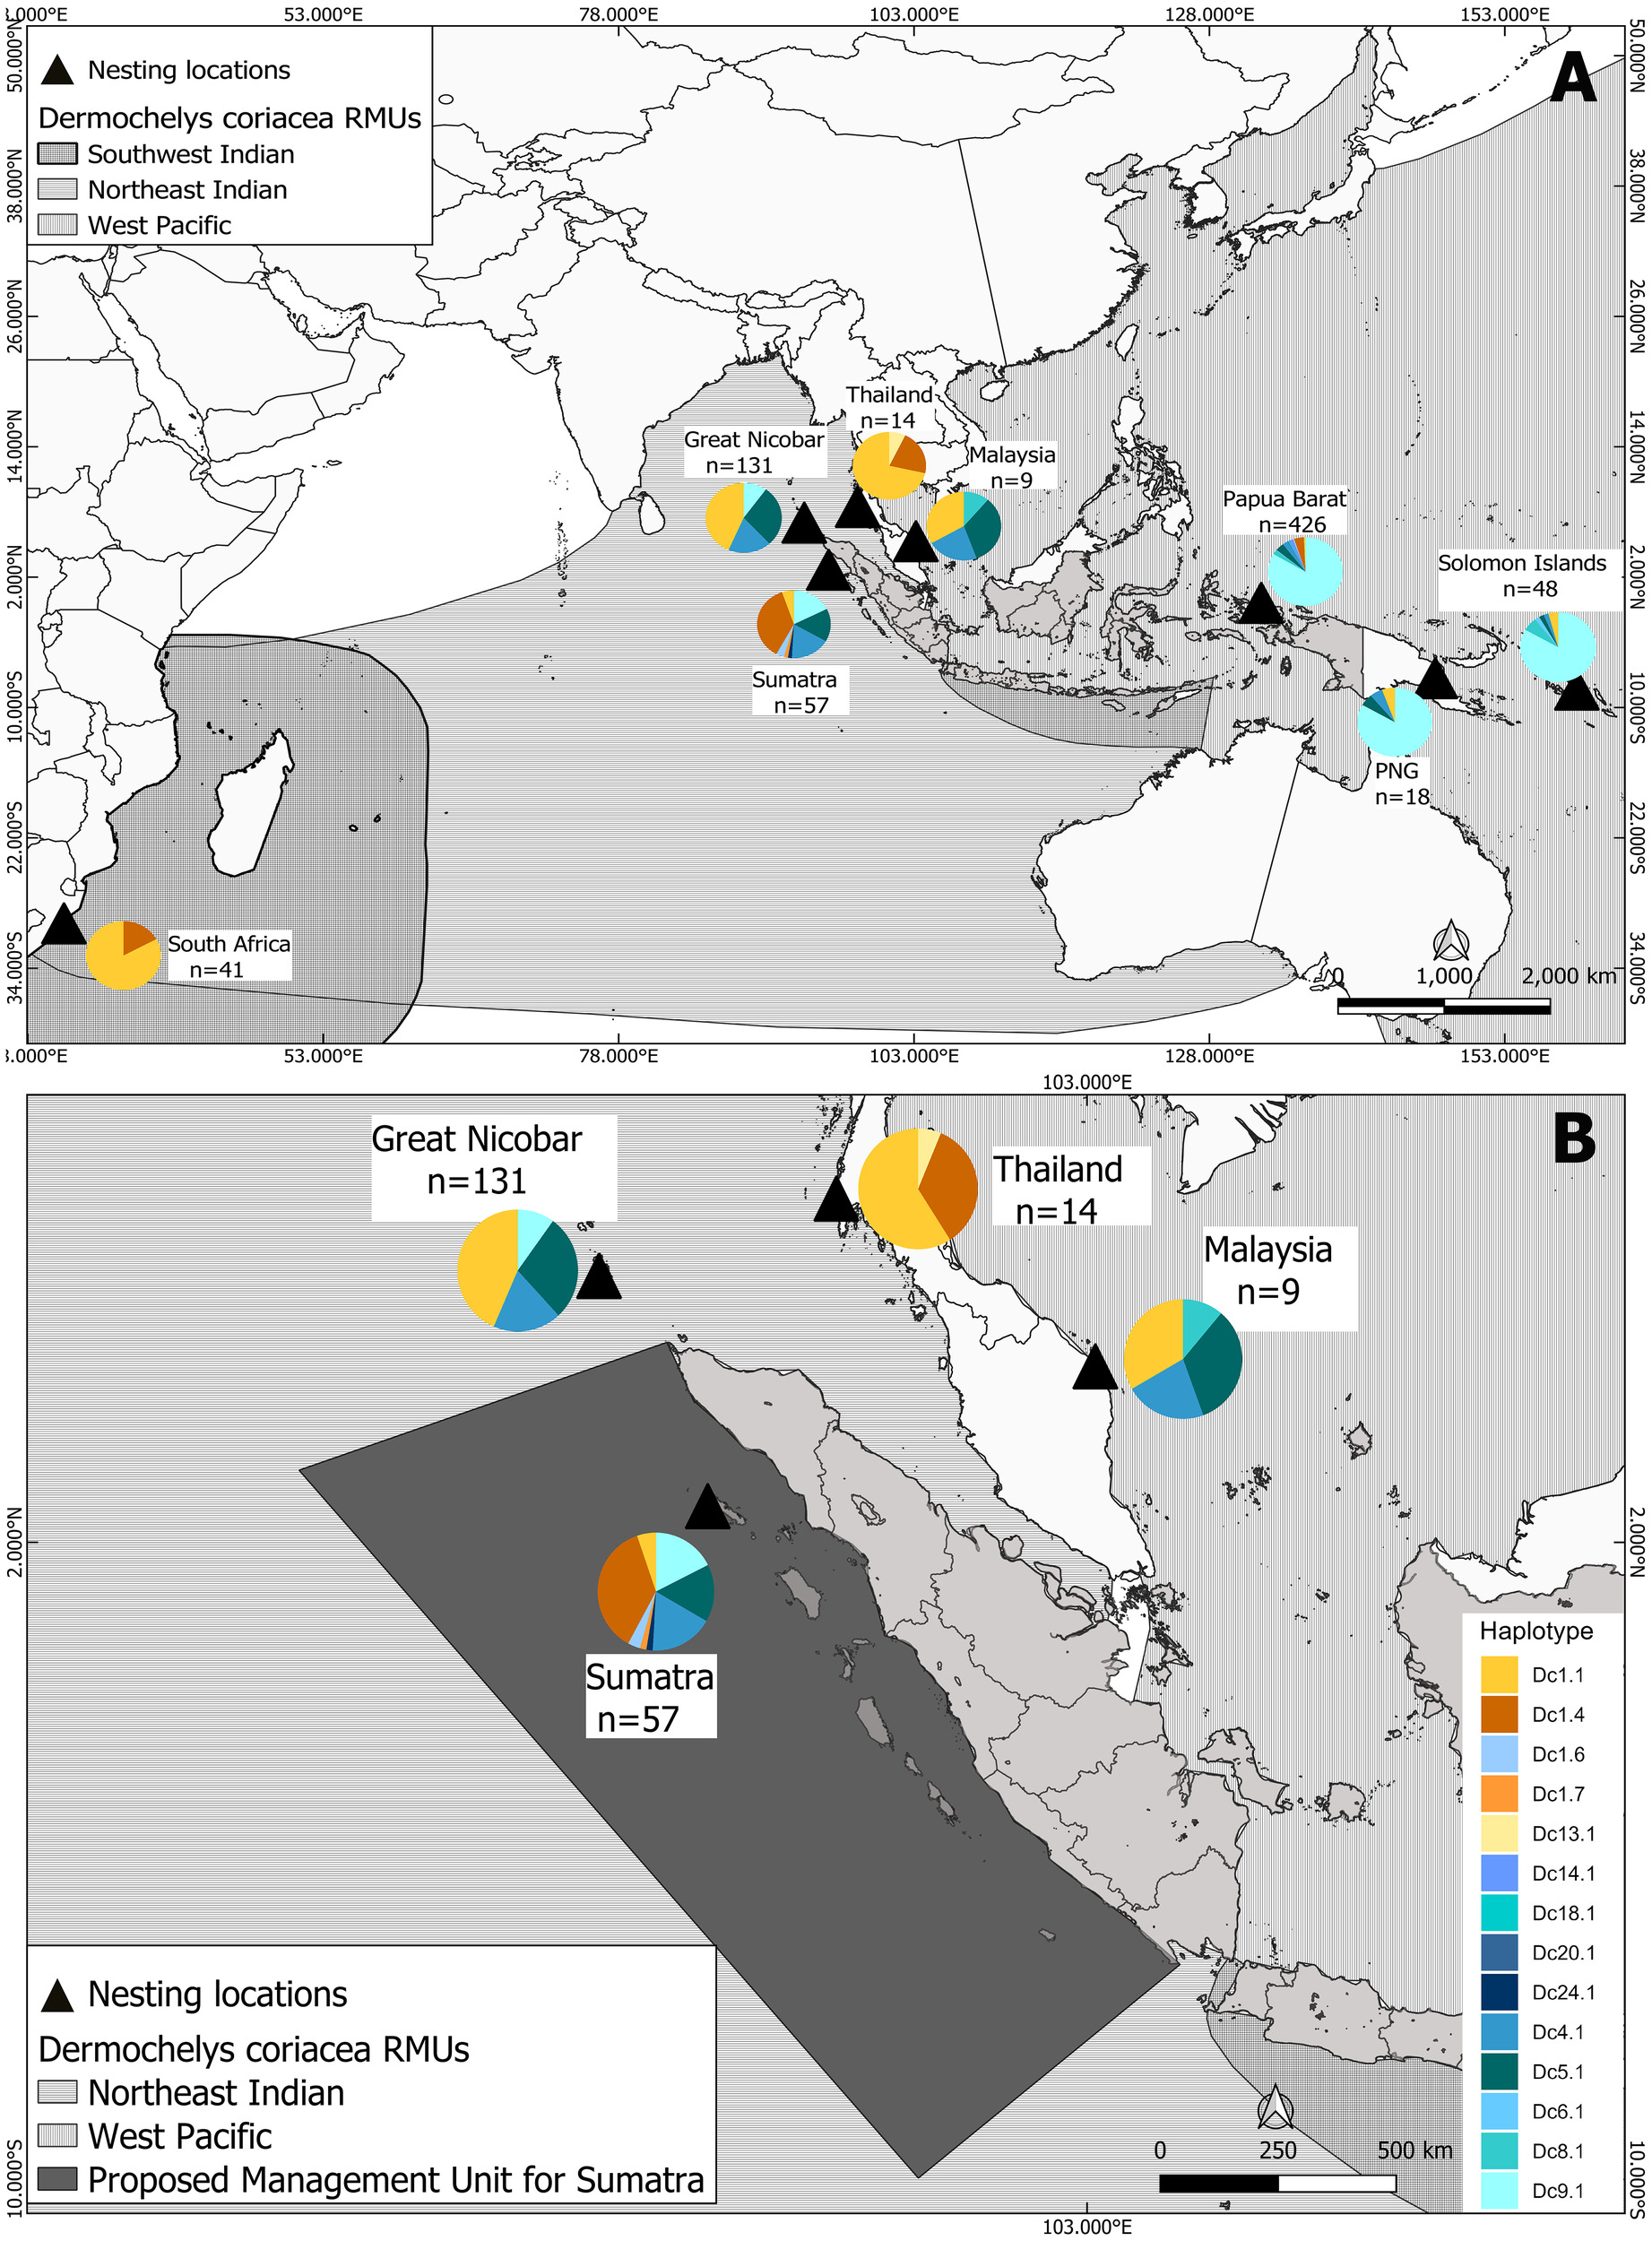
(A) Frequency distribution of leatherback turtle mitochondrial DNA haplotypes (763 bp) across nesting sites in the Indian Ocean and West Pacific regions, with sample sizes indicated (n). The map illustrates distinct regional patterns in haplotype composition, broadly separating populations into the Indian Ocean and West Pacific clusters. The Sumatra population shows a mixture of haplotypes associated with both regions. (B) Expanded view of the Northeast Indian Ocean, showing finer-scale haplotype substructure among regional populations. The Sumatra population displays a unique haplotype composition, supporting its recognition as a potential separate management unit within the Northeast Indian Ocean. The proposed management area for Sumatra is indicated in dark grey.
4 Discussion
This study aimed to assess the genetic diversity, population structure, and regional connectivity of leatherback turtle populations nesting along the west coast of Sumatra, Indonesia. Based on mtDNA control region sequences, we identified eight haplotypes, including one novel variant (Dc24.1). Genetic diversity in Sumatra was higher than in most other rookeries across the Indian Ocean and West Pacific regions. Pairwise FST comparisons revealed significant genetic structuring between the West Pacific and Indian Ocean populations, as well as substructuring within the Indian Ocean, particularly among populations in the Northeast Indian Ocean. The presence of haplotypes from both Indian Ocean and West Pacific lineages in Sumatra positions it as a potential genetic bridge between these major population groups. These findings support the recognition of Sumatra as a separate Management Unit, with important implications for leatherback conservation in the Indo-Pacific.
4.1 Genetic diversity in Sumatra
We identified eight distinct mtDNA haplotypes among leatherback turtles nesting in Sumatra, including one novel haplotype (Dc24.1) found exclusively at Panga. The most frequently observed haplotype in Sumatra, Dc1.4, has been previously reported in both the Atlantic (Dutton et al., 2013; Vargas et al., 2019) and Pacific (Toha et al., 2025), but is also common in other Indian Ocean populations (Shanker et al., 2011; Dutton et al., 2013; Wongfu et al., 2022), suggesting an Indian Ocean origin for this haplotype. In addition, haplotypes Dc5.1 and Dc9.1, previously reported in the West Pacific, were also found in relatively high frequencies in Sumatra. Haplotype Dc1.6, until recently only known from Jeen Yessa, Papua Barat (Toha et al., 2025), was also identified at Along. These findings correct errors and build on earlier work based on limited samples from two rookeries (Maslim et al., 2016) and confirm relatively high haplotypic diversity in Sumatra. Note that two new haplotypes previously identified in Sumatra (Maslim et al., 2016), Dc4.2 (GenBank# KU234548) and Dc4.3 (GenBank# KU234549), could not be validated, and are now known to be based on sequencing errors. The results presented here for Sumatra failed to detect these highly divergent haplotypes, and these two haplotypes should not be included in future studies.
This pattern of diversity is consistent with other marine turtle species, where higher haplotype richness is observed in the Indo-Pacific compared to the Atlantic. For instance, the hawksbill turtle also shows greater haplotype diversity in the Indo-Pacific (61 haplotypes) than in the Atlantic (27 haplotypes) (Arantes et al., 2020). Similar patterns of higher genetic diversity in Indo-Pacific compared to Atlantic populations have previously been documented for leatherbacks (Dutton et al., 1999, 2013). The haplotype diversity observed in Sumatra (0.786) exceeds values reported in many other rookeries globally, such as those in the Atlantic 0.112 to 0.533 (Vargas et al., 2019) or 0.112 to 0.498 (Dutton et al., 2013), Pacific 0.28–0.62 (Toha et al., 2025), Nicobar 0.693 (Shanker et al., 2011), and Thailand 0.4735 (Wongfu et al., 2022). This highlights the importance of the Sumatra population in a global context, particularly given that the Malaysian population, which previously exhibited the highest diversity, is now considered extinct (Dutton et al., 1999). This relatively high level of diversity may reflect the presence of a genetically diverse breeding population in Sumatra, or it may indicate that the region serves as a convergence zone for multiple maternal lineages from different parts of the Indo-Pacific. High haplotype diversity is often associated with regions that have experienced historical connectivity and may act as critical genetic reservoirs for migratory species (Dutton et al., 1999; Bowen and Karl, 2007; Hays et al., 2019), making Sumatra a key site for maintaining the species’ genetic health and long-term resilience.
4.2 Population structure within Sumatra
Our results indicate no significant genetic structure among leatherback turtle rookeries in Sumatra. AMOVA showed that nearly all genetic variation occurred within populations, with negative variation among grouped sites, and pairwise FST values were low or negative and non-significant. These results support the interpretation that Sumatra represents a single genetic stock. Given the low and scattered nesting along the west coast of Sumatra, our sampling reflects the overall spatial distribution of nesting in the region, with small sample sizes at some beaches due to low nesting activity rather than undersampling (As-singkily et al., in prep). This aligns with earlier findings on mitochondrial diversity in the region (Maslim et al., 2016) underscoring the importance of maintaining within-population variation to support the species’ adaptive capacity under changing environmental conditions.
Leatherback turtles, like other marine turtle species, are known to exhibit strong natal philopatry, with females returning to their birthplace to nest. This behavior contributes to reproductive isolation and can lead to fine-scale genetic structuring among populations (Roden et al., 2017; Dutton et al., 2019). Similar patterns have been documented in other sea turtle species, where natal homing has played a key role in shaping genetic population structure (Lohmann and Lohmann, 2019; Phillips et al., 2022). In the Atlantic, mtDNA analyses have also revealed fine-scale population differentiation among leatherback rookeries, linked to nesting site fidelity (Dutton et al., 2013; Vargas et al., 2019). The low and scattered nesting activity along the west coast of Sumatra, rather than undersampling, likely explains the lack of detectable genetic structure and presents challenges for delineating distinct Management Units within Sumatra populations. Nonetheless, the detection of a novel haplotype in Panga and the overall high haplotypic diversity suggest that even small, scattered rookeries contribute meaningful genetic variation. Recognizing and delineating the appropriate population units is essential for effective conservation planning, as each may possess unique genetic compositions or ecological traits (Wallace et al., 2025). Management strategies should therefore be designed based on the recognition of these population units, ensuring that conservation actions are suited to the specific demographic and ecological characteristics of each group. This approach is critical for maintaining the long-term viability of leatherback turtle populations in Sumatra. While most sampled females and nests were individually identified and tagged, a small number of nests without corresponding female identification mean that some overlap cannot be entirely excluded. Future studies incorporating multi-season sampling and higher sample sizes would help confirm maternal independence and provide a more robust assessment of population structure in Sumatra.
4.3 Connectivity and regional differentiation within the Indo-Pacific
The Sumatra population displays a unique genetic profile, sharing haplotypes with both Indian Ocean and West Pacific lineages. Our results indicate some genetic connectivity between Sumatra and nearby Northeast Indian Ocean rookeries, particularly Nicobar and Malaysia, where shared haplotypes and relatively low FST values suggest both historical and ongoing gene flow (Figure 2 and Table 2). This connectivity is likely facilitated by regional oceanographic currents and female-mediated dispersal (Jensen et al., 2020; Phillips et al., 2022), and is further supported by field observations of leatherback females nesting in both Nicobar and Along, Sumatra (Turtle Foundation, pers. comm.). In contrast, Sumatra shows stronger genetic differentiation from Thailand, suggesting subregional population structure within the eastern Indian Ocean. Within Indonesia, the strong structure between Sumatra and Papua Barat is pronounced, with high FST values reflecting limited gene flow. Similar east–west genetic structuring has been documented in other sea turtle species across the Indonesian archipelago, including green turtles (Nishizawa et al., 2018) and hawksbill turtles (Sani et al., 2024), suggesting that such patterns may be shaped by persistent biogeographic and oceanographic boundaries.
In a broader phylogeographic context, the mixture of Indian and Pacific haplotypes observed in Sumatra may reflect a historical zone of secondary contact or a post-glacial colonization pathway, where distinct lineages converged following range expansions from different ocean basins (Dutton et al., 1999). This historical signal may underlie the population’s intermediate position and is now maintained by limited but ongoing gene flow. This pattern aligns with broader sea turtle phylogeography, which suggests that major lineages originated from Indo-Pacific refugia and dispersed across ocean basins during interglacial periods, with present-day structure shaped by natal philopatry and limited female-mediated gene flow (Bowen and Karl, 2007; Bentley et al., 2023). Satellite tracking studies offer further insight into these dynamics. Leatherbacks nesting in South Africa typically forage in the nearby Mozambique Channel, with limited evidence of long-distance dispersal (Robinson et al., 2016) consistent with the observed lack of genetic connectivity with Sumatra, despite weak differentiation from Thailand. In contrast, individuals tagged in Little Andaman have been recorded migrating towards the Timor Sea and northern Australia (Swaminathan et al., 2019), overlapping with the dispersal routes of leatherbacks from Papua Barat, some of which entered Indonesian waters for foraging (Benson et al., 2011). These overlapping movement corridors support the possibility of occasional gene flow between Pacific and Indian Ocean populations and reinforce the interpretation of Sumatra as a geographic and genetic bridge within the Indo-Pacific. Collectively, the genetic structure and movement patterns highlight the complex history of connectivity in this region.
From a conservation perspective, the recognition of Sumatra as a potential genetic bridge has important implications for regional management. Its intermediate position between the West Pacific and Southwest Indian Ocean RMUs means that protecting these rookeries could help sustain connectivity and genetic diversity across ocean basins (Bowen and Karl, 2007; Vargas et al., 2016; Hoban et al., 2021; Madden Hof et al., 2023; Piboon et al., 2025). The loss of such intermediate populations could disrupt long-term gene flow and reduce the species’ overall adaptive potential under changing climatic and oceanographic conditions (Hellberg et al., 2002; Ng et al., 2024). Therefore, conservation planning should not only focus on major nesting aggregations but also prioritize smaller, transitional rookeries such as those in Sumatra, which may serve as demographic and genetic linkages among regional populations (Dutton et al., 1999; As-singkily et al., 2025a; Toha et al., 2025). Strengthening transboundary collaboration among Indonesia, India, Thailand, and other neighboring nations will be essential to maintain these linkages and safeguard the evolutionary resilience of leatherback turtles in the Indo-Pacific (Wallace et al., 2025).
4.4 Management units within Indo-Pacific
Based on mitochondrial haplotype composition, pairwise FST values, and hierarchical AMOVA results, we propose Sumatra as a distinct Management Unit (MU), separate from other populations in the Northeast Indian Ocean and the Southwest Indian Ocean (South Africa). Although Sumatra shares haplotypes with neighboring populations, the AMOVA results indicate greater genetic variation among groups in the five-group model within Indo-Pacific, supporting its treatment as a demographically independent unit. While we recognize that the presence of a single base-pair difference (Dc24.1) alone cannot justify MU differentiation, our interpretation is based on multiple lines of evidence—haplotype composition, pairwise FST values, and Sumatra’s intermediate geographic and phylogeographic position between the West Pacific and Northeast Indian Ocean rookeries. This designation reflects Sumatra’s distinct genetic profile and its contribution to regional genetic diversity. Additional data from nuclear markers and satellite tracking would be valuable in clarifying the extent of gene flow between Sumatra and adjacent populations, such as Nicobar and Malaysia, which may influence future MU boundary refinement.
In comparison, Nicobar and historical nesting populations in Malaysia show close genetic similarity and are best considered a single MU, despite Malaysia’s previous classification within the West Pacific RMU (Wallace et al., 2023). Thailand appears genetically differentiated from both this group and Sumatra, suggesting that it may represent a separate MU within the Northeast Indian Ocean. South Africa, as in earlier studies, remains genetically distinct and aligns with a separate MU in the Southwest Indian Ocean (Dutton et al., 2013; Vargas et al., 2019). West Pacific populations, including Papua Barat, Papua New Guinea, and the Solomon Islands, show internal genetic similarity and continue to be consistent with a single MU designation (Dutton et al., 2007; Toha et al., 2025). These findings point to the need to re-evaluate RMU boundaries in the Indo-Pacific (Wallace et al., 2010, 2023), particularly where past assignments, such as Malaysia’s inclusion in the West Pacific, are not supported by current genetic evidence, even though nesting in that region is now thought to be extirpated.
Nonetheless, we acknowledge that small and uneven sample sizes across some regional rookeries, particularly in Malaysia and Sumatra, may have influenced the degree of genetic differentiation detected among Northeast Indian Ocean populations. However, these sample sizes accurately represent the current nesting densities and demographic realities of these rookeries. Thus, while limited sample sizes could affect statistical power, they remain ecologically representative of the populations’ present condition. Continued sampling across additional nesting seasons and sites will be essential to capture potential temporal variation and strengthen future assessments of population structure and Management Unit boundaries across the Indo-Pacific.
The present findings further support the re-evaluation of RMU boundaries within the Indo-Pacific, particularly the Northeast Indian Ocean RMU. Based on current genetic affinities, this RMU could potentially extend southward to include Singapore, the Gulf of Thailand, and the western parts of Kalimantan and Java, as well as adjacent coastal areas. However, this delineation remains provisional due to limited genetic data from several intervening sites. Future work integrating broader sampling, genomic markers, and satellite-tracking data will be essential to refine these boundaries and strengthen regional management coordination. Recent advances in next-generation sequencing (NGS) technologies, such as genome-wide SNP analysis and RAD-Capture (Rapture), offer the potential to resolve fine-scale population structure and detect adaptive variation beyond the limits of mtDNA. For example, Vilaça et al. (2021) applied whole-genome resequencing to detect cryptic divergence and historical hybridization across sea turtle lineages, providing deeper insights into evolutionary relationships. Similarly, Komoroske et al. (2019) developed a versatile RAD-Capture platform for marine turtles, which enabled high-resolution genotyping and identification of both fine-scale population structure and adaptive genetic variation. Toha et al. (2025) combined rapture and whole genome resequencing data to rule out fine scale substructuring of leatherbacks nesting in Papua Barat, Indonesia. These NGS-based approaches represent powerful tools for refining Management Unit (MU) and Evolutionarily Significant Unit (ESU) boundaries, particularly in genetically complex regions such as the Indo-Pacific.
5 Conclusion
This study reveals high mitochondrial haplotype diversity and mixed maternal ancestry in leatherback turtles nesting in Sumatra, including a novel haplotype and shared lineages with both the Indian Ocean and the West Pacific. Genetic structuring distinguishes the Sumatra population from others in the region, supporting its recognition as a distinct Management Unit (MU). These findings underscore the importance of region-specific conservation strategies that prioritize the protection of Sumatra’s unique genetic composition while maintaining connectivity across the Indo-Pacific.
Statements
Data availability statement
The original contributions presented in the study are included in the article/Supplementary Material. Further inquiries can be directed to the corresponding authors.
Ethics statement
The animal study was approved by National Research and Innovation Agency (BRIN) under reference number B-9/IV/KS.01.04/1/2022 and Ministry of Forestry and Environment Indonesia under permit number SK.109/KSDAE/SET.3/KSA.2/5/2022. The study was conducted in accordance with the local legislation and institutional requirements.
Author contributions
MA-S: Validation, Funding acquisition, Data curation, Writing – review & editing, Conceptualization, Writing – original draft, Methodology, Visualization, Formal Analysis, Software. PD: Data curation, Investigation, Conceptualization, Validation, Writing – review & editing, Methodology, Supervision. VV: Investigation, Software, Resources, Writing – review & editing, Formal Analysis, Data curation. MZ: Writing – review & editing, Investigation, Resources, Conceptualization. M: Resources, Project administration, Investigation, Writing – review & editing. RN: Data curation, Supervision, Writing – review & editing, Conceptualization, Investigation, Methodology, Resources, Validation. LB: Resources, Validation, Writing – original draft, Supervision, Conceptualization, Funding acquisition, Writing – review & editing, Methodology.
Funding
The author(s) declare financial support was received for the research and/or publication of this article. Funding provided by the Indonesia Endowment Fund for Education (LPDP) Scholarship from the Ministry of Finance of the Republic of Indonesia for the first author, Award Number SKPB8837/ LPDP/LPDP.3/2024.
Acknowledgments
We extend our gratitude to the Turtle Foundation – Yayasan Penyu Indonesia, EcosystemImpact, Kelompok Konservasi Penyu Along, and Aroen Meubanja, DKP Aceh, BPSPL Padang as well as to Stefanus, Wawan, Fren, Irda, Tom, and Hiltrud Cordes for their assistance during fieldwork and sample collection. We thank Adhith Swaminathan and Kelly Stewart for helpful input on the manuscript. Sampling was conducted under permit number SK.109/KSDAE/SET.3/KSA.2/5/2022 from the Ministry of Forestry and Environment (KLHK), with ethical approval granted by the National Research and Innovation Agency (BRIN) under reference number B-9/IV/KS.01.04/1/2022. Sample transfer was authorized under CITES permits issued by Indonesia (18867/IV/SATSLN/2023) and the Netherlands (24NL322651/11).
Conflict of interest
The authors declare that the research was conducted in the absence of any commercial or financial relationships that could be construed as a potential conflict of interest.
The author(s) declared that they were an editorial board member of Frontiers, at the time of submission. This had no impact on the peer review process and the final decision.
Generative AI statement
The author(s) declare that no Generative AI was used in the creation of this manuscript.
Any alternative text (alt text) provided alongside figures in this article has been generated by Frontiers with the support of artificial intelligence and reasonable efforts have been made to ensure accuracy, including review by the authors wherever possible. If you identify any issues, please contact us.
Publisher’s note
All claims expressed in this article are solely those of the authors and do not necessarily represent those of their affiliated organizations, or those of the publisher, the editors and the reviewers. Any product that may be evaluated in this article, or claim that may be made by its manufacturer, is not guaranteed or endorsed by the publisher.
Supplementary material
The Supplementary Material for this article can be found online at: https://www.frontiersin.org/articles/10.3389/fmars.2025.1699375/full#supplementary-material
References
1
Abreu-Grobois F. A. Horrocks J. Formia A. Dutton P. H. LeRoux R. Velez-Zuazo X. et al . (2006). “ New mtDNA D-loop primers which work for a variety of marine turtle species may increase the resolution of mixed stock analysis,” in Proceedings of the 26th Annual Symposium on Sea Turtle Biology, Book of Abstracts. ( NOAA, Myrtle Beach). 179.
2
Arantes L. S. Vargas S. M. Santos F. R. (2020). Global phylogeography of the critically endangered hawksbill turtle (Eretmochelys imbricata). Genet. Mol. Biol.43, 1–12. doi: 10.1590/1678-4685-GMB-2019-0264
3
As-singkily M. Nijland R. Bista I. Dutton P. H. Becking L. E . (2025a). Assessing Applicability of eDNA-Based Sampling for Population Monitoring of Leatherback Turtles in the Northeast Indian Ocean. Environmental DNA, 7. doi: 10.1002/edn3.70160
4
As-singkily M. Nijland R. Becking L. E . (2025b). Sea turtle protection in Indonesia: A review of constitutional and customary regulations. Environmental Challenges, 20. doi: 10.1016/j.envc.2025.101304
5
Bandelt H.-J. Forster P. Röhl A. (1999). Median-joining networks for inferring intraspecific phylogenies. Mol. Biol. Evol.16, 37–48. doi: 10.1093/oxfordjournals.molbev.a026036
6
Benson S. R. Dutton P. H. Hitipeuw C. Samber B. Bakarbessy J. Parker D. (2007). Post-nesting migrations of leatherback turtles (dermochelys coriacea) from jamursba-medi, Bird’s head Peninsula, Indonesia. Chelonian Conserv. Biol.6, 150–154. doi: 10.2744/1071-8443(2007)6[150:PMOLTD]2.0.CO;2
7
Benson S. R. Eguchi T. Foley D. G. Forney K. A. Bailey H. Hitipeuw C. et al . (2011). Large-scale movements and high-use areas of western Pacific leatherback turtles, Dermochelys coriacea. Ecosphere2, 1–27. doi: 10.1890/ES11-00053.1
8
Bentley B. P. Carrasco-Valenzuela T. Ramos E. K. S. Pawar H. Arantes L. S. Alexander A. et al . (2023). Divergent sensory and immune gene evolution in sea turtles with contrasting demographic and life histories. Proc. Natl. Acad. Sci. United States America. 120. doi: 10.1073/pnas.2201076120
9
Bowen B. W. Karl S. A. (2007). Population genetics and phylogeography of sea turtles. Mol. Ecol.16, 4886–4907. doi: 10.1111/j.1365-294X.2007.03542.x
10
Camacho C. Boratyn G. M. Joukov V. Vera Alvarez R. Madden T. L. (2023). ElasticBLAST: accelerating sequence search via cloud computing. BMC Bioinf.24, 117. doi: 10.1186/s12859-023-05245-9
11
Dutton P. H. Bowen B. W. Owens D. W. Barragan A. Davis S. K. (1999). Global phylogeography of the leatherback turtle (Dermochelys coriacea). J. Zool. Lond.248, 397–409. doi: 10.1111/j.1469-7998.1999.tb01038.x
12
Dutton P. H. Hitipeuw C. Zein M. Benson S. R. Petro G. Pita J. et al . (2007). Status and genetic structure of nesting populations of leatherback turtles (Dermochelys coriacea) in the western Pacific. Chelonian Conserv. Biol.6, 47–53. doi: 10.2744/1071-8443(2007)6[47:SAGSON]2.0.CO;2
13
Dutton P. H. LeRoux R. A. LaCasella E. L. Seminoff J. A. Eguchi T. Dutton D. L. (2019). Genetic analysis and satellite tracking reveal origin of the green turtles in San Diego Bay. Mar. Biol.166, 1–13. doi: 10.1007/s00227-018-3446-4
14
Dutton P. H. Roden S. E. Stewart K. R. LaCasella E. Tiwari M. Formia A. et al . (2013). Population stock structure of leatherback turtles (Dermochelys coriacea) in the Atlantic revealed using mtDNA and microsatellite markers. Conserv. Genet.14, 625–636. doi: 10.1007/s10592-013-0456-0
15
Dutton P. H. Stewart K. R. (2013). A method for sampling hatchling sea turtles for the development of a genetic tag. Mar. Turtle Newslett.138, 3–7.
16
Excoffier L. Smouse P. E. Quattro J. M. (1992). Analysis of molecular variance inferred from metric distances among DNA haplotypes: application to human mitochondrial DNA restriction data. Genetics131, 479–491. doi: 10.1093/genetics/131.2.479
17
Goudet J. (2005). HIERFSTAT, a package for R to compute and test hierarchical F-statistics. Mol. Ecol. Notes5, 184–186. doi: 10.1111/j.1471-8278
18
Hamann M. Limpus C. Hughes G. Mortimer J. A. Pilcher N. (2006). “ Assessment of the conservation status of the leatherback turtle in the Indian Ocean and South-East Asia,” in IOSEA Species Assessment: Volume I. Bangkok, Thailand: IOSEA Marine Turtle MoU Secretariat.
19
Hamann M. Godfrey M. H. Seminoff J. A. Arthur K. Barata P. C. R. Bjorndal K. A. et al . (2010). Global research priorities for sea turtles: Informing management and conservation in the 21st century. Endangered Species Research, 11, 245–269. doi: 10.3354/esr00279
20
Harris L. R. Nel R. Oosthuizen H. Meÿer M. Kotze D. Anders D. et al . (2015). Paper-efficient multi-species conservation and management are not always field-effective: The status and future of Western Indian Ocean leatherbacks. Biol. Conserv.191, 383–390. doi: 10.1016/j.biocon.2015.07.009
21
Hays G. C. Bailey H. Bograd S. J. Bowen W. D. Campagna C. Carmichael R. H. et al . (2019). Translating marine animal tracking data into conservation policy and management. Trends Ecol. Evol.34, 459–473. doi: 10.1016/j.tree.2019.01.009
22
Hellberg M. E. Burton R. S. Neigel J. E. Palumbi S. R . (2002). Genetic Assessment of Connectivity Among Marine Populations. Bull. Mar. Sci.70, 273–290.
23
Hitipeuw C. Dutton P. H. Benson S. Thebu J. Bakarbessy J. (2007). Population status and internesting movement of leatherback turtles, Dermochelys coriacea, nesting on the northwest coast of Papua, Indonesia. Chelonian Conserv. Biol.6, 28–36. doi: 10.2744/1071-8443(2007)6[28:PSAIMO]2.0.CO;2
24
Hoban S. Bruford M. W. Funk W. C. Galbusera P. Griffith M. P. Grueber C. E. et al . (2021). Global commitments to conserving and monitoring genetic diversity are now necessary and feasible. In BioScience71, 964–976. Oxford University Press. doi: 10.1093/biosci/biab054
25
Jensen M. P. Dalleau M. Gaspar P. Lalire M. Jean C. Ciccione S. et al . (2020). Seascape genetics and the spatial ecology of juvenile green turtles. Genes11, 278. doi: 10.3390/genes11030278
26
Kamvar Z. N. Tabima J. F. Gr̈unwald N. J. (2014). Poppr: An R package for genetic analysis of populations with clonal, partially clonal, and/or sexual reproduction. PeerJ2014, 1–14. doi: 10.7717/peerj.281
27
Komoroske L. M. Jensen M. P. Stewart K. R. Shamblin B. M. Dutton P. H. (2017). Advances in the application of genetics in marine turtle biology and conservation. Front. Mar. Sci.4. doi: 10.3389/fmars.2017.00156
28
Komoroske L. M. Miller M. R. O’Rourke S. M. Stewart K. R. Jensen M. P. Dutton P. H. (2019). A versatile Rapture (RAD-Capture) platform for genotyping marine turtles. Mol. Ecol. Resour.19, 497–511. doi: 10.1111/1755-0998.12980
29
Leigh J. W. Bryant D. (2015). POPART: Full-feature software for haplotype network construction. Methods Ecol. Evol.6, 1110–1116. doi: 10.1111/2041-210X.12410
30
Lohmann K. J. Lohmann C. M. F. (2019). There and back again: Natal homing by magnetic navigation in sea turtles and salmon. J. Exp. Biol.222. doi: 10.1242/jeb.184077
31
Madden Hof C. A. Desbiens A. A. Kinch J. Fitzsimmons N. N. Versace H. Amon A. et al . (2023). From rookeries to foraging grounds: understanding regional connectivity and genetic diversity in hawksbill turtles. Front. Mar. Sci.10. doi: 10.3389/fmars.2023.1201009
32
Madduppa H. Bahri S. Ghozali A. T. Atmadipoera A. S. Subhan B. Santoso P. et al . (2021). Population genetic structure of Olive ridley (Lepidochelys olivacea) across Indonesian archipelago revealed by mitochondrial DNA: Implication for management. Regional Stud. Mar. Sci.41. doi: 10.1016/j.rsma.2020.101600
33
Maslim Farajallah A. (2016). Distribution and nesting habitat status of leatherback turtle (Dermochelys coriacea) in Indonesia. Zoo Indonesia25, 160–164.
34
Maslim Farajallah A. Zamani N. P. (2016). Leatherback turtle (Dermochelys coriacea) populations in Sumatra: Genetic diversity and connectivity pattern. AACL Bioflux9, 276–283.
35
Moritz C. (1994). Defining “Evolutionarily significant units” for conservation. Trends Ecol. Evol.10, 373–375. doi: 10.1016/0169-5347(94)90057-4
36
Ng C. K. Y. Ishihara T. Hamabata T. Nishizawa H. Liu M. Song J. H. et al . (2024). Overview of the population genetics and connectivity of sea turtles in the East Asia Region and their conservation implications. Front. Mar. Sci.11. doi: 10.3389/fmars.2024.1325849
37
Nishizawa H. Joseph J. Chong Y. K. Syed Kadir S. A. Isnain I. Ganyai T. A. et al . (2018). Comparison of the rookery connectivity and migratory connectivity: insight into movement and colonization of the green turtle (Chelonia mydas) in Pacific–Southeast Asia. Mar. Biol.165, 77. doi: 10.1007/s00227-018-3328-9
38
Paradis E. Schliep K. (2019). Ape 5.0: An environment for modern phylogenetics and evolutionary analyses in R. Bioinformatics35, 526–528. doi: 10.1093/bioinformatics/bty633
39
Phillips K. F. Martin K. R. Stahelin G. D. Savage A. E. Mansfield K. L. (2022). Genetic variation among sea turtle life stages and species suggests connectivity among ocean basins. Ecol. Evol.12. doi: 10.1002/ece3.9426
40
Piboon P. Brown J. Kaewmong P. Kittiwattanawong K. Nganvongpanit K . (2025). Biology, Nesting Behavior, Genetic Diversity, and Conservation of Leatherback Sea Turtles: Insights From Thailand and Global Perspectives. In Ecology and Evolution15. John Wiley and Sons Ltd. doi: 10.1002/ece3.71014
41
Prosdocimi L. Dutton P. H. Albareda D. Remis M. I. (2014). Origin and genetic diversity of leatherbacks (Dermochelys coriacea) at argentine foraging grounds. J. Exp. Mar. Biol. Ecol.458, 13–19. doi: 10.1016/j.jembe.2014.04.025
42
Rambaut A. (2024). FigTree (v1.4.5) (Edinburgh: Institute of Evolutionary Biology, University of Edinburgh).
43
Reavis J. L. Rojas-Canizales D. Mejias-Balsalobre C. Naranjo I. Arauz R. Senko J. F. (2022). Dynamics of human take and animal predation on sea turtle nests in Northwest Costa Rica. PeerJ10. doi: 10.7717/peerj.12925
44
Robinson N. J. Morreale S. J. Nel R. Paladino F. V. (2016). Coastal leatherback turtles reveal conservation hotspot. Sci. Rep.6. doi: 10.1038/srep37851
45
Roden S. E. Stewart K. R. James M. C. Dodge K. L. Dell’Amico F. Dutton P. H. (2017). Genetic fingerprinting reveals natal origins of male leatherback turtles encountered in the Atlantic Ocean and Mediterranean Sea. Mar. Biol.164, 1–9. doi: 10.1007/s00227-017-3211-0
46
Roe J. H. Clune P. R. Paladino F. V. (2013). Characteristics of a leatherback nesting beach and implications for coastal development. Chelonian Conserv. Biol.12, 34–43. doi: 10.2744/CCB-0967.1
47
Ronquist F. Teslenko M. van der Mark P. Ayres D. L. Darling A. Höhna S. et al . (2012). Mrbayes 3.2: Efficient bayesian phylogenetic inference and model choice across a large model space. Systematic Biol.61, 539–542. doi: 10.1093/sysbio/sys029
48
Rozas J. Ferrer-Mata A. Sanchez-DelBarrio J. C. Guirao-Rico S. Librado P. Ramos-Onsins S. E. et al . (2017). DnaSP 6: DNA sequence polymorphism analysis of large data sets. Mol. Biol. Evol.34, 3299–3302. doi: 10.1093/molbev/msx248
49
Sani L. M. I. Jamaludin Hadiko G. Herma E. Inoguchi E. Jensen M. P. et al . (2024). Unraveling fine-scale genetic structure in endangered hawksbill turtle (Eretmochelys imbricata) in Indonesia: implications for management strategies. Front. Mar. Sci.11. doi: 10.3389/fmars.2024.1358695
50
Seminoff J. A. Benson S. R. Arthur K. E. Eguchi T. Dutton P. H. Tapilatu R. F. et al . (2012). Stable isotope tracking of endangered sea turtles: Validation with satellite telemetry and δ15N analysis of amino acids. PloS One7(5). doi: 10.1371/journal.pone.0037403
51
Shanker K. Choudhury B. C. Aggarwal R. K. (2011). Conservation genetics of marine turtles on the mainland coast of India and offshore island. Hyderabad, India: Final Project Report. Wildlife Institute of India, Dehradun and Centre for Cellular and Molecular Biology.
52
Shillinger G. L. Palacios D. M. Bailey H. Bograd S. J. Swithenbank A. M. Gaspar P. et al . (2008). Persistent leatherback turtle migrations present opportunities for conservation. PloS Biol.6, 1408–1416. doi: 10.1371/journal.pbio.0060171
53
Stewart K. R. Dutton P. H. (2011). Paternal genotype reconstruction reveals multiple paternity and sex ratios in a breeding population of leatherback turtles (Dermochelys coriacea). Conserv. Genet.12, 1101–1113. doi: 10.1007/s10592-011-0212-2
54
Swaminathan A. Namboothri N. Shanker K. (2019). Tracking leatherback turtles from little andaman. Indian Ocean Turtle Newslett.29, 8–10.
55
Tamura K. Stecher G. Kumar S. (2021). MEGA11: molecular evolutionary genetics analysis version 11. Mol. Biol. Evol.38, 3022–3027. doi: 10.1093/molbev/msab120
56
Toha A. H. A. Lontoh D. Pakiding F. Prasetyo A. P. Komoroske L. M. Dutton P. H. (2025). Population structure and genetic diversity of leatherback turtles (Dermochelys coriacea) in Bird’s Head Seascape, Papua-Indonesia. Front. Mar. Sci.12. doi: 10.3389/fmars.2025.1569466
57
Tomillo P. S. Saba V. S. Blanco G. S. Stock C. A. Paladino F. V. Spotila J. R. (2012). Climate driven egg and hatchling mortality threatens survival of Eastern Pacific leatherback turtles. PloS One7, 1–7. doi: 10.1371/journal.pone.0037602
58
Vargas S. M. Jensen M. P. Ho S. Y. W. Mobaraki A. Broderick D. Mortimer J. A. et al . (2016). Phylogeography, genetic diversity, and management units of hawksbill turtles in the indo-pacific. J. Heredity107, 199–213. doi: 10.1093/jhered/esv091
59
Vargas S. M. Lins L. S. F. Molfetti É. Ho S. Y. W. Monteiro D. Barreto J. et al . (2019). Revisiting the genetic diversity and population structure of the critically endangered leatherback turtles in the South-west Atlantic Ocean: Insights for species conservation. J. Mar. Biol. Assoc. United Kingdom99, 31–41. doi: 10.1017/S002531541700193X
60
Vilaça S. T. Piccinno R. Rota-Stabelli O. Gabrielli M. Benazzo A. Matschiner M. et al . (2021). Divergence and hybridization in sea turtles: Inferences from genome data show evidence of ancient gene flow between species. Mol. Ecol.30, 6178–6192. doi: 10.1111/mec.16113
61
Wallace B. Bandimere A. Abreu-Grobois F. Acosta H. Akiti J. Akomedi M. et al . (2025). Updated global conservation status and priorities for marine turtles. Endangered Species Res.56, 247–276. doi: 10.3354/esr01385
62
Wallace B. P. DiMatteo A. D. Bolten A. B. Chaloupka M. Y. Hutchinson B. J. Abreu-Grobois F. A. et al . (2011). Global conservation priorities for Marine turtles. PloS One6. doi: 10.1371/journal.pone.0024510
63
Wallace B. P. DiMatteo A. D. Hurley B. J. Finkbeiner E. M. Bolten A. B. Chaloupka M. Y. et al . (2010). Regional management units for marine turtles: A novel framework for prioritizing conservation and research across multiple scales. PloS One5, 1–11. doi: 10.1371/journal.pone.0015465
64
Wallace B. Posnik Z. Hurley B. DiMatteo A. Bandimere A. Rodriguez I. et al . (2023). Marine turtle regional management units 2.0: an updated framework for conservation and research of wide-ranging megafauna species. Endangered Species Res.52, 209–223. doi: 10.3354/esr01243
65
Witt M. J. Bonguno E. A. Broderick A. C. Coyne M. S. Formia A. Gibudi A. et al . (2011). Tracking leatherback turtles from the world’s largest rookery: Assessing threats across the South Atlantic. Proc. R. Soc. B: Biol. Sci.278, 2338–2347. doi: 10.1098/rspb.2010.2467
66
Wongfu C. Prasitwiset W. Poommouang A. Buddhachat K. Brown J. L. Chomdej S. et al . (2022). Genetic Diversity in Leatherback Turtles (Dermochelys coriacea) along the Andaman Sea of Thailand. Diversity14, 76. doi: 10.3390/d14090764
Summary
Keywords
genetic diversity, population structure, haplotype, conservation, mtDNA
Citation
As-singkily M, Dutton PH, van Hoof V, Zai M, Murniadi, Nijland R and Becking LE (2025) Connectivity among leatherback turtle populations in the Indian Ocean and West Pacific: a new management unit proposed in Sumatra, Indonesia. Front. Mar. Sci. 12:1699375. doi: 10.3389/fmars.2025.1699375
Received
04 September 2025
Revised
11 November 2025
Accepted
12 November 2025
Published
26 November 2025
Volume
12 - 2025
Edited by
Xuelei Zhang, Ministry of Natural Resources, China
Reviewed by
Sandra Ludwig, Federal University of Paraná, Brazil
Nicolas James Pilcher, Marine Research Foundation, Malaysia
Ajit Kumar, Government of Uttar Pradesh, India
Updates
Copyright
© 2025 As-singkily, Dutton, van Hoof, Zai, Murniadi, Nijland and Becking.
This is an open-access article distributed under the terms of the Creative Commons Attribution License (CC BY). The use, distribution or reproduction in other forums is permitted, provided the original author(s) and the copyright owner(s) are credited and that the original publication in this journal is cited, in accordance with accepted academic practice. No use, distribution or reproduction is permitted which does not comply with these terms.
*Correspondence: Maslim As-singkily, maslim.singkil@gmail.com; maslim.maslim@wur.nl; Leontine E. Becking, lisa.becking@naturalis.nl
Disclaimer
All claims expressed in this article are solely those of the authors and do not necessarily represent those of their affiliated organizations, or those of the publisher, the editors and the reviewers. Any product that may be evaluated in this article or claim that may be made by its manufacturer is not guaranteed or endorsed by the publisher.