Abstract
Introduction:
In this study we investigate the Suspended Particulate Matter (SPM) source and dynamics in terms of resuspension and advection in the mid field region of Rhine Region Of Freshwater Influence (Rhine-ROFI). In this area of the Rhine-ROFI, the sediment transport mechanisms are governed by the Rhine freshwater plume originating from the Rhine-Meuse estuary and propagating towards the coast in northward direction.
Methods:
The SPM near the bottom at a mooring located at 12m of water depth is analyzed in terms of concentration, particle size and shape in correlation with frontal dynamics and weather conditions for two seasons of winter 2013 (12 February - 07 March) and autumn 2014 (17 September - 06 October).
Results and discussion:
The freshwater front transports organic matter (such as microalgae strains and other organic matter) from the estuary into the coastal area. In calm weather conditions in autumn, most particles in suspension are of low density and high anisotropy. These particles are recognized as elongated algae strains with some organic matter-clay aggregates (flocs), giving trimodal Particle Size Distributions (PSD). During the neap tides strong salinity stratification and low turbulence result in SPM accumulation at the bed forming a fluff layer. At spring tides a fast switch between stratified and well mixed water column conditions caused by tidal mixing results in resuspension of SPM. During spring tides, the PSD’s are multimodal at low bed stress (predominance of microalgae) and monomodal at high bed stress (predominance of mineral sediment). At the storm initiation in autumn, the organic-matter rich fluff layer is depleted in a matter of hours, which is reflected in the change in modality of the PSD’s. Once the resuspended material is dominated by the mineral clay fraction, the PSD turns sharply monomodal. During winter monomodal PSD’s are recorded during calm weather conditions. The particles in suspension are then relatively spherical flocs of low density. During the winter storm, the fluff layer, which is much thinner than in autumn, is depleted very fast. This study shows the importance of organic matter in the transport of mineral sediment particles in coastal areas. The dynamic composition of the fluff layer of the bed should be accounted for in erosion models.
1 Introduction
The mid-field part of the Rhine Region Of Freshwater Influence (Rhine-ROFI region) is a shallow coastal region located 10 km north of the Rhine River mouth along the Dutch coast. The interaction between tidal asymmetry, gravitational circulation, and river freshwater discharge makes the hydrodynamics in this part of Rhine-ROFI quite complicated. The impact of salinity stratification and frontal dynamics on the sediment fluxes along the Dutch coastal area of Rhine-ROFI have been studied within two projects (STRAINS I and II) (Rijnsburger et al., 2018; Horner-Devine et al., 2017; Flores et al., 2017). Moorings were deployed at 12m and 18m depth in late winter on 12 February to 7 March of 2013 (STRAINS I) and in autumn, 17 September to 10 October, of 2014 (STRAINS II). Both measurement campaigns covered spring-neap tidal cycles and a stormy period was captured at each season during the neap tides. During STRAINS II an 11 hour boat survey (6:00 - 17:00 GMT) was performed on the 17th of September 2014 close to the 12m mooring.
Different cross-shore sediment transport mechanisms were identified: frontal pumping during spring tides, stratified tidal transport during neap tides and storm transport during the stormy weather conditions (Flores et al., 2017; Horner-Devine et al., 2017). In the present article, the Particle Size Distributions (PSD’s) recorded at the 12m mooring in 2013 and 2014 will be analyzed, making use of the results presented in a previous article, where the composition of the suspended particles was studied (Safar et al., 2022).
The particles found in the Rhine-ROFI are made of particles from organic origin aggregated with different amount of mineral sediment (Safar et al., 2022). The composition of these aggregates (flocs) is spatially and temporally variable and their settling velocity is orders of magnitude different from the settling velocity of the mineral particles embedded in their structure. Sediment dynamics can therefore strongly be influenced by sediment composition.
The composition of a floc and flocculation kinetics are determined by the availability of organic and inorganic matter, salinity and shear stresses. Their effects have recently been studied under controlled laboratory experiments in (Safar et al., 2023; Deng et al., 2019). It was found that microalgae (skeletonema costatum, an algae species commonly found in coastal areas) and extracellular polymeric substances aggregate with clay particles and it was confirmed that salt ions plays a crucial role in flocculation kinetics. Consequently the freshwater lens, that cause stratification in the Rhine-ROFI, is important in SPM formation and dynamics in the Dutch coastal area.
The fresh water transports particulate matter, such as organic debris and planktonic species into the estuary (Schofield et al., 2013; De Ruyter van Steveninck et al., 1992; Cross et al., 2015; Fettweis et al., 2025). Studies on phytoplankton have shown their concentration fluctuating with tidal currents and spring-neap tidal cycles in the Dutch coastal area and southern North sea (Blauw, 2015; Fettweis et al., 2007). Suspended organic particles can be advected by the freshwater front along the coast (Naudin et al., 1997; Ren and Wu, 2014; Yao et al., 2016; Lee et al., 2016; Tao et al., 2018). The Rhine river plume in particular transports phytoplanktonic species such as microalgae and related organic matter as far as 100 km along the dutch coast (Schofield et al., 2013; De Ruyter van Steveninck et al., 1992; Cross et al., 2015; van der Hout et al., 2015; van de Meent, 1982; Joordens et al., 2001).
Jago et al. found different concentrations and particle sizes in the surface and bottom layer of a thermally stratified water column (Jago and Jones, 1998). The possibility of accumulation of particles at different density water layers was also experimentally confirmed by other authors (Kindler et al., 2010; Sutherland et al., 2015). The trapped particles can aggregate at these layers especially during slack water (Naudin et al., 1997; Lee et al., 2016). In the Rhine-ROFI, organic matter and bound sediment can be temporary trapped in the halocline, at the interface between fresh and saline water due to their low density. De Nijs et al. have found that high concentrations of (inorganic) sediment settled and deposited at Botlek harbour at the mouth of Rotterdam Waterway, at the tip of the salt intrusion wedge. The wedge is associated with the presence of Estuarine Turbidity Maximum zone (ETM) of the Rhine-Meus delta (Nijs et al., 2011). The cross-shore transport mechanism caused by the Rhine-ROFI appears also to contribute to the presence of the turbidity maximum in the area (van der Hout et al., 2015; Flores et al., 2020).
Organic matter, creating a “fluff layer” on the bed largely influences the erodibility of the sediment top layer (Gu et al., 2020; Forsberg et al., 2018; Lund-Hansen et al., 2002). Very different thresholds for erosion can be found in literature, depending on the type of fluff layer present on the bed. The fluff layer can be resuspended by very low energetic mixing as discussed by Tolhurst (Tolhurst et al., 2009). However, the fluff layer erosion threshold also depends on the compaction degree of this layer which in turn depends on the effective density of the particles and the relative amounts of clay, silt and sand within this layer (Xu, 2019; Ganaoui et al., 2007). It was found by Lund-Hansen et al. that beds with a fluff layer of higher water and organic matter content exhibit a larger threshold for erosion (Lund-Hansen et al., 2002). This shows that cohesive forces cannot be related to water content (a higher water content is not indicative of a lower erosion threshold), but rather to the “stickiness” of the fluff material, related to organic matter properties.
The properties of the fluff bed change over time. Gu et al. studied the effects of incubation on the properties of the biofilms developed on sediment beds (Gu et al., 2020). They found than the threshold for erosion increased with incubation time until 50 days and decreased thereafter. The properties of the fluff layer are therefore extremely dynamic, depending on the biofilm development and the type and amount of fresh material settling down, mixing with the growing biofilm. The presence of phytoplanktonic species and biogenic organic matter in the water column, which are changing on seasonal basis, have therefore also a large impact on bed erosion as settled flocs are incorporated in the fluff layer (Al Ani et al., 1991; Manning et al., 2007; Joordens et al., 2001; Mikkelsen et al., 2007; Chang et al., 2006).
At present, sediment transport and erosion models are primarily calibrated for the inorganic sediment fraction. Understanding the role of organic matter on the SPM dynamics and accumulation on the bed in time and in different seasons is hence required for adequate modeling.
In the present study SPM particle dynamics are analyzed based on in situ data acquired over periods of several weeks at two different seasons. The mean particle size behaviour as function of bed stress is discussed as function of SPM composition. SPM composition is derived from the recorded PSD’s and in-situ images.
2 Set-up and methods
2.1 Monitoring campaigns
The data of the 12m mooring is studied in the present article and its position is indicated in Figure 1 by a red square. It is located at 1.5 km from the shoreline and seaward of the Sand Engine. The Sand Engine is a large (21.5 million m3) sand nourishment located 10 km north of the Rhine River mouth. It was built to protect the beaches and dunes along the Dutch coast from erosion (Stive et al., 2013). During STRAINS II an 11 hour boat survey (6:00 - 17:00 GMT) was performed on the 17th of September 2014 close to the 12m mooring. The results of this survey were reported in an previous article (Safar et al., 2022) and will be used here in the discussions.
Figure 1
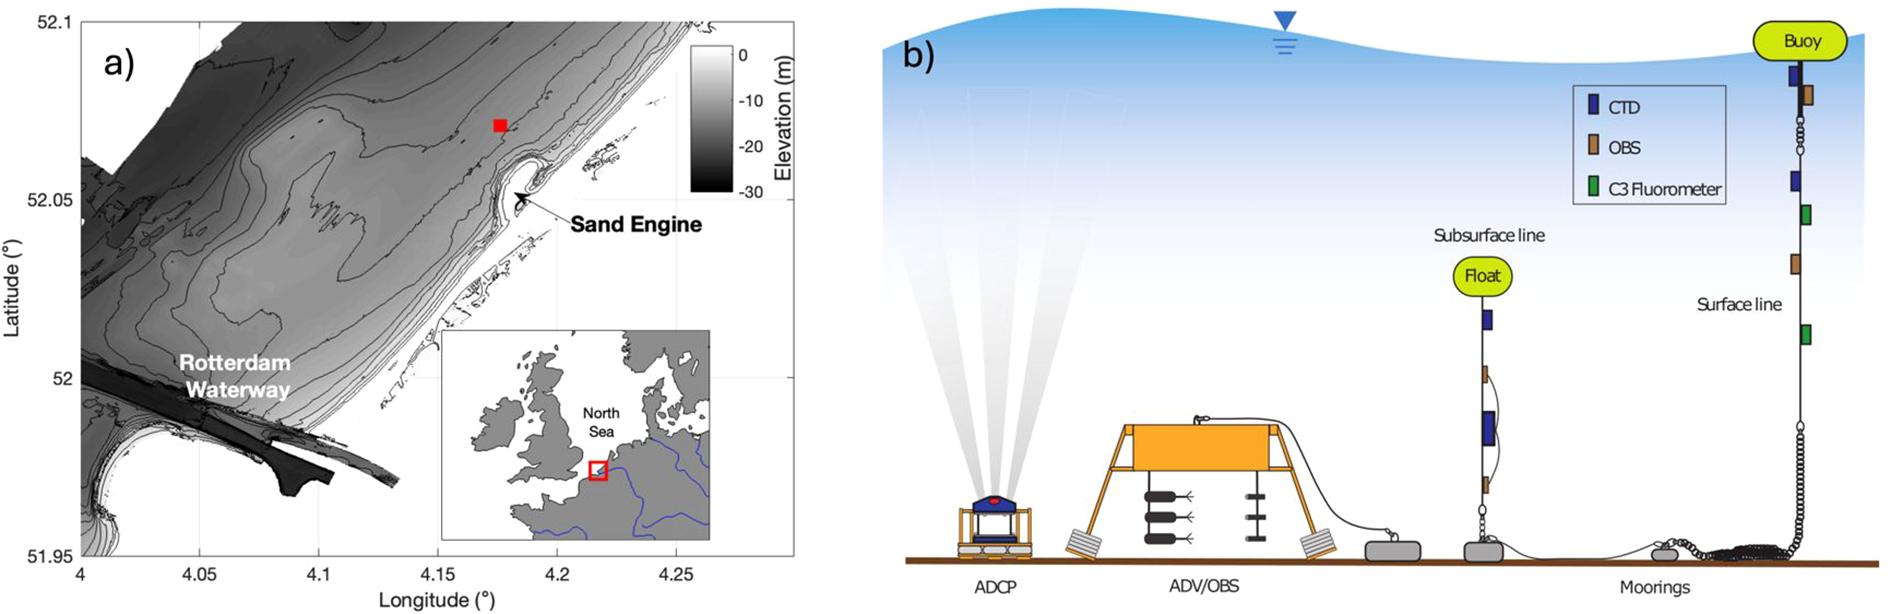
Study area and moorings. (a) Dutch coastal area with the mooring indicated as a red square. (b) the instruments at the mooring.
The wind speed and directions, the significant wave heights and river discharge were obtained by the Dutch weather organizations KNMI and Rijkswaterstaat at Hoek van Holland (close to the Rhine-mouth).
The vertical velocity structure was measured with a bottom mounted ADCP (Acoustic Doppler Current Profiler, 1200 kHz RDI Workhorse). The raw ADCP velocity data were averaged into 10 minute blocks and contain of vertical bins of 0.25 m, where the first bin is located at approximately 1.5 mab. The near bed velocity structure was measured using three synchronized ADV (Acoustic Doppler Velocimetry) instruments mounted at 0.25, 0.50 and 0.75 mab on the same frame as the LISST (Laser In-Situ Scattering and Transmissometry) and OBS (optical backscatter). These instruments measure at a frequency of 16 Hz. The raw data has been averaged per burst of 10 minutes every 15 minutes. The N-E components of both velocity instruments were rotated into along- and cross-shore directions, with an angle of 42.5 degrees from the North. The bed stresses were estimated from the ADV velocities and account for both current and wave action (Flores et al., 2017, 2018; Horner-Devine et al., 2017; Rijnsburger et al., 2018). The plotted crosshore velocities are given as positive when they are onshore directed.
The water column salinity profiles were measured by CTD (Conductivity-Temperature-Depth). The salinity difference ΔS is defined as the difference between the bottom and surface salinities in PSU (Practical Salinity Units). The ΔS is taken as a measure for degree of stratification.
The SSC (Suspended Sediment Concentration) obtained from the OBS instruments has been calibrated using inorganic sediment particles (Formazine solution added prior the measurements). The conversion is done based on bottle samples collected at Port of Rotterdam (Flores et al., 2017)).
2.2 Particle size distribution measurements
LISST 100X (Laser In-Situ Scattering and Transmissometry) was deployed in both 2013 and 2014 moorings at 0.95 meters above the bed (mab) and 1.65 mab respectively. LISST 100X uses laser diffraction to determine the volume concentrations of particles in 32 logarithmic spaced effective spherical diameter classes (PSD) ranging for the 100X type from 2.7 to 460 µm (Agrawal and Traykovski, 2001). The mean particle diameter is calculated by Equation 1:
where Vk and Dk represent the volumes and the sizes of each class k.
LISST-HOLO (Submersible Digital Holographic Camera) was also deployed at the 2014 mooring at 1.4 mab. LISST-HOLO is an in-situ digital holographic technology that uses solid-state diode laser at 658 nm and 4.4 µm pixel size digital camera (1600 × 1200 pixels). The raw data is converted into equivalent spherical diameters in the size range of 25 - 2500 µm, within 50 log spaced size classes.
The LISST-HOLO data is available for the first period of the measurement (neap tide calm weather). As the storm initiated, the LISST-HOLO stopped working due to bio-fouling.
3 Results and data analysis
3.1 Autumn 2014, neap tide
3.1.1 Calm weather conditions
The first recorded neap tide (days 260 - 267) starts with a period of calm weather conditions (days 260–264 weather data are shown in Supplementary Material, Appendix A). During these days, the salinity stratification is strong, caused by front arrivals at the surface that divide the water column into layers of fresh and saline water. The front arrivals are indicated by dashed lines in Figure 2.
Figure 2
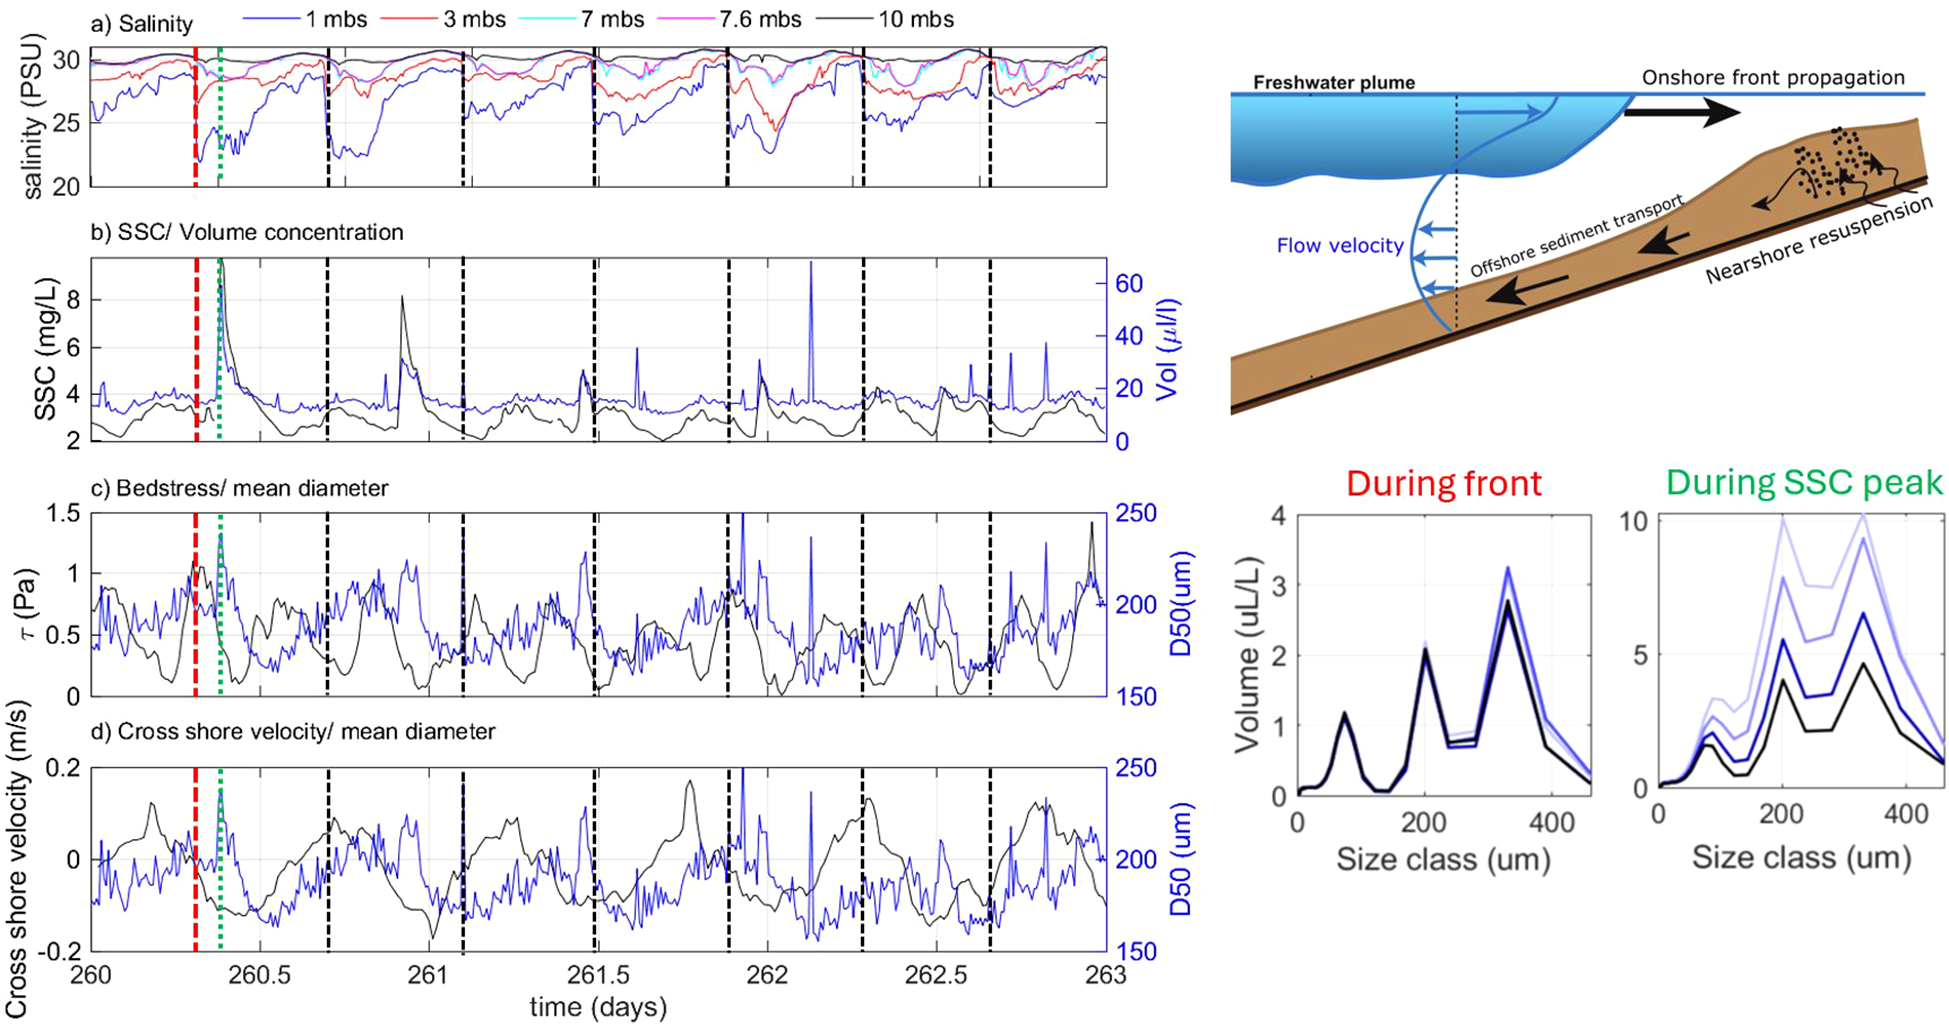
First recorded neap tide of autumn 2014. The red and black dashed lines indicate the period during which the freshwater front passes the mooring and the green dotted line indicates the period of a SSC peak. The PSD’s displayed on the right are representative for the whole period.
The SSC concentrations measured with OBS and volume concentration measured by LISST 100X over the whole period are very low. The SSC peaks observed occasionally are not significant in terms of quantitative sediment concentration and are much lower in concentration than the SSC peaks found during the following periods of stormy weather or spring tide (Flores et al., 2017). It should be noted that OBS cannot properly record the organic matter or the algae species which are semi-transparent and have low densities, as the equipment calibration is done with inorganic sediment particles having a high density contrast.
The observed PSDs are multimodal during these calm weather days of the neap tide. Two examples of PSD’s are given in Figure 2. The PSD’s over the whole period are similar. These trimodal distributions are known to be caused by the presence of elongated particles such as microalgae strains (Safar et al., 2023). The presence of elongated algae strains is also confirmed by the LISST-HOLO measurements. Before the front arrival (Figure 3a), the LISST-HOLO pictures show much less biological species and elongated particles than during the front. This occurred for the three consecutive days. During the high SSC peaks, however, the LISST-HOLO shows particles with different sizes and structures indicating different composition, such as open structures with low effective density, elongated particles and very dense almost spherical particles (Figure 3c). The density of the particles was estimated thanks to additional video microscopy experiments performed on board, as detailed in (Safar et al., 2023).
Figure 3
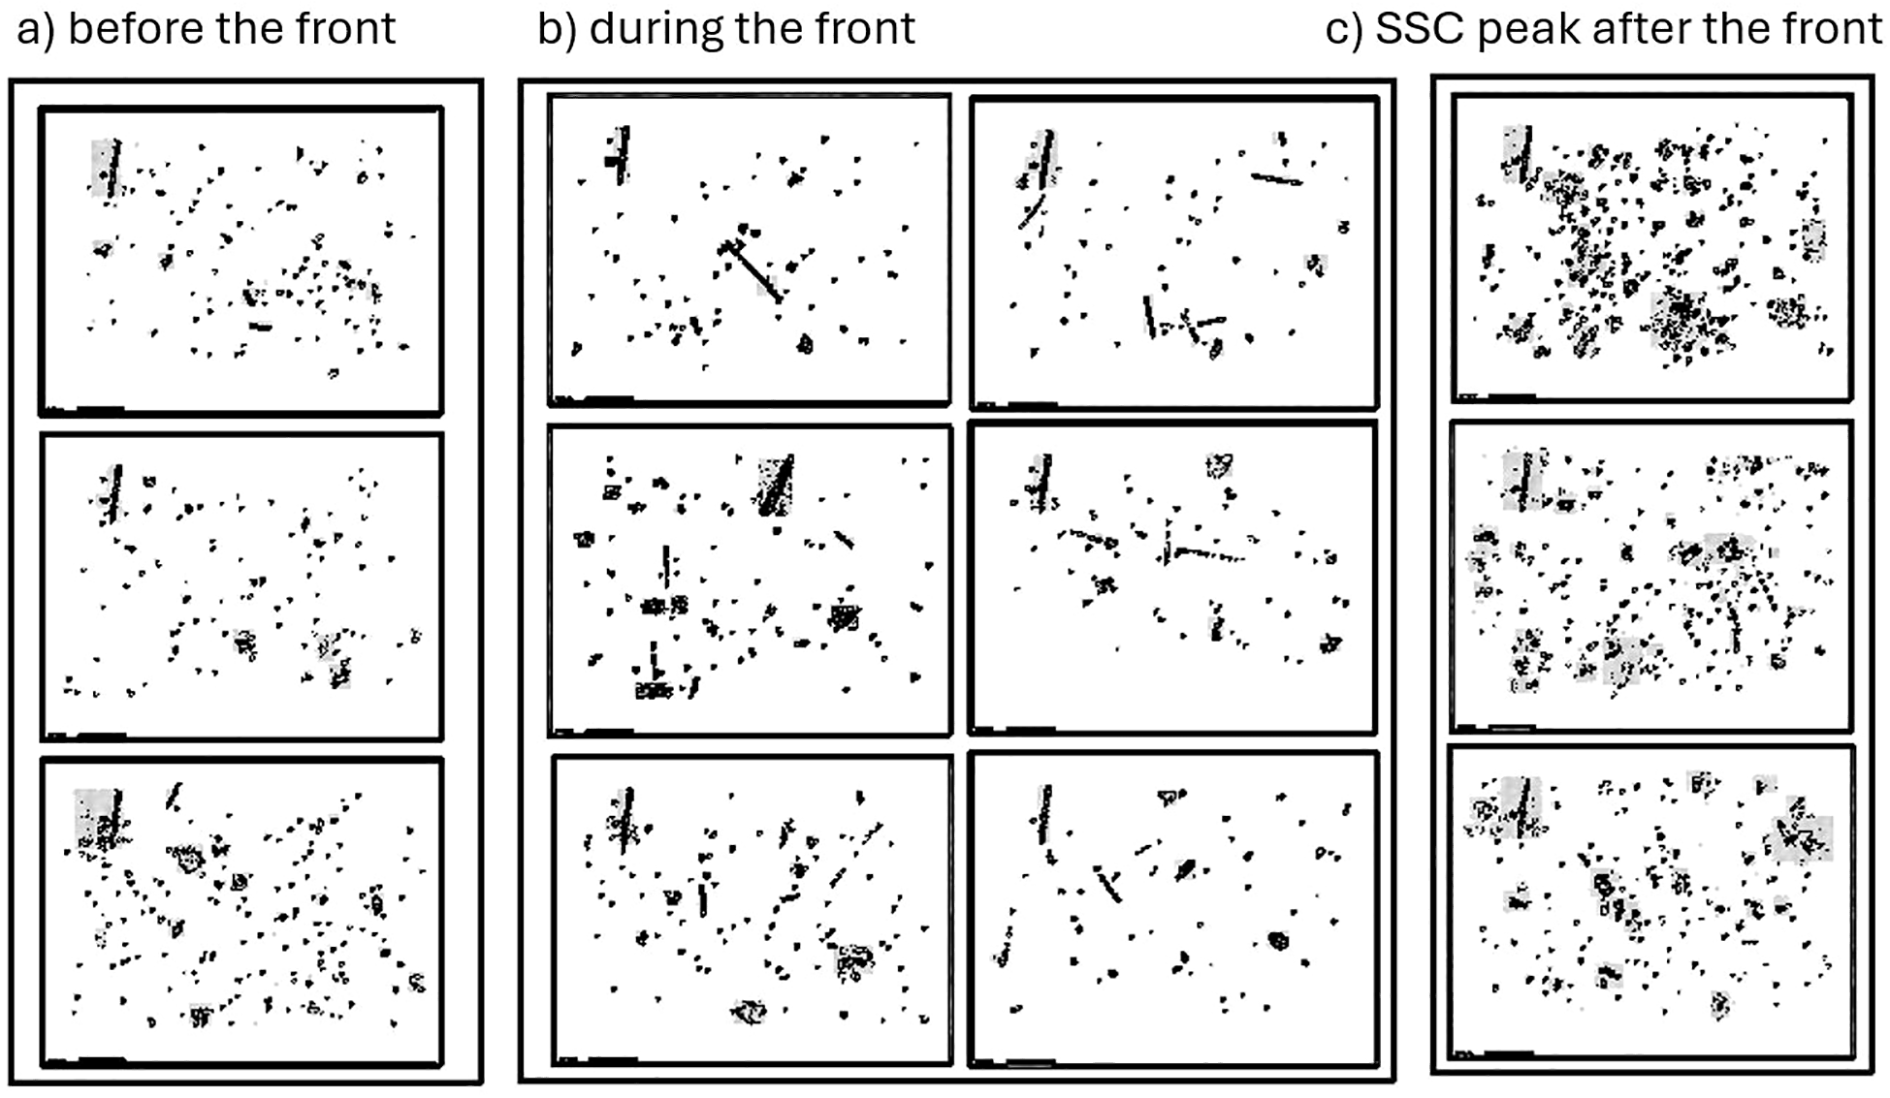
LISST-HOLO pictures during the calm weather period of the first recorded neap tide, corresponding to the dashed red line in 2: (a) before the front, (b) during the frontal passage and (c) during high SSC peak after the front.
3.1.2 From calm weather to storm
After these typical neap tide days, the weather conditions changed to storm (days 264 -266) with high wind speeds from the north and high wave heights (see Appendix D). The water column turned to well mixed, resulting in zero salinity stratification (Figure 4).
Figure 4
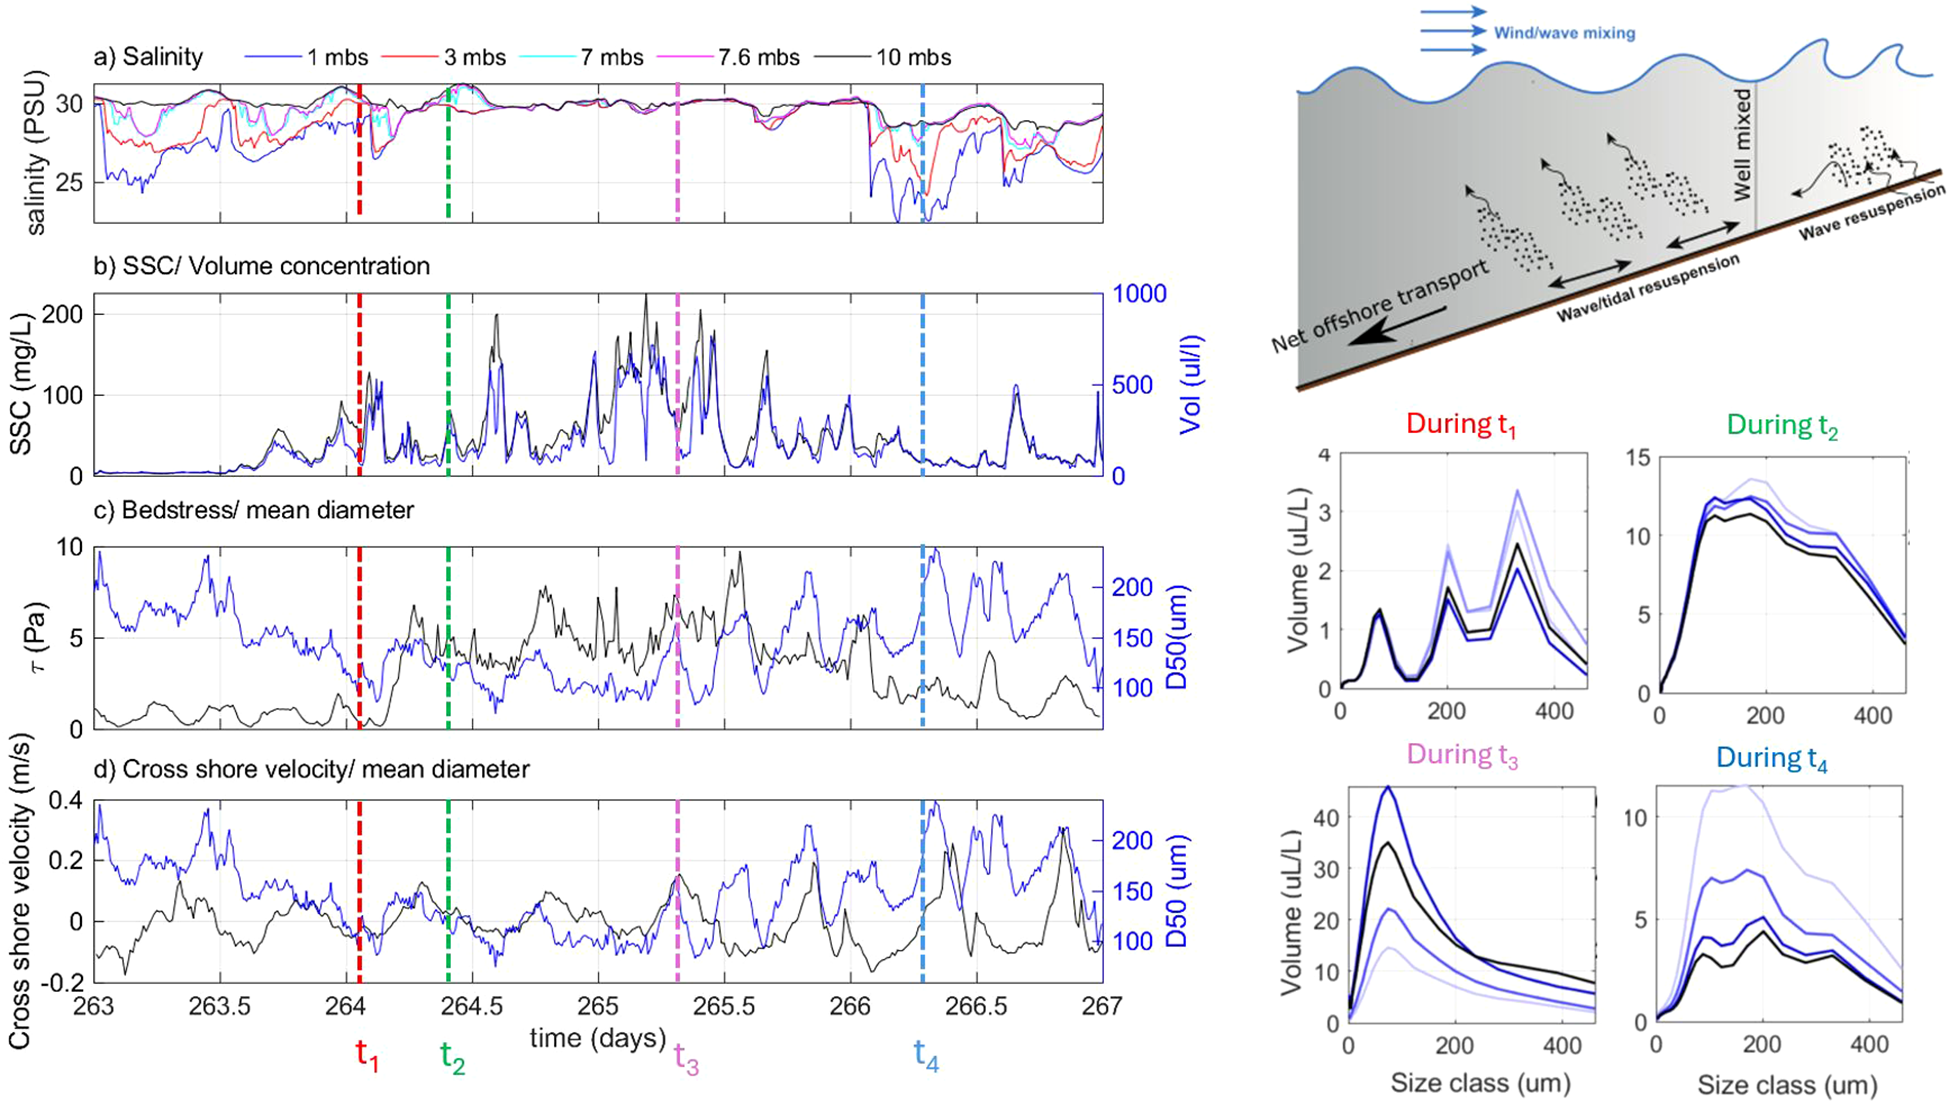
First recorded neap tide of autumn 2014 with storm weather conditions. The PSD’s measured at periods t1 − t4 are displayed on the right.
The total bed stress (current and wave induced) increased due to wave action. The increase in bed stress co-incided with a decrease in the mean diameter, as seen from the change in mean particle size before and after t1 in Figure 4. The PSD measured before the storm initiates is still sharply multimodal. A gradual transition from multimodal to monomodal is found as the storm progresses and the multimodality reappears after the storm (see PSD at t4). In Figure 5, the change in PSD modality at the onset of the storm is illustrated with LISST-HOLO images. When the storm initiates at around 06:00 am, the LISST-HOLO shows substantially higher concentration of particles of different size and shapes. The particle volume concentration is still not very high and bed stresses are about 2 Pa.
Figure 5
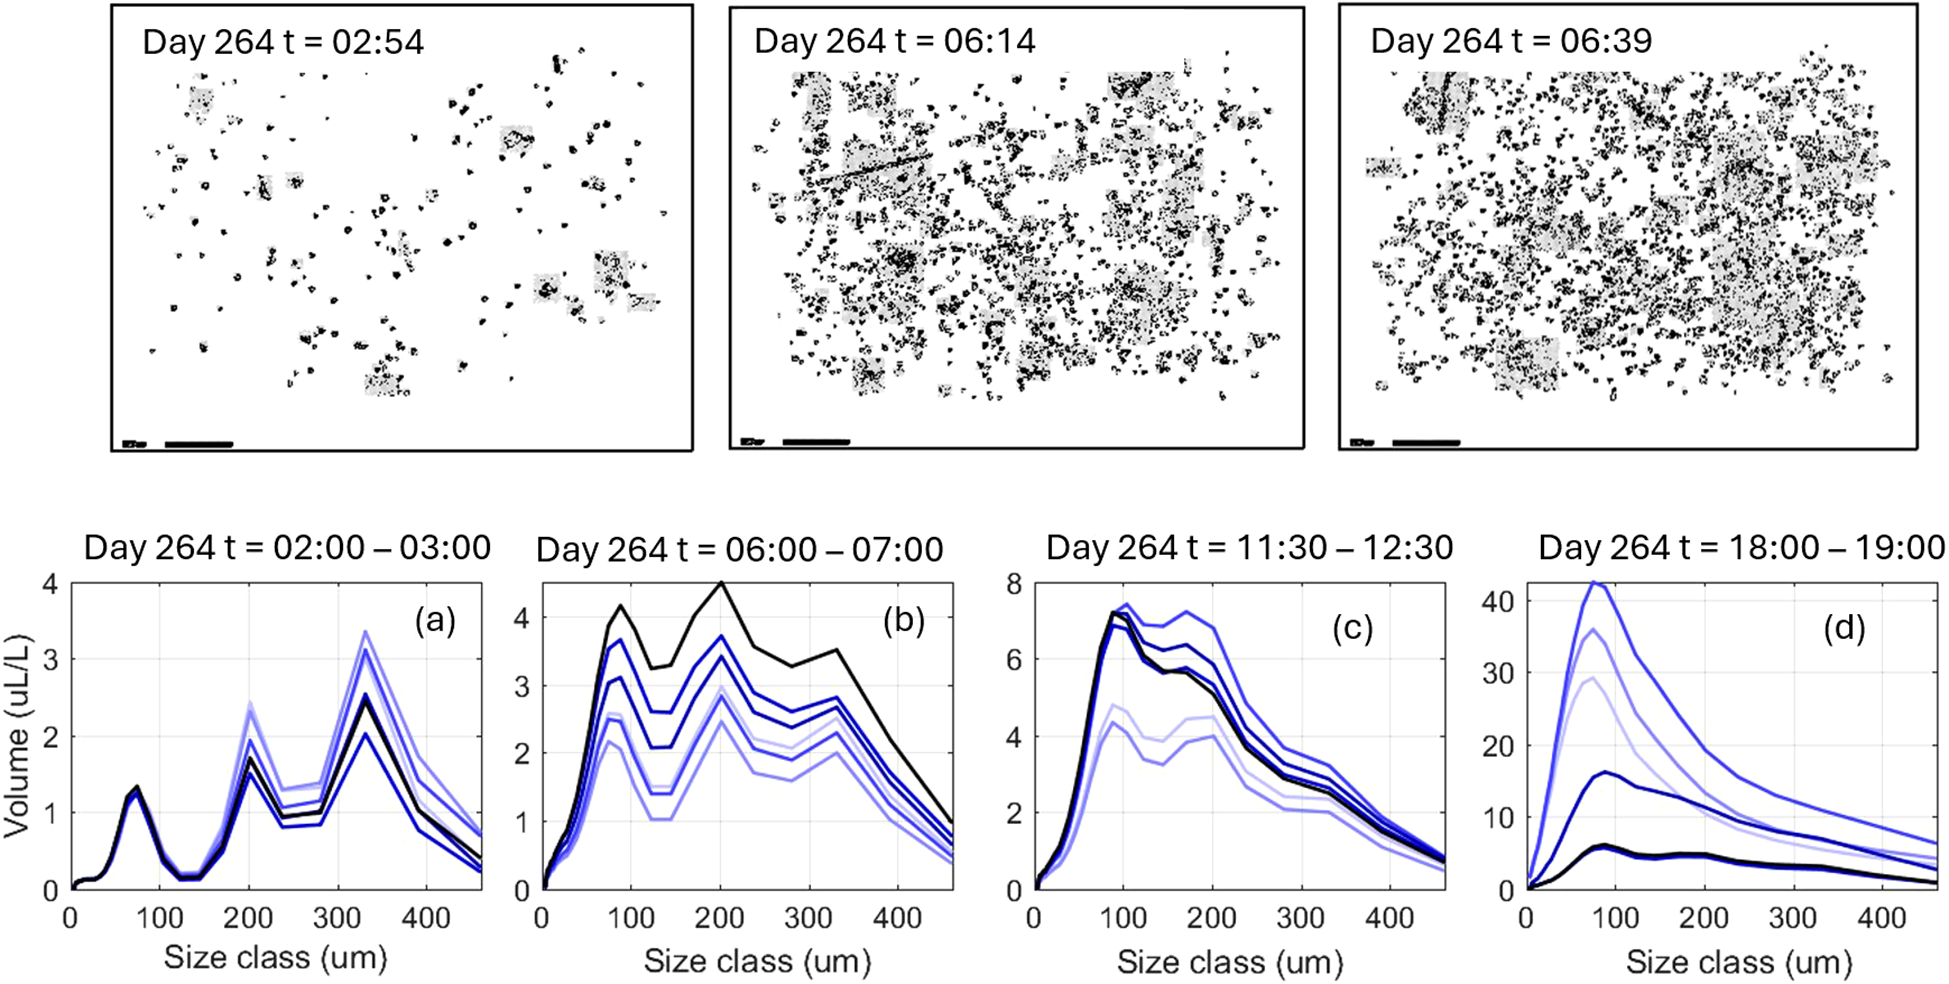
First storm day of autumn 2014 neap tide: storm initiation and proceeding. Top row: pictures obtained from LISST- HOLO; bottom row: PSD obtained from LISST 100X: (a) stratified water during frontal passage (b) storm initiation (c) and (d) storm proceeding.
As the storm proceeds and the bed stress increases gradually, the multimodality of the PSD decreases and the volume concentration increases, until the PSD turns into completely monomodal at bed stresses > 5 Pa. There are no LISST-HOLO measurements for this time period, because of the high SSC during the storm, that caused instrument saturation.
The second neap tide of the measurement period (days 274 - 280, data shown in Appendix A and B), is comparable with the first one in terms of weather conditions and salinity stratification. The near bottom sediment concentrations are low during the fronts and relatively low bed shear stresses coincide with a high mean diameter, indicative of large particles of low density. From day 278 until the end of this period slightly higher wind and wave activities and a weaker stratification pattern were observed. These conditions resulted in higher bed stresses and higher SSC with lower mean diameter, indicative of finer, but denser particles.
The observed PSDs are mainly trimodal as they were during the first neap tide. However, there are sometimes bimodal PSDs observed especially during the sudden decrease in salinity at the front arrival. The bimodal distributions turn to trimodal as the water column stratifies again. As the well mixed periods of the water column are very short before the stratification period at the next front, the PSD is barely changing to monomodal. Monomodal distributions are observed at day 278, which is a windy day with a wind speed of almost 15 m/s.
3.2 Autumn 2014, spring tide
During days 267–270 of the spring tide, some wave activity is recorded while winds favor downwelling and force the freshwater front towards the coast (Flores et al., 2017). The water column switches between stratified and well mixed conditions, with shorter periods of stratification by tidal forcing, see Figure 6. During that period, OBS and LISST concentrations are in agreement, indicating that a substantial amount of mineral clay is in suspension. Low bed stress corresponds to multimodal PSD (indicative of the presence of microalgae strains, see (Safar et al., 2023)) and high mean particle size (period t1 and t4 in Figure 7). High bed stress (period t2 and t3 in Figure 7) corresponds to lower mean particle size and monomodal PSD (indicative of the presence of fine mineral sediment). Over the next period (days 270 - 274) the bed stresses reduce as well as the wave heights. The SSC measured by OBS becomes very low, whereas the concentration measured by LISST increases significantly after day 272. This increase is related to a large change in PSD modality (period t7 and t8, day 273) signaling the presence of large organic particles. At high or low SSC peak (period t5 and t6, day 271), the PSD remains relatively monomodal during the front passage (t6, low SSC) and the PSD peak becomes broader when the water column is stratified (t5, high SSC).
Figure 6
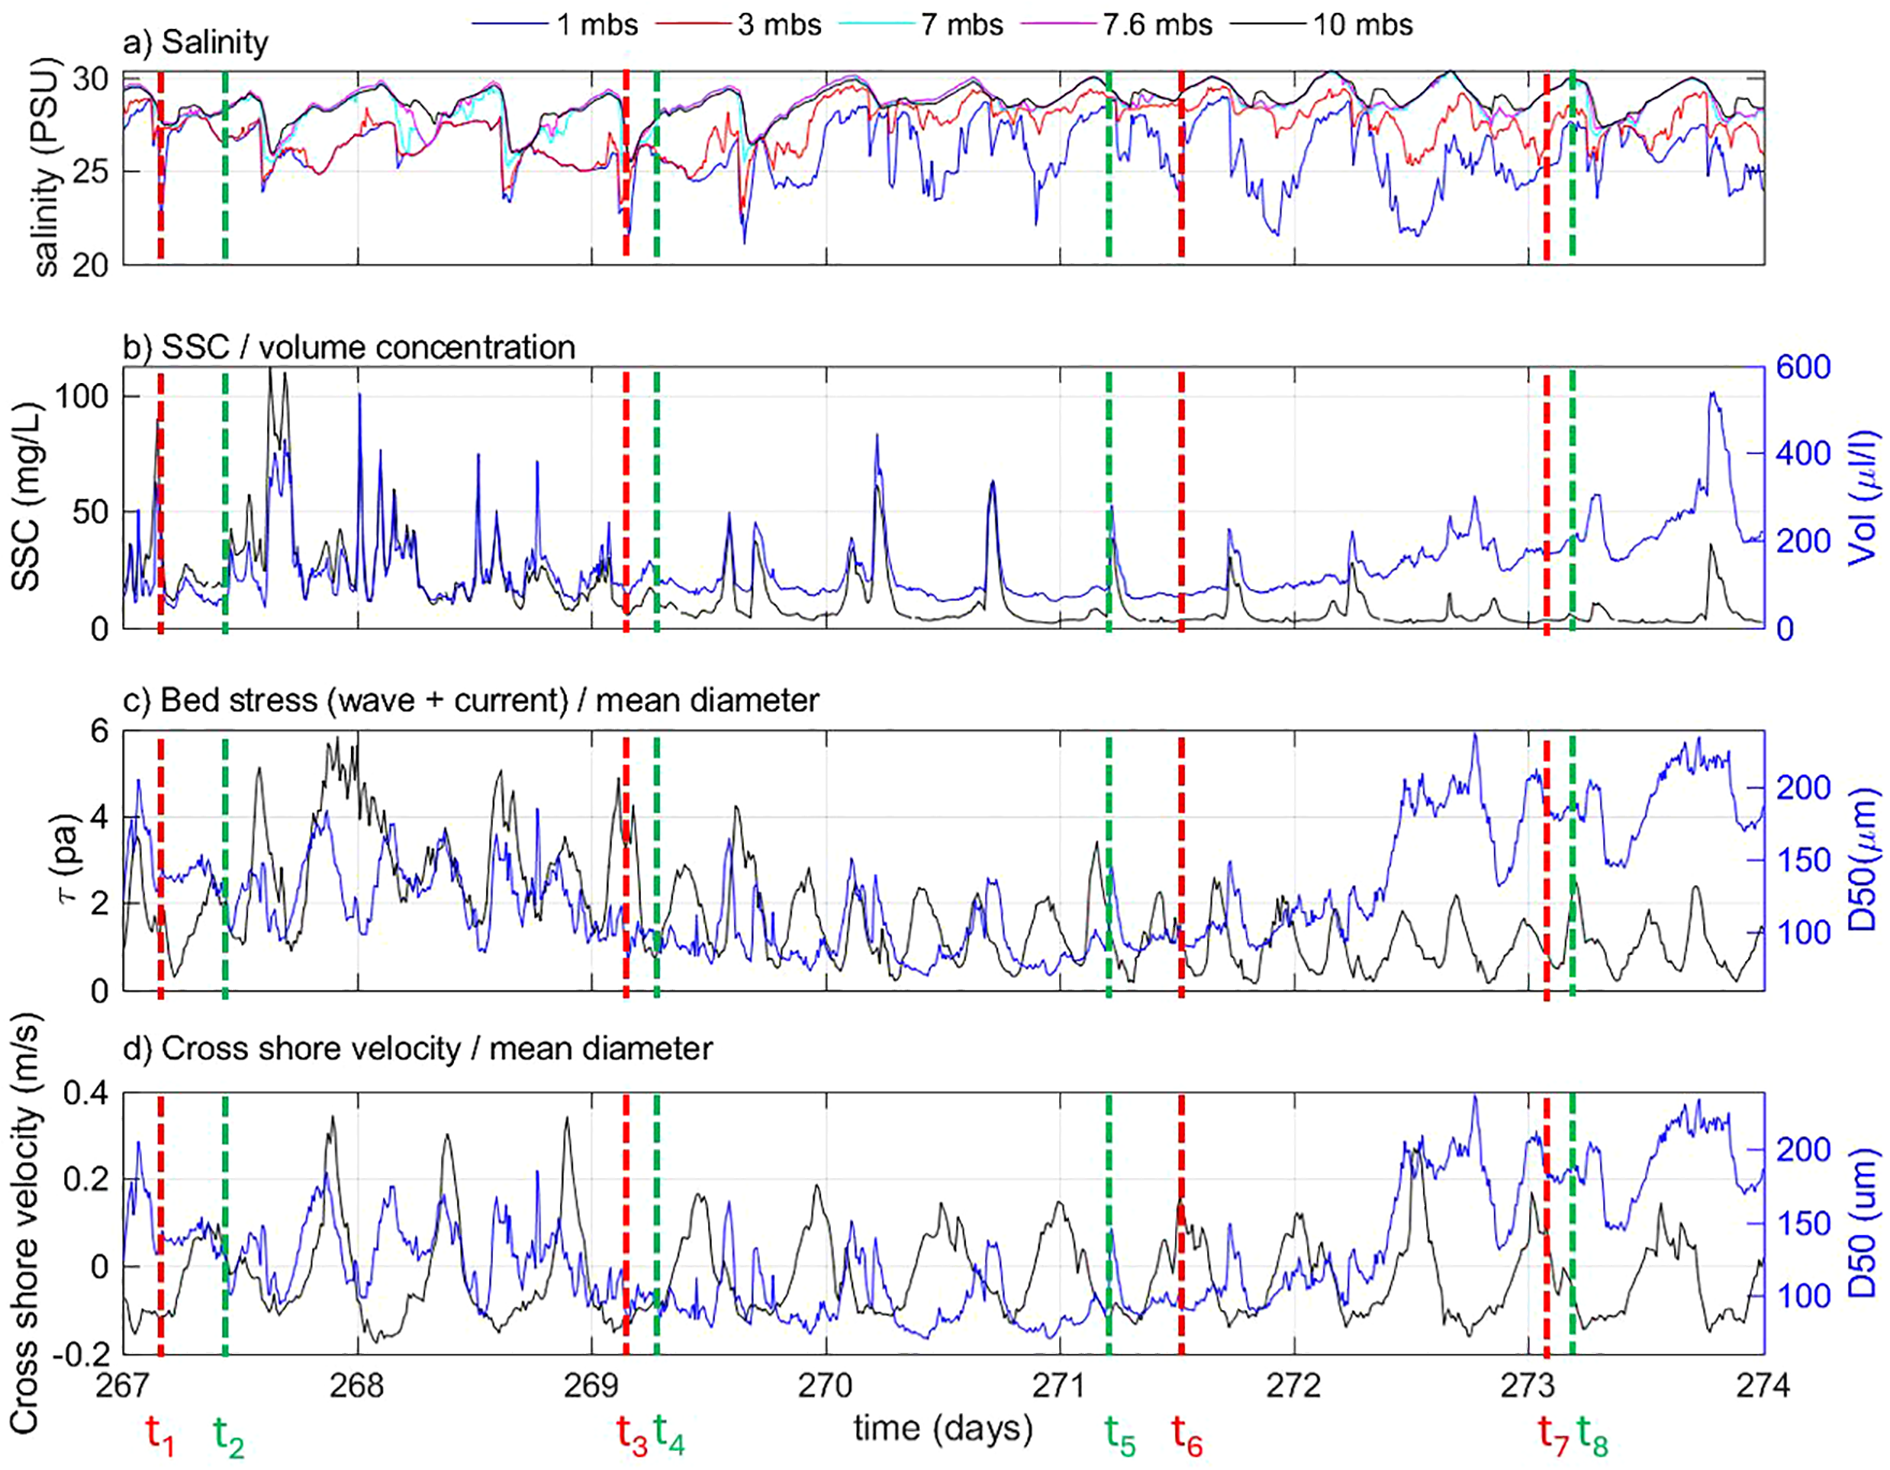
First recorded spring tide of autumn 2014. The PSD’s corresponding to the time periods t1 − t8 are given in Figure 7.
Figure 7
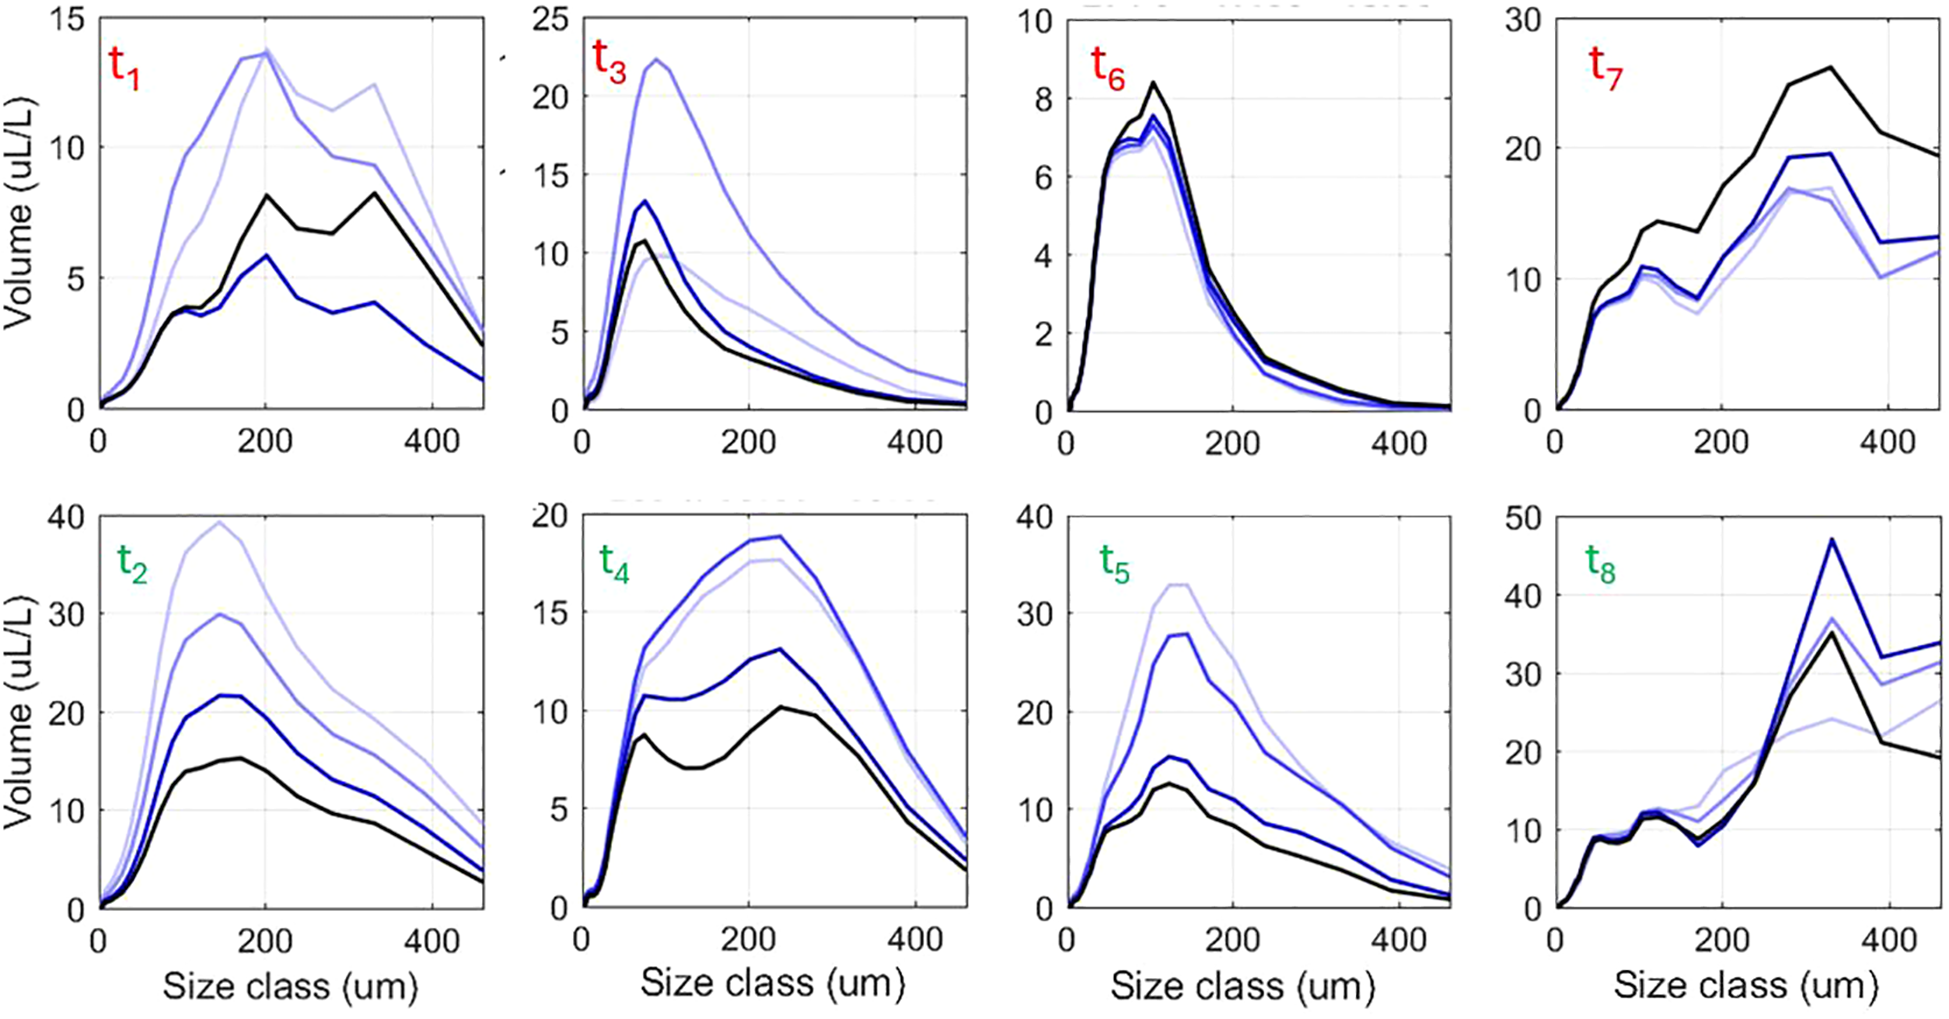
First recorded spring tide of autumn 2014. The PSD’s correspond to the time periods t1 − t8 given in Figure 6.
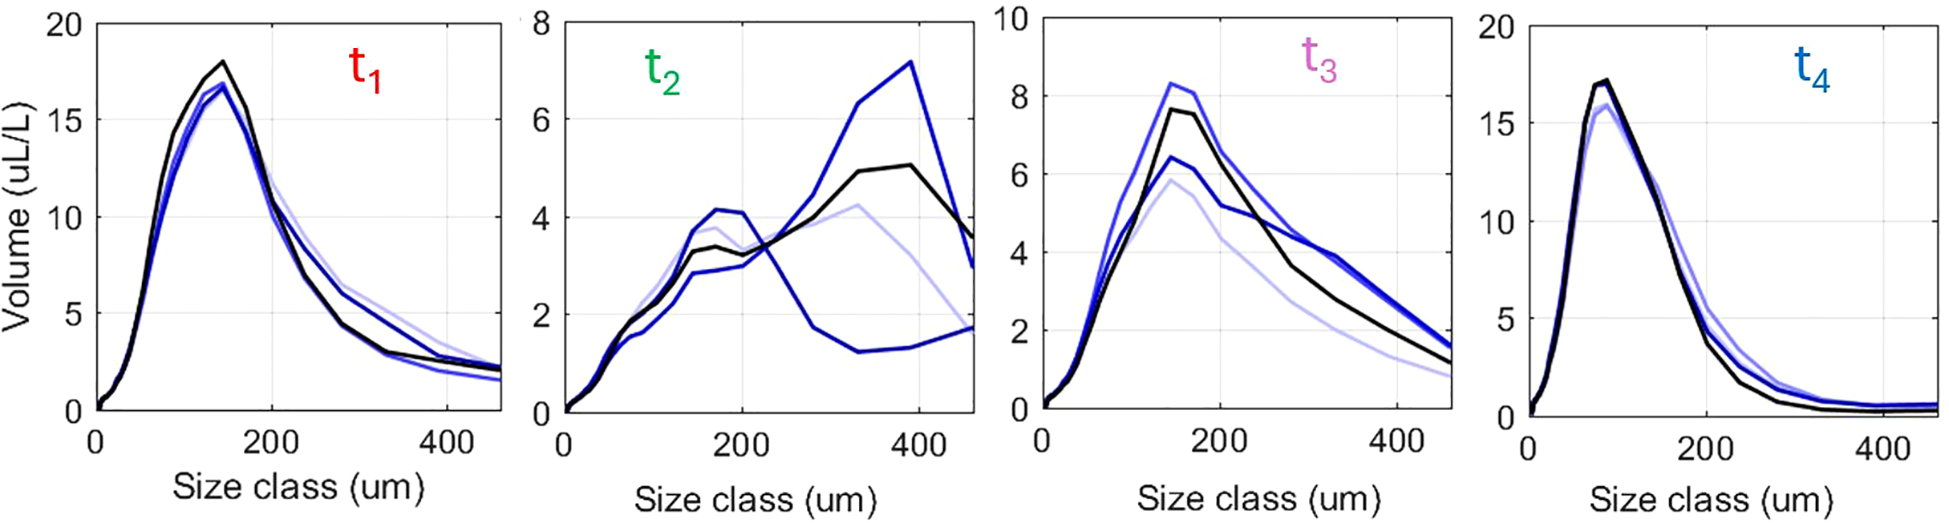
3.3 Winter 2013, spring tides
The weather conditions were normal during both spring tides in February and March 2013 (Appendix C). Wind speeds were generally moderate during the whole measurement period with some windy days in between, consistently from the northeast. These upwelling-favorable winds from northeast forced the freshwater front onshore, contributing to the plume mixing and breakdown of stratification during the first days (43-46), see Figures 8, 9. During these first days the PSD exhibits slight multimodality (period t1 and t2).
Figure 8
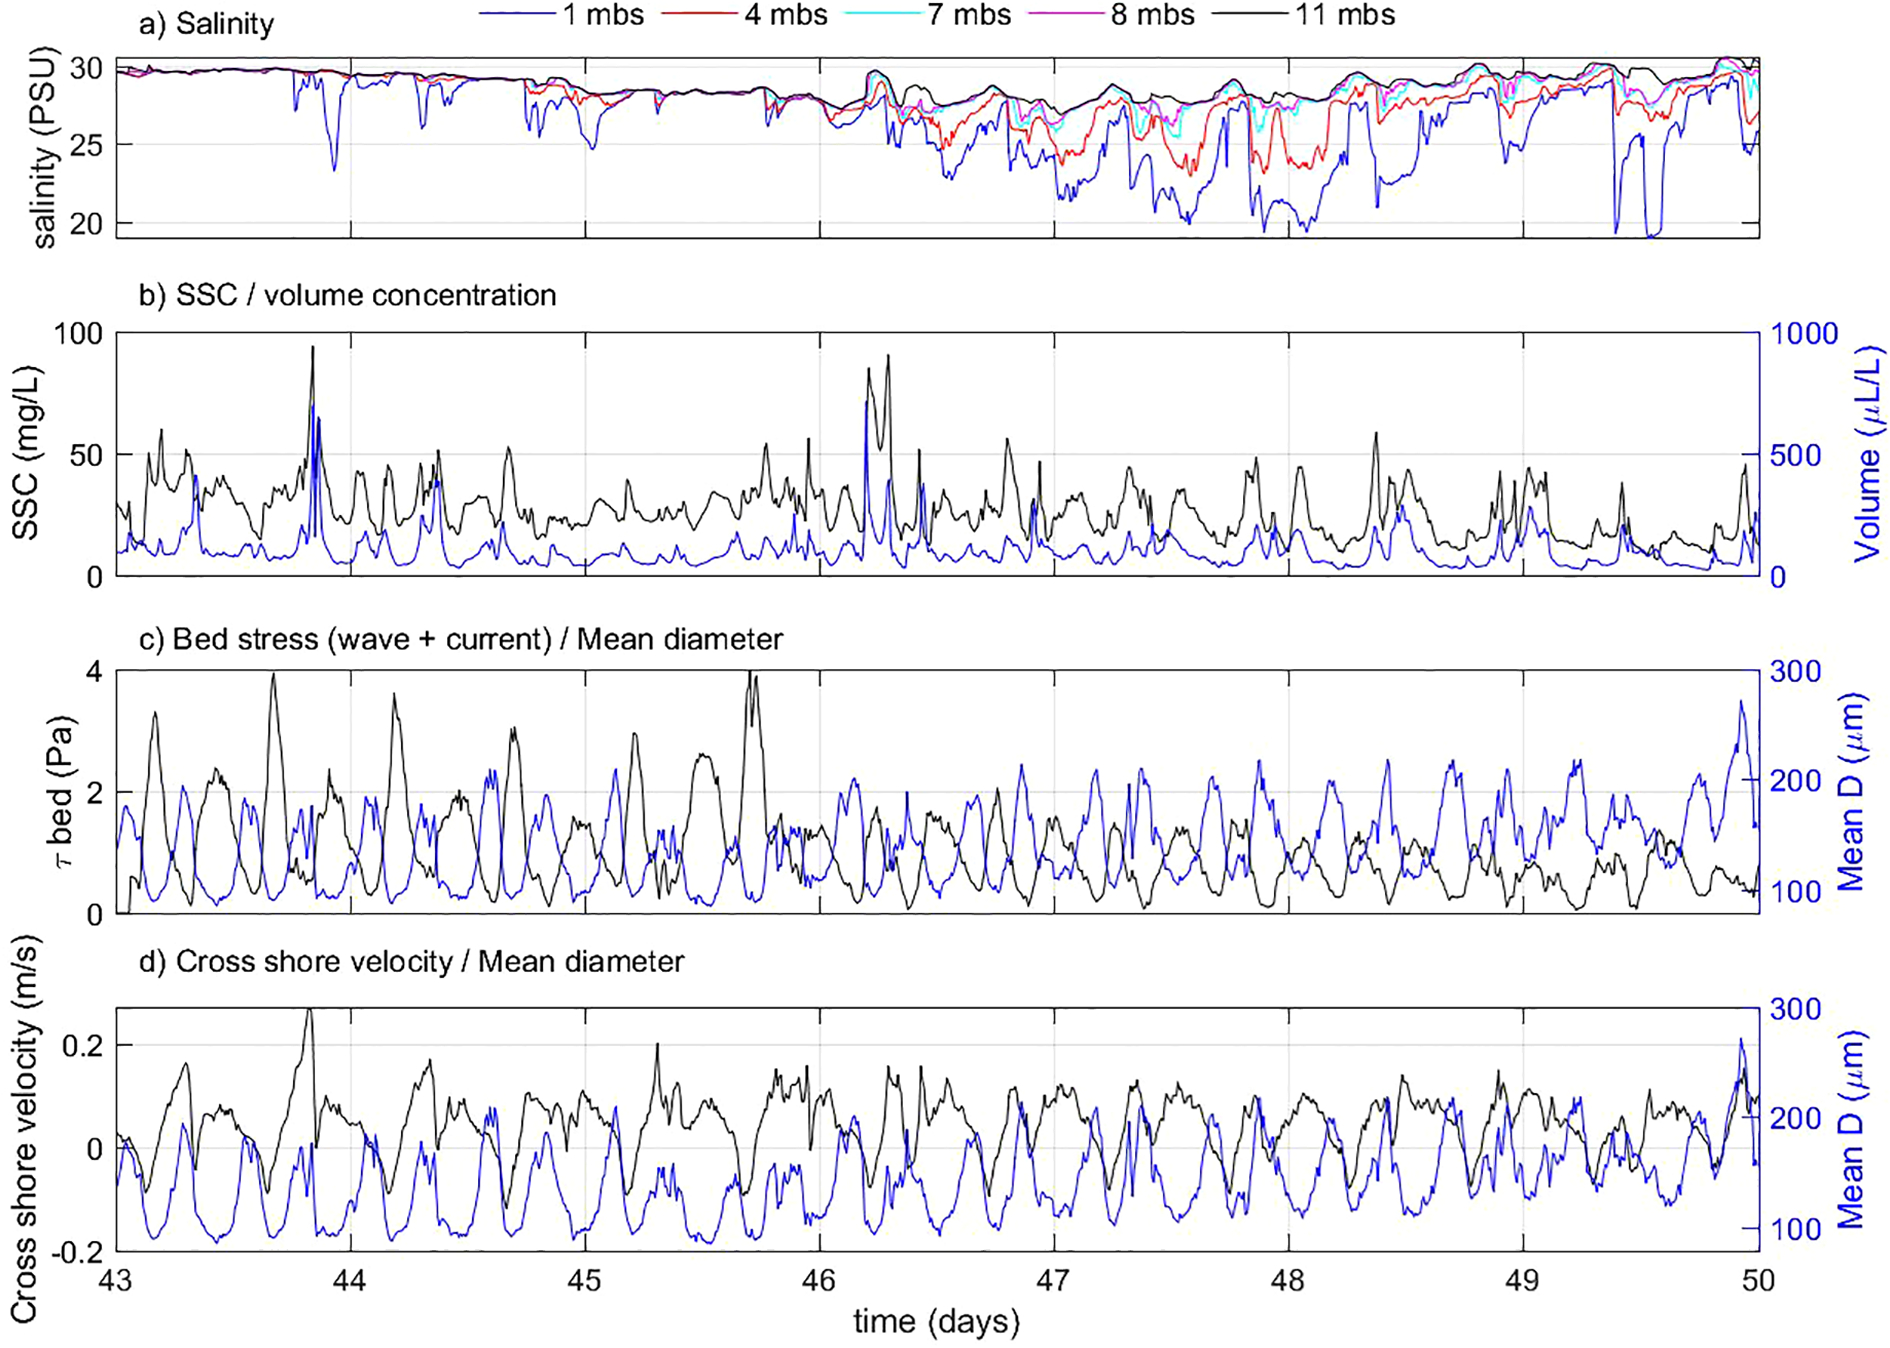
First recorded spring tide of winter 2013. The PSD’s corresponding to the time periods t1 − t4 are given in Figure 9.
Figure 9
PSD of first recorded spring tide of winter 2013. The PSD’s correspond to the time periods t1 − t4 given in Figure 8.
During the whole period the bed stress is inversely related with the mean particle size, whereby high stresses correspond to low mean particle size and vice-versa. The mean particle size is increasing slightly during the last days (48-50) as the stratification becomes stronger and SSC and bed stresses become lower. The observed PSDs are on average monomodal over the whole period with a mean diameter of 100 - 200 µm. This indicates the presence of particles with low anisotropy (Safar et al., 2023).
The second recorded spring tide displays almost the same patterns, the data are shown in Appendix D.
3.4 Winter 2013, neap tides
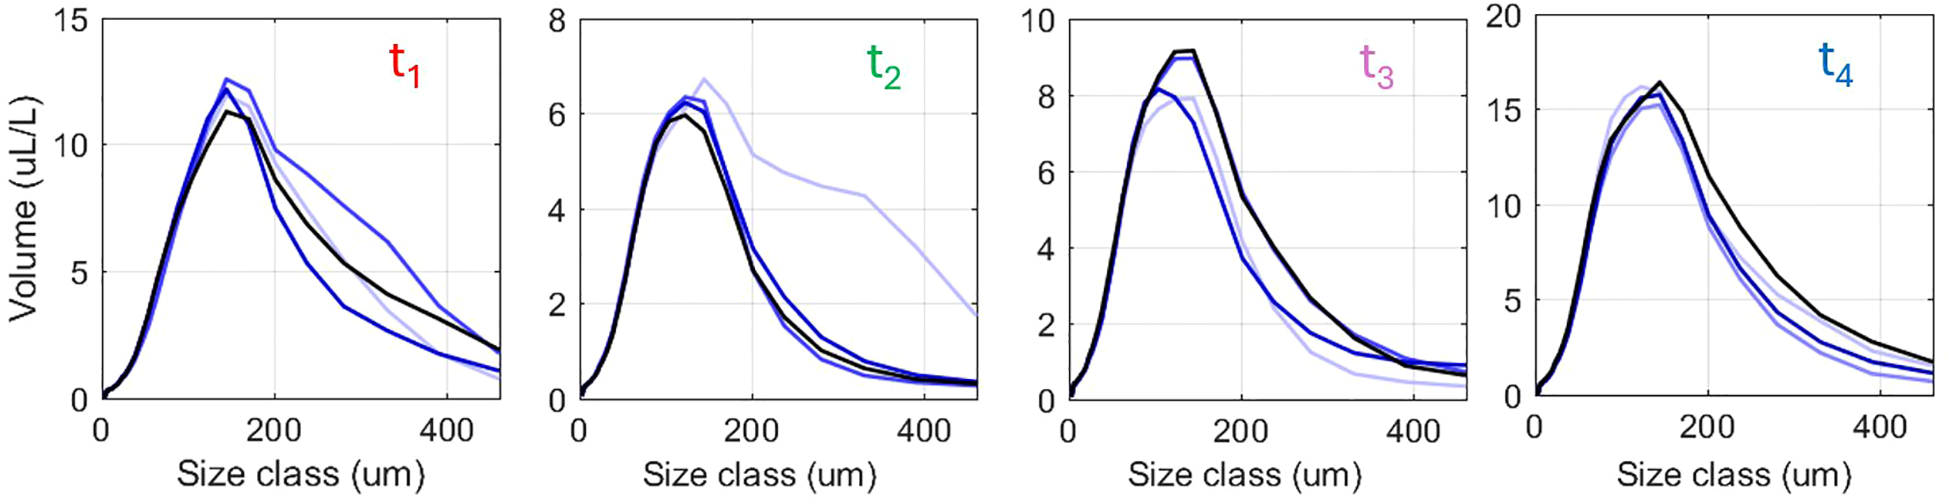
The first recorded neap tide of the winter season (days 50 - 56) can be divided into calm and stormy periods in terms of weather conditions (weather data are shown in Appendix C). The mean diameter is inversely related to bed stress for almost the whole period, except after day 55 when the storm is energetically high (high SSC, high bed stresses), see Figures 10, 11.
Figure 10
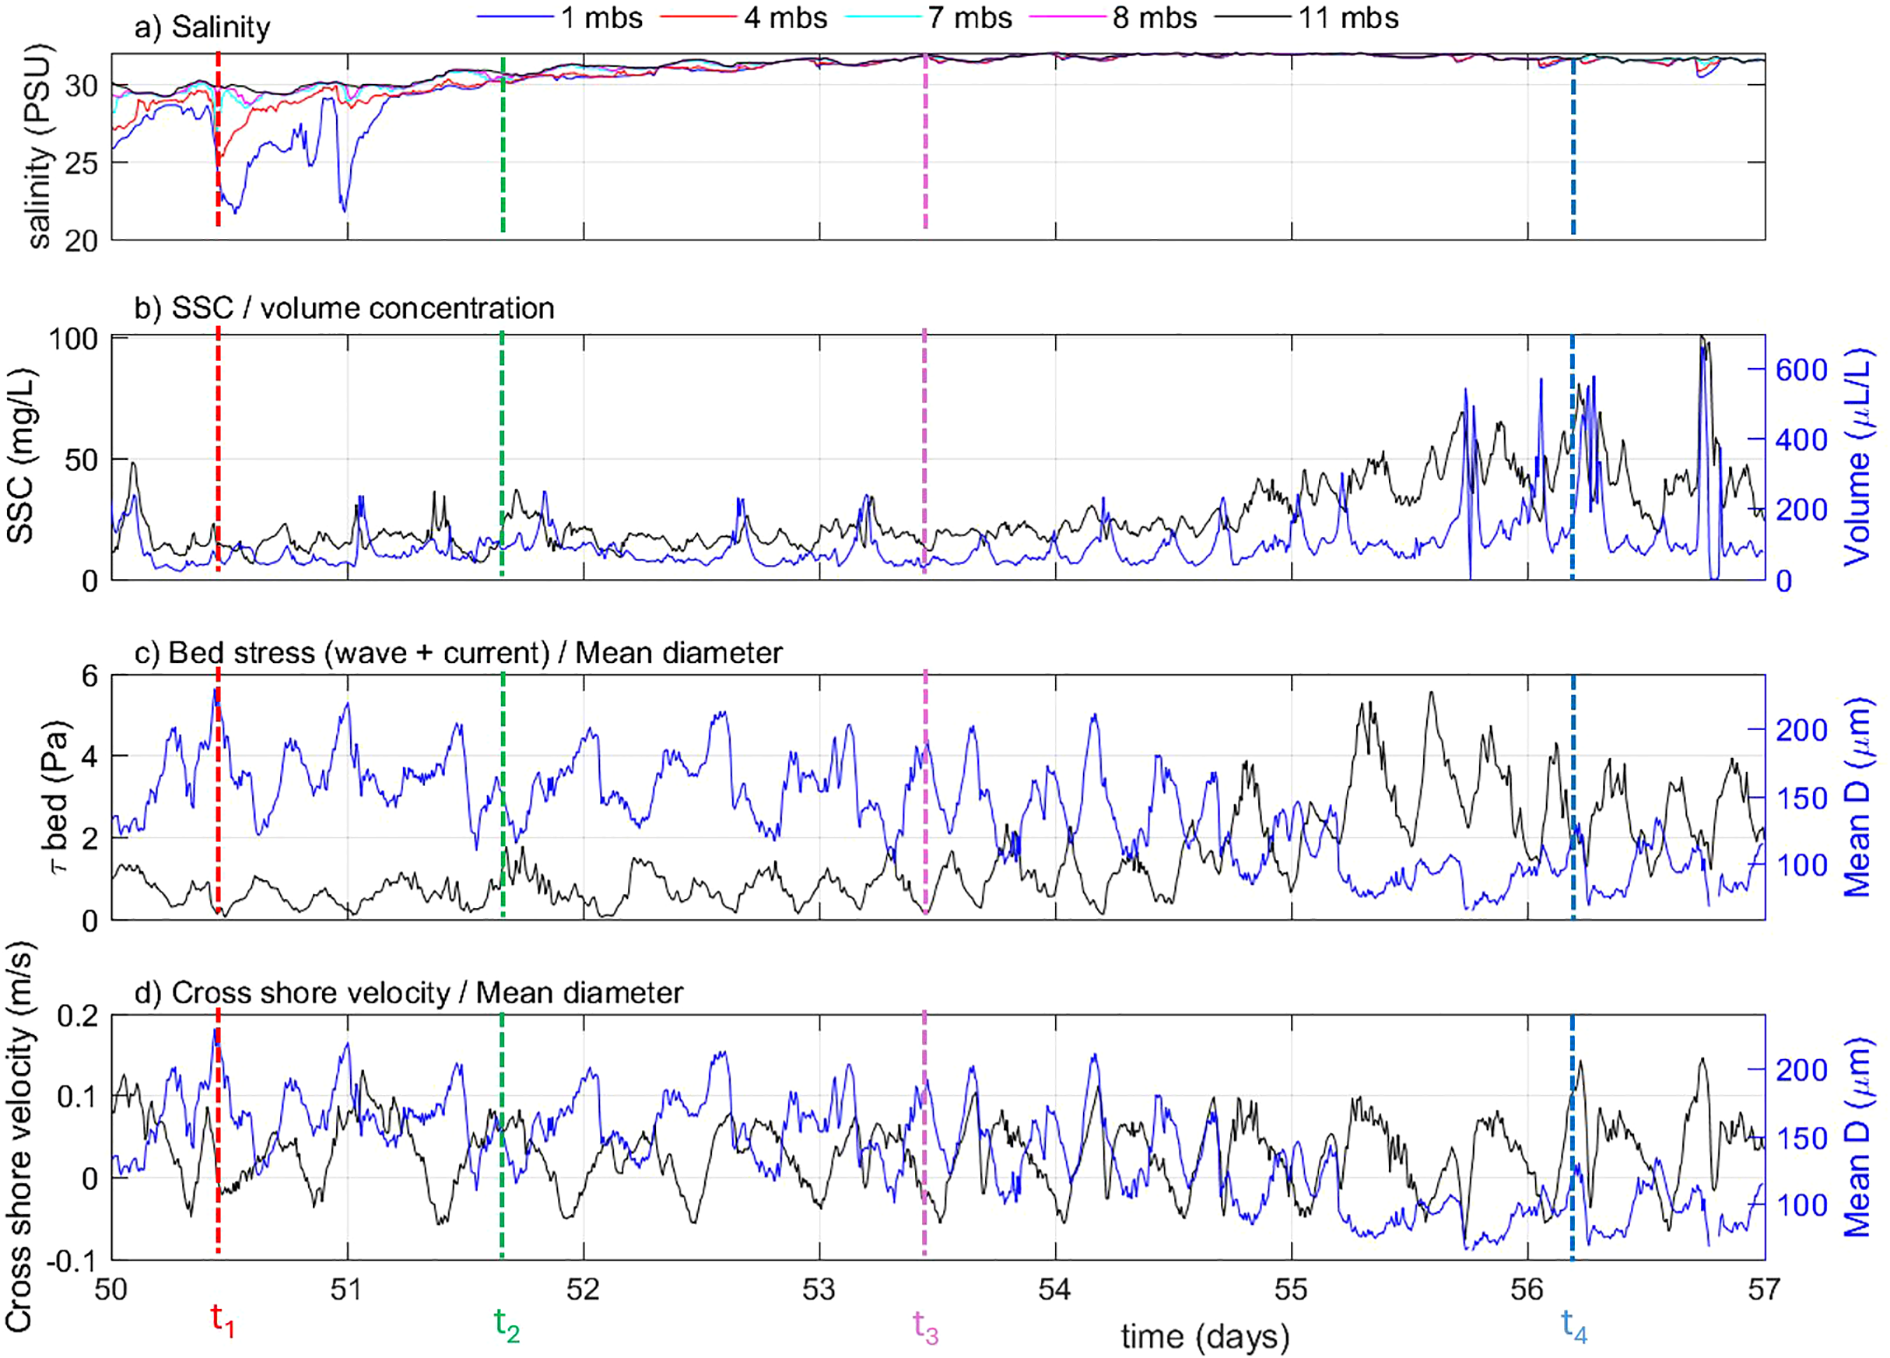
First recorded neap tide of winter 2013. The PSD’s corresponding to the time periods t1 − t4 are given in Figure 11.
Figure 11
First recorded neap tide of winter 2013. The PSD’s correspond to the time periods t1 − t4 are given in Figure 10.
3.4.1 Calm weather days
The first two days (50 - 51) were characterized by moderate wind speed and wave heights. The freshwater fronts maintained long periods of strong stratification (Figure 10). The SSC is low while the mean diameter is high (150 - 200 m) and the bed stress is low, hinting to the presence of organic-rich particles. The PSD during this period is monomodal (period t1), implying that the recorded particles are of low density but fairly spherical. Spherical flocs were obtained in laboratory studies when clay was flocculated with EPS (Extracellular Polymeric Substance), but not when microalgae were present (multimodal peaks were then observed in the PSD’s) (Safar et al., 2023).
For the second neap tide only two days were recorded, these days show similar behavior in terms of weather conditions, bed stresses, SSC and corresponding PSDs (data are shown in Appendix D).
3.4.2 Storm days
After these calm weather days, stormy weather conditions came into play at days 53-55 (Appendix C). The wind and wave activities were elevated and the water column became well mixed (Figure 10a). The SSC and bed stress increased while multimodal PSD’s are observed as the storm initiates (period t2). In agreement with the previous storm during the autumn season, as the storm progresses the mean diameter decreases (mean particle size of about 100 µm and less) and the PSD turns monomodal (from period to ).
4 Discussion
Flores et al. investigated the suspended sediment concentrations and fluxes over the period 260–290 days (2014) for the 12 m mooring (Flores et al., 2017). They found that sediment concentrations were highly variable during this period, with peak near-bottom concentrations of about 400 mg/L during storms. Sediment concentrations were lower during neap (40 mg/L) and spring tides (80 mg/L) during calm periods after the storms. Importantly, correlation between near-bottom suspended sediment concentration and bottom stresses was found only for wavy periods, indicating that waves are primarily responsible for resuspension for the largest recorded SSC. In our study, the calm periods were studied in more details, and the PSD’s analyzed based on mineral particles - organic matter composition of the sediment. The Rhine freshwater fronts transport biogenic species and organic matter along the coast (Joordens et al., 2001; Peperzak et al., 2003; Witbaard et al., 2015). Organic matter availability is a seasonal variable depending on the algae blooms periods of the year (Blauw, 2015; Fettweis and Baeye, 2015). Studies showed that most of dead algae cells remain as particulate organic matter (Otsuki and Hanya, 1972; Foree and McCarty, 1970). In most of these studies the biological activity is expressed in Chl-a concentration which is generally measured to be low during the winter months and high during the summer (Maerz and Wirtz, 2009; Deng et al., 2019). During our study, Chl-a measurements were unfortunately not possible. The dynamic behavior of organic matter with time and location (water column/sediment bed) is reflected in the shapes and densities of flocs (Van der Hout et al., 2017). These could partially be captured in the present study thanks to LISST-HOLO imaging and the results of a field survey performed 17th of September 2014 (Safar et al., 2022).
4.1 SPM in autumn
4.1.1 During neap tides
At neap tides with calm weather conditions, the salinity stratification prevails for a long period of the day. The well mixed water column conditions are very short. The stratification, induced by the fresh water front arrival, also dampens the turbulence (Naudin et al., 1997; Ren and Wu, 2014; Yao et al., 2016; Lee et al., 2016; Tao et al., 2018). The suspended sediment concentrations are then generally low especially at the surface layer (Pietrzak et al., 2011; Flores et al., 2017), but algae, phytoplanktonic species and organic matter cannot be detected properly using OBS measurements and are generally not taken into account as SPM concentrations. Microorganisms and related organic matter originating from the estuary are known to be transported by river fronts (Eisma et al., 1980; Rijstenbil, 1987; van der Woerd et al., 2011; Schofield et al., 2013; Tao et al., 2018). Comparison between the LISST-HOLO pictures before, during and after the front (Figure 3) showed clearly more elongated (fresh microalgae particles) during the fronts for three days of calm weather neap tides of autumn 2014. These particles, largely devoid of mineral sediment, are therefore believed to be advected by the freshwater front.
The freshwater front propagating onshore at the surface causes a offshore flow near the bed when reaching the shoreline (Rijnsburger et al., 2018). The organic matter from the freshwater layer then combines with the sediment to form a SPM cloud that passes the mooring as a SSC peak 1 - 1.5h after the front arrival. This peak is a recurring event during the neap tides with calm weather conditions. The near bottom SSC (including peak values) is low during neap tides. The analysis of PSD’s and bed stresses indicate that most particles in suspensions are highly anisotropic and of low density (Safar et al., 2022, 2023).
During the calm weather conditions, the low density organic matter can also be trapped in the freshwater layer due to salinity discontinuities and experience a delayed settling (Naudin et al., 1997; Ren and Wu, 2014; Yao et al., 2016; Lee et al., 2016; Tao et al., 2018; MacIntyre et al., 1995). An estimation of the settling velocities of organic matter rich particles (of the order of 1 mm/s) indicates that organic matter trapped in the halocline will also reach the bottom within 1.0 - 1.5 hour after the front arrival, and can therefore mix with the SPM cloud. A sketch represented the two mechanisms of SPM accumulation at the mooring is given in Figure 12.
Figure 12
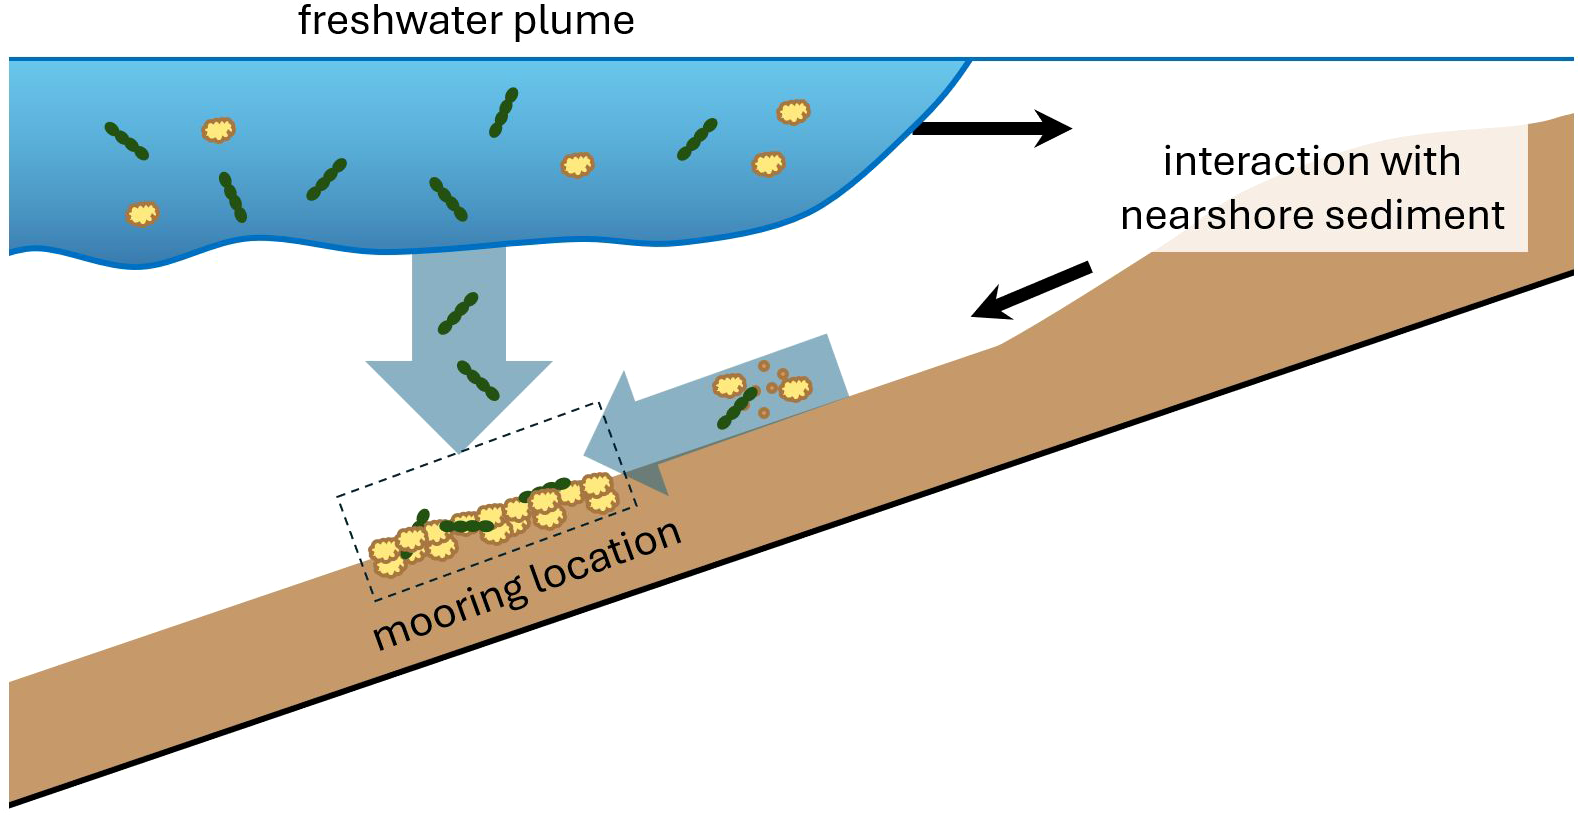
Sketch illustrating SPM dynamics at the mooring during autumn neap tides. Microalgae strains are represented by green elongated particles and flocs, largely composed of organic matter (but which can include mineral sediment) as yellow particles of undefined shape. The particles are transported by the freshwater front. Some of this material will settle directly from the front, whereas a part will mix with nearshore sediment and be advected back towards the mooring by return flow.
Eventually this organic matter-rich SPM cloud accumulates at the bed creating a fluff layer that can easily be resuspended during storms (McCandliss et al., 2002; Forsberg et al., 2018).
The presence of this fluff layer was detected during the first hours of the storm initiation. At the first hours of higher wind and wave activities, the increase in bed stress coincided with a decrease in mean diameter and the observed PSD turned gradually from multimodal into monomodal. This gradual turnover during the storm initiation confirms the presence of a fluff layer (formed of anisotropic large particles of low density) that is depleted during the first hours of the storm. A sketch representing the erosion of the fluff layer at the onset of the storm is given in Figure 13.
Figure 13
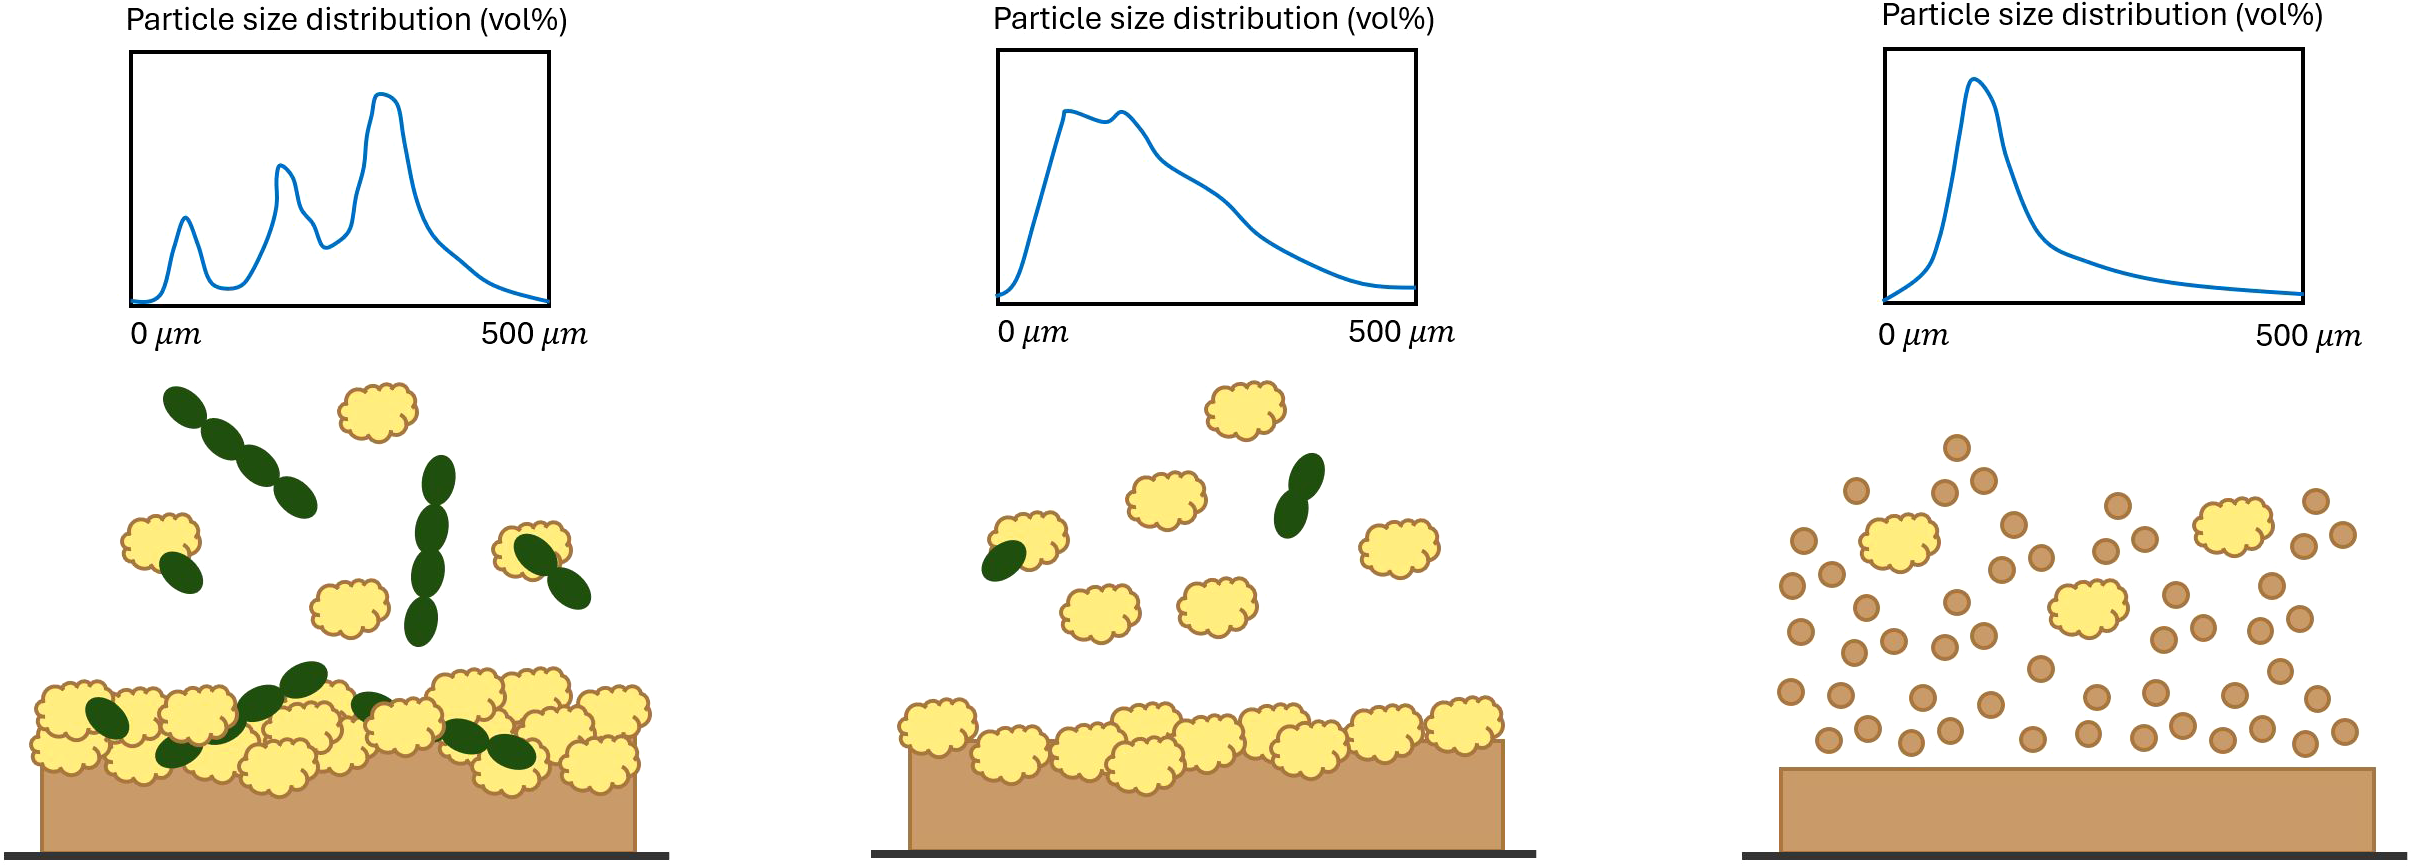
Sketch illustrating erosion dynamics at the onset of a storm during the autumn season. Before the storm the PSD’s are very multimodal due to the presence of microalgae strains in the water column. The mean particle size is then large. The modality of the PSD’s change as the top of the fluff layer is eroded. As the storms proceeds, the fluff layer is depleted and mineral sediment is suspended into the water column, turning the PSD monomodal. The mean particle size is then smaller than before the storm.
The bed stress increased gradually as the storm proceeded, reaching the erosion threshold of sand and silt (Flores et al., 2018). This is reflected in a strong increase in volume concentrations measured with the LISST 100X. At the second day of the storm, high volume concentrations and monomodal distributions with fine sand sizes confirm the wave-induced resuspension of mineral sediments from the bed. The fine fraction of this sediment becomes available to interact with advected organic matter. It will then settle and accumulate again as the weather calms down, and the fluff layer develops again after the storm. An other study in the far-field region confirmed the development of a fluff layer composed of settled Chl-a rich particles deposited after a storm (Van der Hout et al., 2017).
4.1.2 During spring tides
The particle size distribution for the spring tide of the autumn 2014, switches between a multimodal distribution and a monomodal distribution with fine sand size. High mean diameters coincide with low bed stresses and vice-versa when the stratification is high, but high mean diameters coincide with high bed stresses (and vice-versa) when the stratification is low, i.e. when the water column is well mixed. During the spring tides, the freshwater front causes near bottom turbulent spikes that results in resuspension of bed material (Flores et al., 2017).
Due to the lack of LISST-HOLO measurements for these periods, we cannot visually confirm the presence of the algae and organic material in the water column. However, taking the neap tide pictures as a reference and other studies that confirmed the presence of planktonic species (Smetacek, 1985; Balzano et al., 2011; Karp-Boss et al., 2007), we can assume that the multimodal distributions found using the LISST 100x are indeed due to the presence of anistropic particles of organic origin. The fact that mass and volume based concentrations recorded by OBS and LISST do not overlap for the period where multimodal peaks are found is also an indication that the suspended sediment during that period has an organic origin (Safar et al., 2022).
4.2 SPM in winter
Higher SSC concentrations were found in winter compared to autumn, in agreement with other studies (Fettweis and Baeye, 2015; McCandliss et al., 2002; Van der Hout et al., 2017).
4.2.1 During neap tides
During winter, the biological activity is expected to be low (Eisma et al., 1980). The PSDs are mainly monomodal for any degree of stratification, high mean diameters corresponding to low bed stresses and vice versa. This indicates that the suspended particles are still organic-rich in winter, as larger particles (with lower density) are in suspension at low bed stresses. The fact that the PSD’s are monomodal are an indication that there are limited anisotropic particles in suspension. There are some multimodal PSDs with high mean diameters observed during the neap tide of winter 2013. These multimodal distributions appear mainly during the strong stratified periods of freshwater front passage with low bed stress and at cross-shore water slack. The shape of these multimodal PSD’s is different from the PSD’s measured in autumn, when elongated particles were present.
The PSDs of the stormy days turned from multimodal to monomodal very fast and not gradually as was observed during the storm of autumn season. This fast turnover indicates that the fluff layer is more depleted in winter than in autumn season. A sketch representing the erosion of the fluff layer at the onset of the storm is given in Figure 14.
Figure 14
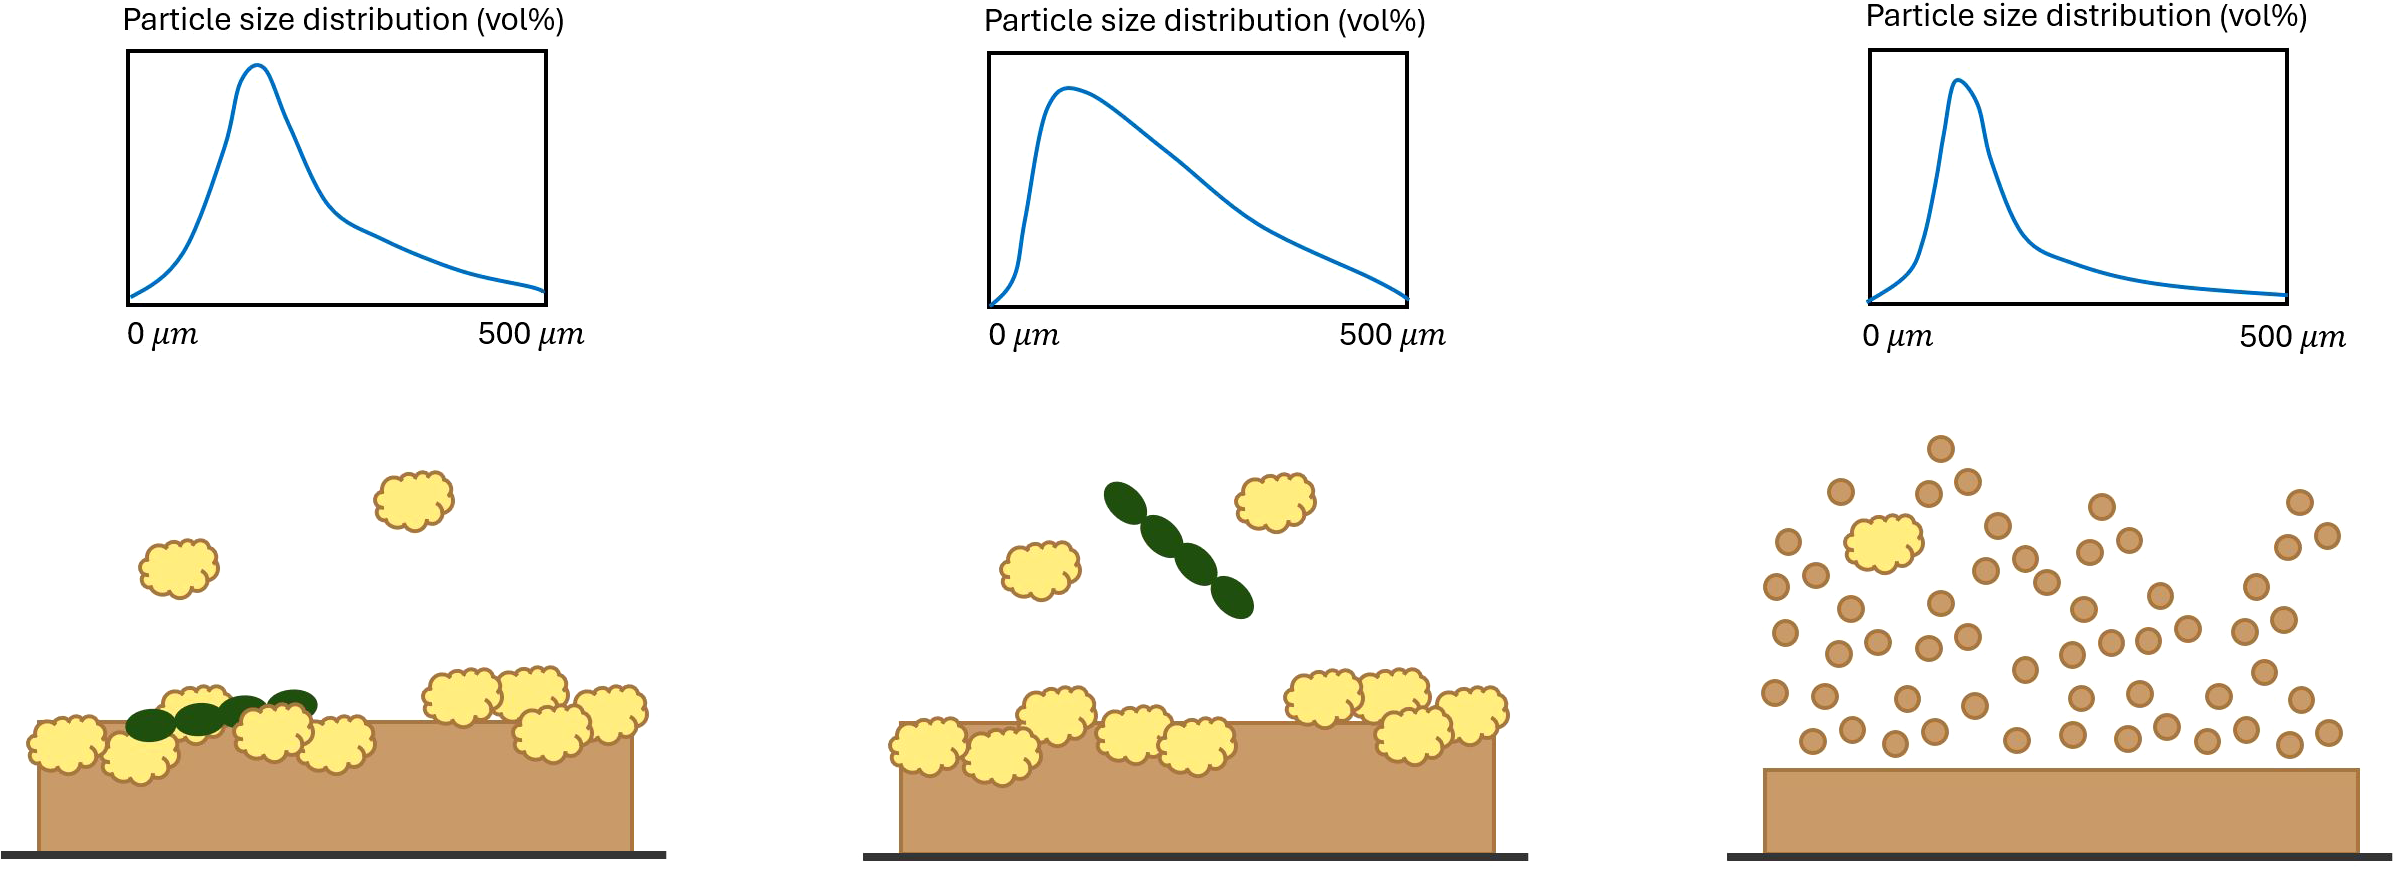
Sketch illustrating erosion dynamics at the onset of a storm during the winter season. Before the storm the PSD’s are monomodal and composed of rather spherical flocs of low density. At the onset of the storm, a slight shift in modality is observed as the top of the fluff layer is eroded. This layer might contain some remaining anisotropic organic matter, such as dead algae. As the storms proceeds, the fluff layer is depleted and mineral sediment is suspended into the water column, turning the PSD monomodal. The mean particle size is then smaller than before the storm.
4.2.2 During spring tides
Mainly monomodal PSDs with fine sand sizes are found during spring tides. As during neap tide, high mean diameters correspond to low bed stresses. Despite the lack of LISST-HOLO measurements for this period, we can reasonably assume that these particles are the same type of flocs as found during neap tide.
4.3 Threshold for erosion
During the storm period of the autumn season, the resuspension of the fluff layer could be detected at first hours of the storm initiation (Figure 5), while the fine sand and silt particles were observed a few hours later. The switch between fluff erosion/sediment erosion is defined as the changes in LISST profiles (switching from multimodal peaks to monomodal peaks). The threshold for fluff erosion in the observations is difficult to relate to a bed stress threshold. The reason is that the OBS which measures SSC is not well calibrated for organic matter or organic matter-rich flocs (Safar et al., 2022). As the fluff material deposited on the bed is of low density, it is expected that the erosion threshold for this material is close to zero. As we have seen, the thickness of the fluff layer is season-dependent, but also influenced by the weather and hydrodynamic conditions (the fluff layer is for example depleted after a storm) (Fettweis and Baeye, 2015; van der Hout et al., 2015; Van der Hout et al., 2017). In general, bottom layers are mixtures of organic matter and mineral sediment resulting from sedimentation, influenced by the growth of biofilms on the bed (Al Ani et al., 1991; Manning et al., 2007; Joordens et al., 2001; Mikkelsen et al., 2007; Chang et al., 2006). Studying biologically mediated flocculation processes is therefore important to predict the erosion of the fluff layer (Brocchini et al., 2017; Prins et al., 2012; Chen et al., 2018).
An important factor for the erosion rate is the amount of mineral sediment eroded for a given shear (or stress). As the composition of the bed varies in space (both vertically and horizontally) and time, these should be taken into account in the estimation of erosion fluxes. Even at constant bed stress, erosion fluxes can be time-dependent as portions of the bed with different composition and strength will gradually be eroded. One modeling strategy could be the one presented by van Kessel et al. who proposed a bilayer erosion model for erosion of fines in sandy beds (Van Kessel et al., 2011), recently extended with porosity as state variable (van Rees et al., 2024).
5 Conclusion
In this study we identified the source of SPM during spring-neap tidal cycles during two seasons of winter and autumn in the mid-field region of Rhine-ROFI. During the neap tides with calm weather conditions in autumn, advection of organic matter and microorganisms from the Rhine front are the main source of SPM. Multimodal PSDs with high mean diameter are typical during the neap tides and indicate that elongated particles such as microalgae strains are present in the water column as the stratification is fully developed. These multimodal distributions and high mean diameters coincided with low bed stresses indicating that these particles are advected rather than resuspended from the bed at the location of the mooring. These particles are brought by the freshwater front and are estimated to settle over a period of 1.0 - 1.5h after the front arrival at the mooring. The freshwater front also resuspends fine sediment from close to the shoreline by causing a return flow near the bottom. This resuspended sediment interacts subsequently with the advected organic particles and form a SPM cloud (with higher SSC peak) that is observed 1.0 - 1.5 hour after the front arrival at the mooring location. This SPM cloud eventually accumulate at the bottom to form a fluff layer. This fluff layer is observed to resuspend during stormy weather conditions, after which the fine silt and sand particles from the layers underneath are in turn eroded as the storm proceeds.
The composition of the SPM is found to be seasonal dependent as much less organic matter is found during the winter period. Comparison of the autumn and winter seasons showed that very multimodal distributions were observed mostly during the autumn season, due to the presence of strongly anisotropic algae strains. During the winter, observed PSDs where mainly monomodal indicating the presence of rather spherical particles. As the mean particle size is large at low bed stress (and vice-versa) in both seasons during calm weather conditions, it can be deduced that organic-rich particles are in suspension at low bed stresses even in winter. In winter, the rather spherical particles of low density are assumed to be flocs formed by mineral clay and EPS.
The PSDs during the storm periods of both seasons were different. The gradual transition from multimodal distribution into monomodal at the first hours of storm initiation in autumn confirms the presence of a significantly large fluff layer. The change of multimodal PSDs into monomodal PSD’s in winter is on the other hand very fast, indicating that the fluff layer is then rather thin. From the present study, it is hence confirmed that the presence of organic matter is key to understand SPM dynamics in the Rhine-ROFI during calm conditions, influencing both erosion and settling-deposition fluxes. During energetic storm conditions, inorganic sediments have a dominant contribution as soon as the fluff layer is depleted. Variations of SPM and seabed composition should be better studied in order to include their effect on sediment transport and erosion fluxes. This will help to improve current sediment transport models.
Statements
Data availability statement
The data used in this work can be found at: https://zenodo.org/records/15624212.
Author contributions
ZS: Conceptualization, Investigation, Methodology, Writing – original draft, Writing – review & editing. CC: Conceptualization, Funding acquisition, Supervision, Writing – review & editing. SR: Writing – review & editing. RF: Writing – review & editing. JP: Writing – review & editing. AS: Writing – review & editing. TK: Writing – review & editing. AH-D: Writing – review & editing.
Funding
The author(s) declare financial support was received for the research and/or publication of this article. This work has been performed in the frame of the grant NWO869.15.011, entitled “Flocs and fluff in the Delta” and the MUDNET academic network (https://www.tudelft.nl/mudnet/).
Conflict of interest
The authors declare that the research was conducted in the absence of any commercial or financial relationships that could be construed as a potential conflict of interest.
The authors CC and AS declared that they were an editorial board member of Frontiers at the time of submission. This had no impact on the peer review process and the final decision.
Generative AI statement
The author(s) declare that no Generative AI was used in the creation of this manuscript.
Any alternative text (alt text) provided alongside figures in this article has been generated by Frontiers with the support of artificial intelligence and reasonable efforts have been made to ensure accuracy, including review by the authors wherever possible. If you identify any issues, please contact us.
Publisher’s note
All claims expressed in this article are solely those of the authors and do not necessarily represent those of their affiliated organizations, or those of the publisher, the editors and the reviewers. Any product that may be evaluated in this article, or claim that may be made by its manufacturer, is not guaranteed or endorsed by the publisher.
Supplementary material
The Supplementary Material for this article can be found online at: https://www.frontiersin.org/articles/10.3389/fmars.2025.1701467/full#supplementary-material
References
1
Agrawal Y. C. Traykovski P. (2001). Particles in the bottom boundary layer: Concentration and size dynamics through events. J. Geophysical Research: Oceans106, 9533–9542.
2
Al Ani S. Dyer K. R. Huntley D. A. (1991). Measurement of the influence of salinity on floc density and strength. Geo-Marine Lett.11, 154–158. doi: 10.1007/BF02431002
3
Balzano S. Sarno D. Kooistra W. H. C. F. (2011). Effects of salinity on the growth rate and morphology of ten Skeletonema strains. J. Plankton Res.33, 937–945. doi: 10.1093/plankt/fbq150
4
Blauw A. (2015). Monitoring and prediction of phytoplankton dynamics in the North Sea. (PHD thesis). ( Universiteit van Amsterdam).
5
Brocchini M. Calantoni J. Postacchini M. Sheremet A. Staples T. Smith J. et al . (2017). Comparison between the wintertime and summertime dynamics of the Misa River estuary. Mar. Geology385, 27–40. doi: 10.1016/j.margeo.2016.12.005
6
Chang T. S. Joerdel O. Flemming B. W. Bartholomä A. (2006). The role of particle aggregation/disaggregation in muddy sediment dynamics and seasonal sediment turnover in a back-barrier tidal basin, East Frisian Wadden Sea, southern North Sea. Mar. Geology235, 49–61. doi: 10.1016/j.margeo.2006.10.004
7
Chen P. Yu J. C. S. Fettweis M. (2018). Modeling Storm-Influenced Suspended Particulate Matter Flocculation Using a Tide-Wave-Combined Biomineral Model: Chen et al. Water Environ. Res.90.3, 244–257. doi: 10.2175/106143017X15131012152799
8
Cross J. Nimmo-Smith W. A. M. Hosegood P. J. Torres R. (2015). The role of advection in the distribution of plankton populations at a moored 1-D coastal observatory. Prog. Oceanography137, 342–359. doi: 10.1016/j.pocean.2015.04.016
9
Deng Z. He Q. Safar Z. Chassagne C. (2019). The role of algae in fine sediment flocculation: In-situ and laboratory measurements. Mar. Geology413, 71–84. doi: 10.1016/j.margeo.2019.02.003
10
De Ruyter van Steveninck E. D. Admiraal W. Breebaart L. Tubbing G. M. J. Van Zanten B. (1992). Plankton in the River Rhine: structural and functional changes observed during downstream transport. J. Plankton Res.14, 1351–1368. doi: 10.1093/plankt/14.10.1351
11
Eisma D. Kalf J. Veenhuis M. (1980). The formation of small particles and aggregates in the Rhine estuary. Netherlands J. Sea Res.14.2, 172–191. doi: 10.1016/0077-7579(80)90020-4
12
Fettweis M. Baeye M. (2015). Seasonal variation in concentration, size, and settling velocity of muddy marine flocs in the benthic boundary layer. J. Geophysical Research: Oceans120.8, 5648–5667. doi: 10.1002/2014JC010644
13
Fettweis M. Silori S. Adriaens R. Desmit X. (2025). Clay minerals and the stability of organic carbon in suspension along coastal to offshore transects. Geochimica Cosmochimica Acta395, 229–237. doi: 10.1016/j.gca.2025.03.003
14
Fettweis M. NeChad B. den Eynde D. V. (2007). An estimate of the suspended particulate matter (SPM) transport in the southern North Sea using SeaWiFS images, in situ measurements and numerical model results. Continental Shelf Res.27.10-11, 1568–1583. doi: 10.1016/j.csr.2007.01.017
15
Flores R. P. Rijnsburger S. Horner-Devine A. R. Souza A. J. Pietrzak J. D. (2017). The impact of storms and stratification on sediment transport in the r hine region of freshwater influence. J. Geophysical Research: Oceans122, 4456–4477.
16
Flores R. P. Rijnsburger S. Meirelles S. Horner-Devine A. R. Souza A. J. Pietrzak J. D. et al . (2018). Wave generation of gravity-driven sediment flows on a predominantly sandy seabed. Geophysical Res. Lett.45, 7634–7645. doi: 10.1029/2018GL077936
17
Flores R. P. Rijnsburger S. Horner-Devine A. R. Kumar N. Souza A. J. Pietrzak J. D. (2020). The formation of turbidity maximum zones by minor axis tidal straining in regions of freshwater influence. J. Phys. Oceanography50, 1265–1287. doi: 10.1175/JPO-D-18-0264.1
18
Foree E. G. McCarty P. L. (1970). Anaerobic decomposition of algae. Environ. Sci. Technol.4, 842–849. doi: 10.1021/es60045a005
19
Forsberg P. L. Skinnebach K. H. Becker M. Ernstsen V. B. Kroon A. Andersen T. J. (2018). The influence of aggregation on cohesive sediment erosion and settling. Continental Shelf Res.171, 52–62. doi: 10.1016/j.csr.2018.10.005
20
Ganaoui O. E. Schaaff E. Boyer P. Amielh M. Anselmet F. Grenz C. (2007). Erosion of the upper layer of cohesive sediments: characterization of some properties. J. Hydraulic Eng.133, 1087–1091. doi: 10.1061/(ASCE)0733-9429(2007)133:9(1087)
21
Gu Y. Zhang Y. Qian D. Tang Y. Zhou Y. Zhu D. Z. (2020). Effects of microbial activity on incipient motion and erosion of sediment. Environ. Fluid Mechanics20, 175–188. doi: 10.1007/s10652-019-09706-9
22
Horner-Devine A. R. Pietrzak J. D. Souza A. J. McKeon M. A. Meirelles S. Henriquez M. et al . (2017). Cross-shore transport of nearshore sediment by river plume frontal pumping. Geophysical Res. Lett.44, 6343–6351.
23
Jago C. F. Jones S. E. (1998). Observation and modelling of the dynamics of benthic fluff resuspended from a sandy bed in the southern North Sea. Continental Shelf Res.18, 1255–1282. doi: 10.1016/S0278-4343(98)00043-0
24
Joordens J. C. A. Souza A. J. Visser A. (2001). The influence of tidal straining and wind on suspended matter and phytoplankton distribution in the Rhine outflow region. Continental Shelf Res.21, 301–325. doi: 10.1016/S0278-4343(00)00095-9
25
Karp-Boss L. Azevedo L. Boss E. (2007). LISST-100 measurements of phytoplankton size distribution: Evaluation of the effects of cell shape. Limnology Oceanography: Methods5, 396–406.
26
Kindler K. Khalili A. Stocker R. (2010). Diffusion-limited retention of porous particles at density interfaces. Proc. Natl. Acad. Sci.107, 22163–22168. doi: 10.1073/pnas.1012319108
27
Lee J. Liu J. T. Hung C.-C. Lin S. Du X. (2016). River plume induced variability of suspended particle characteristics. Mar. Geology380, 219–230. doi: 10.1016/j.margeo.2016.04.014
28
Lund-Hansen L. C. Laima M. Mouritsen K. Lam N. N. Hai D. N. (2002). Effects of benthic diatoms, fluff layer, and sediment conditions on critical shear stress in a non-tidal coastal environment. J. Mar. Biol. Assoc. United Kingdom82, 929–936. doi: 10.1017/S0025315402006410
29
MacIntyre S. Alldredge A. L. Gotschalk C. C. (1995). Accumulation of marines now at density discontinuities in the water column. Limnology Oceanography40, 449–468. doi: 10.4319/lo.1995.40.3.0449
30
Maerz J. Wirtz K. (2009). Resolving physically and biologically driven suspended particulate matter dynamics in a tidal basin with a distribution-based model. Estuarine Coast. Shelf Sci.84, 128–138. doi: 10.1016/j.ecss.2009.05.015
31
Manning A. J. Friend P. L. Prowse N. Amos C. L. (2007). Estuarine mud flocculation properties determined using an annular mini-flume and the LabSFLOC system. Continental Shelf Res.27, 1080–1095. doi: 10.1016/j.csr.2006.04.011
32
McCandliss R. R. Jones S. E. Hearn M. Latter R. Jago C. F. (2002). Dynamics of suspended particles in coastal waters (southern North Sea) during a spring bloom. J. Sea Res.47, 285–302. doi: 10.1016/S1385-1101(02)00123-5
33
Mikkelsen O. A. Hill P. S. Milligan T. G. (2007). Seasonal and spatial variation of floc size, settling velocity, and density on the inner Adriatic Shelf (Italy). Continental Shelf Res.27, 417–430. doi: 10.1016/j.csr.2006.11.004
34
Naudin J. J. Cauwet G. Chrétiennot-Dinet M.-J. Deniaux B. Devenon J.-L. Pauc H. (1997). River discharge and wind influence upon particulate transfer at the land–ocean interaction: case study of the Rhone River plume. Estuarine Coast. Shelf Sci.45, 303–316. doi: 10.1006/ecss.1996.0190
35
Nijs M. A. J. D. Pietrzak J. D. Winterwerp J. C. (2011). Advection of the salt wedge and evolution of the internal flow structure in the Rotterdam Waterway. J. Phys. Oceanography41, 3–27. doi: 10.1175/2010JPO4228.1
36
Otsuki A. Hanya T. (1972). Production of dissolved organic matter from dead green algal cells. II. Anaerobic microbial decomposition. Vertical Profile of Organic Matter in the Bering Sea Sediment 13 in Organic Geochemistry 1966, ed. by GE HOBSON and GC SPEERS (London: Pergamon Press).
37
Peperzak L. Colijn F. Koeman R. Gieskes W. W. C. Joordens J. C. A. (2003). Phytoplankton sinking rates in the Rhine region of freshwater influence. J. Plankton Res.25, 365–383. doi: 10.1093/plankt/25.4.365
38
Pietrzak J. D. de Boer G. J. Eleveld M. A. (2011). Mechanisms controlling the intra-annual mesoscale variability of SST and SPM in the southern North Sea. Continental Shelf Res.31, 594–610. doi: 10.1016/j.csr.2010.12.014
39
Prins T. C. Desmit X. Baretta-Bekker J. G. (2012). Phytoplankton composition in Dutch coastal waters responds to changes in riverine nutrient loads. J. sea Res.73, 49–62. doi: 10.1016/j.seares.2012.06.009
40
Ren J. Wu J. (2014). Sediment trapping by haloclines of a river plume in the Pearl River Estuary. Continental Shelf Res.82, 1–8. doi: 10.1016/j.csr.2014.03.016
41
Rijnsburger S. Flores R. P. Pietrzak J. D. Horner-Devine A. R. Souza A. J. (2018). The influence of tide and wind on the propagation of fronts in a shallow river plume. J. Geophysical Research: Oceans123, 5426–5442. doi: 10.1029/2017JC013422
42
Rijstenbil J. W. (1987). Phytoplankton composition of stagnant and tidal ecosystems in relation to salinity, nutrients, light and turbulence. Netherlands J. Sea Res.21, 113–123. doi: 10.1016/0077-7579(87)90027-5
43
Safar Z. Deng Z. Chassagne C. (2023). Applying a logistic growth equation to model flocculation of sediment in the presence of living and dead organic matter. Front. Mar. Sci. 10. doi: 10.3389/fmars.2023.1227849
44
Safar Z. Chassagne C. Rijnsburger S. Sanz M. I. Manning A. J. Souza A. J. et al . (2022). Characterization and classification of estuarine suspended particles based on their inorganic/organic matter composition. Front. Mar. Sci.9, 896163. doi: 10.3389/fmars.2022.896163
45
Schofield O. Moline M. Cahill B. Frazer T. Kahl A. Oliver M. et al . (2013). Phytoplankton productivity in a turbid buoyant coastal plume. Continental shelf Res.63, S138–S148. doi: 10.1016/j.csr.2013.02.005
46
Smetacek V. S. (1985). Role of sinking in diatom life-history cycles: ecological, evolutionary and geological significance. Mar. Biol.84, 239–251. doi: 10.1007/BF00392493
47
Stive M. J. F. De Schipper M. A. Luijendijk A. P. Aarninkhof S. G. J. van Gelder-Maas C. Van Thiel de Vries J. S. M. et al . (2013). A new alternative to saving our beaches from sea-level rise: the sand engine. J. Coast. Res.29, 1001–1008. doi: 10.2112/JCOASTRES-D-13-00070.1
48
Sutherland B. R. Barrett K. J. Gingras M. K. (2015). Clay settling in fresh and salt water. Environ. Fluid Mechanics15, 147–160. doi: 10.1007/s10652-014-9365-0
49
Tao J. Hill P. S. Boss E. S. Milligan T. G. (2018). Variability of suspended particle properties using optical measurements within the Columbia River Estuary. J. Geophysical Research: Oceans123, 6296–6311. doi: 10.1029/2018JC014093
50
Tolhurst T. J. Black K. S. Paterson D. M. (2009). Muddy sediment erosion: Insights from field studies. J. Hydraulic Eng.135, 73–87. doi: 10.1061/(ASCE)0733-9429(2009)135:2(73)
51
van de Meent D. (1982). Particulate organic matter in the river Rhine delta. (PHD thesis). (TU Delft: Delft University of Technology).
52
van der Hout C. M. Gerkema T. Nauw J. J. Ridderinkhof H. (2015). Observations of a narrow zone of high suspended particulate matter (SPM) concentrations along the Dutch coast. Continental Shelf Res.95, 27–38. doi: 10.1016/j.csr.2015.01.002
53
Van der Hout C. M. Witbaard R. Bergman M. J. N. Duineveld G. C. A. Rozemeijer M. J. C. Gerkema T. (2017). The dynamics of suspended particulate matter (SPM) and chlorophyll-a from intratidal to annual time scales in a coastal turbidity maximum. J. Sea Res.127, 105–118. doi: 10.1016/j.seares.2017.04.011
54
van der Woerd H. J. Blauw A. Peperzak L. Pasterkamp R. Peters S. (2011). Analysis of the spatial evolution of the 2003 algal bloom in the Voordelta (North Sea). J. sea Res.65, 195–204. doi: 10.1016/j.seares.2010.09.007
55
Van Kessel T. Winterwerp H. Van Prooijen B. Van Ledden M. Borst W. (2011). Modelling the seasonal dynamics of SPM with a simple algorithm for the buffering of fines in a sandy seabed. Continental Shelf Res.31, S124–S134. doi: 10.1016/j.csr.2010.04.008
56
van Rees F. F. Hanssen J. Gamberoni S. Talmon A. M. van Kessel T. (2024). Effect of air exposure time on erodibility of intertidal mud flats. Front. Mar. Sci.11, 1393262. doi: 10.3389/fmars.2024.1393262
57
Witbaard R. Duineveld G. C. A. Bergman M. J. N. Witte H. I. J. Groot L. Rozemeijer M. J. C. (2015). The growth and dynamics of Ensis directus in the near-shore Dutch coastal zone of the North Sea. J. Sea Res.95, 95–105. doi: 10.1016/j.seares.2014.09.008
58
Xu Y. (2019). Approach to the erosion threshold of cohesive sediments. Ocean Eng.172, 183–190. doi: 10.1016/j.oceaneng.2018.11.036
59
Yao H. Y. Leonardi N. Li J. F. Fagherazzi S. (2016). Sediment transport in a surface-advected estuarine plume. Continental Shelf Res.116, 122–135. doi: 10.1016/j.csr.2016.01.014
Summary
Keywords
floc aggregates, fluff layer, sediment, particle size distribution (PSD), LISST 100X
Citation
Safar Z, Chassagne C, Rijnsburger S, Flores RP, Pietrzak JD, Souza AJ, van Kessel T and Horner-Devine A (2025) The role of organic matter on suspended particulate matter dynamics in the Rhine region of freshwater influence. Front. Mar. Sci. 12:1701467. doi: 10.3389/fmars.2025.1701467
Received
08 September 2025
Revised
27 October 2025
Accepted
07 November 2025
Published
04 December 2025
Volume
12 - 2025
Edited by
Xiaoteng Shen, Hohai University, China
Reviewed by
Leiping Ye, Sun Yat-sen University, China
Justus Van Beusekom, Helmholtz Centre for Materials and Coastal Research (HZG), Germany
Updates
Copyright
© 2025 Safar, Chassagne, Rijnsburger, Flores, Pietrzak, Souza, van Kessel and Horner-Devine.
This is an open-access article distributed under the terms of the Creative Commons Attribution License (CC BY). The use, distribution or reproduction in other forums is permitted, provided the original author(s) and the copyright owner(s) are credited and that the original publication in this journal is cited, in accordance with accepted academic practice. No use, distribution or reproduction is permitted which does not comply with these terms.
*Correspondence: Claire Chassagne, c.chassagne@tudelft.nl
Disclaimer
All claims expressed in this article are solely those of the authors and do not necessarily represent those of their affiliated organizations, or those of the publisher, the editors and the reviewers. Any product that may be evaluated in this article or claim that may be made by its manufacturer is not guaranteed or endorsed by the publisher.