There was a mistake in the captions of Figures 1, 3, 4, 9, 10, 11 published. In Figure 1, the global paleogeographic map has been replaced with a new version created using GPlates software to ensure proper copyright compliance. Typographical errors in Figures 3 and 4 have been corrected. Figure 9 caption has been revised to acknowledge the source of the global paleogeographic map included as an inset. Figure 10 and its caption have been modified to correctly credit the conceptual model adapted from Boussagol et al. (2024). The caption of Figure 11 has been updated to cite the source of the global paleogeographic map shown in the inset.
The corrected Figures 1, 3, 4, 9, 10, 11 and their captions appear below.
Figure 1
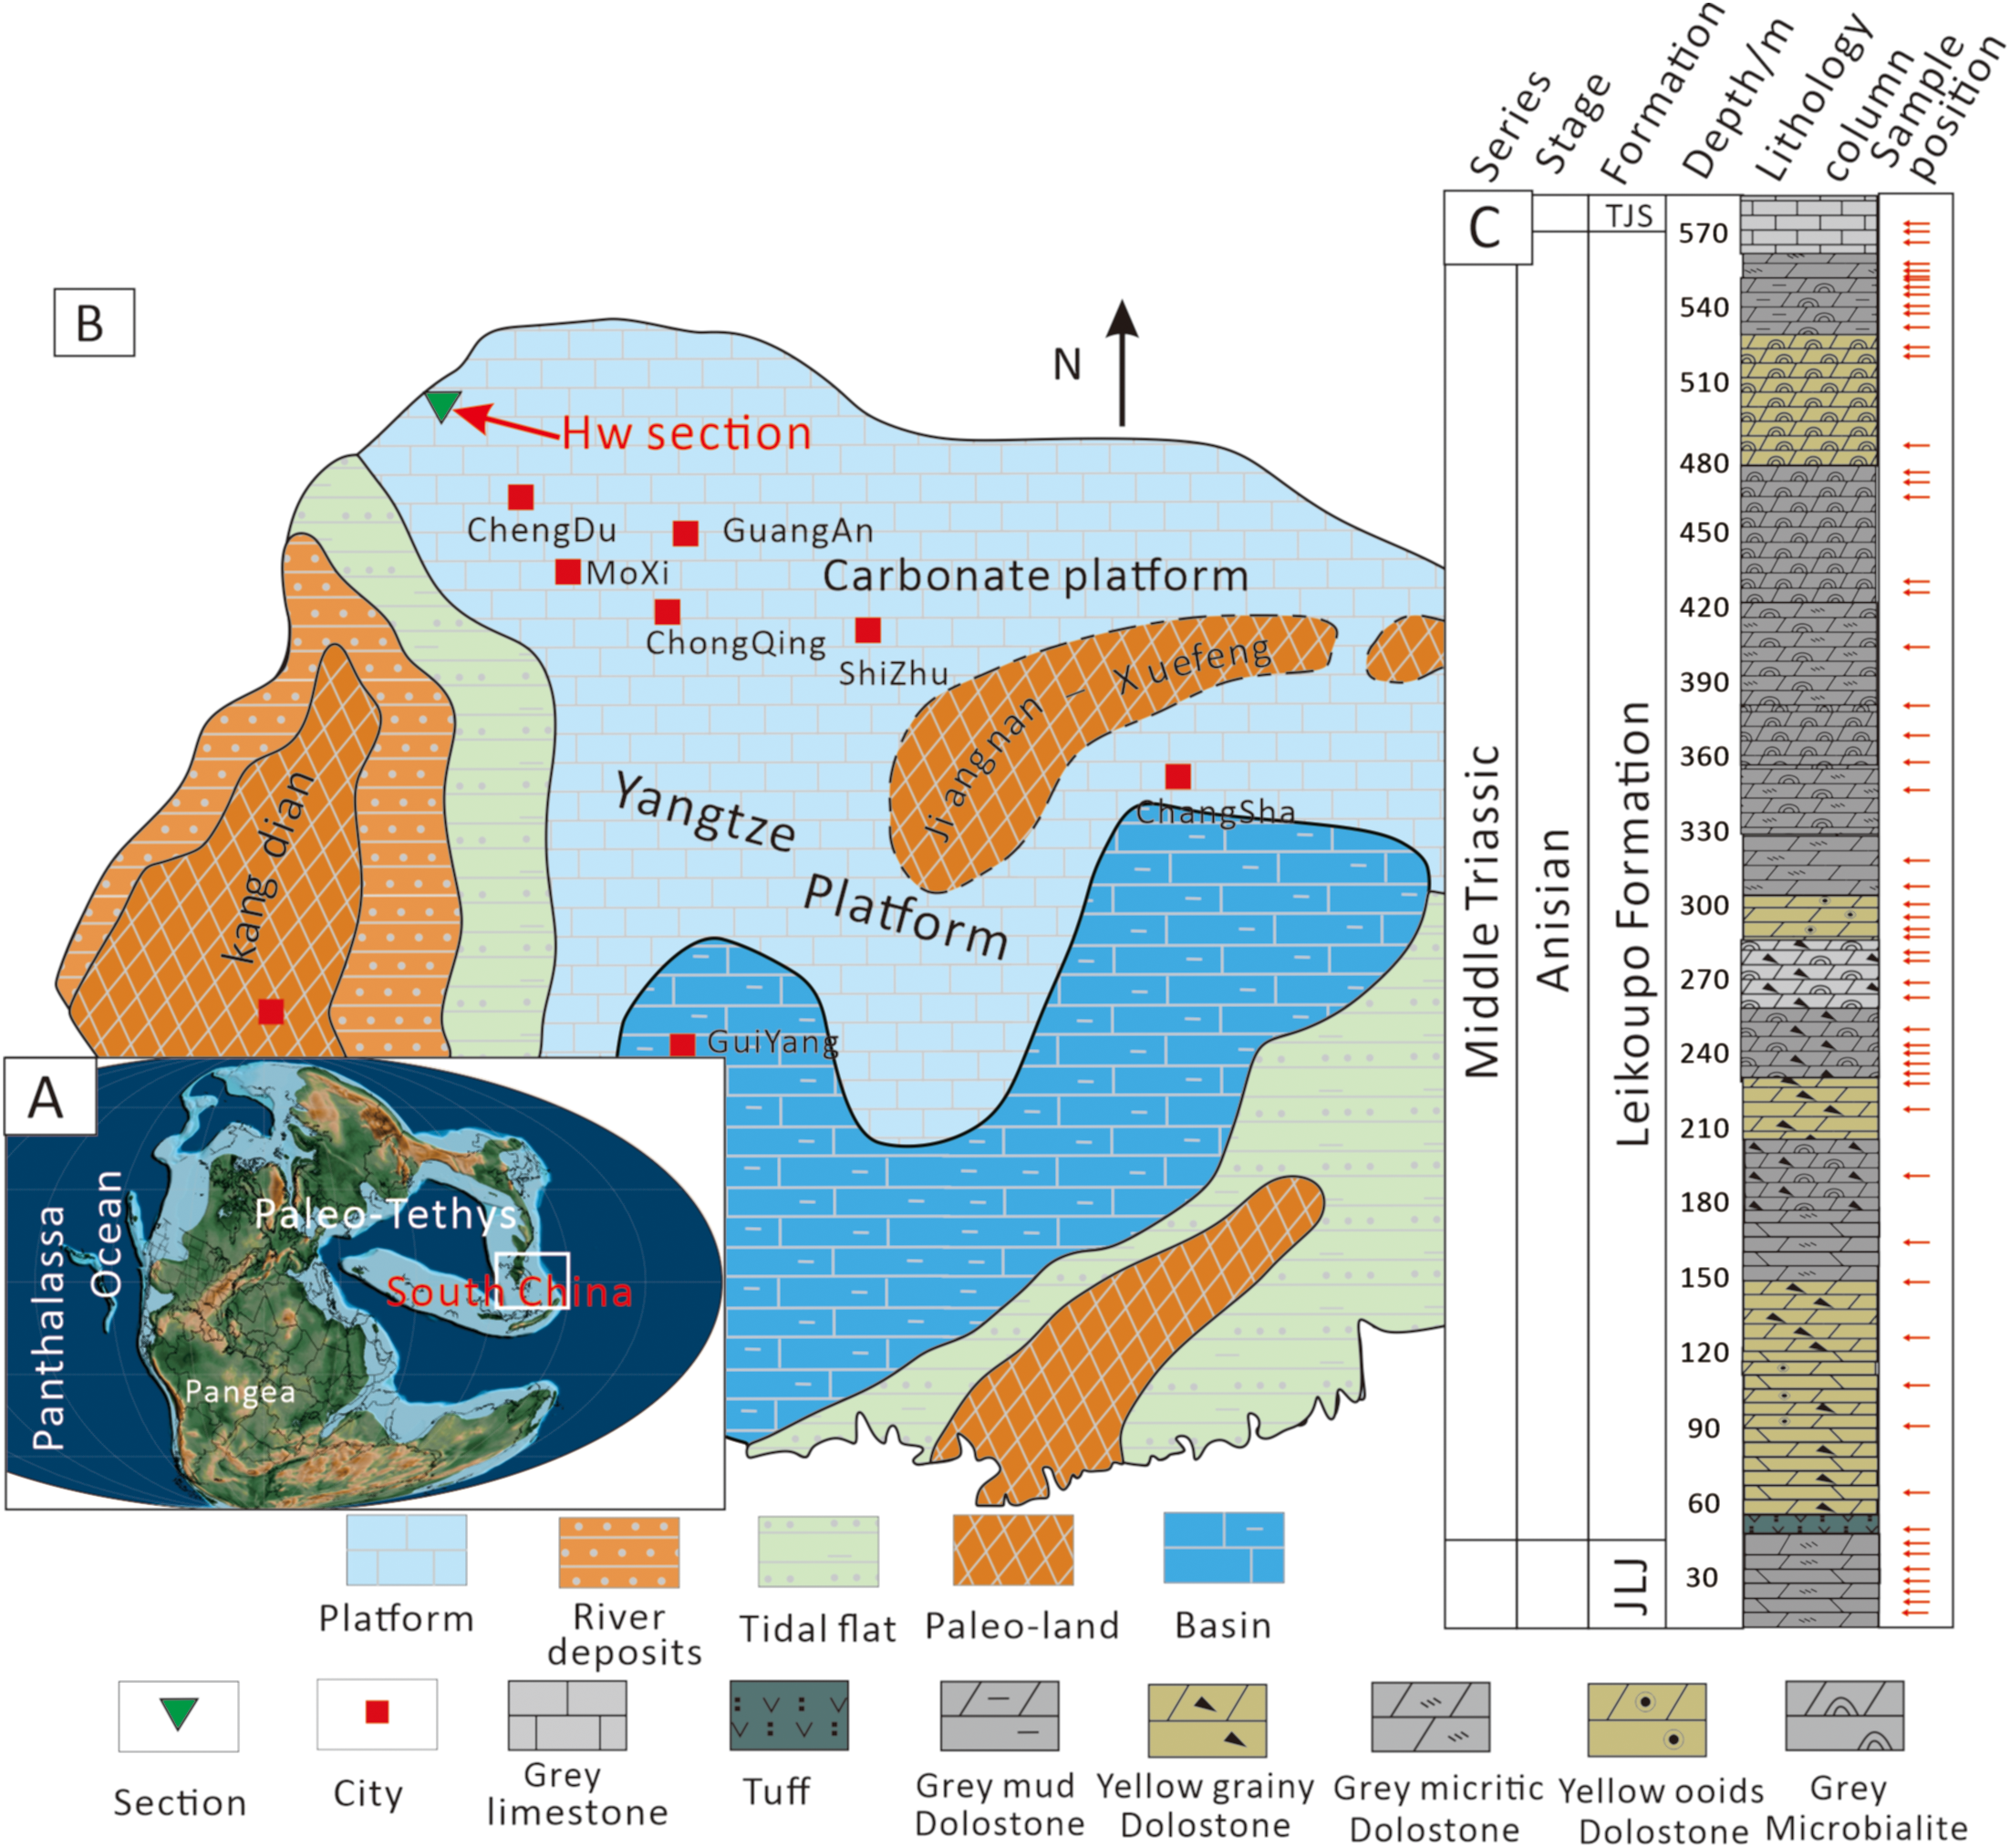
Geological background and stratigraphic column of the study area. (A) Paleogeographic map during the Middle Triassic (~247 Ma). Source: Map generated using GPlates software (https://www.gplates.org) and the latest pyGPlates release (v1.0.0). (B) Lithofacies paleogeographic map of the Middle-Upper Yangtze Platform during the Middle Triassic, showing major blocks and the approximate location of the Hanwang section (red arrow; E104°09’48.10”, N31°27’39.14”). (C) Stratigraphic framework of the Hanwang section showing sampling depths.”
Figure 3
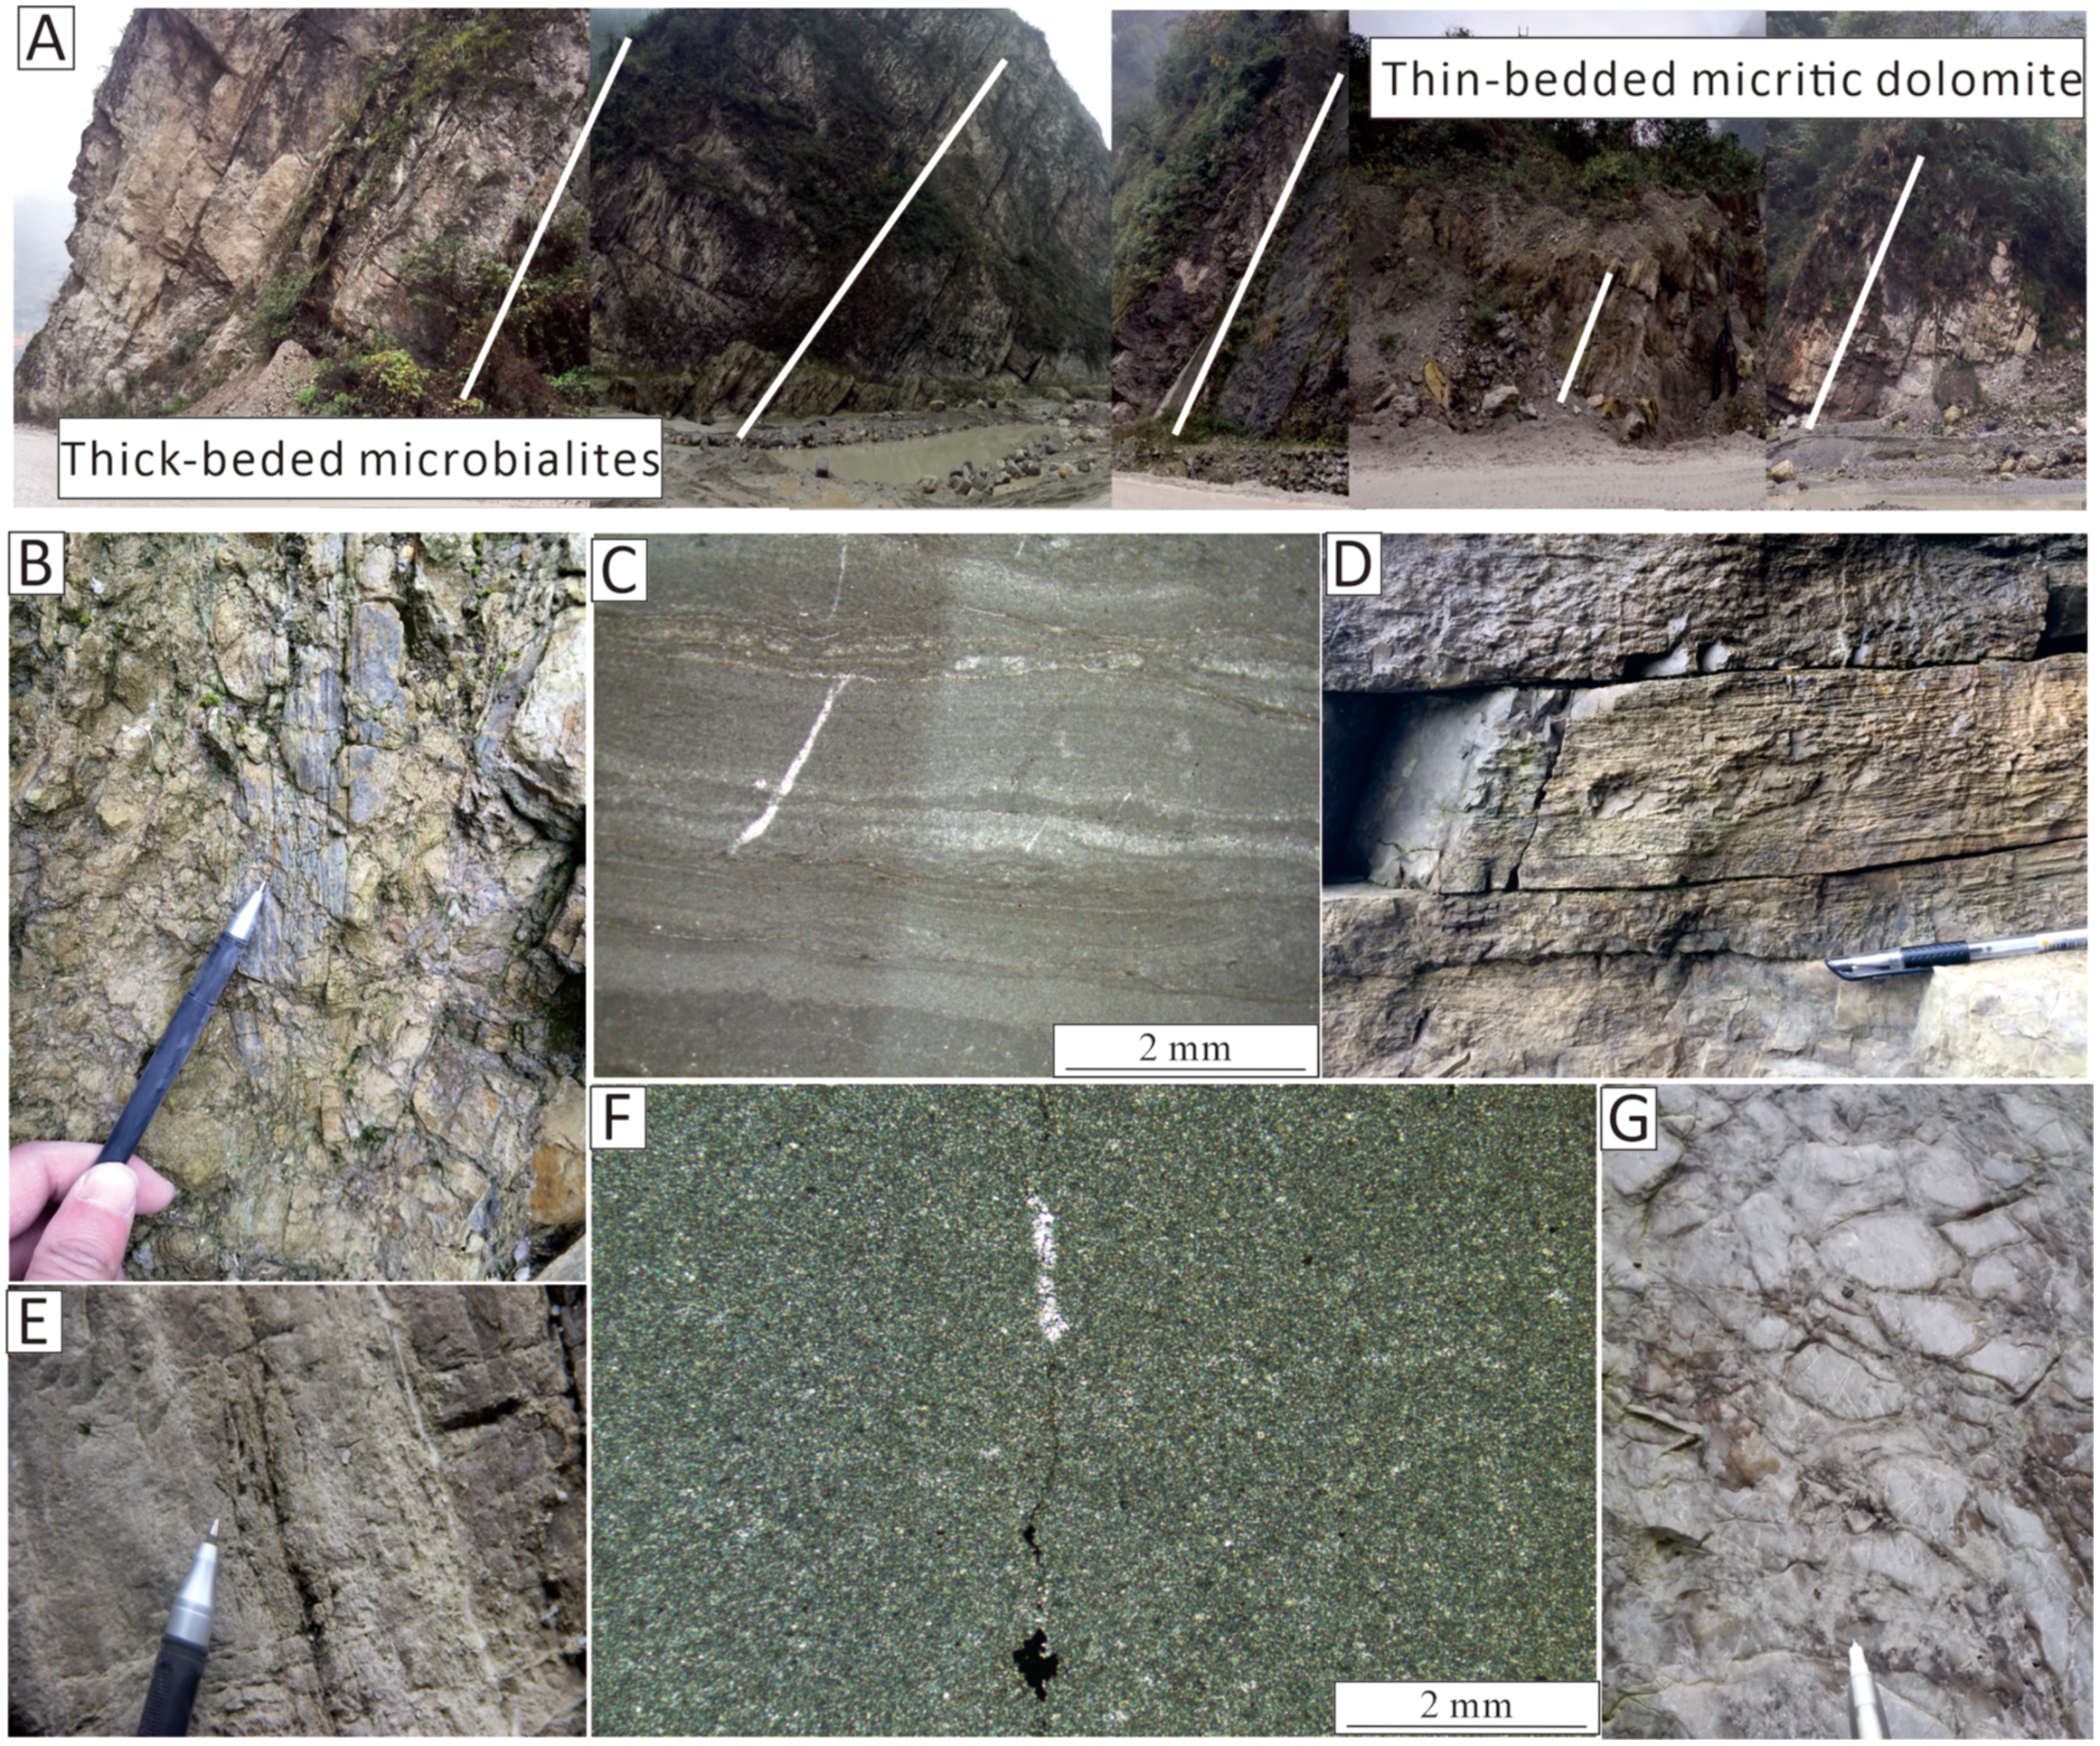
Field photographs of the Hanwang outcrop showing the features of the depositional transition from underlying thin-layered micrite dolostones to overlying thick-layered microbialites. (A) Panoramic macro-photos of HW sections (multiple images stitched together). (B) Horizontal bedding at the bottom of the Leikoupo Formation. (C) Micritic dolostones at approximately 160 m. (D) Layered structure at the bottom of the Leikoupo Formation. (E) Thin dolostone bed interspersed with dolomicrite at the bottom of the Leikoupo Formation. (F) Granular dolostone at 180 m. (G) Bioclastic grain-dominated dolostone at the bottom of the Leikoupo Formation.
Figure 4
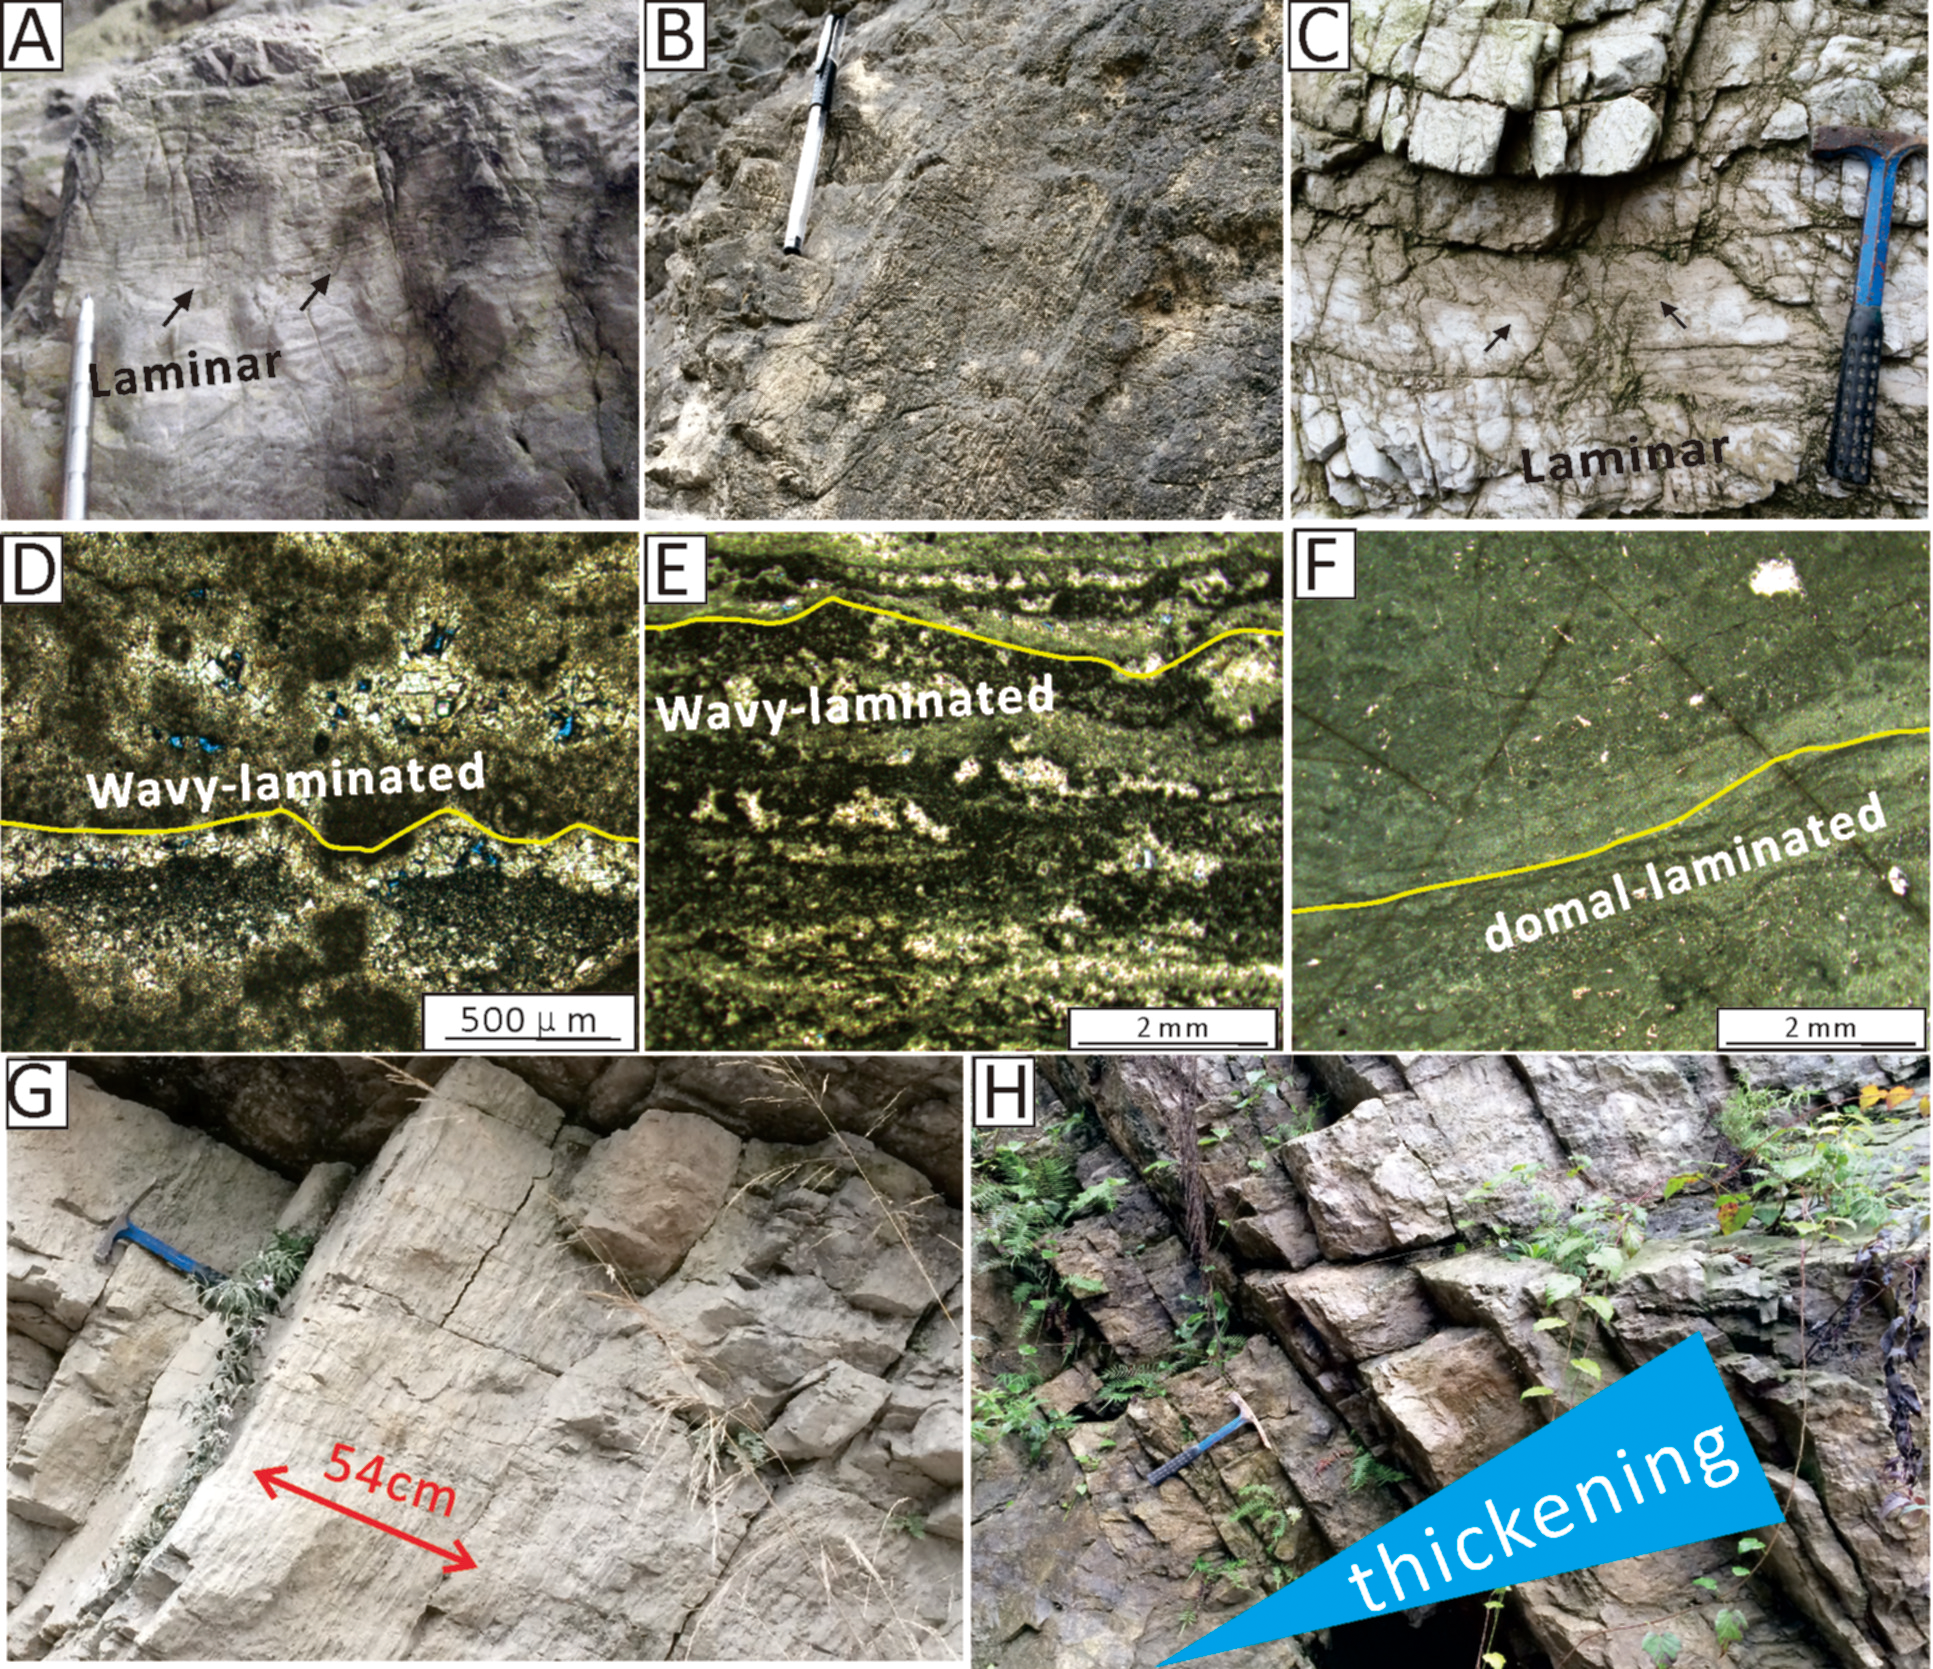
Field photographs of the stromatolite outcrops and thin-section photomicrographs of the Stromatolites. (A) Field photo showing domal stromatolite morphology (HW sample 540 m), interpreted as in-situ microbial buildup. Note that the black arrows indicate the laminar structure formed in the microbialites. The pen is 20 cm in length. (B) Stromatolite with laminar structure at approximately 517 m. (C) Light grey stromatolite with laminar structure in the middle of Leikoupo Formation (approximately 470 m). Note that the black arrow conveys the same meaning. (D) Stromatolite at approximately 420 m. Note that the yellow wavy line represents the structure of wavy-laminated. (E) Stromatolite at 400.15 m. Note that the yellow wavy line represents the structure of wavy-laminated. (F) Dark grey stromatolite at the top of the Leikoupo Formation (approximately 510 m). Note that the yellow wavy line represents the structure of a domal-laminated. (G) The single-layer thickness of Microbialites (approximately 500 m. The geological hammer is ~40 cm in length. (H) Transition from thin layer to thick layer in the middle part of the Leikoupo Formation (approximately 250 m).
Figure 9
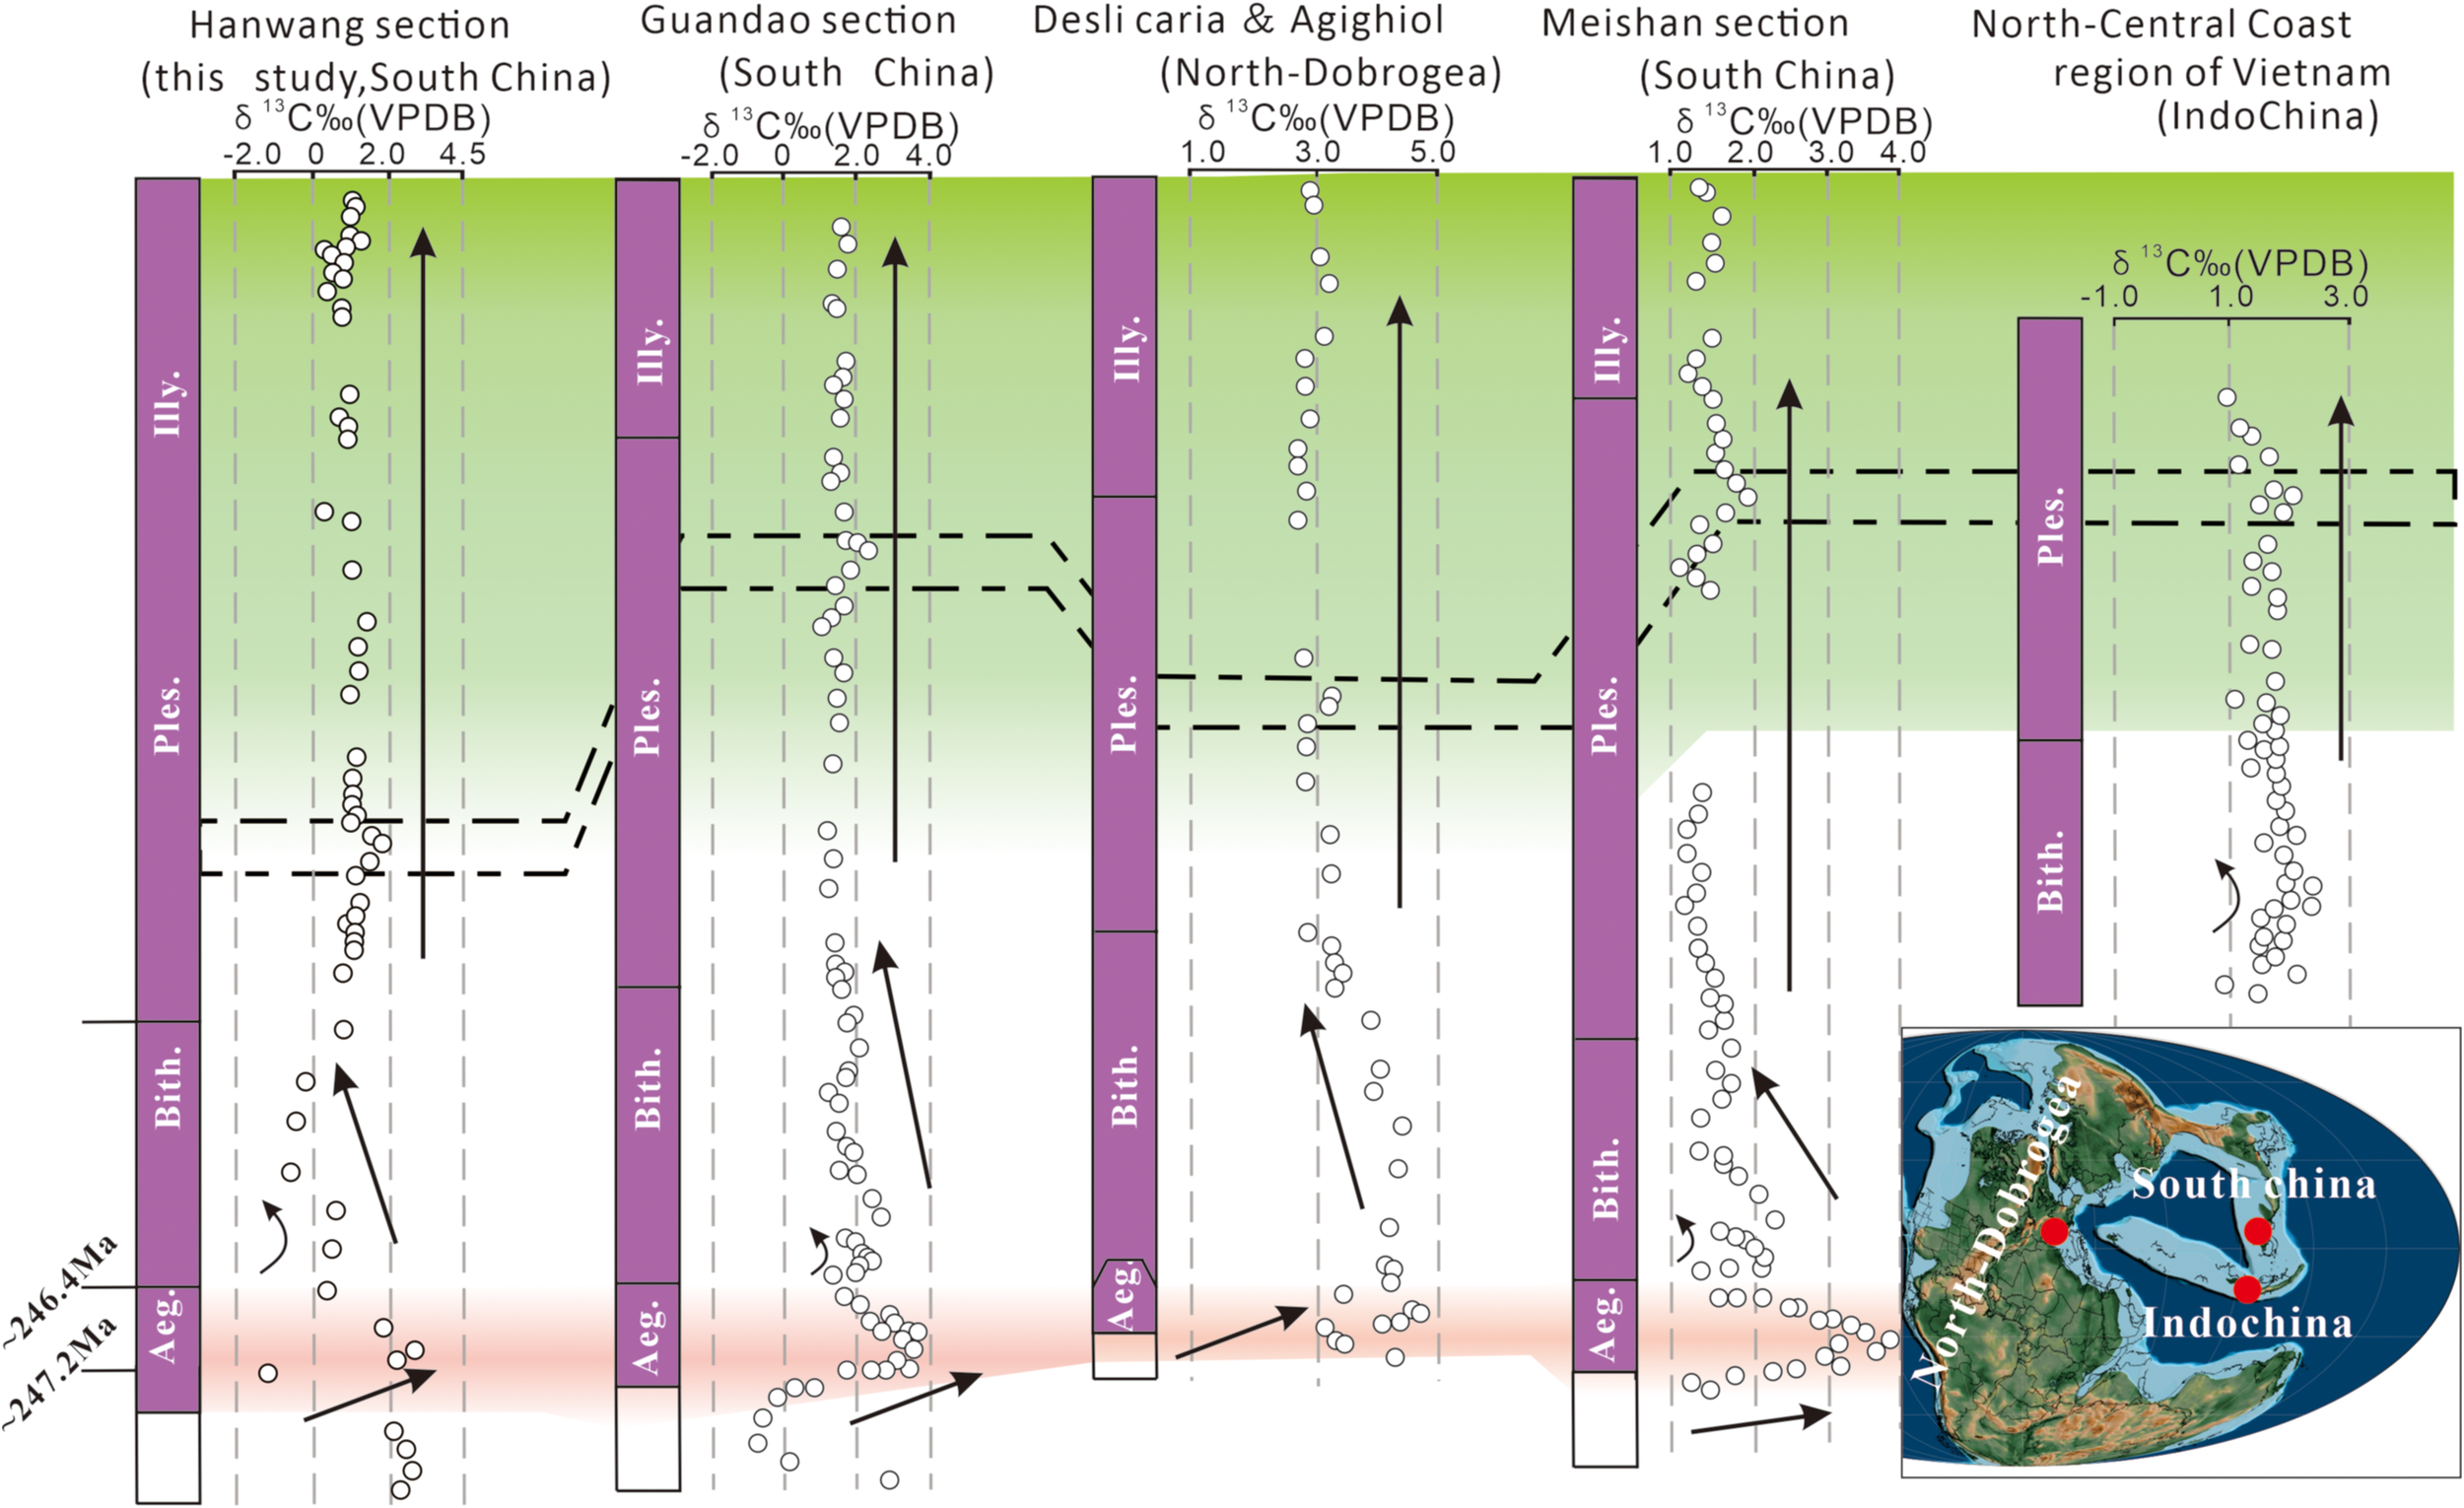
Carbon isotope stratigraphic correlations of the Leikoupo Formation in the HanWang section (this study); the Guandao section from Li et al. (2018); the North-Central Coast region of Vietnam from Ha et al. (2019); the Desli Caira and Agighiol section, North-Dobrogea from Atudorei et al. (1997); Meishan section from Chen and Benton (2012). Source for the global paleogeographic map: As in Figure 1 (https://www.gplates.org).
Figure 10
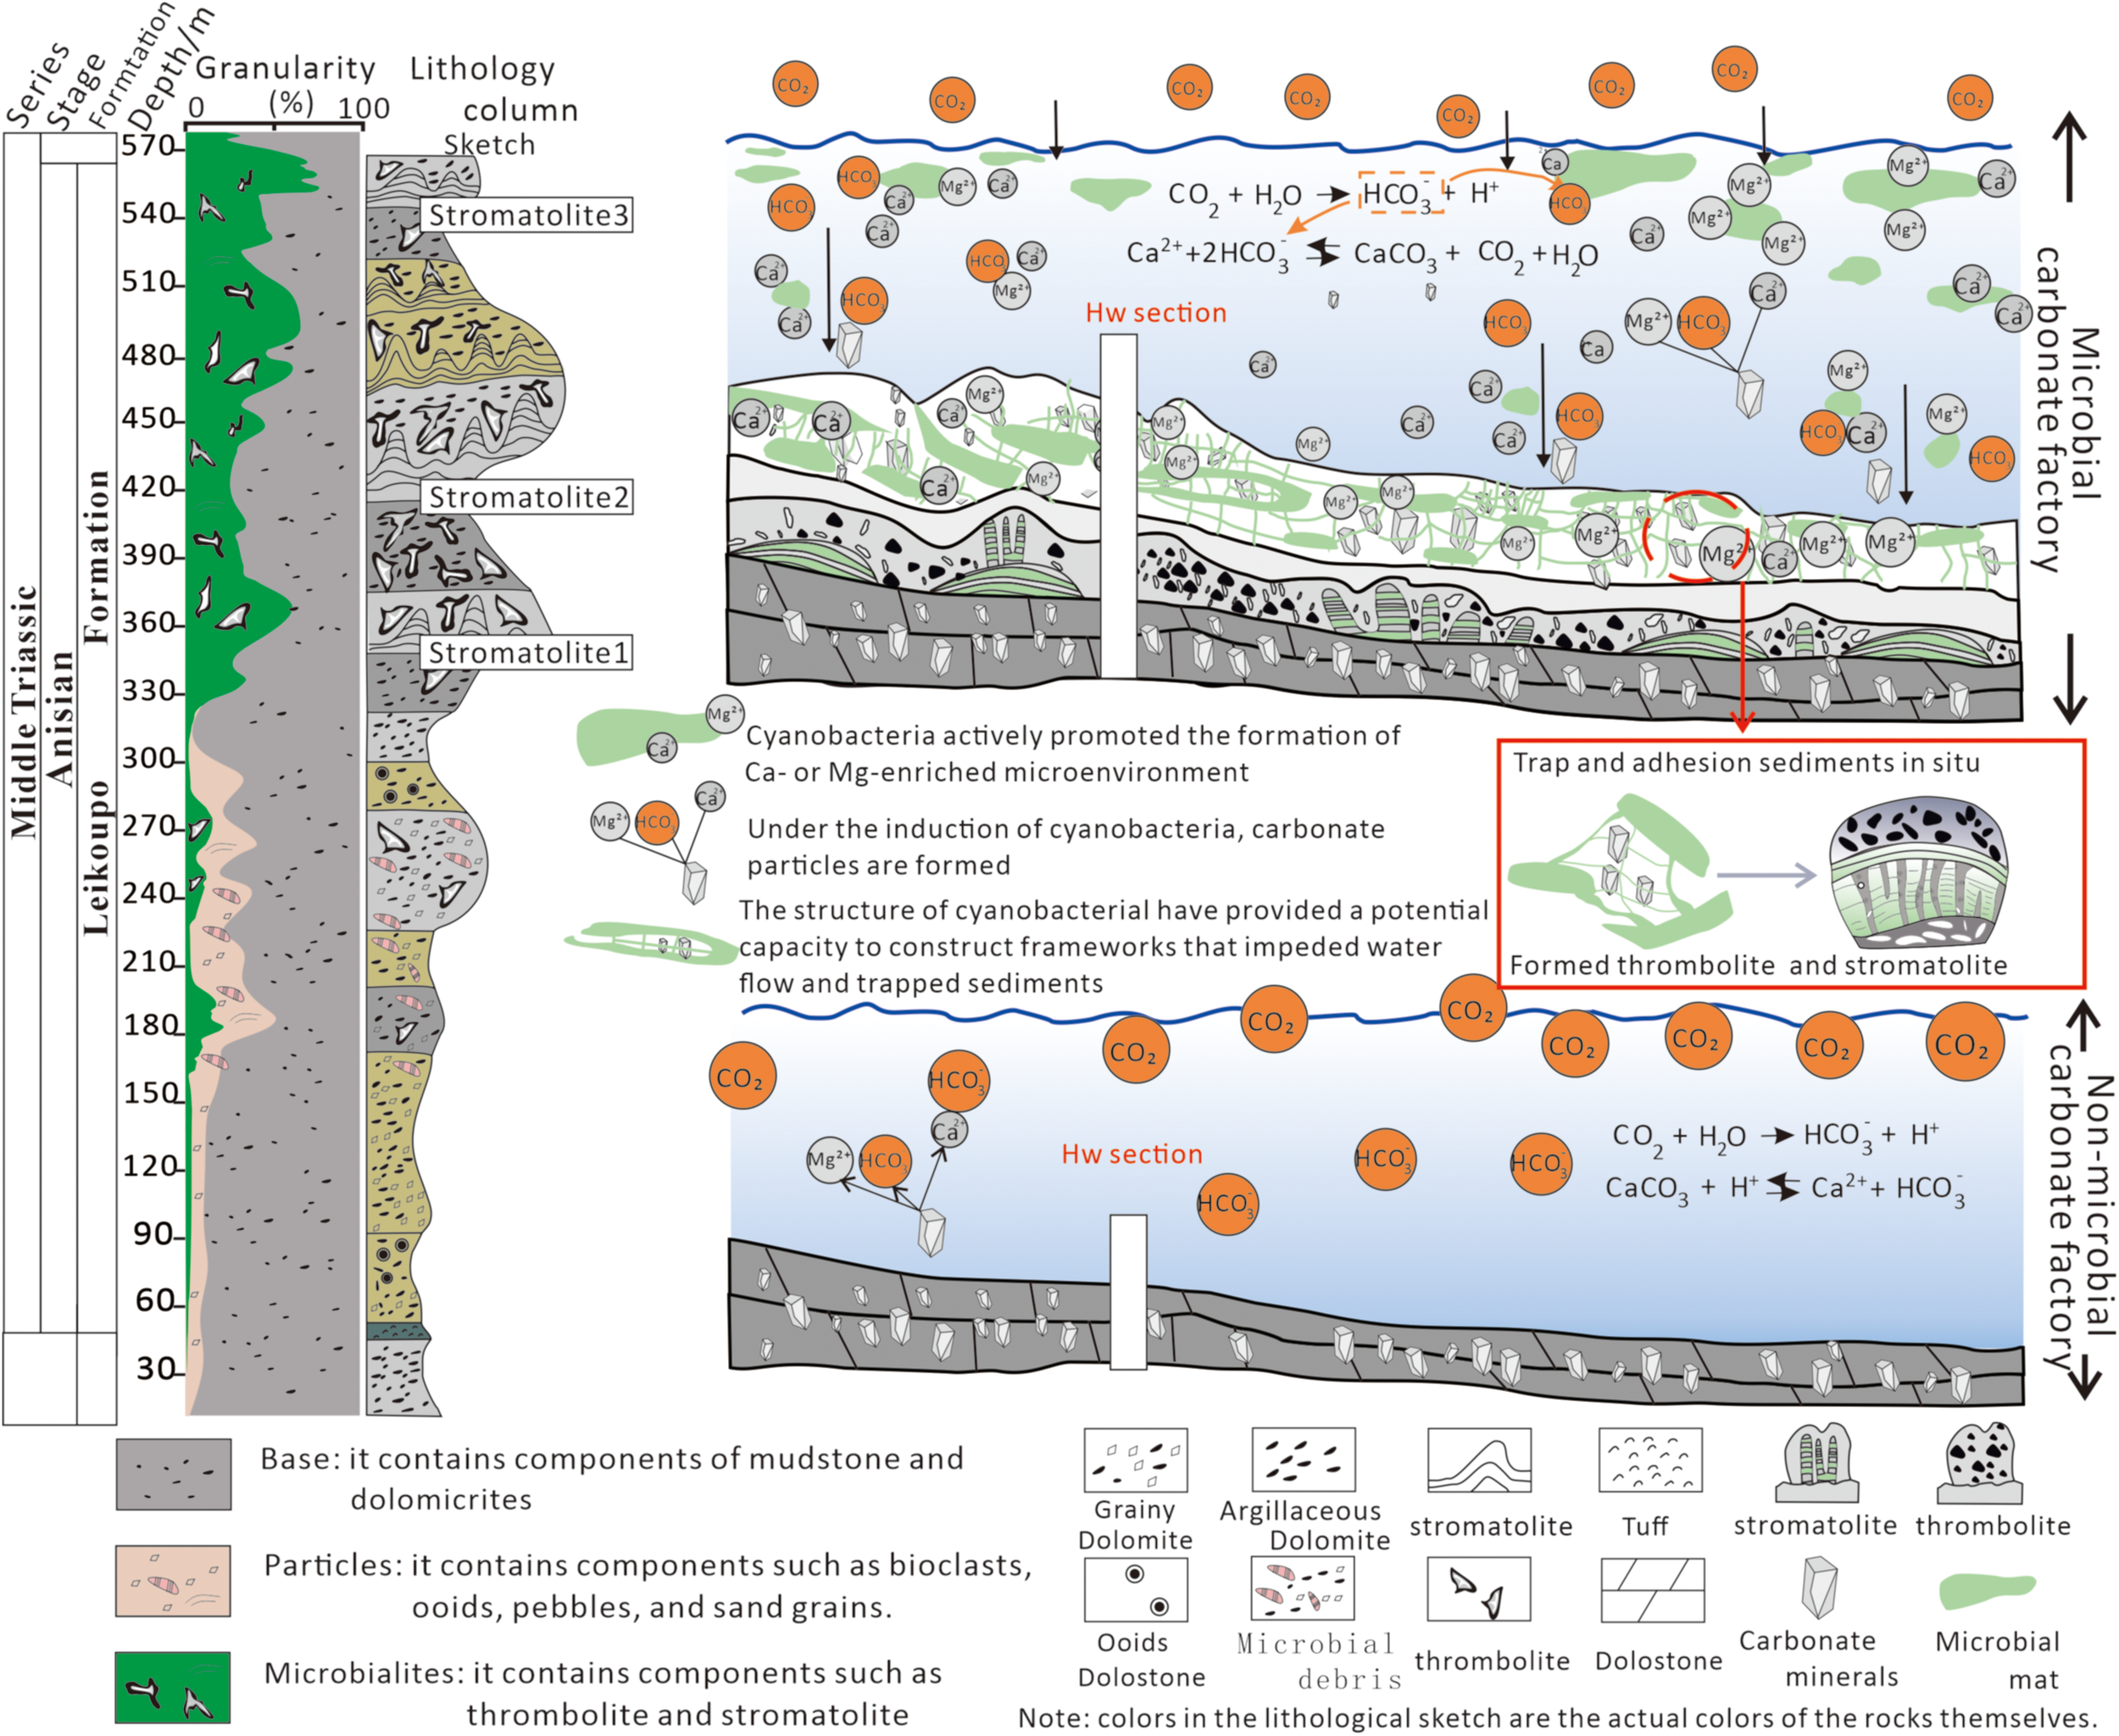
Expansion of microbialites and changes in carbonate factories from the late Early Triassic to the Middle Triassic, as well as the pattern diagram of the formation of stromatolites and thrombolites promoted by microorganisms. Source: Pattern diagram adapted from Boussagol et al. (2024), published under CC BY NC ND 4.0 License.
Figure 11
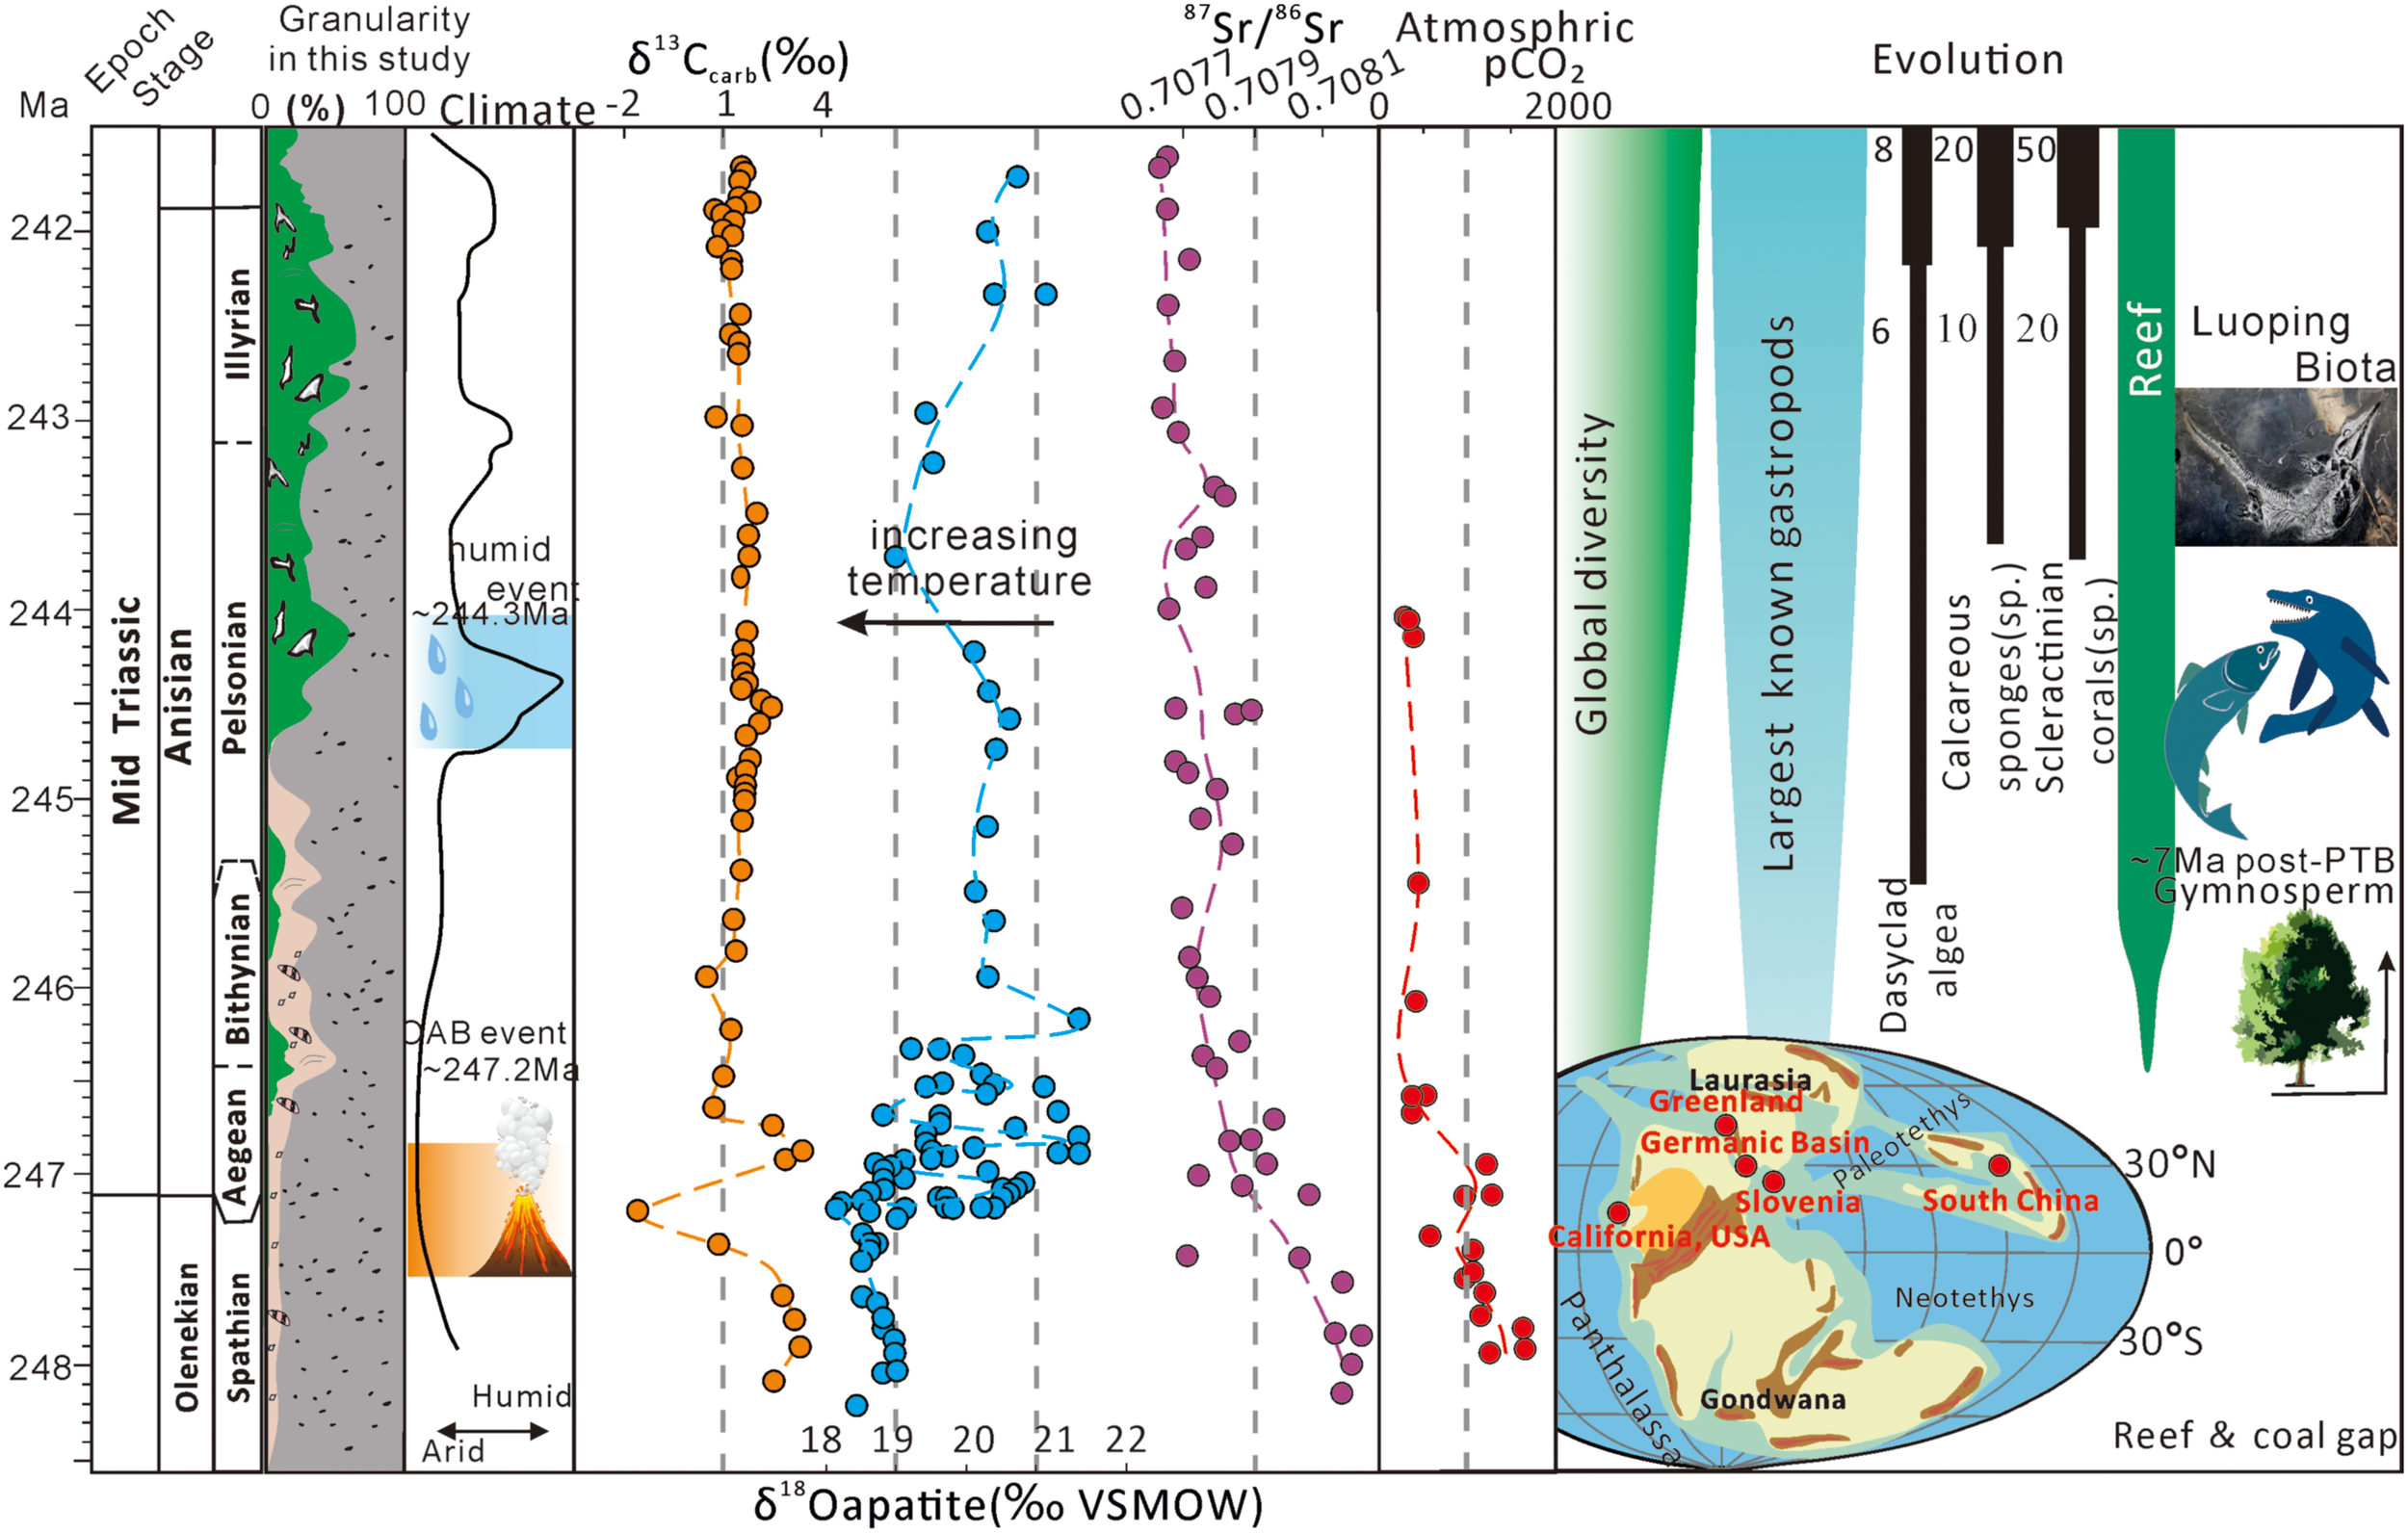
The expansion of the microbial carbon sink coincided with the stabilization of the Middle Triassic climate and the recovery of Earth’s ecosystems. The δ13Ccarb is from this study; δ18Oapatite is from Li et al. (2018); Luoping faunas are from Benton et al. (2013); Reef, Global Diversity, Largest known gastropods and Dasyclad algae are from Flügel (2002) and Payne et al. (2004); Calcareous sponges and Scleractinian corals are from Kiessling, (2010); Reconstruction of atmosphere pCO2 is from Joachimski et al (2022); Climate is from Stefani et al. (2010). Source for the global paleogeographic map: As in Figure 1 (https://www.gplates.org).
Statements
Publisher’s note
All claims expressed in this article are solely those of the authors and do not necessarily represent those of their affiliated organizations, or those of the publisher, the editors and the reviewers. Any product that may be evaluated in this article, or claim that may be made by its manufacturer, is not guaranteed or endorsed by the publisher.
References
1
Atudorei V. Baud A. Crasquin-Soleau S. Galbrun B. Gradinaru E. Mirauta E. (1997). Extended scientific report of the Peri, in Tethys project “The triassic of north dobrogea” (Lausanne: Geological Museum, Lausanne).
2
Benton M. J. Zhang Q. Hu S. Chen Z. Q. Wen W. Liu J. et al . (2013). Exceptional vertebrate biotas from the Triassic of China, and the expansion of marine ecosystems after the Permo-Triassic mass extinction. Earth-Sci. Rev.125, 199–243. doi: 10.1016/j.earscirev.2013.05.014
3
Boussagol P. Vennin E. Monna F. Millet L. Bonnotte A. Motreuil S. et al . (2024). Carbonate mud production in lakes is driven by degradation of microbial substances. Commun. Earth Environ.5, 533. doi: 10.1038/s43247-024-01709-9
4
Chen Z. Q. Benton M. J. (2012). The timing and pattern of biotic recovery following the end-Permian mass extinction. Nat. Geosci.5, 375–383. doi: 10.1038/ngeo1475
5
Flügel E. (2002). Triassic reef patterns. Phanerozoic Reef Patterns72, 391–464.
6
Ha T. T. N. Takayanagi H. Ueno K. Asahara Y. Yamamoto K. Iryu Y. et al . (2019). Litho-, bio-, and chemostratigraphy of the Middle Triassic carbonate succession in the North-Central Coast Region of Vietnam. Earth Planet. Sci.6, 47. doi: 10.1186/s40645-019-0293-y
7
Joachimski M. M. Müller J. Gallagher T. M. Mathes G. Chu D. L. Mouraviev F. et al . (2022). Five million years of high atmospheric CO2 in the aftermath of the Permian-Triassic mass extinction. Geology50, 650–654. doi: 10.1130/G49714.1
8
Kiessling W. (2010). Reef expansion during the Triassic: spread of photosymbiosis balancing climatic cooling. Palaeogeogr. Palaeoclimatol. Palaeoecol.290, 11–19. doi: 10.1016/j.palaeo.2009.03.020
9
Li M. S. Huang C. J. Hinnov L. Chen W. Z. Ogg J. Tian W. (2018). Astrochronology of the Anisian stage (Middle Triassic) at the Guandao reference section, South China. Earth Planet. Sci. Lett.482, 591–606. doi: 10.1016/j.epsl.2017.11.042
10
Payne J. L. Lehrmann D. J. Wei J. Orchard M. J. Schrag D. P. Knoll A. H. (2004). Large perturbations of the carbon cycle during recovery from the end-Permian extinction. Science305, 506–509. doi: 10.1126/science.1097023
11
Stefani M. Furin S. Gianolla P. (2010). The changing climate framework and depositional dynamics of Triassic carbonate platforms from the Dolomites. Palaeogeogr. Palaeoclimatol. Palaeoecol.290, 43–57. doi: 10.1016/j.palaeo.2010.02.018
Summary
Keywords
Middle Triassic, carbonate succession, microbialite, habitable environment, South China
Citation
Wang X, Azmy K, Chen A, Sun S and Li S (2025) Correction: The resilient Middle Triassic habitable climate following Early Triassic severe carbon isotope oscillations: contributions from microbialites, Upper Yangtze Block. Front. Mar. Sci. 12:1703935. doi: 10.3389/fmars.2025.1703935
Received
12 September 2025
Accepted
30 October 2025
Published
12 November 2025
Volume
12 - 2025
Edited and reviewed by
Khan M. G. Mostofa, Tianjin University, China
Updates
Copyright
© 2025 Wang, Azmy, Chen, Sun and Li.
This is an open-access article distributed under the terms of the Creative Commons Attribution License (CC BY). The use, distribution or reproduction in other forums is permitted, provided the original author(s) and the copyright owner(s) are credited and that the original publication in this journal is cited, in accordance with accepted academic practice. No use, distribution or reproduction is permitted which does not comply with these terms.
*Correspondence: Anqing Chen, aqinth@163.com
Disclaimer
All claims expressed in this article are solely those of the authors and do not necessarily represent those of their affiliated organizations, or those of the publisher, the editors and the reviewers. Any product that may be evaluated in this article or claim that may be made by its manufacturer is not guaranteed or endorsed by the publisher.