Abstract
Since the proposal to build a strong maritime country in 2012, China’s marine economy has developed rapidly. This study, using panel data from nine southeastern coastal provinces (1999-2023), employs methods such as the hybrid control-weighting model, kernel density estimation, and factor detection to evaluate the policy effects of building a strong maritime country on coastal regions. Fujian Province exhibits the strongest policy effect, whereas Hainan Province shows a weaker effect due to a narrow industrial structure and lagging technological innovation. Marine informatization is the core driver (q = 0.964), it enhances outcomes through marine technological innovation and industrial optimization. Marine technological innovation and tertiary sector optimization account for 92.6% and 76.9% of the explanatory power, respectively, emphasizing their role in high-quality marine economic development. The study suggests that future policies should focus on enhancing informatization, technological innovation, and optimizing the tertiary sector to advance the construction of a strong maritime country.
Highlights
-
Evaluation of China’s “Strong Maritime Country” policy’s regional economic impacts.
-
Marine informatization drives 96.4% of policy success, boosting technological growth.
-
Technological innovation and tertiary sector optimization key to high-quality marine growth.
1 Introduction
Since the concept of building a Strong Maritime Country (SMC) was proposed in 2012, it has become a core national guide for China’s ocean development (Shi and Ma, 2019; Chen and Zheng, 2021). Driven by national policies, China’s marine economy has seen significant growth. In 2023, the national marine GDP reached 99.1 trillion yuan, accounting for 7.9% of the national economy. This represents an average annual growth rate of 6.82%, compared to 50.05 trillion yuan in 2012. As a key pillar for the construction of a SMC, coastal regions have leveraged their resource endowments and locational advantages (De Vivero and Mateos, 2010; Joshi, 2023) to take the lead in development driven by the blue economy (Lin et al., 2015; Gopal and Alverdian, 2021; That et al., 2023). However, in this process, what role has the construction of a SMC played in the economic and social development of coastal regions? Does its policy effect exhibit regional heterogeneity? Research on the construction of a SMC began shortly after the policy was proposed and has gradually enriched and developed. Focusing on the connotations and practical pathways, policy effect evaluation, and the mechanisms of influencing factors, the research has concentrated on three main directions.
The construction of a SMC, its connotations, and pathways for realization have been studied extensively. Chinese government emphasizes that the core connotation of building a SMC lies in enhancing marine resource development capabilities, promoting marine economic growth, protecting the marine ecological environment, and safeguarding national maritime rights. This has provided scholars with a theoretical foundation and research framework (Jin, 2014; Le Roy et al., 2019). Researchers have further elaborated on the connotations of building a SMC from various perspectives, including marine industries, technology, culture, management, and maritime rights, and have proposed specific pathways for achieving these goals (Tripathy et al., 2024). These include adhering to integrated land-sea planning, promoting technological innovation, and strengthening maritime rule of law (Shinohara, 2010; Mursitama and Ying, 2021; Cariou and Randrianarisoa, 2023; Wang et al., 2024). Additionally, fostering national awareness of the ocean is also regarded as an essential component in advancing the construction of a SMC (Zhang et al., 2023). Scholars have conducted numerous empirical studies on marine economic efficiency, industrial structure optimization, and ecological sustainability, exploring the driving relationship between marine resource development and economic growth (Jambeck et al., 2015; Grzechnik, 2018; Weiskopf et al., 2020; Naylor et al., 2021; Gissi et al., 2021; Tuuri and Leterme, 2023; Wernberg et al., 2024). At the same time, studies have shown that there are significant regional differences in natural endowments, industrial foundations, and policy implementation strength along China’s coastal areas, which results in regional characteristics in the implementation effects of building a SMC.
Recent reference documents the intensifying and shifting trajectories of cumulative human pressures on the ocean. The so-called “blue acceleration” in ocean uses, robust evidence for rebuilding marine life and the triple benefits of protection for biodiversity, fisheries, and climate, and forward-looking assessments of the global ocean-economy (Halpern et al., 2015; Vargas-Fonseca et al., 2024; Jouffray et al., 2020; Duarte et al., 2020; Sala et al., 2021). Framing our analysis against this body of work positions China’s SMC strategy squarely within contemporary debates on sustainability, competitiveness and governance. Regarding the evaluation of the policy effects of becoming a SMC, most current research on the effects of policies related to the construction of a SMC is theoretical, lacking systematic quantitative analysis. While some studies have affirmed the significant importance of building a SMC from the perspectives of regional economics and ecology (Wu et al., 2019; Ye et al., 2020; Yuan et al., 2022; Liu et al., 2023; Grove et al., 2024), the actual impact of policy effects on promoting regional high-quality development still needs further validation.
In recent years, some scholars have attempted to assess the effects using synthetic control methods, finding that these policies have generally promoted economic development in coastal regions (Motta et al., 2021; Gai et al., 2022). However, existing research mainly focuses on macro-level analysis, which struggles to capture the heterogeneous policy effects across different regions. In macro-policy effect evaluations, traditional methods such as simultaneous equation systems, VAR models, and DSGE models are widely used, but they have limitations in causal identification (Bryhn et al., 2020). Recently, scholars have begun to adopt counterfactual frameworks for evaluation, such as the difference-in-differences method and synthetic control method. However, these methods face certain constraints in practice, limiting their applicability (Boone et al., 2023). In this context, the regression synthetic control method proposed by Hsiao et al. combines the transparency of the synthetic control method and the flexibility of regression analysis, making it more suitable for policy evaluation with small-sample macroeconomic data (Wang et al., 2023).
Regarding the mechanisms of influencing factors, while some scholars have explored the roles of factors such as maritime informatization, technological innovation, and industrial optimization in economic growth (Selvaraj et al., 2020; Afonso et al., 2022; Xu et al., 2024), the specific pathways and relative importance of these factors in policy effects remain unclear. Particularly under the context of the transition of the marine economy toward high-quality development, the enhancement of the tertiary sector and its impact on industrial structure optimization require further empirical analysis.
A review of the relevant literature reveals that while the importance of building a strong maritime country has become a consensus, the following research questions still warrant in-depth exploration: First, regional heterogeneity of policy effects. Current studies on the policy effects of the SMC rarely focus on the differences observed across coastal provinces during policy implementation. Coastal regions differ significantly in terms of resource endowments, economic foundations, and policy responsiveness, which may lead to regional disparities in policy effects. However, existing research has mainly concentrated on overall trends at the macro level, making it difficult to capture the specific performances of different provinces. Second, the innovative application of research methods. Existing policy effect evaluation methods mainly focus on traditional econometric models, lacking the application of innovative methods. The Hybrid Control-Weighting (HCW) model, as a novel tool that combines synthetic control methods with regression analysis, has significant advantages in the counterfactual analysis of policy effects, yet its application in the marine economy field remains unexplored.
In response to the limitations of previous studies, this paper focuses on the nine provinces along the southeast coastal region of China. Using provincial panel data from 1999 to 2023, an empirical evaluation of the policy effects of the strategy for building a strong maritime country is conducted using the HCW model. By combining methods such as Kernel Density Estimation (KDE) and the factor detector, this study explores the temporal and spatial evolution characteristics of the policy effects and their influencing factors. The aim is to reveal the regional heterogeneity and underlying patterns of the strategy’s implementation at the regional level. This study uses the 8 provinces along the southeast coast as examples to provide a detailed evaluation of the policy effects across coastal provinces, revealing regional differences and their mechanisms. Through a comprehensive quantitative and qualitative analysis, the key factors influencing the policy effects and their pathways are identified. The innovative application of the HCW model provides a reference for the expansion of policy evaluation methods.
China’s SMC construction is a national policy. Yet national objectives through policy mobility processes in which ideas, instruments and standards circulate across scales and are translated by local actors into specific packages. Research shows that policies rarely move intact, they are selectively adopted, adapted and recombined. In parallel, polycentric governance theory posits that complex systems are governed by multiple centers of decision-making whose interactions generate variation in implementation and outcomes. Taken together, these lenses predict variegated local effects under a uniform national goal precisely the pattern we document for SMC across provinces. Our research design is therefore well suited to capture province specific translations of a national strategy and to link effect sizes to enabling capabilities. Firstly, situating SMC within policy mobility clarifies local assemblages of institutions, data systems, and industries mediate how national instruments work in practice. Secondly, viewing SMC through polycentric governance highlights the value of coordination and shared indicators when aligning diverse centers of decision-making, improving interoperability with international practices.
This study advances the literature in two ways relative to prior work. First, we introduce a regression-assisted synthetic control (HCW) design that produces unit-level counterfactuals for coastal provinces and achieves high pre-2013 fit, improving identification over macro-trend approaches and complementing earlier single-context evaluations. Second, we provide the first integrated empirical comparison across four key coastal provinces over 1999–2023, delivering transparent, province-specific effect paths and robustness diagnostics including in-time and in-space placebos and pre-trend balance, aligned with best practice in SCM/DiD research (Hsiao et al., 2012; Callaway and Sant’Anna, 2021; Arkhangelsky et al., 2021).
2 Materials and methods
2.1 Study area and data sources
This study is based on panel data from eight provinces (autonomous regions) in southeastern China from 2000 to 2023, including Hainan, Guangdong, Guangxi Zhuang Autonomous Region, Fujian, Jiangxi, Hunan, Guizhou, and Yunnan (Figure 1). Among these, the four coastal areas are directly affected by the policy effects of the important discourse on becoming a SMC, and thus, these four provinces (autonomous regions) are selected as the experimental group. According to the assumptions of the HCW model, the control group must meet two conditions: firstly, the cross-sectional data of the control group should be influenced by common factors with the experimental group; secondly, the economic performance of the control group should not be significantly influenced by the policy effects, or the impact should be minimal. Therefore, four inland provinces are chosen as the control group.
Figure 1
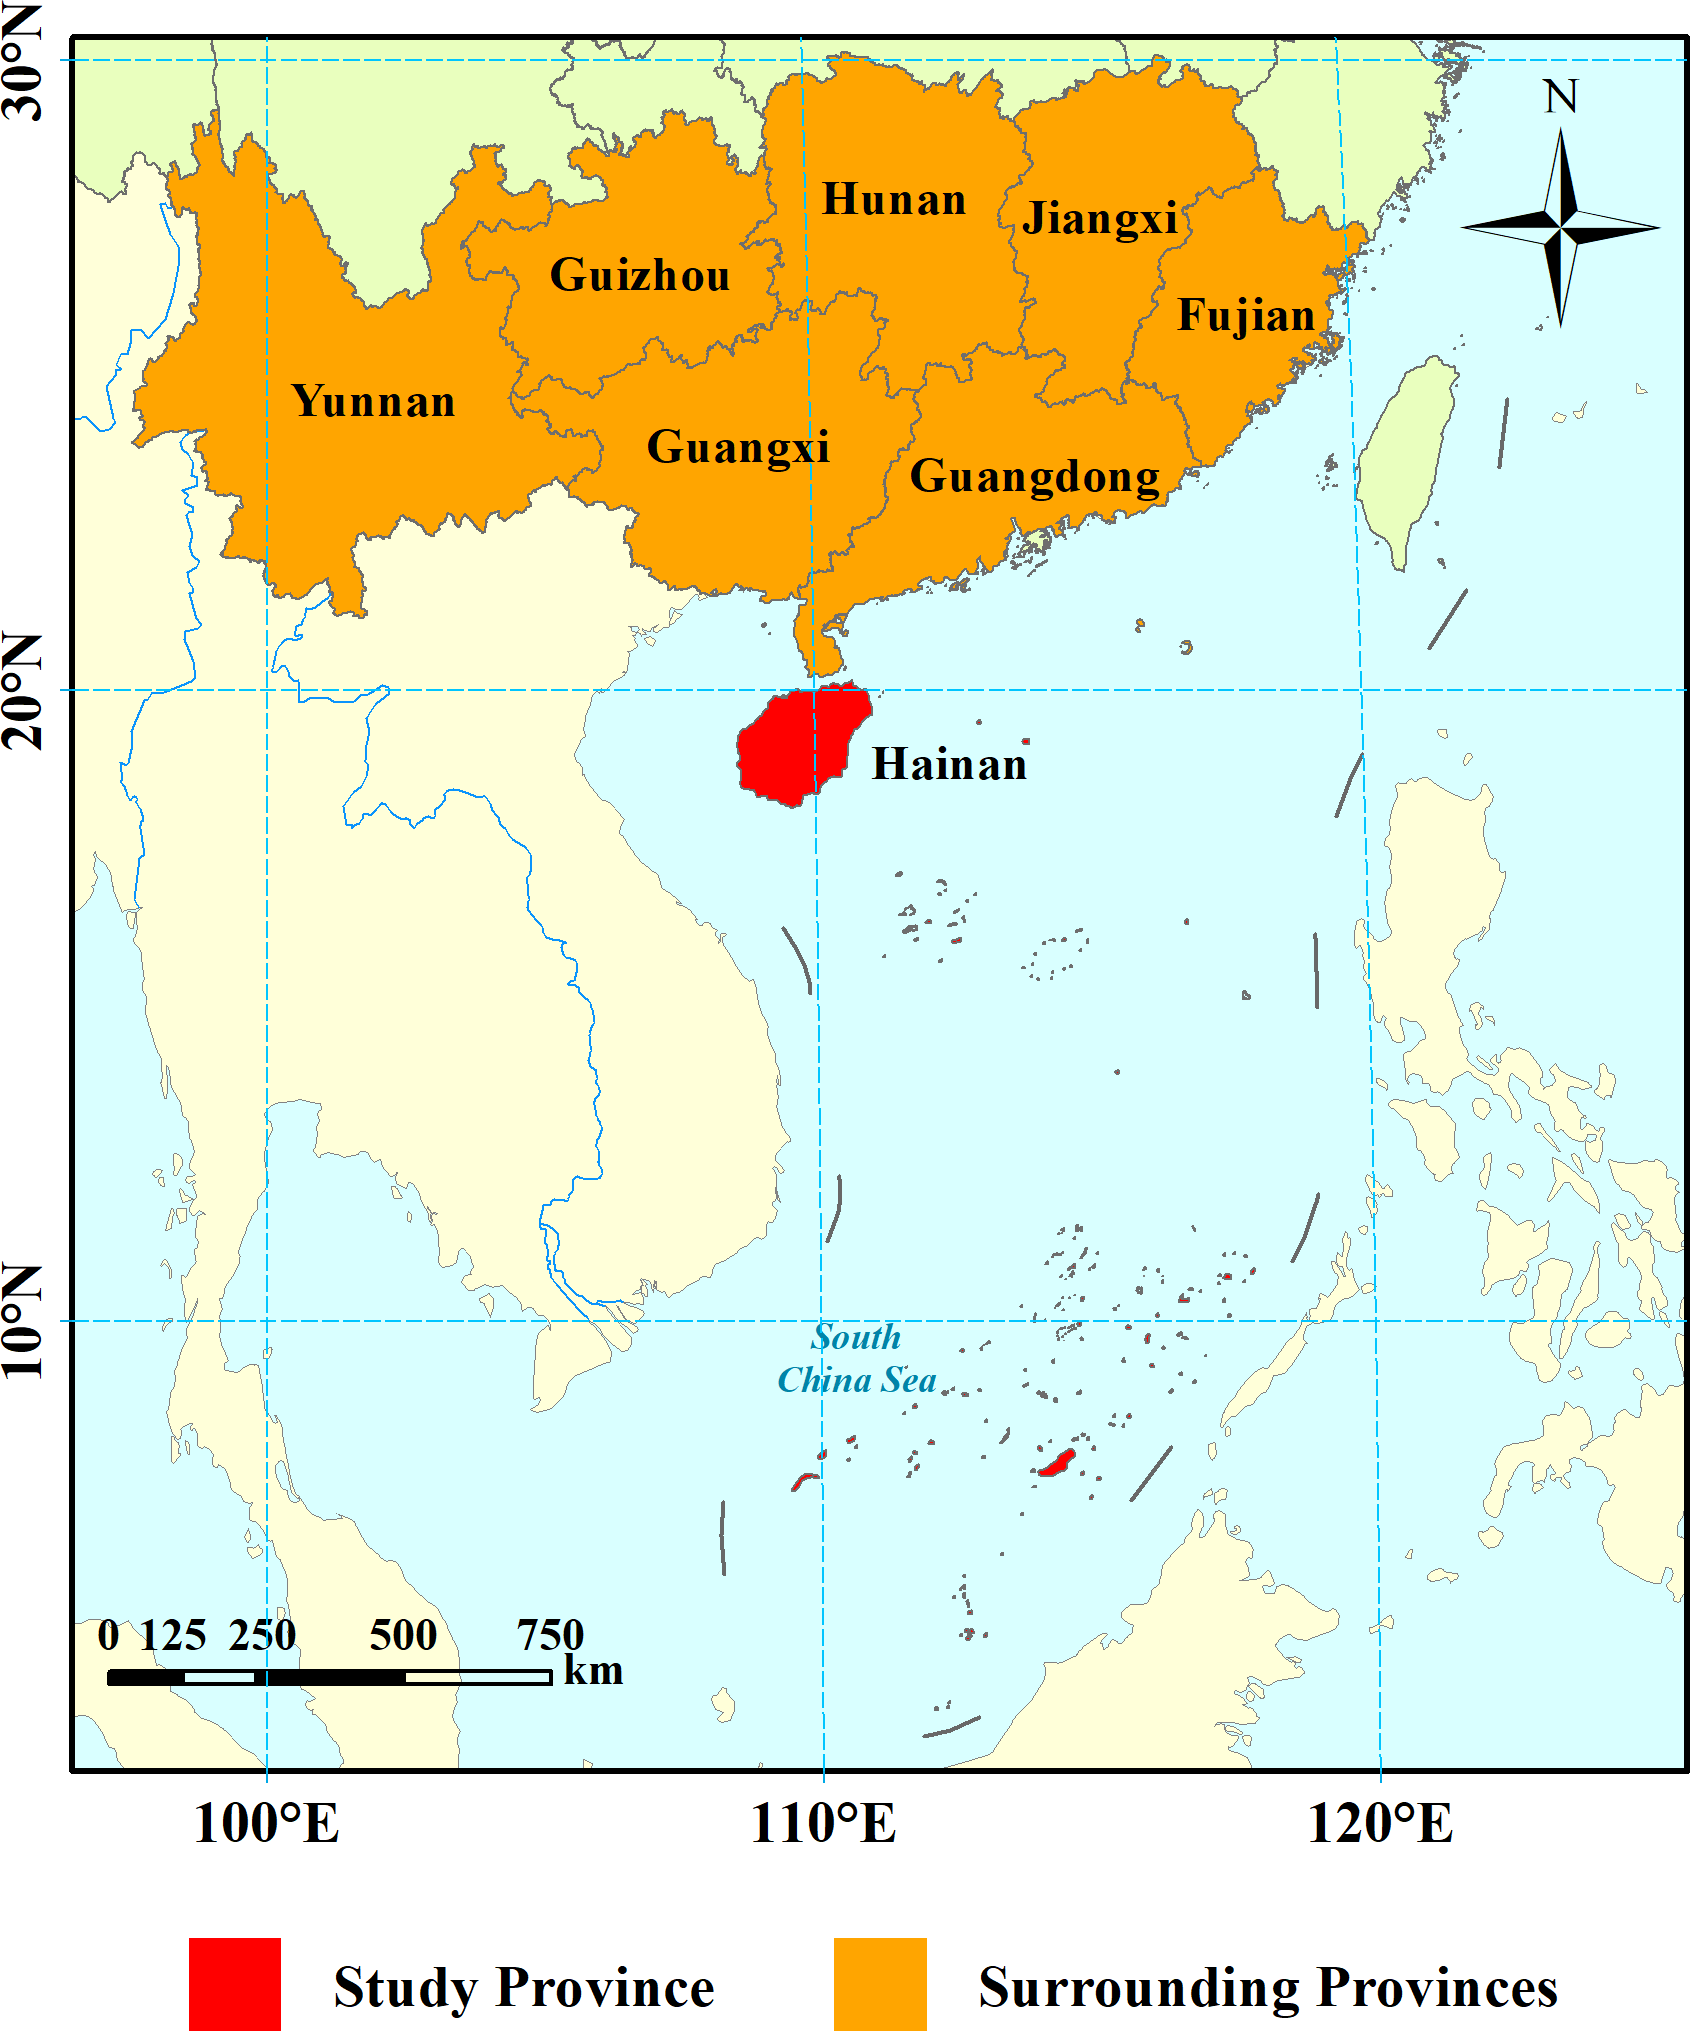
Research area location map.
We focus on November 2012, when the Report to the 18th CPC National Congress first formally set the goal to “build China into a maritime power,” with implementation subsequently advancing through coastal jurisdictions and ocean related sectors. Accordingly, treated units are restricted to southeastern coastal provinces, and control group are drawn from inland provinces without a coastline where direct maritime instruments do not apply. From the southeastern inland jurisdictions we select Jiangxi, Hunan, Guizhou, and Yunnan because they lack direct jurisdiction over marine functional zones and exhibit negligible marine-industry shares in official statistics minimizing policy exposure. While their geographic proximity to the treated provinces provides comparable macro conditions and strengthens the plausibility of shared common factors required for panel factor-model counterfactuals. The concept of SMC was first introduced in November 2012. Considering the potential lag in policy effects, this study designates the period from 2000 to 2012 as the observation period, with 2013 to 2023 as the window period. The data used primarily come from sources such as the China Statistical Yearbook and the China Marine Statistical Yearbook for the years 2000 to 2023. Data collection, collation, and analysis for this study were conducted in accordance with the guidelines presented in Table 1.
Table 1
| Variable symbols | Variable names | Specific indicators |
|---|---|---|
| X1 | Marine Resource Endowment | Standardized representative resource quantity multiplied by corresponding weight |
| X2 | Marine Industry Optimization | The ratio of the marine tertiary industry to the secondary industry |
| X3 | Marine Human Resources | Number of students enrolled in marine-related undergraduate programs and above |
| X4 | Marine Technological Innovation | Internal R&D expenditure of marine research institutions |
| X5 | Marine Informatization Construction | Number of internet broadband access ports |
| X6 | Degree of Openness | Ratio of total import value to GDP |
The influencing factors of policy effects on the construction of SMC.
2.2 Core variables and influencing factors
Based on the policy text analysis, it is clear that the development of the marine economy is an important intrinsic requirement and indicator for implementing the principle of “coordinating land and sea development and accelerating the construction of SMC.” To evaluate the impact of policy effects on economic growth in coastal areas, this study uses the actual per capita GDP growth rate as the outcome variable. This indicator comprehensively reflects the scale and efficiency of regional economic growth. To eliminate the interference of price factors, the study uses the GDP deflator with 2000 as the base year. The distribution of the policy effects of the important discourse on the construction of a strong maritime country in coastal provinces shows significant spatial heterogeneity. The economic and social development levels, as well as the technological innovation capabilities, within the region are key factors influencing the practical outcomes of the strong maritime country discourse. Based on existing relevant literature (Deng et al., 2020; Ali et al., 2024), and following the principles of scientific rigor and data availability, six variables have been selected as indicators for assessing the policy effects (Table 1).
Within the SMC strategy, marine informatization, technological innovation, and industrial optimization form an integrated pathway from capabilities to outcomes. Marine informatization build-out of digital infrastructure, data platforms, and information services for the ocean to reduces information frictions, improves real-time monitoring and coordination, and raises operational efficiency in ports, fisheries, and environmental management. Technological innovation measured through R&D investment and knowledge outputs to translates data and analytics into new products, processes, and management tools, with growing evidence that marine technology innovation promotes high-quality development in coastal regions (Miedtank et al., 2024). Industrial optimization shift toward a more advanced and rationalized structure with a larger role for high-value services to consolidates these gains by reallocating factors to more productive activities and expanding service linkages across the blue economy (Wang et al., 2023; Zhang et al., 2024). The study period spans from 2013 to 2023.
Marine resources provide the essential material conditions for the development of the maritime economy, with resource supply serving as the foundational guarantee and fundamental support for the construction of a strong maritime country. Against the backdrop of intensifying global resource competition and severe challenges to the marine ecological environment, the full utilization and rational development of marine resources can effectively promote the sustainable development of national economy and technology. The calculation formula is as follows:
In Equation 1, the variables represent the output of marine capture fisheries, mariculture production, marine crude oil, natural gas, marine mining, and sea salt production. These are the data after normalization, with each indicator assigned a weight of 0.2. China’s marine economy is undergoing a transformation, as emphasized by the central government, from a growth model based on speed and scale to one focused on quality and efficiency. The optimization of the marine industrial structure directly influences the development of a SMC and the high-quality growth pattern. On the one hand, optimizing the marine industry can improve resource allocation efficiency, enabling the intensive and efficient utilization of resources. On the other hand, optimizing the marine industry promotes the formation of industrial clusters, providing new momentum for regional economic development. Therefore, the ratio of the output value of the marine tertiary industry to that of the marine secondary industry is selected to reflect the degree of optimization in the marine industrial structure.
In the era of the knowledge economy, particularly within the practice of marine administrative management, there is an increasing emphasis on advancing governance capacity and modernizing governance systems. Building a high-quality maritime talent pool provides essential intellectual support for the development of SMC. Furthermore, a well-developed pool of marine human resources not only enhances China’s voice in global maritime affairs but also strengthens its ability to address complex marine challenges, offering professional support for global ocean governance. Accordingly, the number of undergraduate and postgraduate students enrolled in marine-related programs is selected as an indicator of marine human resources.
As global competition for marine resources intensifies, marine science and technology have become the primary driving force behind high-quality marine economic development. However, the development and utilization of marine resources in China still face significant technological and efficiency bottlenecks. Through technological innovation in areas such as deep-sea exploration and the development of marine renewable energy, the depth and breadth of marine resource utilization can be substantially improved, thereby providing a solid resource foundation for the national economy. Therefore, internal R&D expenditures of marine research institutions are selected as an indicator to reflect the intensity of marine science and technology investment.
The demand for informatization in building SMC has become increasingly pronounced. Maritime informatization serves as a critical tool for enhancing the efficiency of marine resource exploitation, environmental protection, disaster prevention, and security management. By establishing marine ecological monitoring networks and strengthening data sharing, improvements in maritime informatization can effectively enhance the protection and restoration of marine ecosystems. Moreover, it significantly improves maritime disaster early-warning capabilities and emergency response efficiency. Therefore, this study uses the number of broadband internet access ports as an indicator to measure the level of maritime informatization development in different regions.
Expanding openness to the outside world is an inherent requirement for building SMC in the era of globalization. Openness facilitates the exchange and substitution of technology, information, and resources, injecting new momentum into economic growth. Specifically, greater openness promotes technological advancements and innovation in the maritime domain, enhances national participation in global ocean governance, stimulates maritime economic development, extends the marine industrial chain, and strengthens the agglomeration effects of marine industries. In this study, the proportion of total import and export value to GDP is used as an indicator to measure the degree of openness.
2.3 HCW model
Our implementation follows the regression-assisted synthetic control logic in Hsiao et al. (2012), which uses observed donor units to approximate the unobserved counterfactual under a panel factor-model, thereby combining the interpretability of SCM with the flexibility of regression. The HCW model is a counterfactual method based on panel data, combining the Synthetic Control Method (SCM) and regression analysis as a new econometric approach (Hsiao et al., 2012) (Figure 2). It is used to evaluate the impacts of public policies and interventions, particularly effective in small-sample or panel data scenarios. For each treated coastal province, we first use policy data from 2000 to 2012 to learn a regression-assisted synthetic control from inland provinces. The algorithm searches candidate control group sets and chooses the specification that minimizes in-sample prediction error by AIC. The resulting regression coefficients summarize how the control group combines to replicate the treated unit’s pre-2013 trajectory. We then predict the counterfactual path for 2013–2023 by applying the estimated relationship to the control group’s post-2012 data. The yearly policy effect equals the difference between the observed outcome and this HCW counterfactual.
Figure 2
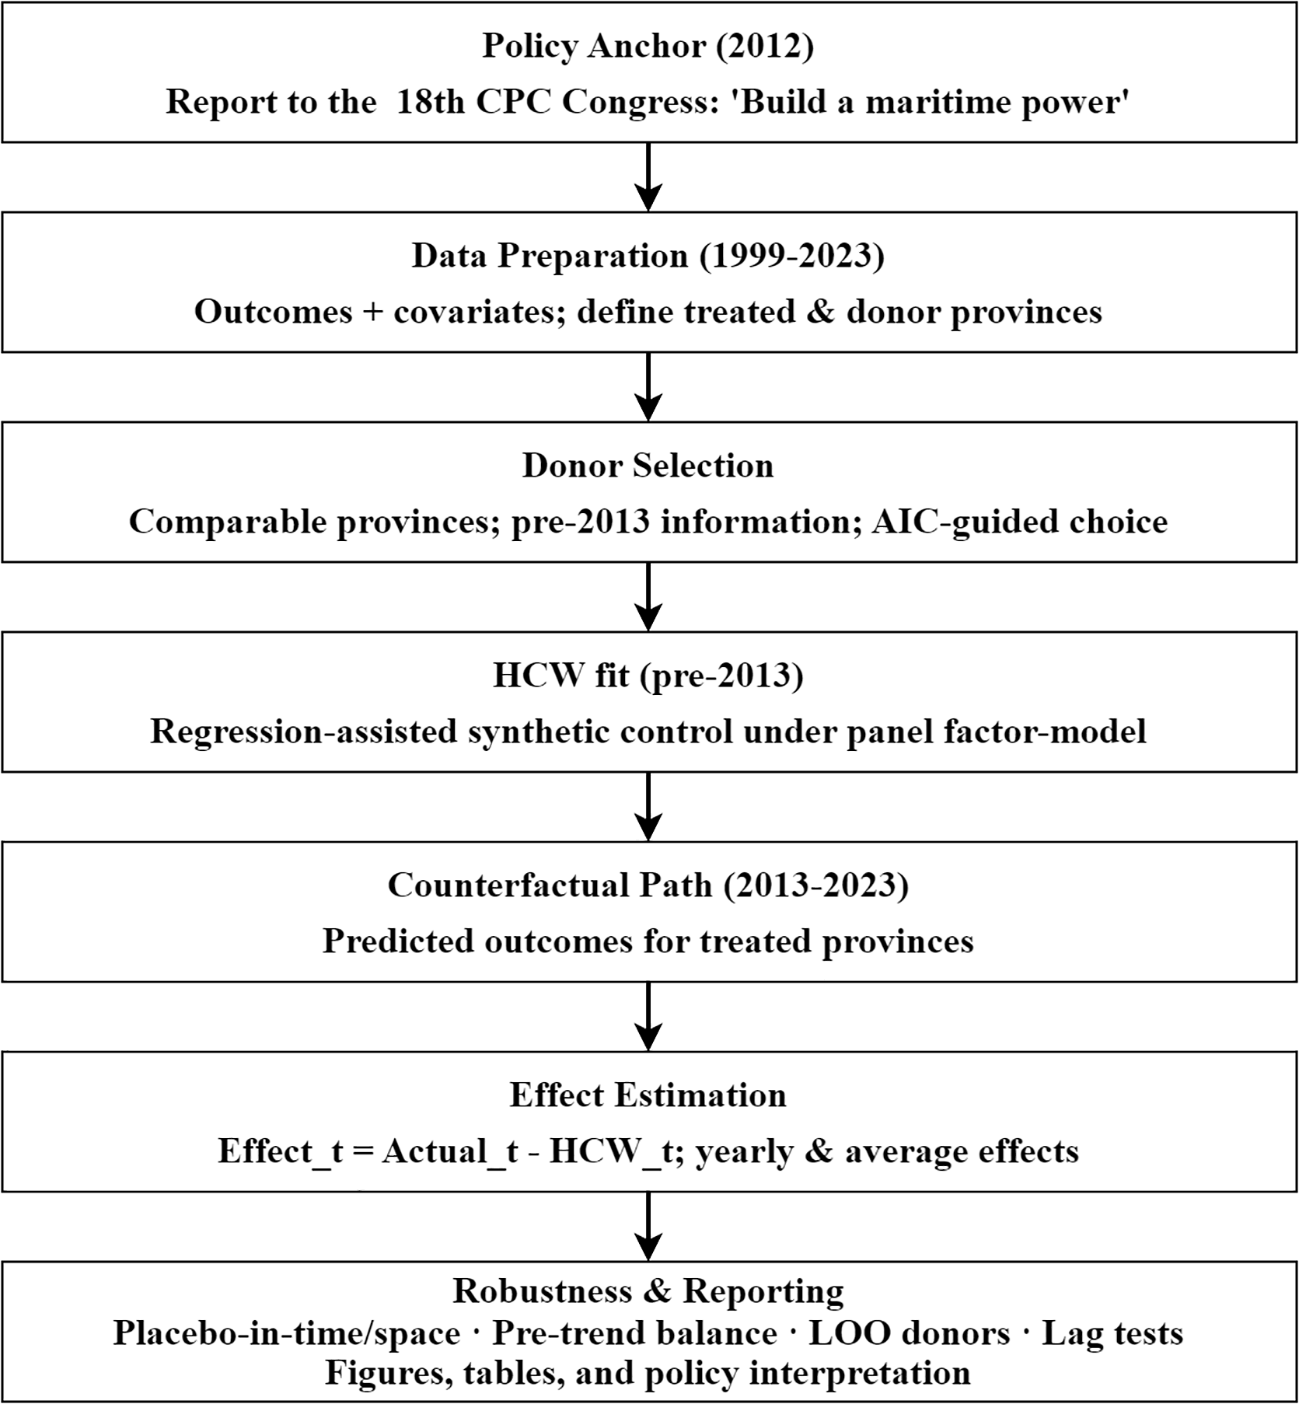
HCW model’s flowchart.
This method integrates the transparency of the synthetic control approach with the flexibility of regression analysis, which effectively improves the accuracy and robustness of the evaluation. On one hand, the synthetic control method provides a more intuitive comparison between the intervention and control units in policy evaluation; on the other hand, regression analysis helps control potential confounding variables, thereby making the analysis more robust. Consequently, by using data from the control group, the counterfactual values for the experimental group that did not implement the policy can be estimated, and the gap between the actual and counterfactual values is measured. The specific steps are as follows:
Let represent the outcome for region i at time t before the intervention of the policy effect. The factor model for its generation process is in the Equation 2: represents a K-dimensional vector of common factors; denotes the coefficients of the vector; represents the region-specific fixed effects; and is the random disturbance term, varying over time and satisfying E()=0.
Let and denote the outcomes of region i at time t under the intervention and non-intervention scenarios, respectively. The policy effect can then be expressed as in Equation 3. However, and cannot be observed simultaneously. Therefore, a dummy variable is introduced to indicate whether region i at time t is affected by the policy intervention. If the region is affected, =1; otherwise, =0. The observed outcome can then be expressed as in Equation 4.
Assuming ( , ……, ) is an N×1 column vector at time t, prior to the policy effect taking place, we have seen it in Equations 5–8. If region i is subject to the policy intervention effect while other regions remain unaffected, without loss of generality, let i = 1. Then, If cannot be observed, it can be estimated using the counterfactual approach. Hsiao and other scholars have noted that due to the presence of common factors, there is certain cross-sectional correlation among units. Therefore, can be approximated by substituting it with , yielding the ‘counterfactual’ value that represents the outcome unaffected by policy effects.
In the practical application of this method, various approaches can be used to select the control group, and it is not necessary to include all provinces or regions as controls. The specific selection steps are as follows: among the N-1 cross-sectional units, select j units at random to predict and fit . Based on the goodness-of-fit, the equation with the best fitting performance is chosen from M(j) and denoted as M(j)*, where j = 1, 2,…, N-1. Using the model fitting criteria, the optimal control group M(m)* is selected from M(1)*, M(2)*, ⋯, M(N-1)*. In summary, the policy effect of the strategic discourse on building a maritime power during period t can be measured as follows in Equation 9. The average effect of the policy during the study period can also be calculated in Equation 10.
2.4 Kernel density estimation
KDE is a non-parametric statistical method used to estimate the probability density function of a random variable. Compared to traditional histogram methods, KDE provides a smoother and more accurate representation of data distribution characteristics. It is widely applied in fields such as data exploration, probability density estimation, and pattern recognition. Assuming the random variables x1, x2, ⋯, xn are independent and identically distributed, the kernel density estimation can be expressed as Equation 11:
Where is the estimated probability density function, xi represents the observed sample points, n is the number of samples, h is the bandwidth controlling the smoothness, and K is the kernel function, typically chosen as a smooth and symmetric function such as the Gaussian kernel.
2.5 Robustness and sensitivity analyses
We implement diagnostics consistent with recent advances in policy evaluation. First, pretrend balance and fit quality are assessed over 2000–2012; the HCW pre-policy fits achieve high goodness of fit (all R2>0.8). Second, placebo-in-time tests reassign treatment to pre-2013 years and re-estimate HCW; no systematic effects appear, indicating that detected impacts are not driven by spurious pre-trends. Third, placebo-in-space rotates each donor province as if treated; the realized effects for treated provinces lie outside the bulk of the placebo distributions. Policy-timing sensitivity acknowledges the national policy anchor in November 2012 and evaluates 0–2-year lags. Together, these checks can confirm that the province-level effects results are credible and stable.
3 Results
3.1 Policy effect evaluation results
Following the outlined methods and procedures, this study employed sample data from the pre-implementation period of the construction of SMC (2000-2012). Using stepwise regression and the Akaike Information Criterion (AIC), the optimal fitted equations and corresponding weights were determined. The R² values of the fitted equations all exceeded 0.8, demonstrating a high degree of goodness-of-fit. This indicates that the selected control group effectively captures the actual per capita GDP growth trends of coastal regions prior to the policy implementation. These results provide a robust basis for estimating the counterfactual economic trajectory of the coastal provinces under the influence of policy effects (2013-2023). Based on this, the study plotted the actual per capita GDP growth rates and the counterfactual fitted values for the four coastal provinces (or autonomous regions) during the sample period.
From Figures 3A-D, it is evident that prior to the implementation of the build SMC, the actual per capita GDP growth rates in the coastal provinces aligned closely with the counterfactual trends. The model exhibited good fitting accuracy, particularly at key turning points, with minimal errors, verifying the reliability of the counterfactual path. Based on these fitted results, the annual differences between the actual and counterfactual values for each coastal province (or autonomous region) were calculated to quantify the policy effects, as shown in Table 2. The construction of SMC has significantly driven economic growth and social development in coastal areas, although notable regional heterogeneity in the policy effects exists. On average, the policy contributed an annual increase of 0.208% to the actual per capita GDP across all coastal regions during the study period.
Figure 3
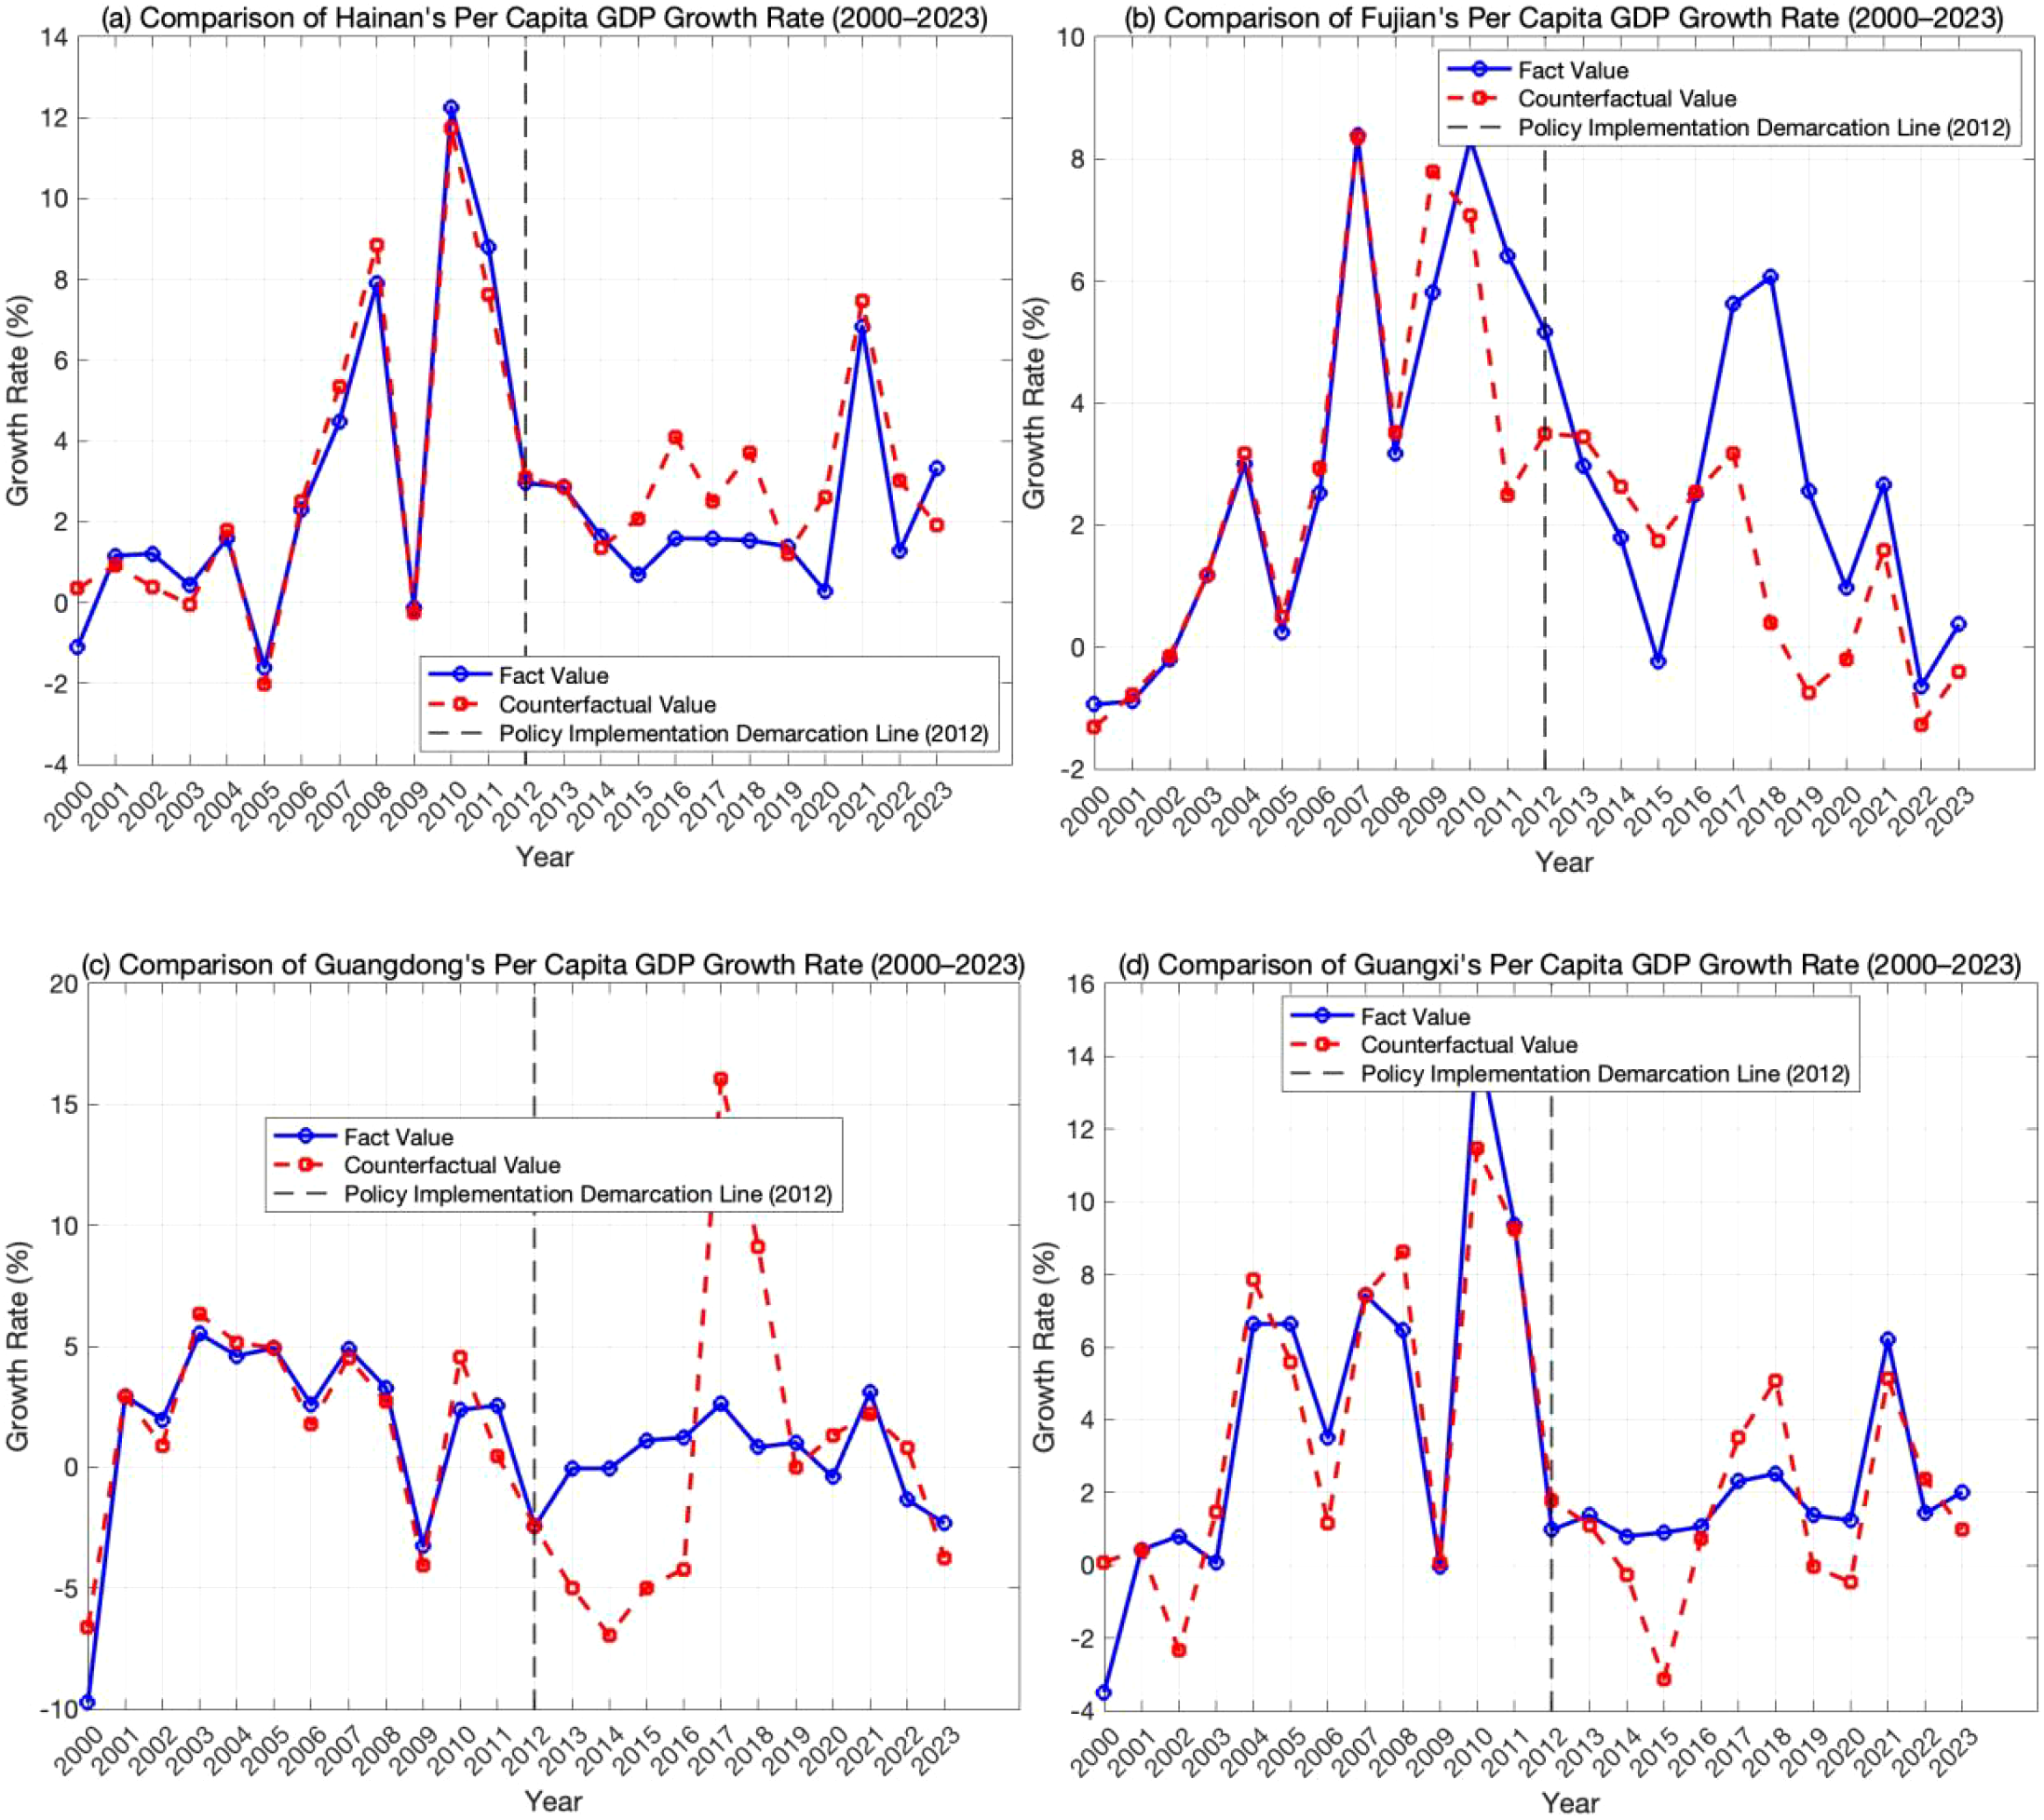
Actual and counterfactual annual per-capita GDP growth rates before and after the implementation of the SMC policy (A) Hainan; (B) Fujian; (C) Guangdong; (D) Guangxi).
Table 2
| Year province | Hainan | Fujian | Guangdong | Guangxi | Mean policy effects (%) |
|---|---|---|---|---|---|
| 2013 | 0 | -0.48 | 4.95 | 0.26 | 1.18 |
| 2014 | 0.29 | -0.82 | 6.9 | 1.05 | 1.86 |
| 2015 | -1.4 | -1.99 | 6.09 | 4.02 | 1.68 |
| 2016 | -2.51 | -0.03 | 5.44 | 0.32 | 0.81 |
| 2017 | -0.92 | 2.34 | -13.43 | -1.2 | -3.3 |
| 2018 | -2.17 | 5.68 | -8.29 | -2.56 | -1.84 |
| 2019 | 0.19 | 3.31 | 1.04 | 1.41 | 1.49 |
| 2020 | -2.33 | 1.17 | -1.74 | 1.7 | -0.3 |
| 2021 | -0.64 | 1.08 | 0.9 | 1.07 | 0.6 |
| 2022 | -1.74 | 0.63 | -2.13 | -0.94 | -1.05 |
| 2023 | 1.41 | 0.78 | 1.43 | 1.03 | 1.16 |
| Mean (%) | -0.89 | 1.06 | 0.11 | 0.56 | 1.18 |
Measured policy effects of the SMC policy (2013–2023).
Between 2013 and 2023, the average policy effects varied significantly among the provinces, with Fujian experiencing the highest positive effect and Hainan showing relatively weaker results. The measured policy effects across Hainan, Fujian, Guangdong, and Guangxi ranged between -13.43% and 5.68%, with the minimum (-13.43%) occurring in Guangdong in 2017 and the maximum (5.68%) in Fujian in 2018. The ranking of average policy effects from largest to smallest is as follows: Fujian (1.06%), Guangxi (0.56%), Guangdong (0.11%), and Hainan (-0.89%). This indicates that, since the national initiative to promote the construction of SMC in 2012, all provinces except Hainan have experienced positive incentives and growth-promoting effects. Consequently, further analysis of Hainan’s construction practices is warranted in the subsequent factor analysis. Additionally, the annual distribution of policy effects for the four coastal provinces (or autonomous regions) during 2013–2023 falls within the range [-3.30, 1.86]. Negative average policy effects were observed in 2017, 2018, 2020, and 2022, while the remaining years exhibited positive values.
3.2 Factor identification results
The factor detection results (Table 3) show that the p-values for all selected factors are less than 0.1, indicating that each factor significantly influences the policy effects of build SMC. In terms of q-values, the ranking of influence is as follows: marine informatization > marine technological innovation > marine industrial optimization > marine human resources > marine resource endowment > level of openness. Therefore, marine informatization emerges as the primary driving factor, with an explanatory power of 96.4%, followed by marine technological innovation and marine industrial optimization, with explanatory powers of 92.6% and 76.9%, respectively.
Table 3
| Influencing factors | q-value | p-value |
|---|---|---|
| X1: Marine Resource Endowment | 0.386 | 0.085 |
| X2: Optimization of Marine Industry | 0.769 | 0.010 |
| X3: Marine Human Resources | 0.724 | 0.015 |
| X4: Marine Technological Innovation | 0.926 | 0.001 |
| X5: Marine Informatization Development | 0.964 | 0.0002 |
| X6: Level of Openness to Trade | 0.307 | 0.077 |
Results of factor detection.
As shown in Table 3, marine informatization emerges as the core driving force behind the construction of a “marine power.” Informatization directly injects new momentum into the marine economy by enhancing industrial efficiency while indirectly supporting the realization of national marine development goals through its cascading effects on related factors. Advancements in information technology drive innovation and application in marine science and technology, enabling the marine economy to evolve toward high-tech, high-value-added industries. Notably, the emergence of new marine industries, such as marine biotechnology, marine pharmaceuticals, seawater utilization, and marine renewable energy—relies heavily on the application of information technologies. These advancements significantly enhance resource utilization efficiency, reduce dependence on traditional energy sources, and promote the development of a green, sustainable marine economic model.
In terms of marine industrial structure optimization, improving the quality and efficiency of the tertiary sector is particularly critical. Traditional marine economic growth has predominantly relied on resource-based and labor-intensive primary and secondary industries. However, the growth of the tertiary sector signifies improvements in the quality and effectiveness of the marine economy. The deepening level of marine informatization provides robust support for the tertiary sector, particularly in marine services, coastal tourism, and marine finance. By leveraging information technology, service efficiency and quality can be significantly enhanced. The development of the tertiary sector greatly improves the overall quality of the marine economy, facilitating its transformation from a production-driven growth model to one that prioritizes innovation and efficiency. Continuous optimization of the industrial structure not only strengthens the competitiveness of the marine economy but also effectively drives related industries, achieving coordinated development across entire industrial and supply chains.
Marine technological innovation plays an indispensable role in the development of SMC, with highly skilled marine professionals serving as the essential foundation for innovation. The research, development, and application of technological advancements heavily depend on a well-established talent pool. Therefore, fostering and attracting high-level marine talent with specialized knowledge and innovative capabilities is a prerequisite for driving technological innovation and ensuring high-quality economic development. Furthermore, improvements in marine informatization provide expanded opportunities and platforms for talent development. The construction of efficient information networks facilitates knowledge dissemination and sharing, enhances cross-regional collaboration in marine scientific research, and accelerates the application and transformation of innovative outcomes.
3.3 Analysis of policy effects by province
As shown in Figure 4A, between 2013 and 2023, the policy effects exhibited a “W-shaped” fluctuation trend, characterized by an initial rise, a subsequent decline, and a gradual recovery. Despite periodic fluctuations, the overall effect has been positive, fostering economic growth in coastal provinces. As illustrated in Figure 4B and Table 2, the policy effects across Hainan, Fujian, Guangdong, and Guangxi exhibited distinct evolutionary characteristics during 2013-2023.
Figure 4
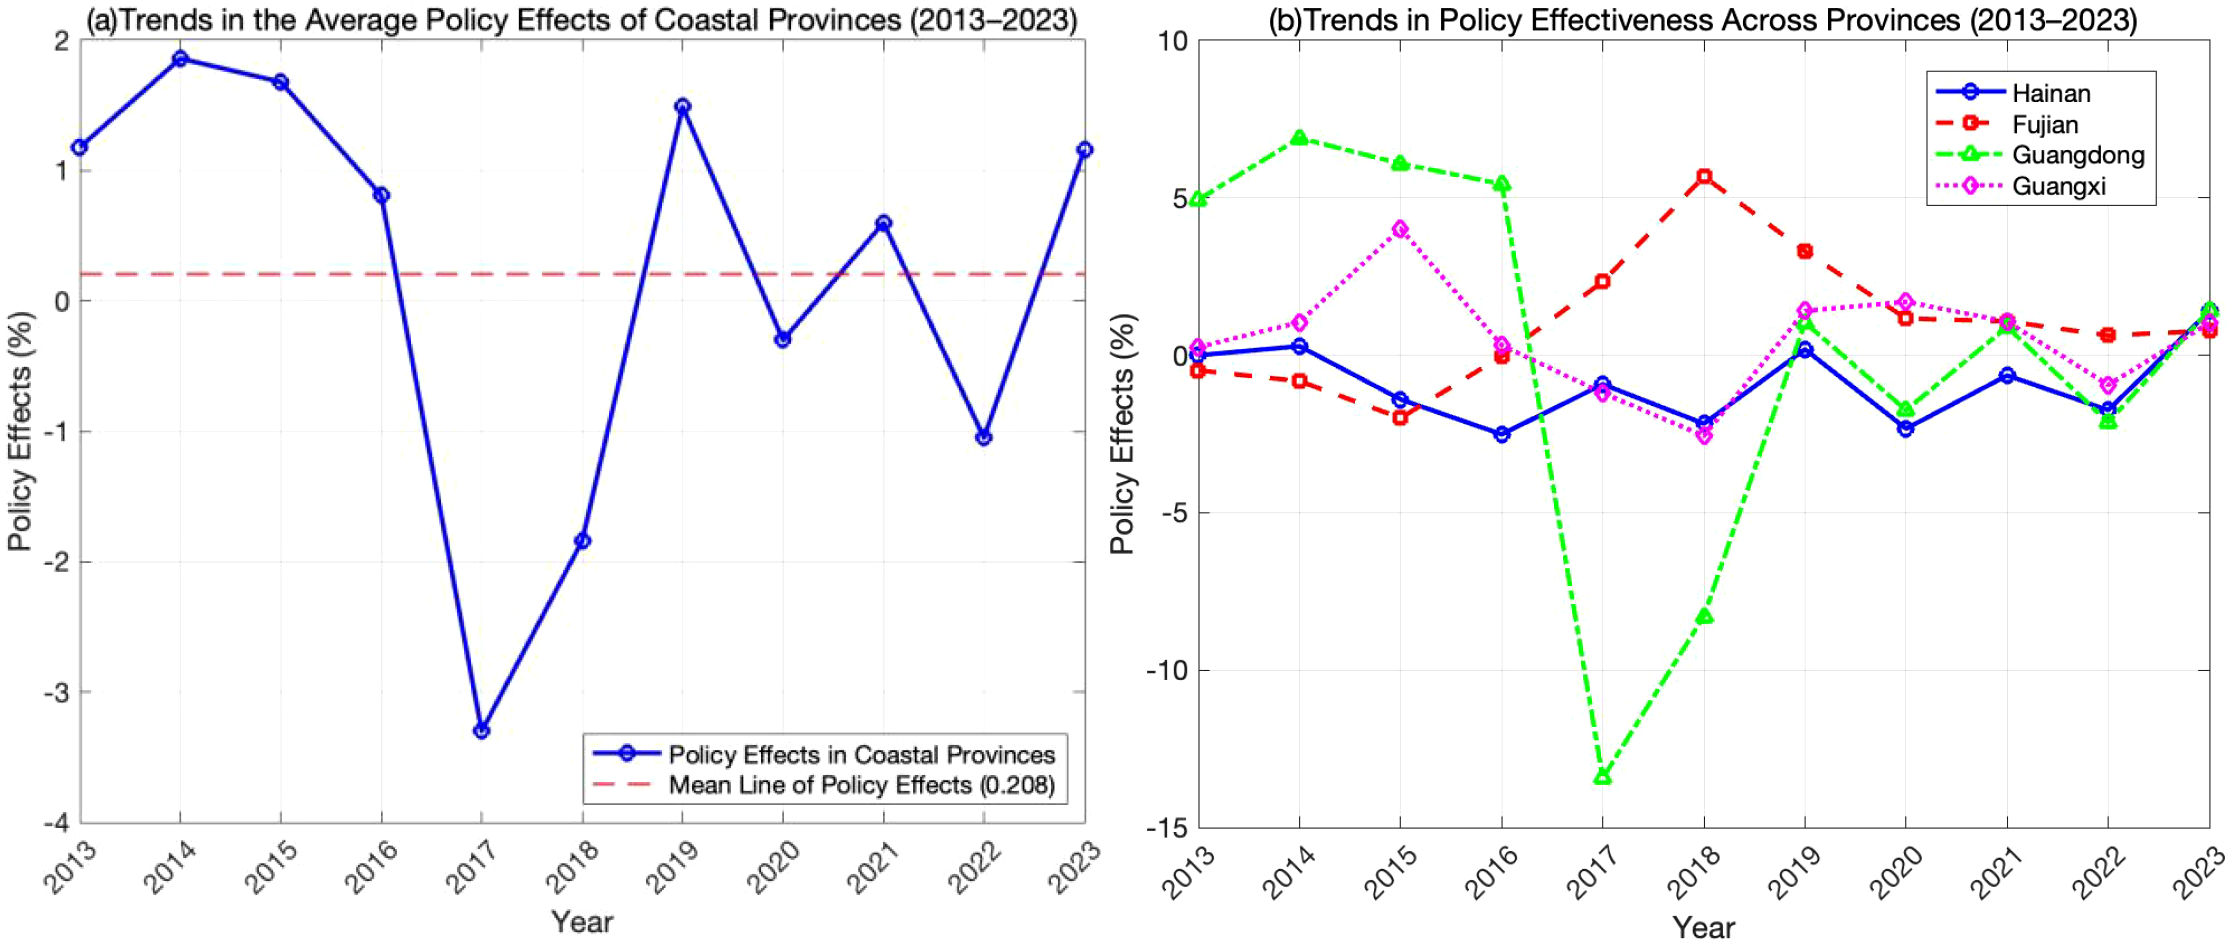
Trends in policy effects from 2013 to 2023 ((A) Average Policy Effects Across Provinces; (B) Policy Effects by Province).
Hainan Province demonstrated relatively low average policy effects, with limited driving force, recording an effect of only -0.89%. Hainan’s implementation of the SMC benefitted from abundant coastal tourism resources, as its tertiary marine industry, particularly coastal tourism, has played a prominent role in driving economic growth. However, Hainan’s overall marine economy remains small in scale, with relatively low technological capabilities and a single-dominant industrial structure. Consequently, while policy effects in Hainan have remained stable, their magnitude has been relatively modest, reflecting limited growth in its marine economic development.
Fujian Province demonstrated relatively high policy effects, with an average impact of 1.06%, indicating strong momentum in driving marine economic development. Fujian capitalized on key opportunities such as the construction of the Straits Blue Economic Experimental Zone, the “21st Century Maritime Silk Road,” and the Free Trade Pilot Zone. The policy effect peaked in 2015, showing a robust growth trend. By 2020, Fujian’s marine GDP reached 1.05 trillion yuan, ranking third nationwide after Shandong and Guangdong, reflecting significant progress in marine economic development. Post-2020, the policy effect stabilized at a high level, highlighting the success of Fujian’s strategic marine economic layout.
Guangdong Province exhibited a moderate average policy effect of 0.11%, with noticeable annual fluctuations. Guangdong, endowed with abundant marine resources and a strong capacity for innovation, leads the nation in marine economic competitiveness. However, high population density has led to over-exploitation of marine resources, placing pressure on the environment. The policy effect turned negative in 2017, suggesting that resource carrying capacity had become a limiting factor for Guangdong’s sustainable marine economic growth. Under policy guidance, Guangdong has made strides in promoting green development, with the policy effect gradually recovering to a moderate level, reflecting the province’s transition toward sustainable marine resource management.
Guangxi Zhuang Autonomous Region displayed a moderate average policy effect of 0.56%, indicating steady progress. Guangxi, with relatively low marine resource utilization, primarily focuses on labor-intensive marine industries such as fisheries and shipbuilding, while emerging marine industries remain underdeveloped. In recent years, Guangxi has actively integrated into the Belt and Road Initiative and strengthened marine trade cooperation with ASEAN countries (Rosnani et al., 2022). Growth in marine transportation and coastal tourism, as part of the tertiary sector, has driven an increase in Guangxi’s marine economic growth rate. The policy effect has stabilized since 2018, reflecting significant achievements in adjusting the region’s marine economic structure.
From Figure 5, several observations can be made. Firstly, regional disparities in policy effects were significant during the initial period (2013-2016), as evidenced by the large box sizes, indicating substantial differences across provinces. During this early phase, variations in resource endowments, economic foundations, and responsiveness to policy implementation contributed to a more dispersed spatial distribution of effects. Secondly, in 2017, an increase in outliers was observed. Although the box size shrank after 2017, the presence of numerous outliers suggests that while policy effects became more concentrated, certain regions exhibited extreme deviations. These outliers may result from differences in policy adaptability or implementation intensity across regions. Thirdly, from 2018 onward, policy effects stabilized, with progressively smaller box sizes and more concentrated data distributions. Particularly after 2020, the absence of significant outliers and reduced box size highlight a substantial decline in regional disparities. This trend reflects the gradual implementation of policies, leading to convergence and consistency in policy effects across coastal regions.
Figure 5
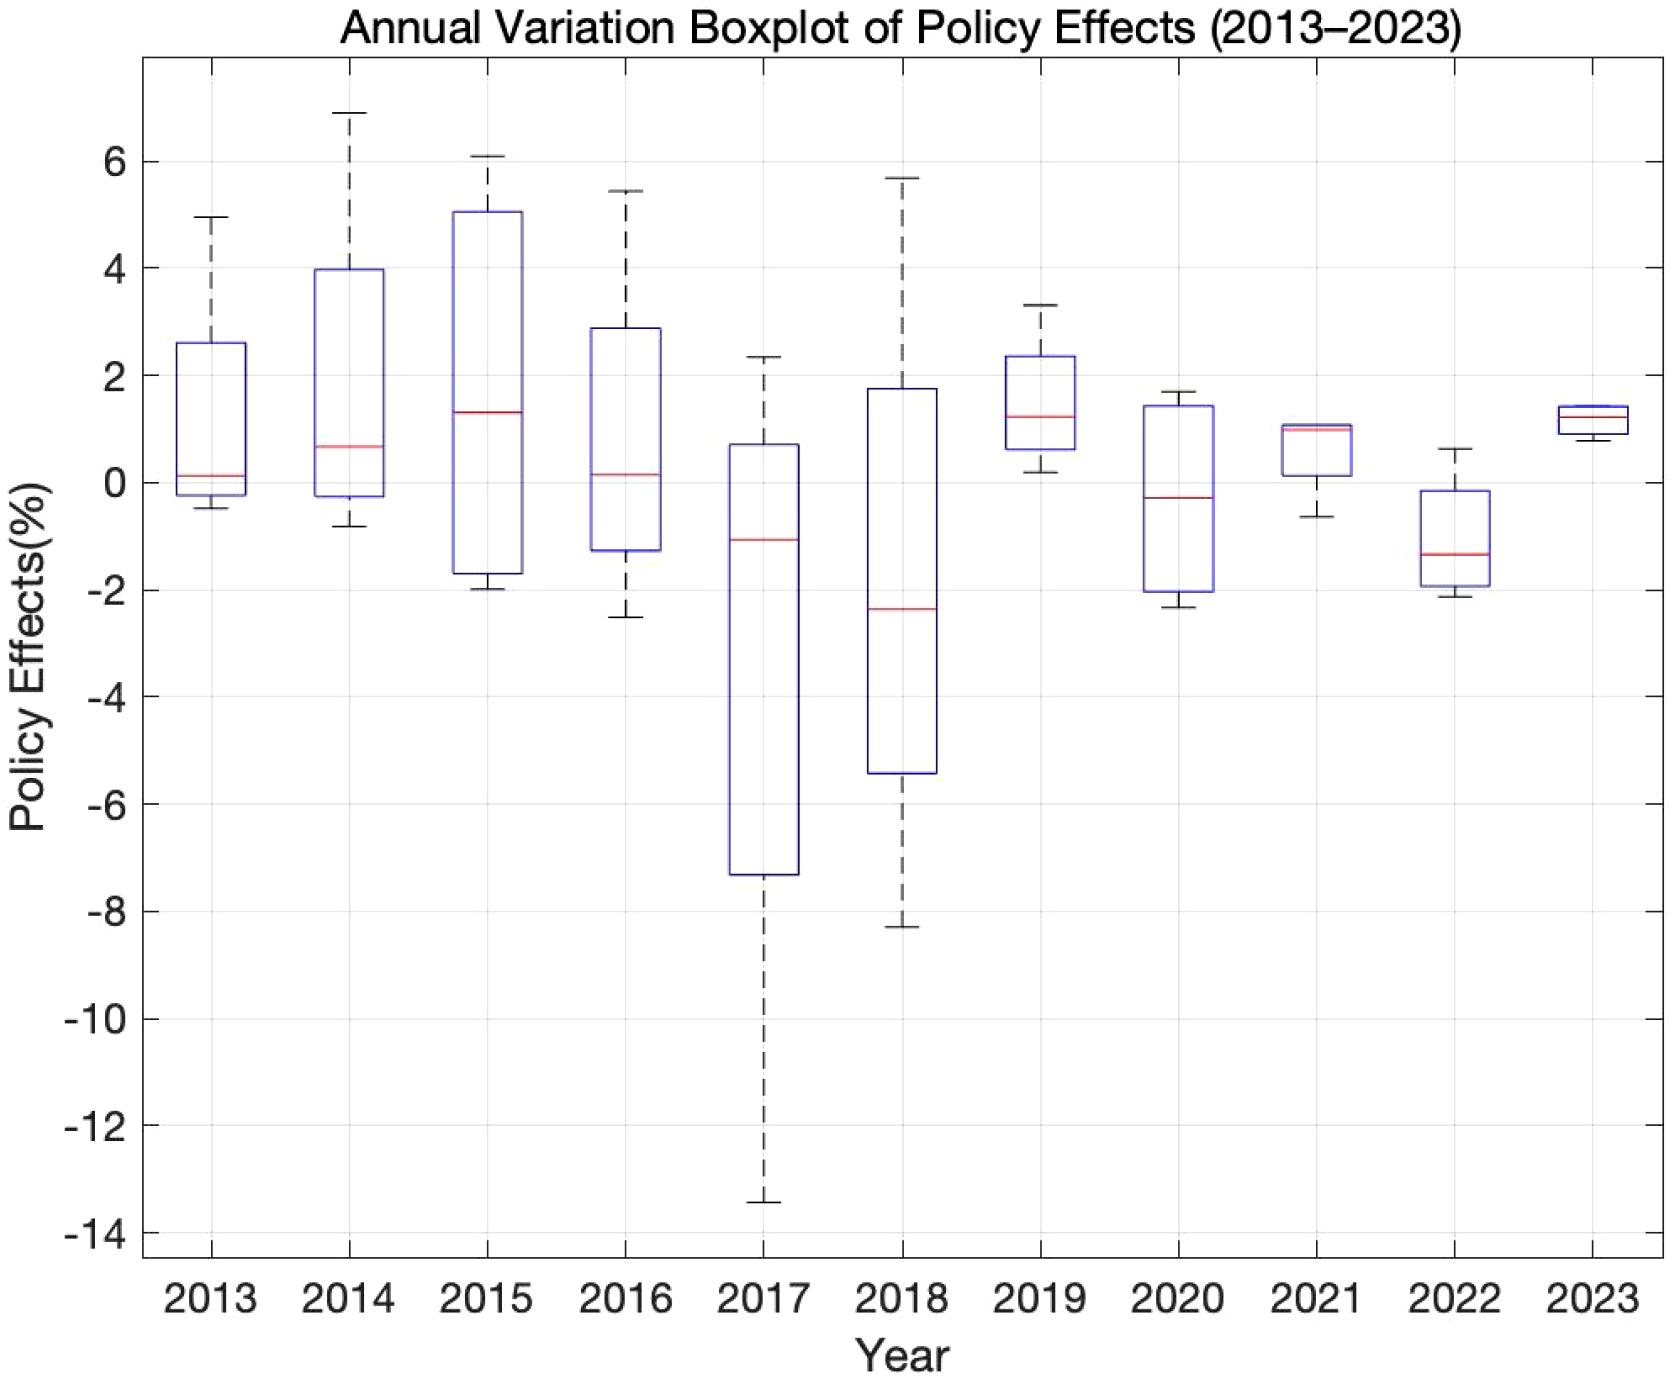
Annual boxplot of policy effects (2013–2023).
3.4 Kernel density analysis of policy effects
The initial regional disparities can be attributed to differences in natural resource endowments, economic foundations, and varying levels of responsiveness to policy implementation. During the early stages of SMC, policy effects exhibited considerable dispersion. However, as policy implementation deepened, the positive effects expanded, institutional benefits were realized, and regional economic growth and policy effects converged.
From the results of the KDE in Figure 6, the following conclusions can be drawn: Firstly, the kernel density curves reveal regional differences in the distribution of policy effects. The centers of density functions for Hainan and Fujian are close to zero, indicating neutral or stable policy effects. In contrast, Guangdong’s distribution leans toward negative values, reflecting certain adverse effects of the policy in this region. Secondly, in terms of shape, the density curves for Fujian and Guangxi exhibit high and narrow peaks, indicating stable policy effects with minimal fluctuations. Conversely, Guangdong’s curve is flatter and wider, demonstrating greater dispersion in policy effects, which may be linked to intensive marine resource exploitation and high population density. Thirdly, the extent of distribution varies significantly across regions. Guangdong’s kernel density curve extends further into the negative range, highlighting pronounced imbalances in policy effects, whereas Hainan and Fujian show more concentrated distributions, suggesting smaller regional gaps. Fourthly, no significant bimodal structure is observed, indicating that while regional disparities exist, there is no evidence of clear polarization. Although Guangdong shows relatively lower policy effects, the differences compared to other regions remain modest, and no extreme divergence trends have emerged.
Figure 6
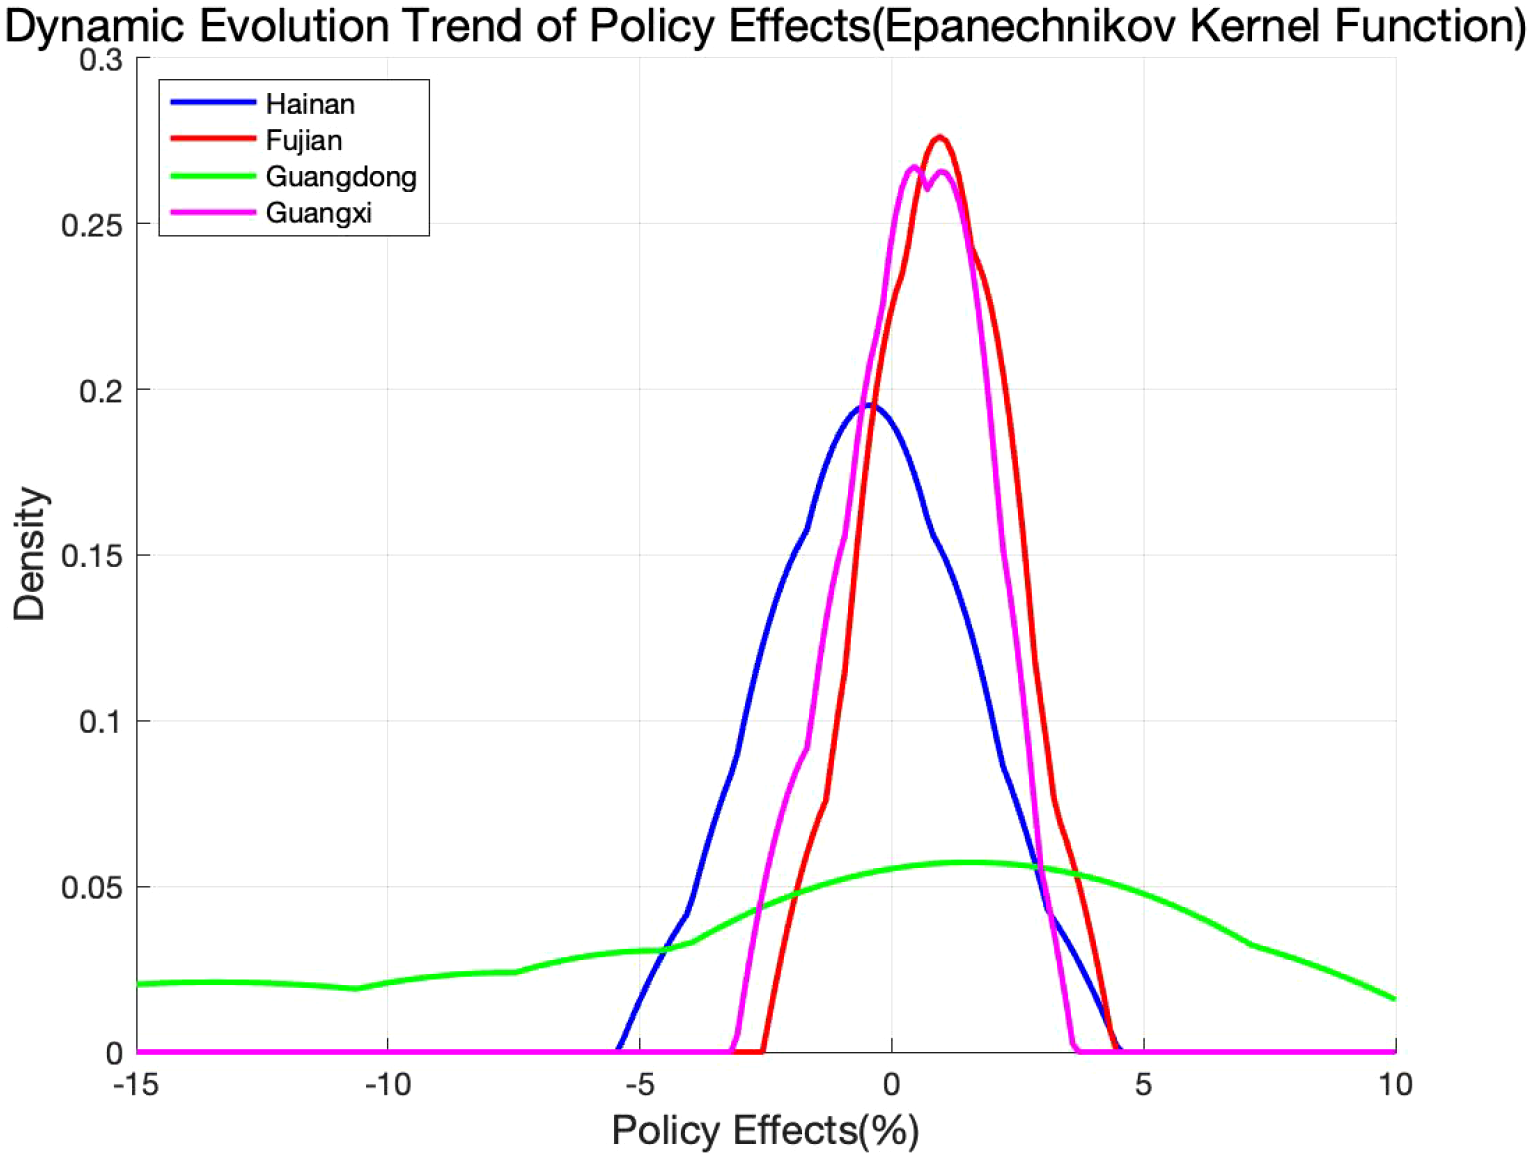
Kernel density distribution of policy effects in four southeastern coastal provinces (2013-2023).
Overall, the KDE reveals regional disparities in policy effects across Hainan, Fujian, Guangdong, and Guangxi. Hainan and Fujian exhibit relatively stable and concentrated policy effects, while Guangdong shows significant volatility. Over time, spatial differences in policy effects across the four provinces gradually converge, reflecting the incremental changes in marine economic development following policy implementation.
4 Discussion
This study provides a rigorous empirical assessment of China’s SMC policy and offers practical guidance for improving policy design and implementation in coastal provinces. Against the backdrop of China’s accelerated efforts to build a maritime power, the evaluation of policy implementation effectiveness is instrumental not only in assessing the impact of policies on coastal economic growth but also in informing the refinement of policy formulation. Although prior studies on the maritime economy and policy evaluation have yielded valuable insights, they predominantly focus on macro-level trend analysis (Gai et al., 2022), with limited exploration of regional disparities and the spatial dynamics of policy effects.
By employing panel data in conjunction with the HCW model and kernel density estimation, this study quantitatively analyzes policy effects and uncovers variations in implementation and trends across provinces, offering practical guidance for policymaking. Importantly, the study emphasizes the regional heterogeneity of policy effects, underscoring the significance of tailoring maritime development policies to local contexts. Findings reveal that policy effects are most pronounced in Fujian Province, highlighting the critical roles of resource endowment, economic foundation, and policy responsiveness in determining implementation outcomes. Conversely, the relatively weaker policy effects in Hainan Province, attributed to its narrow industrial structure and lagging technological innovation, further underscore the importance of optimizing regional industrial structures and advancing technological capabilities as key pathways to enhance policy effectiveness (Gissi et al., 2021).
The analysis of interregional differences not only deepens the understanding of policy implementation outcomes but also provides a foundation for developing more targeted and differentiated policies. Additionally, conventional methods for evaluating policy effects, such as difference-in-differences and synthetic control models, often face limitations in causal inference and small-sample analyses. By introducing the HCW model, this study achieves greater flexibility and accuracy in evaluating macro-level policy effects. The integration of kernel density estimation and geographical detectors complements this approach, offering multidimensional insights into the spatiotemporal evolution of policy effects and their key drivers. This methodological synthesis provides significant reference value for related research fields and establishes a systematic analytical framework for future studies.
Focusing on the mechanisms driving policy effects, the study identifies maritime informatization, technological innovation, and industrial structure optimization as pivotal factors in enhancing policy outcomes. The findings demonstrate that informatization accounts for 96.4% of the explanatory power for policy effects, establishing it as the core driver of high-quality maritime economic development. Technological innovation contributes to economic sustainability by advancing technological capabilities and resource utilization efficiency, while the optimization of the tertiary sector further enhances resource allocation efficiency, injecting new momentum into regional economies. These findings not only offer actionable directions for policy refinement but also underscore the synergistic roles of various driving factors in promoting maritime economic development.
Our factor detection quantifies associations between policy effects and candidate drivers, but it does not identify causality. We identify two threats, namely reverse causality, in which regions with stronger performance subsequently invest more in informatization, and omitted variable bias arising from factors that move jointly with both the proposed drivers and the outcomes. In this study, the HCW framework identifies the policy effect on outcomes via a counterfactual path. The factor results should therefore be read as mechanism hypotheses that organize heterogeneity rather than as causal estimates (Hsiao et al., 2012).
This study employs the HCW model for quantitative analysis and finds that the policy effect is most pronounced in Fujian Province, whereas Hainan Province, constrained by a single industrial structure and lagging technological innovation, exhibits relatively weak policy effects. These findings align with previous research indicating that the economic growth-promoting effects of marine economic policies vary across regions due to differences in resource endowments and industrial structures (Zhang et al., 2023). Moreover, other scholars have highlighted that the effectiveness of marine policy implementation is closely linked to regional levels of technological innovation, a conclusion that corresponds with this study’s factor analysis identifying marine technological innovation as a critical driving factor (Wang et al., 2024).
The kernel density estimation in this study further reveals the spatiotemporal evolution of policy effects, showing significant regional disparities during the early stages of policy implementation that gradually diminish as the policies are fully enacted. Similarly, prior research utilizing kernel density functions to study the spatial patterns of China’s marine economic development noted that the release of policy dividends fosters balanced regional development. However, this study expands on existing research by identifying the pivotal role of informationization in this process, thereby deepening the understanding of policy mechanisms (Gai et al., 2022). Furthermore, most existing studies focus on single-dimensional analyses of policy effects, such as marine resource utilization efficiency or ecological benefits (Chen and Zheng, 2021). This study, however, adopts an integrated evaluation framework that incorporates economic growth, technological innovation, and industrial structure optimization, systematically uncovering the combined influence of multiple factors. This methodological advancement significantly enhances the comprehensiveness and applicability of the analysis, offering valuable insights for future research.
The regional heterogeneity analysis in this study shows that Fujian, Guangxi, and Guangdong Provinces exhibit varying degrees of positive policy effects, while Hainan Province demonstrates negative effects. These results contrast with existing studies emphasizing the positive impacts of the Hainan Free Trade Zone policies on economic growth (Wang et al., 2023). The evidence suggests a composition capacity channel. A service heavy marine economy with limited upstream manufacturing and producer services reduces agglomeration and knowledge diffusion, which lowers returns to national policy inputs (Zhang et al., 2024). Lower R&D intensity and thinner digital infrastructure further slow the translation of policy tools into productivity gains, in line with studies that link innovation and data systems to blue-growth performance (Liu et al., 2021; Halpern et al., 2012). Differences in foreign direct investment also help explain the gap, such as service oriented inflows generate smaller technology spillovers than export or R&D intensive inflows, whereas Fujian benefits from stronger industrial linkages. In Fujian, policy openness under the Fujian Pilot Free Trade Zone, dense industrial linkages across manufacturing and producer services, and plan-led coordination consistent with maritime spatial planning collectively strengthen knowledge diffusion, reduce transaction costs, and improve cross-sector alignment in ports, logistics, fisheries, and conservation. This configuration offers a coherent explanation for Fujian’s higher policy returns relative to peer provinces.
This paper contributes to understanding the muted policy effects in Hainan under the marine power strategy, attributing the outcome primarily to its single industrial structure and relatively low level of informationization. China’s SMC operates within the international legal baseline provided by the United Nations Convention on the Law of the Sea (UNCLOS). At the outcome level, SMC goals are consistent with SDG 14 (conserve and sustainably use oceans, seas and marine resources), which offers measurable targets for pollution reduction, protection, and sustainable use. The EU Integrated Maritime Policy and the EU Maritime Spatial Planning (MSP) Directive institutionalize cross-sector coordination and ecosystem-based planning. Member states must produce MSP plans that balance economic, social, and environmental objectives.
This study provides empirical evidence of the policy effects of the Marine Power Strategy on regional economic development, highlighting its heterogeneous characteristics across different regions and the underlying mechanisms. First, the findings reveal significant regional heterogeneity in policy effects, indicating that variations in resource endowment, industrial structure, and technological innovation levels among coastal regions substantially influence policy outcomes. This underscores the importance of tailoring resource allocation and developing differentiated strategies based on regional characteristics when formulating and implementing marine-related policies. Second, marine informatization has been identified as the core driver of policy effectiveness. Enhanced information infrastructure not only directly improves marine economic efficiency but also significantly amplifies overall policy effects by facilitating industrial structure optimization and technological innovation. These results suggest that prioritizing information infrastructure development, promoting data sharing, and advancing digitalization should be central to efforts to achieve high-quality economic growth in coastal areas. Third, the study demonstrates that optimizing the tertiary sector not only strengthens the competitiveness of the marine economy but also fosters the coordination of the entire industrial chain. This indicates the need to further promote high-value-added industries, such as coastal tourism, marine services, and marine finance, while fostering their integration with traditional industries to inject new momentum into regional economic development. Finally, this study confirms the applicability of the HCW model in evaluating policy effectiveness, providing a methodological reference for quantitative analyses of the Marine Power Strategy. This innovative approach serves as a valuable tool for assessing regional policies and lays a solid foundation for advancing academic research on policy effects.
5 Conclusions
Based on an in-depth analysis of the SMC policy texts, this study systematically evaluates the implementation effects of marine power strategies across four southeastern coastal provinces (2013-2023) using quantitative methods, including the Regression-based SCM, KDE and Factor Detector analysis. Key influencing factors are also explored through core variables. The results indicate that the construction of SMC has significantly promoted economic growth in coastal regions, though regional disparities in policy effects and the mechanisms of influencing factors display considerable diversity and hierarchy. The heterogeneity we document is consistent with a view in which natural resource endowments, the efficiency of policy implementation, and polycentric governance arrangements jointly mediate the transmission of national objectives to local outcomes. Our results therefore speak to a broader policy agenda in which digital infrastructure and innovation capacity condition the returns to marine policies and shape province-specific effect paths.
The key mechanisms we identify, namely maritime informatization, technological innovation, and the rise of high-value services, converge with international experience on knowledge-based blue growth and ecosystem-aware governance. The development of the tertiary sector signifies a transformation of the marine economy from resource dependence to innovation-driven growth. Supported by informatization and technological innovation, sectors such as marine services, coastal tourism, and marine finance exhibit substantial growth potential. Policy effects not only enhance regional economic competitiveness but also facilitate coordinated development across the entire industrial chain. In conclusion, this study reveals the regional heterogeneity and dynamic evolution of policy effects in the construction of a SMC, providing scientific insights for future policy optimization. Moving forward, greater investment in informatization, accelerated technological achievements, and region-specific promotion of tertiary industry development are essential to achieving the comprehensive implementation of the marine power strategy and ensuring sustainable, high-quality economic development.
Beyond the China context, these conclusions align with international frameworks and evidence. OECD projections of the ocean economy underscore the centrality of data systems, skills, and innovation for productivity and new value creation, while global indicator platforms such as the Ocean Health Index and recent syntheses on protection benefits provide goal-based benchmarks for evaluating policy outcomes (Halpern et al., 2012; Sala et al., 2021). The EU Integrated Maritime Policy and the EU Maritime Spatial Planning Directive institutionalize knowledge-driven, plan-led coordination across ports, energy, fisheries and conservation. Our findings suggest that similar MSP integration would amplify gains where informatization and innovation are strong. Situated against the legal and normative baselines of UNCLOS and SDG 14, the HCW design used here can be readily applied to other national or regional settings to generate comparable and mechanism-aware policy evidence.
Statements
Data availability statement
The original contributions presented in the study are included in the article/supplementary material. Further inquiries can be directed to the corresponding author.
Author contributions
KZ: Conceptualization, Supervision, Validation, Writing – review & editing, Funding acquisition, Writing – original draft, Formal Analysis. SW: Data curation, Conceptualization, Methodology, Writing – review & editing, Software, Formal Analysis, Writing – original draft, Visualization. XZ: Software, Writing – review & editing, Formal Analysis, Data curation. YW: Writing – review & editing, Formal Analysis, Data curation, Software. JB: Writing – review & editing, Validation. ST: Investigation, Writing – review & editing, Supervision, Project administration.
Funding
The author(s) declare that financial support was received for the research and/or publication of this article. This study was financially supported by National Natural Science Foundation of China (grant number: 42506232); Shandong Provincial Social Science Planning Research Project (22CXSXJ15); The Zhejiang Academy of Marine Sciences, “Special Project on Dynamic Monitoring, Evaluation and Early Warning of Territorial Spatial Planning - Research on the Delineation of ‘Two Spaces and One Red Line’ in Zhejiang Province and the ‘Dual Evaluation’ of the Marine Environment (Research on Optimization and Refined Zoning of Marine Functional Zones)” (HKY2025KF06WT06(Y)); The project commissioned by the China Land Surveying and Planning Institute, titled “Research on Supporting Policies and Mechanisms for Marine Spatial Management” (2025B1121385); Research on the Construction and Planning of “Near-Reef Offshore Complexes” Based on the Three-Dimensional Spatial Development in the South China Sea.
Conflict of interest
The authors declare that the research was conducted in the absence of any commercial or financial relationships that could be construed as a potential conflict of interest.
Generative AI statement
The author(s) declare that no Generative AI was used in the creation of this manuscript.
Any alternative text (alt text) provided alongside figures in this article has been generated by Frontiers with the support of artificial intelligence and reasonable efforts have been made to ensure accuracy, including review by the authors wherever possible. If you identify any issues, please contact us.
Publisher’s note
All claims expressed in this article are solely those of the authors and do not necessarily represent those of their affiliated organizations, or those of the publisher, the editors and the reviewers. Any product that may be evaluated in this article, or claim that may be made by its manufacturer, is not guaranteed or endorsed by the publisher.
References
1
Afonso F. Félix P. M. Chainho P. Heumüller J. A. de Lima R. F. Ribeiro F. et al . (2022). Community perceptions about mangrove ecosystem services and threats. Regional Stud. Mar. Sci.49, 102114. doi: 10.1016/j.rsma.2021.102114
2
Ali M. Xu D. Yang X. Hu J. Y. (2024). Microplastics and PAHs mixed contamination: An in-depth review on the sources, co-occurrence, and fate in marine ecosystems. Water Res.257, 121622. doi: 10.1016/j.watres.2024.121622
3
Arkhangelsky D. Athey S. Hirshberg D. A. Imbens G. W. Wager S. (2021). Synthetic difference-in-differences. Am. Economic Review111, 4088–4118. doi: 10.1257/aer.20190159
4
Boone L. Preat N. Nhu T. T. Fiordelisi F. Guillard V. Blanckaert M. et al . (2023). Environmental performance of plastic food packaging: Life cycle assessment extended with costs on marine ecosystem services. Sci. Total Environment894, 164781. doi: 10.1016/j.scitotenv.2023.164781
5
Bryhn A. Kraufvelin P. Bergström U. Vretborn M. Bergström L. (2020). A model for disentangling dependencies and impacts among human activities and marine ecosystem services. Environ. Management65, 575–586. doi: 10.1007/s00267-020-01260-1
6
Callaway B. Sant’Anna P. H. C. (2021). Difference-in-Differences with multiple time periods. J. Econometrics225, 200–230. doi: 10.1016/j.jeconom.2020.12.001
7
Cariou P. Randrianarisoa L. M. (2023). Stakeholders? participation at the IMO marine environmental protection committee. Mar. Policy149, 105506. doi: 10.1016/j.marpol.2023.105506
8
Chen S. Y. Zheng Q. Y. (2021). The analysis of U.S. marine thinking and its enlightenment to China’s maritime power construction. Pacific J.29, 53–65. doi: 10.14015/j.cnki.1004-8049.2021.04.005
9
De Vivero J. L. S. Mateos J. C. R. (2010). Ocean governance in a competitive world. The BRIC countries as emerging maritime powers-building new geopolitical scenarios. Mar. Policy34, 967–978. doi: 10.1016/j.marpol.2010.02.002
10
Deng X. Li S. Q. Yuan M. (2020). Evaluation of policy effect in the twenty years of Western development: Based on the panel data policy effect evaluation method. J. Southwest Minzu University41, 107–114. doi: 10.3969/j.issn.1004-3926.2020.01.016
11
Duarte C. M. Agustí S. Barbier E. Britten G. L. Castilla J. C. Gattuso J.-P. et al . (2020). Rebuilding marine life. Nature580, 39–51. doi: 10.1038/s41586-020-2146-7
12
Gai M. He Y. N. Ke L. N. (2022). Research on the development quality of China’s marine economy. J. Natural Resources37, 942–965. doi: 10.31497/zrzyxb.20220408
13
Gissi E. Manea E. Mazaris A. D. Fraschetti S. Almpanidou V. Bevilacqua S. et al . (2021). A review of the combined effects of climate change and other local human stressors on the marine environment. Sci. Total Environment755, 142564. doi: 10.1016/j.scitotenv.2020.142564
14
Gopal P. Alverdian I. (2021). Maritime security cooperation between India and Indonesia: imperatives, status and prospects. India Quarterly-a J. Int. Affairs77, 269–288. doi: 10.1177/09749284211005009
15
Grove L. J. W. Smith S. G. Blondeau J. Ault J. S. (2024). A quantitative assessment of the status of reef fish communities from a large-scale probability survey in southern Florida. Bull. Mar. Sci.100, 239–258. doi: 10.5343/bms.2023.0020
16
Grzechnik M. (2018). Love of wide open waters. The polish maritime programme according to the baltic and western institutes in the aftrtmath of the second world war, (1945-1950). Acta Poloniae Historica117, 195–222. doi: 10.12775/APH.2018.117.07
17
Halpern B. S. Frazier M. Potapenko J. Casey K. S. Koenig K. Longo C. et al . (2015). Spatial and temporal changes in cumulative human impacts on the world’s ocean. Nat. Commun.6, 7615. doi: 10.1038/ncomms8615
18
Halpern B. S. Longo C. Hardy D. McLeod K. L. Samhouri J. F. Katona S. K. et al . (2012). An index to assess the health and benefits of the global ocean. Nature488, 615–620. doi: 10.1038/nature11397
19
Hsiao C. Ching H. S. Wan S. K. (2012). A panel data approach for program evaluation: Measuring the benefits of political and economic integration of Hong Kong with the mainland. J. Appl. Econometrics27, 705–740. doi: 10.1002/jae.1230
20
Jambeck J. R. Geyer R. Wilcox C. Siegler T. R. Perryman M. Andrady A. et al . (2015). Plastic waste inputs from land into the ocean. Science347, 768–771. doi: 10.1126/science.1260352
21
Jin Y. M. (2014). On the content of China’s strategy of maritime power and its legal system. Southeast Asian Affairs1), 18–28. doi: 10.14073/j.cnki.nywtyj.2014.01.009
22
Joshi Y. (2023). Beyond binaries: southeast Asia’s maritime security cooperation with China and India. Contemp. SOUTHEAST ASIA45, 282–312. doi: 10.1355/cs45-2f
23
Jouffray J.-B. Blasiak R. Norström A. V. Österblom H. Nyström M. (2020). The blue acceleration: the trajectory of human expansion into the ocean. One Earth2, 43–54. doi: 10.1016/j.oneear.2019.12.016
24
Le Roy M. Sawtschuk J. Bioret F. Gallet S. (2019). Toward a social-ecological approach to ecological restoration: a look back at three decades of maritime clifftop restoration. Restor. Ecol.27, 228–238. doi: 10.1111/rec.12849
25
Lin Z. Du Z. C. Hsiao C. Yin H. (2015). The macroeconomic effects of the Canada-US Free Trade Agreement on Canada: A counterfactual analysis. World Economy38), 878–892. doi: 10.1111/twec.12217
26
Liu X. L. Wang Y. Y. Zhang H. Guo X. S. (2023). Susceptibility of typical marine geological disasters: an overview. Geoenvironmental Disasters10, 10. doi: 10.1186/s40677-023-00237-6
27
Liu P. D. Zhu B. Y. Yang M. Y. (2021). Has marine technology innovation promoted the high-quality development of the marine economy?–Evidence from coastal regions in China. Ocean Coast. Management209, 105695. doi: 10.1016/j.ocecoaman.2021.105695
28
Miedtank A. Schneider J. Manss C. Zielinski O. (2024). Marine twins for enhanced ocean. Remote Sens. Applications-Society Environment36, 101268. doi: 10.1016/j.rsase.2024.101268
29
Motta F. S. Moura R. L. Neves L. M. Souza G. R. S. Gibran F. Z. Francini C. L. et al . (2021). Effects of marine protected areas under different management regimes in a hot spot of biodiversity and cumulative impacts from SW Atlantic. Regional Stud. Mar. Sci.47, 101951. doi: 10.1016/j.rsma.2021.101951
30
Mursitama T. N. Ying Y. (2021). Indonesia’s perception and strategy toward China’s OBOR expansion: hedging with balancing. Chin. Economy54, 35–47. doi: 10.1080/10971475.2020.1809816
31
Naylor R. L. Hardy R. W. Buschmann A. H. Bush S. R. Cao L. Klinger D. H. et al . (2021). A 20-year retrospective review of global aquaculture. Nature591, 551–563. doi: 10.1038/s41586-021-03308-6
32
Rosnani R. Heryadi D. Yani Y. M. Sinaga O. (2022). ASEAN maritime security cooperation. Transnav-International J. Mar. Navigation Saf. Sea Transportation16, 413–417. doi: 10.12716/1001.16.03.01
33
Sala E. Mayorga J. Bradley D. Cabral R. B. Atwood T. B. Auber A. et al . (2021). Protecting the global ocean for biodiversity, food and climate. Nature592, 397–402. doi: 10.1038/s41586-021-03371-z
34
Selvaraj J. J. Arunachalam V. Coronado-Franco K. V. Romero-Orjuela L. V. Ramírez-Yara Y. N. (2020). Time-series modeling of fishery landings in the Colombian Pacific Ocean using an ARIMA model. Regional Stud. Mar. Sci.39, 101477. doi: 10.1016/j.rsma.2020.101477
35
Shi C.l. Ma W. T. (2019). Retrospect and prospect of China’s marine management system reform since 1978. China Soft Sci.6), 1–12. doi: 10.3969/j.issn.1002-9753.2019.06.001
36
Shinohara M. (2010). Maritime cluster of Japan: implications for the cluster formation policies. Maritime Policy Manage.37, 377–399. doi: 10.1080/03088839.2010.486648
37
That V. V. Lam L. Trung T. Q. (2023). Maritime security policy of India in early 21st century: Vietnam’s perception of its implication on the Asia-pacific region. J. Int. Stdies-JIS19, 67–92. doi: 10.32890/jis2023.19.2.3
38
Tripathy A. K. Shaikh I. Bisht N. S. (2024). Flag of convenience and the tragedy of the commons in maritime transportation. Mar. pollut. Bull.208, 117034. doi: 10.1016/j.marpolbul.2024.117034
39
Tuuri E. M. Leterme S. C. (2023). How plastic debris and associated chemicals impact the marine food web: A review. Environ. Pollution321, 121156. doi: 10.1016/j.envpol.2023.121156
40
Vargas-Fonseca O. A. Frazier M. Lombard A. T. Halpern B. S. (2024). Knowns and unknowns in future human pressures on the ocean. Earth’s Future12, e2024EF004559. doi: 10.1029/2024EF004559
41
Wang X. Du D. B. Peng Y. (2024). Assessing the importance of the marine chokepoint: evidence from tracking the global marine traffic. Sustainability16, 384. doi: 10.3390/su16010384
42
Wang Z. Y. Li Q. Tang Y. Q. Han Z. L. (2023). Evaluation of policy effect of the maritime power strategy: An empirical analysis based on HCW model. GEOGRAPHICAL Res.42, 1215–1233. doi: 10.11821/dlyj020220805
43
Weiskopf S. R. Rubenstein M. A. Crozier L. G. Gaichas S. Griffis R. Halofsky J. E. et al . (2020). Climate change effects on biodiversity, ecosystems, ecosystem services, and natural resource management in the United States. Sci. Total Environment733, 137782. doi: 10.1016/j.scitotenv.2020.137782
44
Wernberg T. Thomsen M. S. Baum J. K. Bishop M. J. Bruno J. F. Coleman M. A. et al . (2024). Impacts of climate change on marine foundation species. Annu. Rev. Mar. Sci.16, 247–282. doi: 10.1146/annurev-marine-042023-093037
45
Wu M. X. Li C. W. Du J. He P. M. Zhong S. C. Wu P. L. et al . (2019). Quantifying the dynamics and driving forces of the coastal wetland landscape of the Yangtze River Estuary since the 1960s. Regional Stud. Mar. Sci.32, 100854. doi: 10.1016/j.rsma.2019.100854
46
Xu C. Y. Li B. W. Kong F. B. He T. (2024). Spatial-temporal variation, driving mechanism and management zoning of ecological resilience based on RSEI in a coastal metropolitan area. Ecol. Indicators158, 111447. doi: 10.1016/j.ecolind.2023.111447
47
Ye X. D. Chen B. Lee K. Storesund R. Zhang B. Y. (2020). An integrated offshore oil spill response decision making approach by human factor analysis and fuzzy preference evaluation. Environ. Pollution262, 114294. doi: 10.1016/j.envpol.2020.114294
48
Yuan Z. H. Nag R. Cummins E. (2022). Human health concerns regarding microplastics in the aquatic environment- From marine to food systems. Sci. Total Environment823, 153730. doi: 10.1016/j.scitotenv.2022.153730
49
Zhang R. P. Gao Q. Gao K. (2024). Impact of marine industrial agglomeration on the high-quality development of the marine economy–A case study of China’s coastal areas. Ecol. Indicators158, 111410. doi: 10.1016/j.ecolind.2023.111410
50
Zhang K. C. Wang H. B. Wu Y. Chen S. Y. Gao J. Z. Tian S. Z. (2023). Optimizing the cultivation of university students’ Maritime awareness in the context of accelerating the construction of maritime power. Ocean Dev. Management40, 136–141. doi: 10.20016/j.cnki.hykfygl.20231023.001
Summary
Keywords
strong maritime country, policy effects, hybrid control-weighting model, kernel density estimation, factor detection
Citation
Zhang K, Wang S, Zhang X, Wang Y, Bian J and Tian S (2025) Evaluation of the policy effects of strong maritime country construction in China. Front. Mar. Sci. 12:1708930. doi: 10.3389/fmars.2025.1708930
Received
19 September 2025
Revised
14 November 2025
Accepted
21 November 2025
Published
08 December 2025
Volume
12 - 2025
Edited by
Song Ding, Zhejiang University of Finance and Economics, China
Reviewed by
Yi-Che Shih, National Cheng Kung University, Taiwan
Hu Zhang, East China University of Political Science and Law, China
Yixiong He, Zhejiang Ocean University, China
Updates
Copyright
© 2025 Zhang, Wang, Zhang, Wang, Bian and Tian.
This is an open-access article distributed under the terms of the Creative Commons Attribution License (CC BY). The use, distribution or reproduction in other forums is permitted, provided the original author(s) and the copyright owner(s) are credited and that the original publication in this journal is cited, in accordance with accepted academic practice. No use, distribution or reproduction is permitted which does not comply with these terms.
*Correspondence: Shizheng Tian, 2024878@ouc.edu.cn
†These authors have contributed equally to this work
Disclaimer
All claims expressed in this article are solely those of the authors and do not necessarily represent those of their affiliated organizations, or those of the publisher, the editors and the reviewers. Any product that may be evaluated in this article or claim that may be made by its manufacturer is not guaranteed or endorsed by the publisher.