Abstract
Accurate estimation of fish length from otoliths is essential for stock assessment, bycatch monitoring, and automated length reconstruction workflows. However, the strength and consistency of otolith-somatic scaling can vary across species and environments. This study examined the predictive performance of otolith morphometric variables for estimating fish length across six pelagic and demersal species from major Philippine fishing grounds. We evaluated 11 otolith morphometric and shape metrics using linear and nonlinear regressions, generalized additive models (GAMs), and machine learning (ML) algorithms. Model performance was compared across species to identify both the most informative predictors and ecological factors influencing otolith-length relationships. Otolith length (OL) and otolith area (OA) consistently produced the highest predictive power, whereas otolith perimeter (OP) showed the weakest performance. Demersal species and the midwater schooling Decapterus kurroides exhibited highly predictable otolith-length relationships (R2 > 0.95), reflecting relatively stable habitats and uniform growth dynamics. In contrast, Selar crumenophthalmus and Thunnus albacares displayed lower predictability (R2 ≤ 0.70), likely due to exposure to dynamic thermal regimes, variable prey fields, and ontogenetic shifts that increase plasticity in otolith accretion. ML models, particularly Random Forest, outperformed classical approaches for species with heterogeneous growth patterns by capturing nonlinearities and interactions among morphometric variables. Our findings demonstrate that OL and OA are robust and broadly transferable predictors of fish length in tropical multispecies fisheries, while species inhabiting variable pelagic environments benefit from more flexible ML frameworks. Integrating ecological context with advanced modeling tools can significantly improve otolith-based size estimation. The study highlights the value of expanding sampling coverage and refining ML approaches to enhance future applications in fisheries monitoring and assessment.
1 Introduction
Otoliths are paired calcified structures in the inner ear of teleost fishes that function in hearing and balance (Popper et al., 2005). They grow incrementally with the fish (Campana, 2004), record chemical signatures from the ambient environment, and are relatively resistant to decay (Campana, 2004; Lishchenko and Jones, 2021), making them natural recorders of fish life and environmental history (Morales et al., 2023). Otoliths vary in shape and size in a species-specific manner (Campana, 2004; Tuset et al., 2008) and have been widely used for age and size estimation, taxonomy and systematics (Tuset et al., 2006; Bostanci et al., 2015; Christensen et al., 2018; Morales et al., 2023), stock discrimination (Bergenius et al., 2006; Barnuevo et al., 2023; Yang et al., 2024; Vu and Pham, 2025), diet and feeding studies (Pierce and Boyle, 1991), migration history, and even archaeological and paleontological research (Harvey et al., 2000; Schwarzhans et al., 2017).
Empirical relationships between fish size and otolith morphometrics (e.g. length, height, weight) are well established (Jawad et al., 2011; Battaglia et al., 2015; Dehghani et al., 2016) and provide a basis for back-calculating fish size when only otoliths are available (e.g. from stomach contents or damaged specimens). Such regressions often explain a large proportion of variation: Giménez et al. (2016) reported that in 142 species, >84% of regressions explained more than 75% of the deviance in fish length from otolith size. These relationships are also used to examine growth patterns and coupling/decoupling between body and otolith growth across environmental conditions (Stormer and Juanes, 2016) and life stages (Hare and Cowen, 1995).
However, linear models, including simple power functions, may not fully capture the complexity of fish-otolith growth relationships. Zabel et al. (2010) found that quadratic and power models outperformed purely linear forms for Chinook salmon Oncorhynchus tshawytscha across populations. Hansen et al. (2022) similarly reported improved fits using nonlinear age–weight models for lake trout Salvelinus namaycush. Life-history transitions, such as migration in S. malma, can decouple body and otolith growth, causing misestimation of size or age if single linear models are used. In Sillago sinica, Yang et al. (2024) showed that populations differ significantly in otolith shape dimensions, suggesting morphological variation not strictly proportional to body size.
More recently, researchers have begun applying machine learning (ML) and deep learning (DL) techniques to otolith analysis, either to capture complex shape information or automate measurement tasks. Vu and Pham (2025) compared traditional morphometrics and DL approaches to distinguish stocks of S. sihama based on otolith morphology, while Zhu and Chen (2023) introduced an ML approach for allometric correction in otolith shape analysis of Chionodraco rastrospinosus, Krefftichthys anderssoni, Electrona carlsbergi, and Pleuragramma antarcticum. For age prediction, Politikos et al. (2021, 2022) introduced DL approaches and an open-source AI platform for automated fish age reading from otolith and scale images, while Benson et al. (2023) combined spectral, spatial, and biological inputs with DL to predict fish age with . These methods demonstrate the ability of ML to handle nonlinearities, size-shape interactions, and image data directly, thereby reducing reliance on manual measurement and linear assumptions.
Despite this progress, most models relating fish size to otolith morphometry remain linear or simple power functions, assuming proportional scaling and ignoring potential nonlinearities from ontogenetic shifts, environmental influences, size-dependent shape changes, or population differences. In addition, while ML approaches are emerging, their use for modeling fish size directly from otolith images beyond age estimation or species identification is still limited.
This study aimed to evaluate linear, nonlinear, and machine learning-based models to predict fish length from otolith morphometric variables and compare their performance against traditional linear and power models. We focus on the applicability of these approaches in data-poor or data-limited settings, where sample sizes are small or measurement resources are constrained. By doing so, we seek to develop predictive models that better capture variance in fish-otolith relationships, accommodate nonlinearities, enable automation, and provide practical tools for fisheries assessment and ecological management.
2 Materials and methods
2.1 Sample collection
Otoliths were extracted from fish specimens representing multiple species and ecological guilds (Figure 1). Samples were obtained from municipal and commercial fishery landings collected between 2020 and 2025 across multiple fishing grounds in the Philippines. Juvenile samples (≤35 cm FL) of Yellowfin tuna Thunnus albacares (Bonnaterre, 1788; n=158) were sourced from 2021 commercial landings from the West Philippine Sea. Bigeye scad Selar crumenophthalmus (Bloch, 1793; n=82), redtail scad Decapterus kurroides Bleeker, 1855 (n=83) were obtained from purse seine landings from the Sulu Sea. Ornate threadfin bream Nemipterus hexodon (Quoy & Gaimard, 1824; n=192), Japanese threadfin bream N. japonicus (Bloch, 1791; n=67), and Yellow-tipped threadfin bream N. nematopus (Bleeker, 1851; n=87) were collected from municipal gillnet and bottom-set longline landings in Northern Iloilo, Philippines and were fished from the Visayan Sea. For each specimen, standard biometric data such as body weight (in g [not included in analyses]), standard length (SL, in cm), total length (TL, in cm), and fork length (FL, in cm) were recorded.
Figure 1
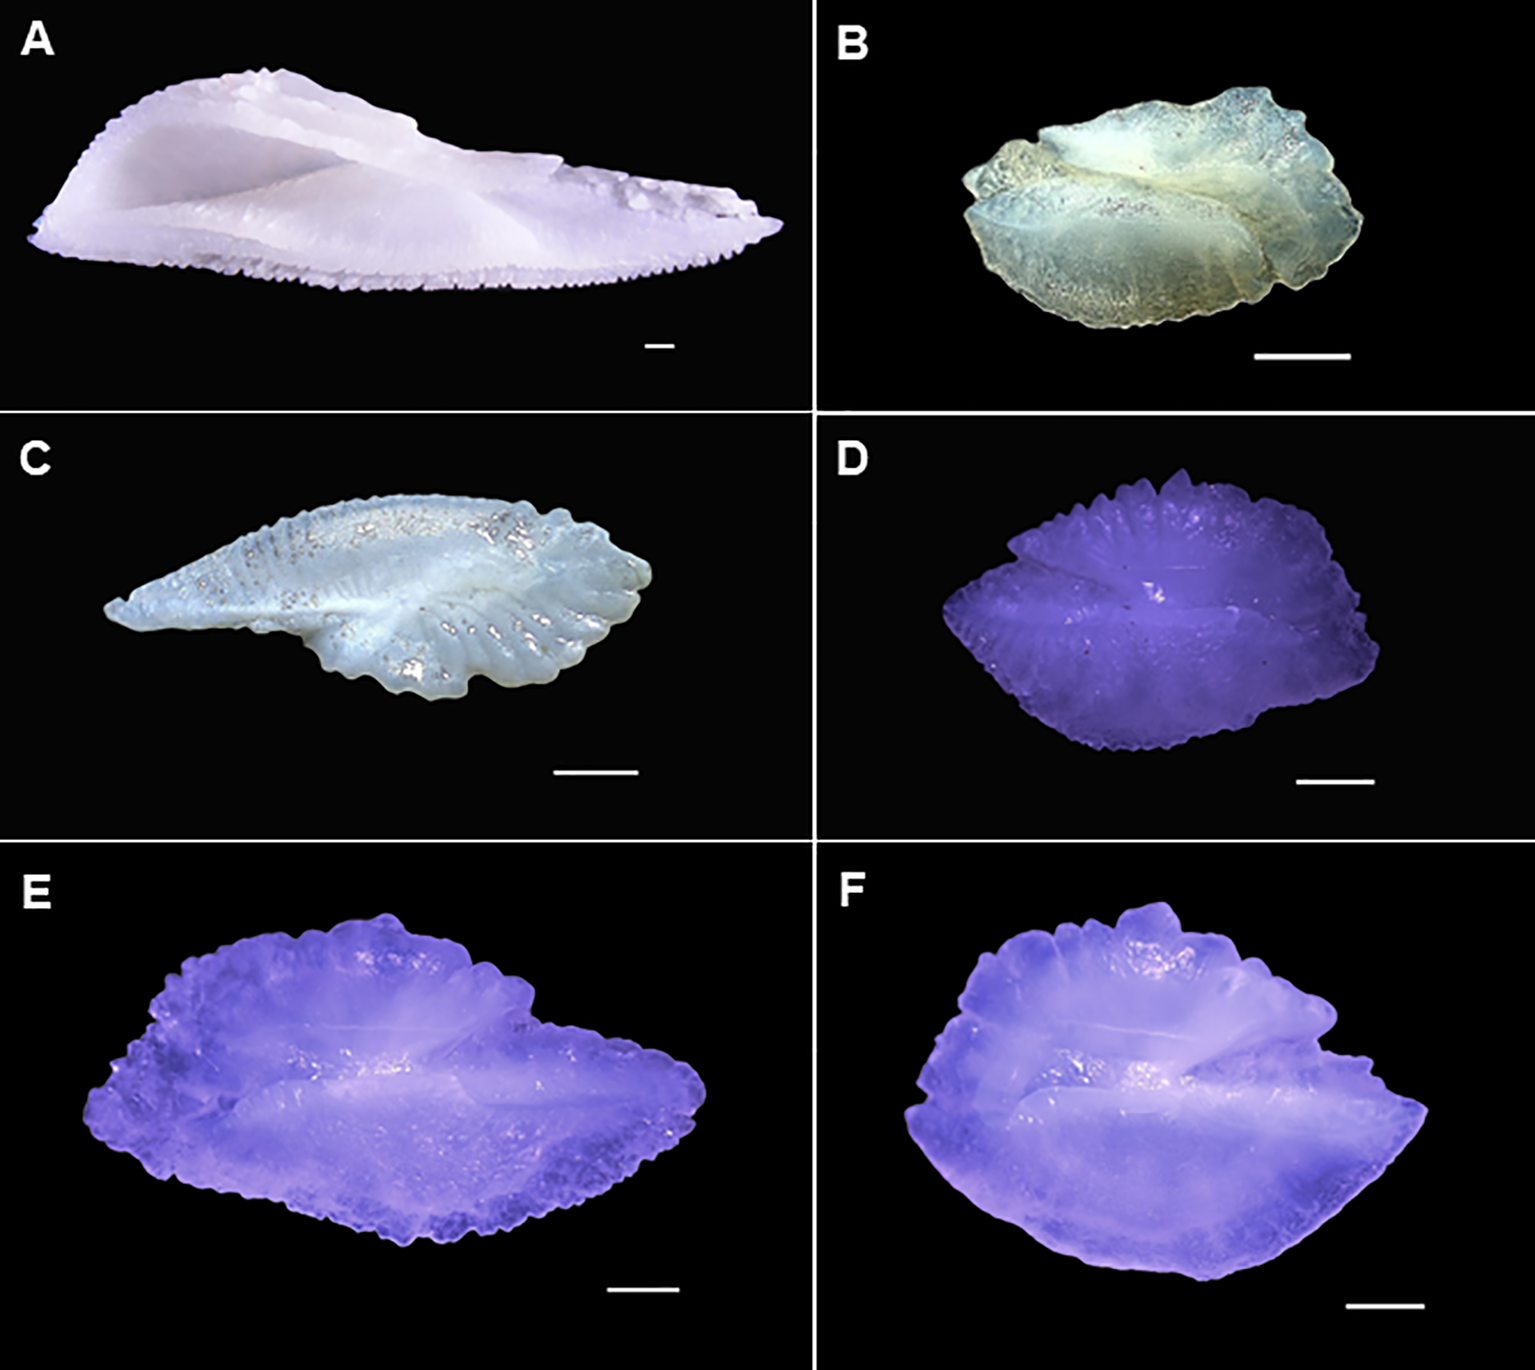
Representative samples of fish otoliths used in the study. (A)Thunnus albacares, (B)Selar crumenophthalmus, (C)Decapteus kurroides, (D)Nemipterus hexodon, (E)N. japonicus, and (F)N. nematopus. Scale bar: 1 mm.
2.2 Otolith imaging and morphometry
Sagittal otolith samples were imaged under an Olympus SZ61 stereomicroscope (Evident Corporation, Tokyo, Japan) with a calibrated XCAM 1080PHB camera mount (ToupTek Photonics, Hangzhou, China). Otoliths were placed sulcus side up on a dark background, ensuring consistent dorsal-ventral orientation. Each otolith was photographed under 4x to 10x magnification depending on otolith size, using a standardized resolution of approximately 200 pixels per mm. The same illumination intensity and angle were maintained for all samples to ensure consistency across species. Images were preprocessed in an image editing software to standardize contrast and orientation. The otolith morphometric variables, otolith length (OL, mm), otolith height (OH, mm), otolith area (OA, mm2), and otolith perimeter (OP, mm) were measured using ImageJ (NIH, USA) (Figure 2). An allometric correction was performed on the morphometric variables following Lleonart et al. (2000) to remove the size effects on the otolith measurements. This was given by:
Figure 2
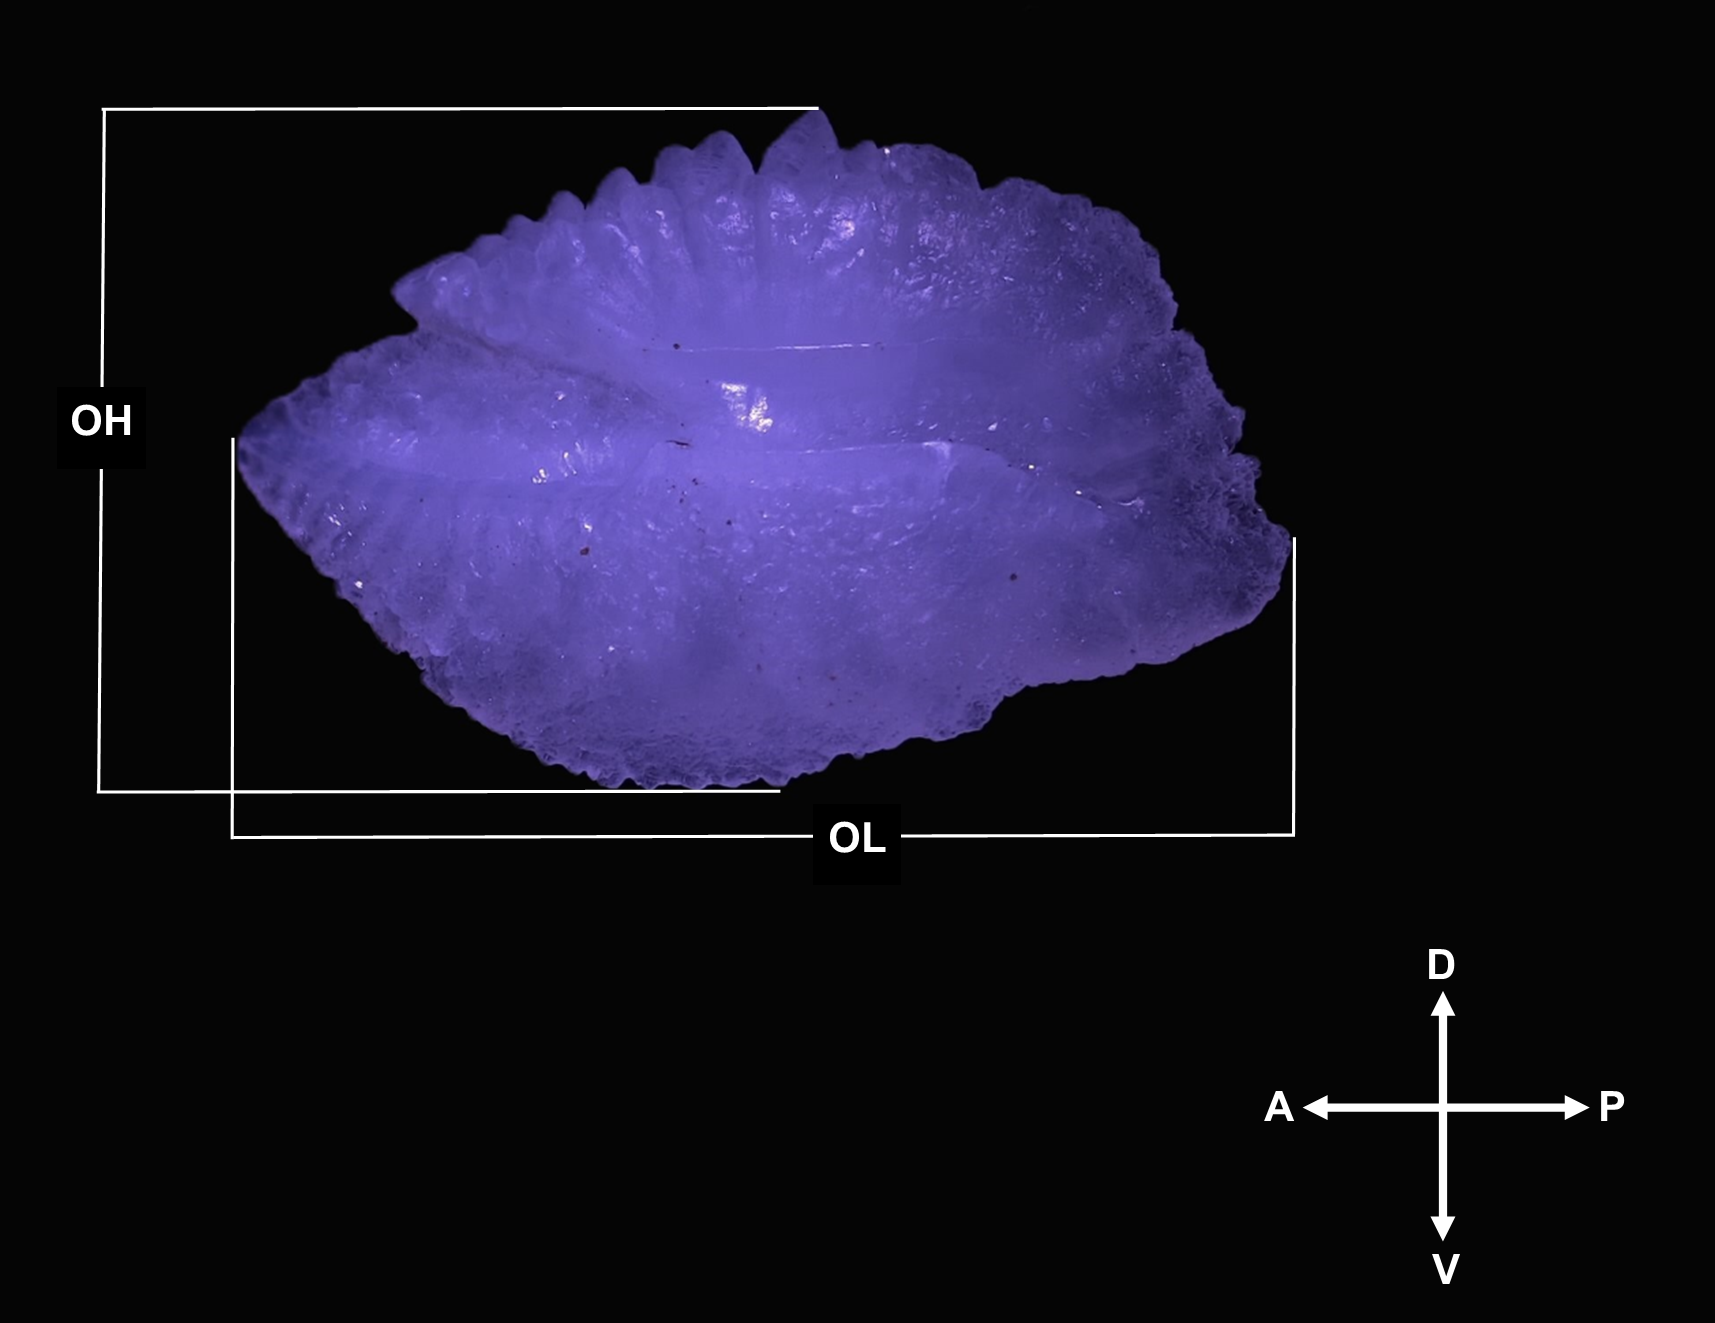
Otolith morphometric variables measured and used in this study: Otolith Length (OL); Otolith Height (OH). Otolith Area (OA) is the total area of the otolith face and Otolith Perimeter (OP) is the outline of the otolith.
where is the allometry-corrected parameter, is the raw otolith parameter, is the mean length of fish, x is the size of the fish sample, and b is the slope of the regression between and . Additionally, otolith shape variables were derived from the size-related variables following Osman et al. (2021): rectangularity (RE), ellipticity (EL), roundness (RO), aspect ratio (AR), form factor (FF), compactness (CO), and circularity (CI) (Table 1). These descriptors were selected based on their established correlations with fish size reported in earlier studies (e.g. Barnuevo et al., 2023; Morales et al., 2023).
Table 1
| Size-related descriptors | Shape-related descriptors |
|---|---|
| OL | |
| OH | |
| OA | |
| OP | |
Morphometric and shape descriptors used in the study.
2.3 Data preparation
All otolith morphometric and biometric data were compiled into a master dataset linking fish length to otolith measurements. Prior checking of possible differences in otolith morphometric variables between sexes were performed. Since results have shown low to no variability between sexes () in all species, otoliths from both males and females were considered for the analyses. To account for ecological differences, analyses were conducted at three hierarchical levels: (a) species; (b) ecological guild (pelagic vs. demersal); and (c) sub-guild (demersal, small pelagic, large pelagic). All continuous variables (fish length, OL, OH, OA, OP, RE, EL, RO, AR, FF, CO, CI) were log transformed prior to statistical analyses to improve normality and homoscedasticity.
2.4 Exploratory analyses
Multicollinearity among otolith variables was assessed using correlation matrices. Principal Component Analysis (PCA) was applied to reduce dimensionality and visualize clustering patterns. Group differences in morphometric variables were tested using Permutational Multivariate Analysis of Variance (PERMANOVA). When assumptions of normality were met, Multivariate Analysis of Variance (MANOVA) was also applied. Post-hoc differences among species and guilds were examined using pairwise PERMANOVA.
2.5 Regression-based modeling
2.5.1 Univariate linear models
Relationships between fish length and individual otolith morphometric variables were explored using simple univariate linear regressions of the form:
where is the log-transformed fish length, is a single morphometric variable (OL, OH, OA, OP, RE, EL, RO, AR, FF, CO, CI), and is the error term. These models provided initial assessments of linearity and predictor strength.
2.5.2 Multivariate linear models
To evaluate combined predictor effects, multiple linear models (MLMs) were constructed using all 11 otolith morphometric variables as predictors:
Model selection followed a stepwise approach using Akaike’s Information Criterion (AIC) to identify the most parsimonious model per species. multicollinearity was checked via variance inflation factors (). Residual normality and independence were verified through Q-Q plots and the Shapiro-Wilk test.
2.5.3 Nonlinear and generalized additive models
Nonlinear regression models of the form
were fitted by applying linear regression to log-transformed data where L is the fish length, X is the otolith morphometric variable, and a and b, respectively, are the intercept and slope of the regression.
Additionally, univariate and multivariate GAMs were implemented:
where are smooth functions estimated via penalized regression splines. Model selection was based on explained deviance and generalized cross-validation (GCV) scores.
2.6 Machine learning models
Predictive modeling was conducted using machine learning algorithms implemented in the caret package (Kuhn, 2008). Three methods were tested: Random Forest (rf), Support Vector Machine with Radial Basis Kernel (svm-Radial), and k-Nearest Neighbors (kNN). All methods used the formula:
Performance metrics (cross-validated and ) were extracted for each model type across species and guilds for a fair comparison.
2.6.1 Model evaluation
To ensure a consistent evaluation framework, all model types, including linear, nonlinear, GAMs, and ML models were assessed using a five-fold cross-validation procedure. For linear and power-law models, cross-validation was implemented using the caret package, with the dataset randomly partitioned into five folds of approximately equal size. Each model was trained on four folds and tested on the remaining fold, repeated across all folds, and average performance metrics () were computed.
2.6.2 Variable importance analysis
The relative importance of OL, OH, OA, OP, RE, EL, RO, AR, FF, CO, and CI were quantified using variable importance functions in caret. Importance scores were extracted separately for each algorithm and aggregated to identify consistent predictors of fish length across species and guilds.
2.7 Statistical analyses
All statistical analyses were performed in R version 4.3.0 (R Core Team, 2023). Data wrangling and visualization were carried out using the packages tidyverse (Wickham et al., 2019) and ggplot2 (Wickham, 2016). Multivariate analyses (PCA, PERMANOVA, MANOVA) were implemented using vegan (Oksanen et al., 2025). Regression and Generalized Additive Models (GAMs) were fitted using the Mixed GAM Computational Vehicle (mgcv) package (Wood, 2017). Machine learning algorithms (rf, svm-Radial, kNN) and variable importance analyses were implemented in caret. Model evaluation metrics ( and ) were calculated with caret. Figures were prepared using ggplot2.
3 Results
A total of 669 otoliths were measured and analyzed across six species representing pelagic and demersal guilds. The lengths of juvenile Thunnus albacares ranged from 158–347 mm FL; Selar crumenophthalmus measured 110–224 mm TL, while Decapterus kurroides ranged from 158–257 mm TL. Nemipterus hexodon samples were 76–190 mm SL; N. japonicus measured 114–201 mm, and N. nematopus were 116–193 mm. The largest otoliths were from N. japonicus (OL = 8.80 mm; 5.26 mm; OA = 5.26 mm2; OP = 61.9 mm), while the smallest otoliths were from D. kurroides (OL = 0.41 mm; OH = 0.19 mm; OA = 0.05 mm2; OP = 0.99 mm).
The strongest correlations between otolith variables (except CI) and fish length were found in D. kurroides (, while the weakest () were in N. hexodon. Across guilds, the pelagic group had stronger correlations between otolith variables, with r values ranging from . Meanwhile, the demersal group had values ranging from , excluding EL.
3.1 Multivariate analyses
Principal Component Analysis revealed a clear separation of the guilds (pelagic and demersal species), with the pelagic guild at the positive axis of the first principal component (57.2% variance) and the demersal guild (Nemipterus spp.) aggregated within the negative axis (see Supplementary A).
PERMANOVA detected significant differences in otolith morphometric variables between species, guilds, and sub-guilds (), with the greatest variance explained at the species level (), followed by sub-guild (), and guild (). MANOVA yielded similar results (), confirming robust differences in otolith morphometric variables among groups.
3.2 Linear models
3.2.1 Univariate linear models
Cross-validated univariate linear regressions revealed strong species-specific differences in the ability of otolith variables to predict fish length. Overall model performance was highly variables was highly variable across taxa, with demersal species consistently showing stronger linear relationships than pelagic species.
Among all predictors, OL and OA were the most stable predictors, yielding the highest values in several demersal species, whereas OP, RE, and EL generally produced the weakest fits. The strongest linear relationships were observed in D. kurroides () and N. hexodon ( up to 0.69; ). In contrast, T. albacares and S. crumenophthalmus exhibited very weak univariate fits (), indicating limited predictive power of single otolith variables for highly mobile species.
3.2.2 Multivariate linear models
Multivariate linear models that included all otolith variables improved predictive performance in several species but only moderate in most cases. The otolith-length models are presented in Table 2. Gains in explanatory power were generally minimal ( for most taxa), suggesting that variation in fish length is largely captured by one or two strong predictors rather than all morphometric variables combined.
The highest multivariate values were observed in D. kurroides () and S. crumenophthalmus (), with the latter showing a substantial improvement from its weak univariate fits (see Supplementary B). residual diagnostics indicated no major violations of linear model assumptions. Overall, additive linear effects provided limited advantage over the best univariate predictors.
3.3 Nonlinear (log-log) models
Results of nonlinear regressions have shown minimal improvement from linear models, with most species exhibiting () (see Table 2). Similar to the linear models, nonlinear models performed exceptionally well for D. kurroides () and moderately for N. hexodon ( up to 0.70) but remained weak for where values were for most variables. These patterns indicate that simple scaling relationships adequately describe otolith-length allometry, and nonlinear curvature contributes little additional explanatory power.
Table 2
| Species | Linear model |
|---|---|
| Thunnus albacares | |
| Selar crumenophthalmus | |
| Decapterus kurroides | |
| Nemipterus hexodon | |
| Nemipterus japonicus | |
| Nemipterus nematopus | |
| Nonlinear Model (log-log) | |
| Thunnus albacares | |
| Selar crumenophthalmus | |
| Decapterus kurroides | |
| Nemipterus hexodon | |
| Nemipterus japonicus | |
| Nemipterus nematopus | |
Summary of linear and nonlinear models for otolith morphometric and shape variables as predictors of fish length.
3.4 Generalized additive models
Cross-validated GAMs (Table 3) further highlighted differences in the functional form and predictive value of otolith variables among species. Across species, D. kurroides and S. crumenophthalmus demonstrated the greatest benefit from GAM flexibility, whereas several demersal taxa showed little improvement over their best linear or nonlinear models.
Table 3
| Model | Species | |||||||||||
|---|---|---|---|---|---|---|---|---|---|---|---|---|
| Thunnus albacares | Selar crumenophthalmus | Decapterus kurroides | Nemipterus hexodon | Nemipterus japonicus | Nemipterus nematopus | |||||||
| R2 | RMSE | R2 | RMSE | R2 | RMSE | R2 | RMSE | R2 | RMSE | R2 | RMSE | |
| Univariate GAM (logOL) | 0.00 | 0.22 | 0.24 | 0.11 | 0.91 | 0.04 | 0.13 | 0.17 | 0.00 | 0.14 | 0.00 | 0.11 |
| Univariate GAM (logOH) | 0.05* | 0.22 | 0.11 | 0.12 | 0.87 | 0.04 | 0.10 | 0.17 | 0.02 | 0.14 | 0.06* | 0.11 |
| Univariate GAM (logOA) | 0.03 | 0.22 | 0.21 | 0.12 | 0.92 | 0.03 | 0.15 | 0.16 | 0.00 | 0.14 | 0.01 | 0.11 |
| Univariate GAM (logOP) | 0.00 | 0.22 | 0.21 | 0.12 | 0.93 | 0.03 | 0.07 | 0.17 | 0.14 | 0.13 | 0.04 | 0.11 |
| Univariate GAM (logRE) | 0.00 | 0.22 | 0.70 | 0.07 | 0.11 | 0.11 | 0.00 | 0.18 | 0.10 | 0.13 | 0.00 | 0.11 |
| Univariate GAM (logEL) | 0.04 | 0.22 | 0.02 | 0.13 | 0.53 | 0.08 | 0.00 | 0.18 | 0.00 | 0.14 | 0.03 | 0.11 |
| Univariate GAM (logRO) | 0.00 | 0.22 | 0.52 | 0.09 | 0.58 | 0.08 | 0.01 | 0.18 | 0.00 | 0.14 | 0.02 | 0.11 |
| Univariate GAM (logAR) | 0.04 | 0.22 | 0.02 | 0.13 | 0.53 | 0.08 | 0.00 | 0.18 | 0.00 | 0.14 | 0.03 | 0.11 |
| Univariate GAM (logFF) | 0.03 | 0.22 | 0.50 | 0.09 | 0.73 | 0.06 | 0.14 | 0.16 | 0.15* | 0.13 | 0.02 | 0.11 |
| Univariate GAM (logCO) | 0.03 | 0.22 | 0.50 | 0.09 | 0.73 | 0.06 | 0.14 | 0.16 | 0.15 | 0.13 | 0.02 | 0.11 |
| Univariate GAM (logCI) | 0.00 | 0.22 | 0.26 | 0.11 | 0.91 | 0.04 | 0.08 | 0.17 | 0.00 | 0.14 | 0.00 | 0.11 |
| Multivariate GAM | 0.14 | 0.21 | 0.87* | 0.05 | 0.95* | 0.03 | 0.29* | 0.15 | 0.23 | 0.12 | 0.10 | 0.10 |
| Pelagic | Demersal | |||||||||||
| R2 | RMSE | R2 | RMSE | |||||||||
| Univariate GAM (logOL) | 0.43 | 0.18 | 0.21 | 0.16 | ||||||||
| Univariate GAM (logOH) | 0.43 | 0.18 | 0.25 | 0.15 | ||||||||
| Univariate GAM (logOA) | 0.42 | 0.18 | 0.22 | 0.16 | ||||||||
| Univariate GAM (logOP) | 0.42 | 0.18 | 0.06 | 0.17 | ||||||||
| Univariate GAM (logRE) | 0.05 | 0.23 | 0.06 | 0.17 | ||||||||
| Univariate GAM (logEL) | 0.35 | 0.19 | 0.10 | 0.17 | ||||||||
| Univariate GAM (logRO) | 0.42 | 0.18 | 0.05 | 0.17 | ||||||||
| Univariate GAM (logAR) | 0.36 | 0.19 | 0.09 | 0.17 | ||||||||
| Univariate GAM (logFF) | 0.50 | 0.17 | 0.10 | 0.17 | ||||||||
| Univariate GAM (logCO) | 0.50 | 0.17 | 0.10 | 0.17 | ||||||||
| Univariate GAM (logCI) | 0.42 | 0.18 | 0.07 | 0.17 | ||||||||
| Multivariate GAM | 0.55* | 0.16 | 0.33* | 0.15 | ||||||||
Summary of cross-validated model metrics for Generalized Additive Models (GAMs) per species and guild.
*: best predictor(s).
For T. albacares, univariate GAMs explained only 0-5% of variance, with OP and OH yielding the highest but still weak fits (; Figure 3), consistent with the low predictive performance of linear and nonlinear models. In S. crumenophthalmus, univariate GAMs captured 11-26% of variance, with OP, OL, and CI performing best. The multivariate model substantially improved performance (), indicating that flexible, nonlinear smoothing can capture additional structure that were not detected in earlier models. D. kurroides achieved excellent predictive accuracy across all GAM forms (univariate ; multivariate ).
Figure 3
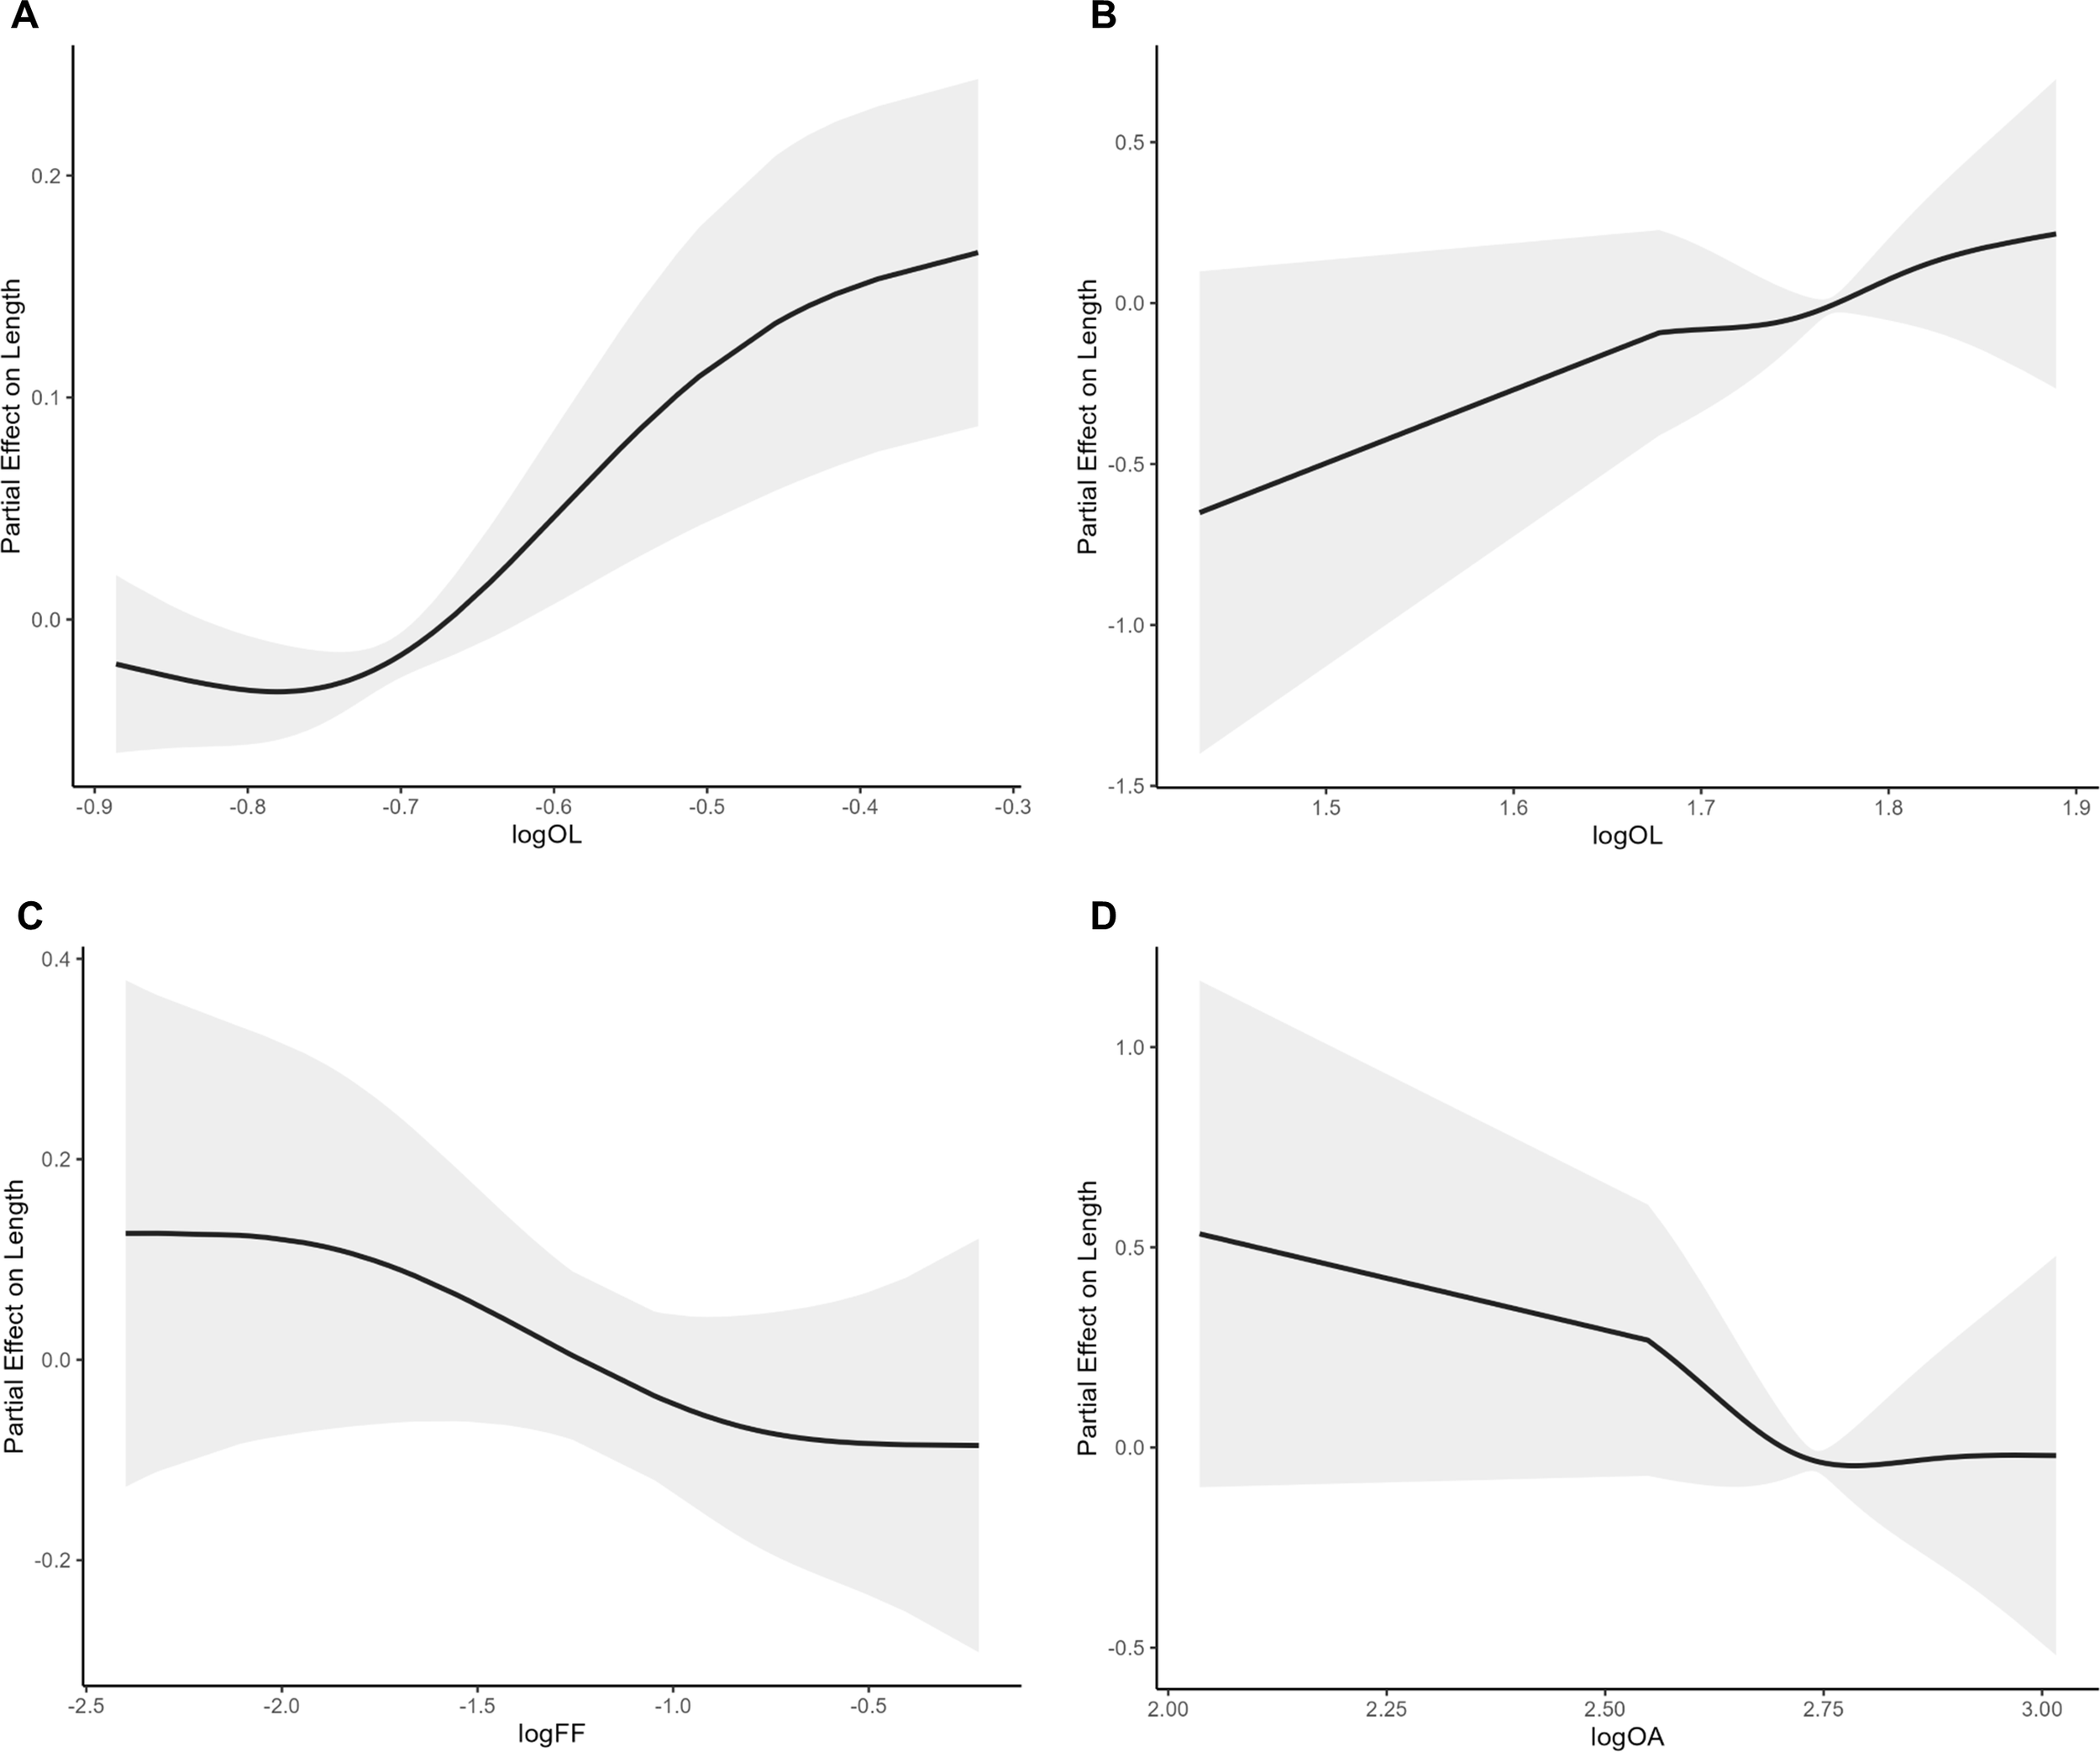
Partial smoothing of the best single otolith predictors for Decapterus kurroides(A), Nemipterus hexodon(B, D), and Nemipterus japonicus(C).
N. hexodon performed moderately (); N. japonicus had weak univariate fits (), but multivariate GAM improved performance to ; N. nematopus also showed limited performance ().
At the guild level, pelagic species achieved higher GAM performance (univariate ) than demersal species () for most predictors, except for RE where both groups performed poorly. Multivariate GAMs improved fits for both guilds (pelagic ; demersal ), though gains were more pronounced for pelagic taxa.
3.5 Machine learning models
Model metrics for Random Forest (rf), Support Vector Machine with Radial kernel (svm-Radial), and k-Nearest neighbors (kNN) are summarized in Figure 4. RF generally produced the highest predictive accuracy (), followed closely by kNN (), and then svm-Radial (). At the species level, the strongest predictions were achieved for D. kurroides (kNN, ), consistent with this species’ strong otolith-length relationships observed in earlier analyses. In contrast, S. crumenophthalmus exhibited the weakest ML performance (rf, ), likely reflecting weaker and more variable otolith-length relationships.
Figure 4
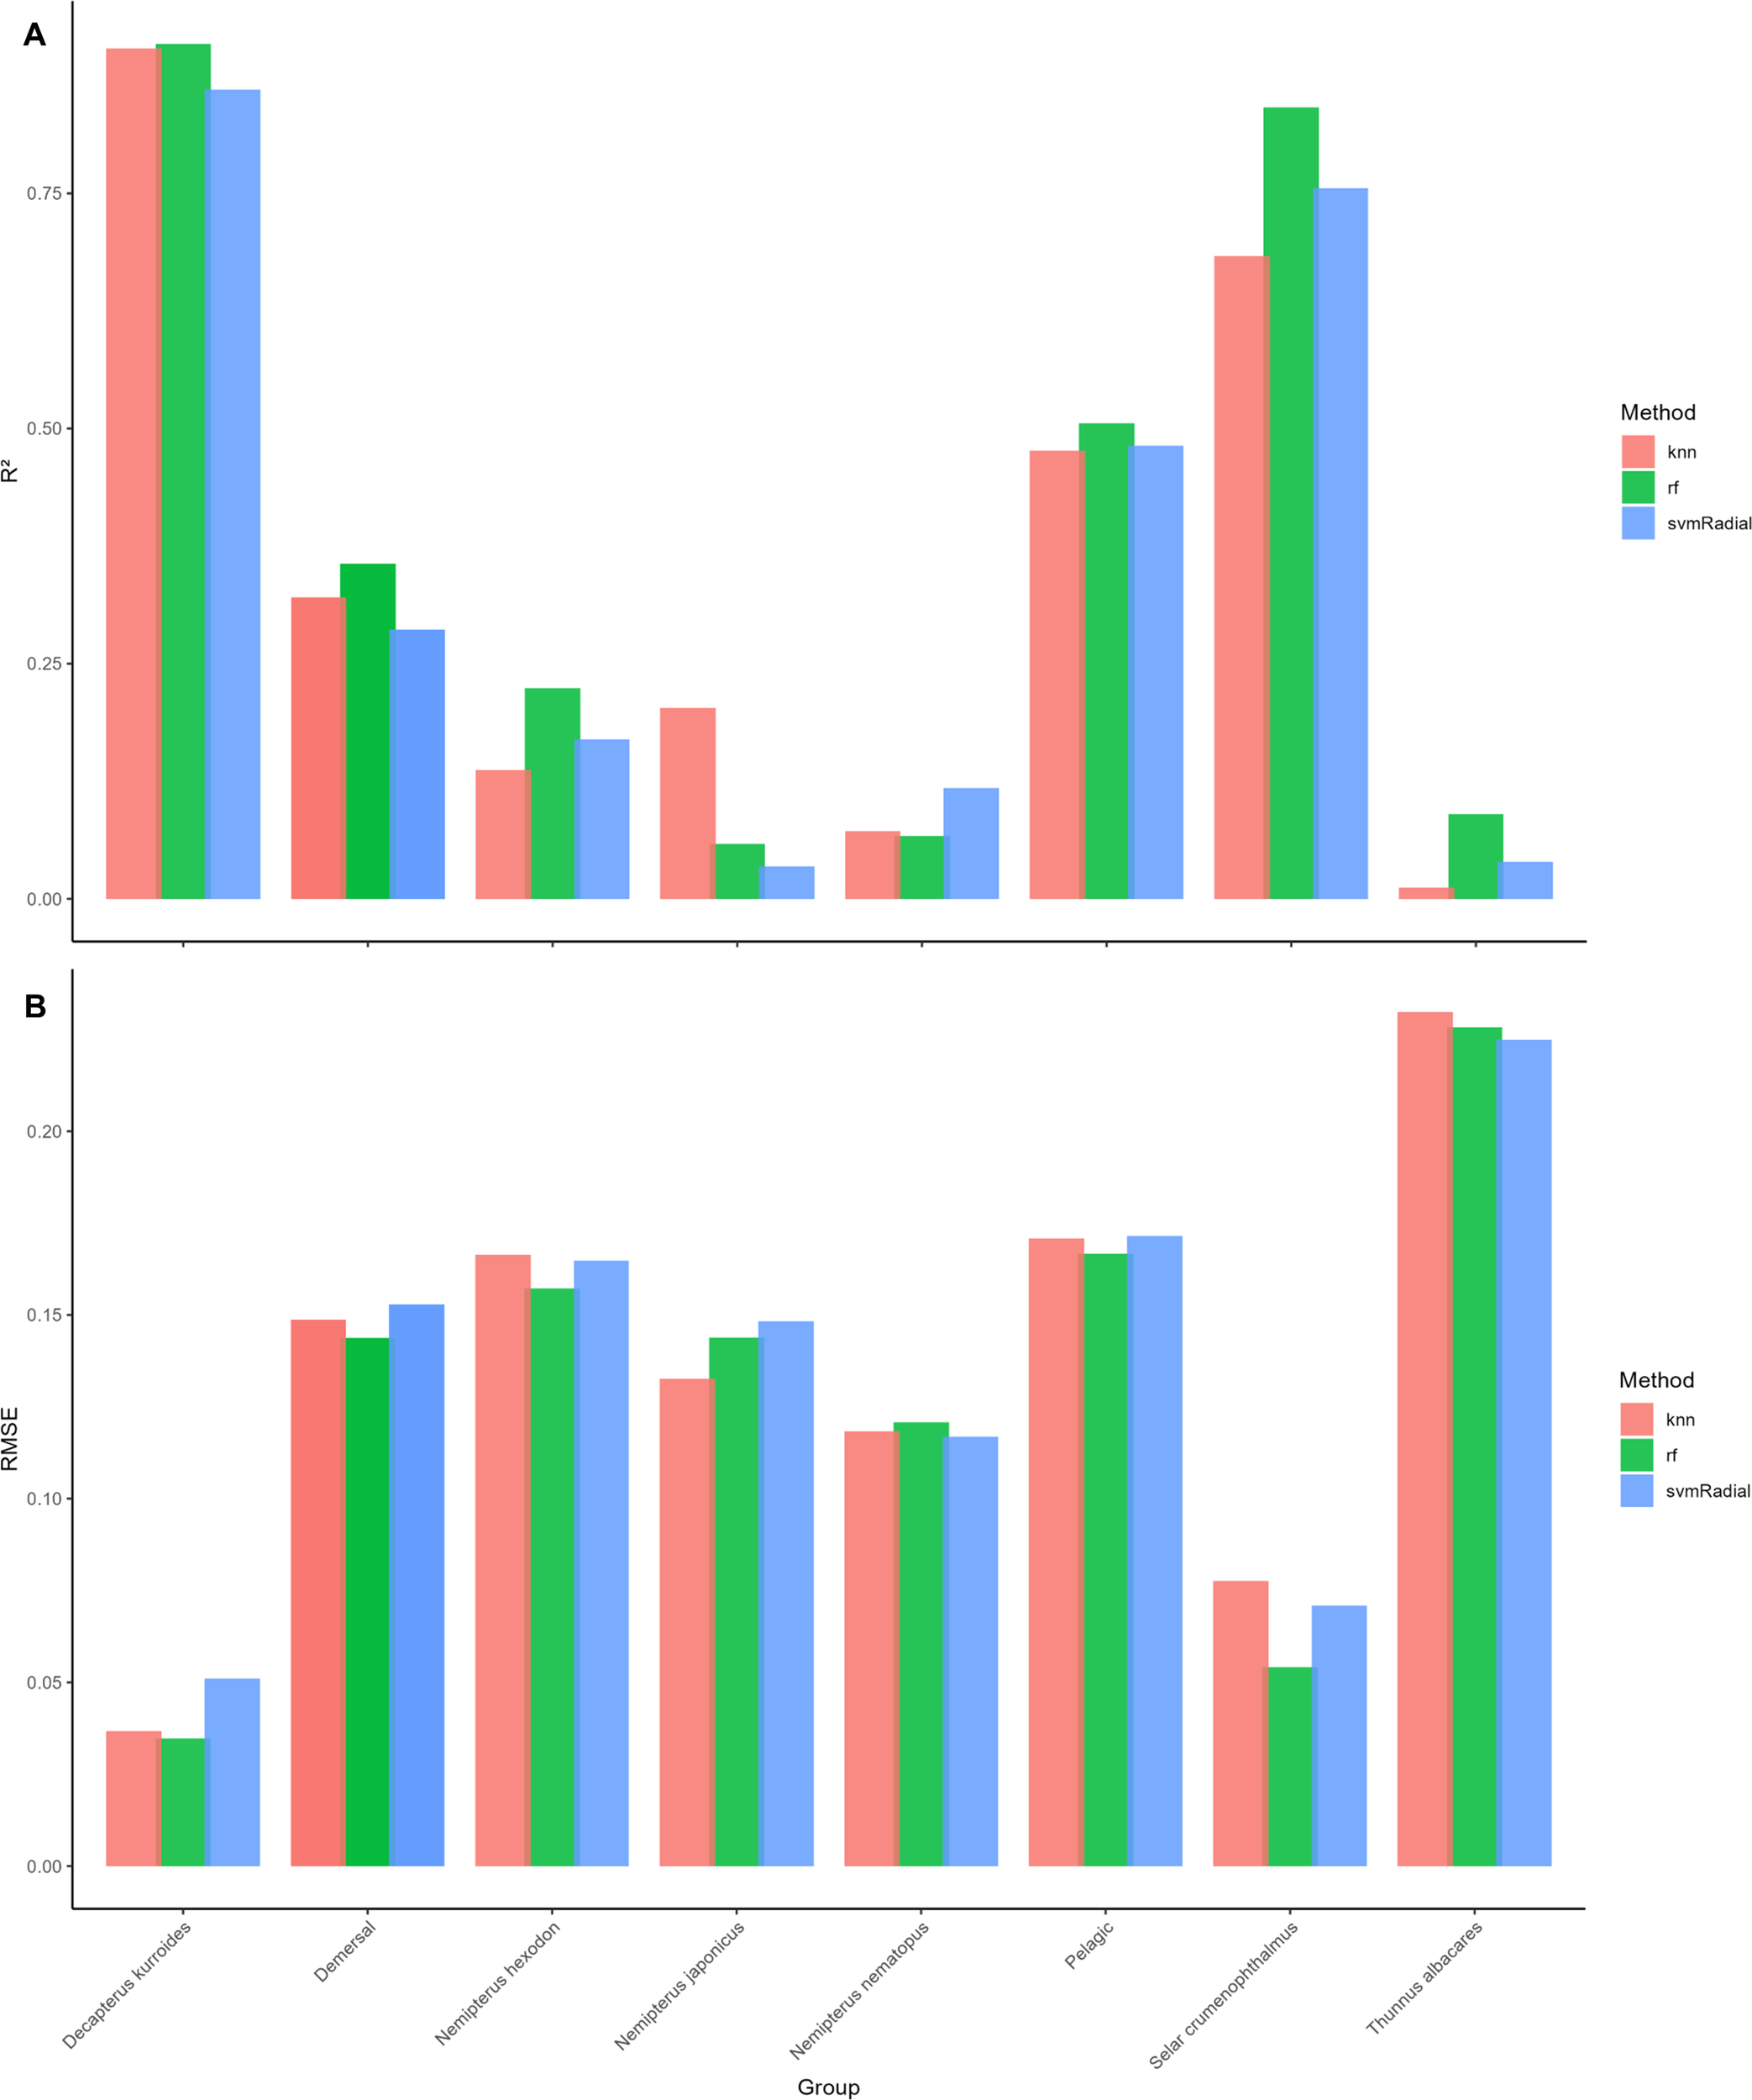
Summary of model metrics, (A) and (B) of the different machine learning (ML) models across species and guilds.
Guild-level patterns also aligned with species-specific trends. RF produced the best results for demersal species () and large pelagics (), while kNN performed best in small pelagics (). These results closely mirrored the outcomes from regression and GAMs, where species with tighter and more linear otolith-length scaling also showed superior ML performance.
3.5.1 Variable importance
Variable importance patterns (Figure 5) were highly consistent across ML methods. OL emerged as the most influential predictor overall ), followed closely by OA (). OH showed moderate importance (), whereas OP contributed the least on average Several species showed 100% importance for OL (e.g., T. albacares, N. japonicus, N. nematopus), with OA consistently ranking second. In contrast, OA dominated in S. crumenophthalmus and D. smithvanizi, each with OA reaching 100% importance.
Figure 5
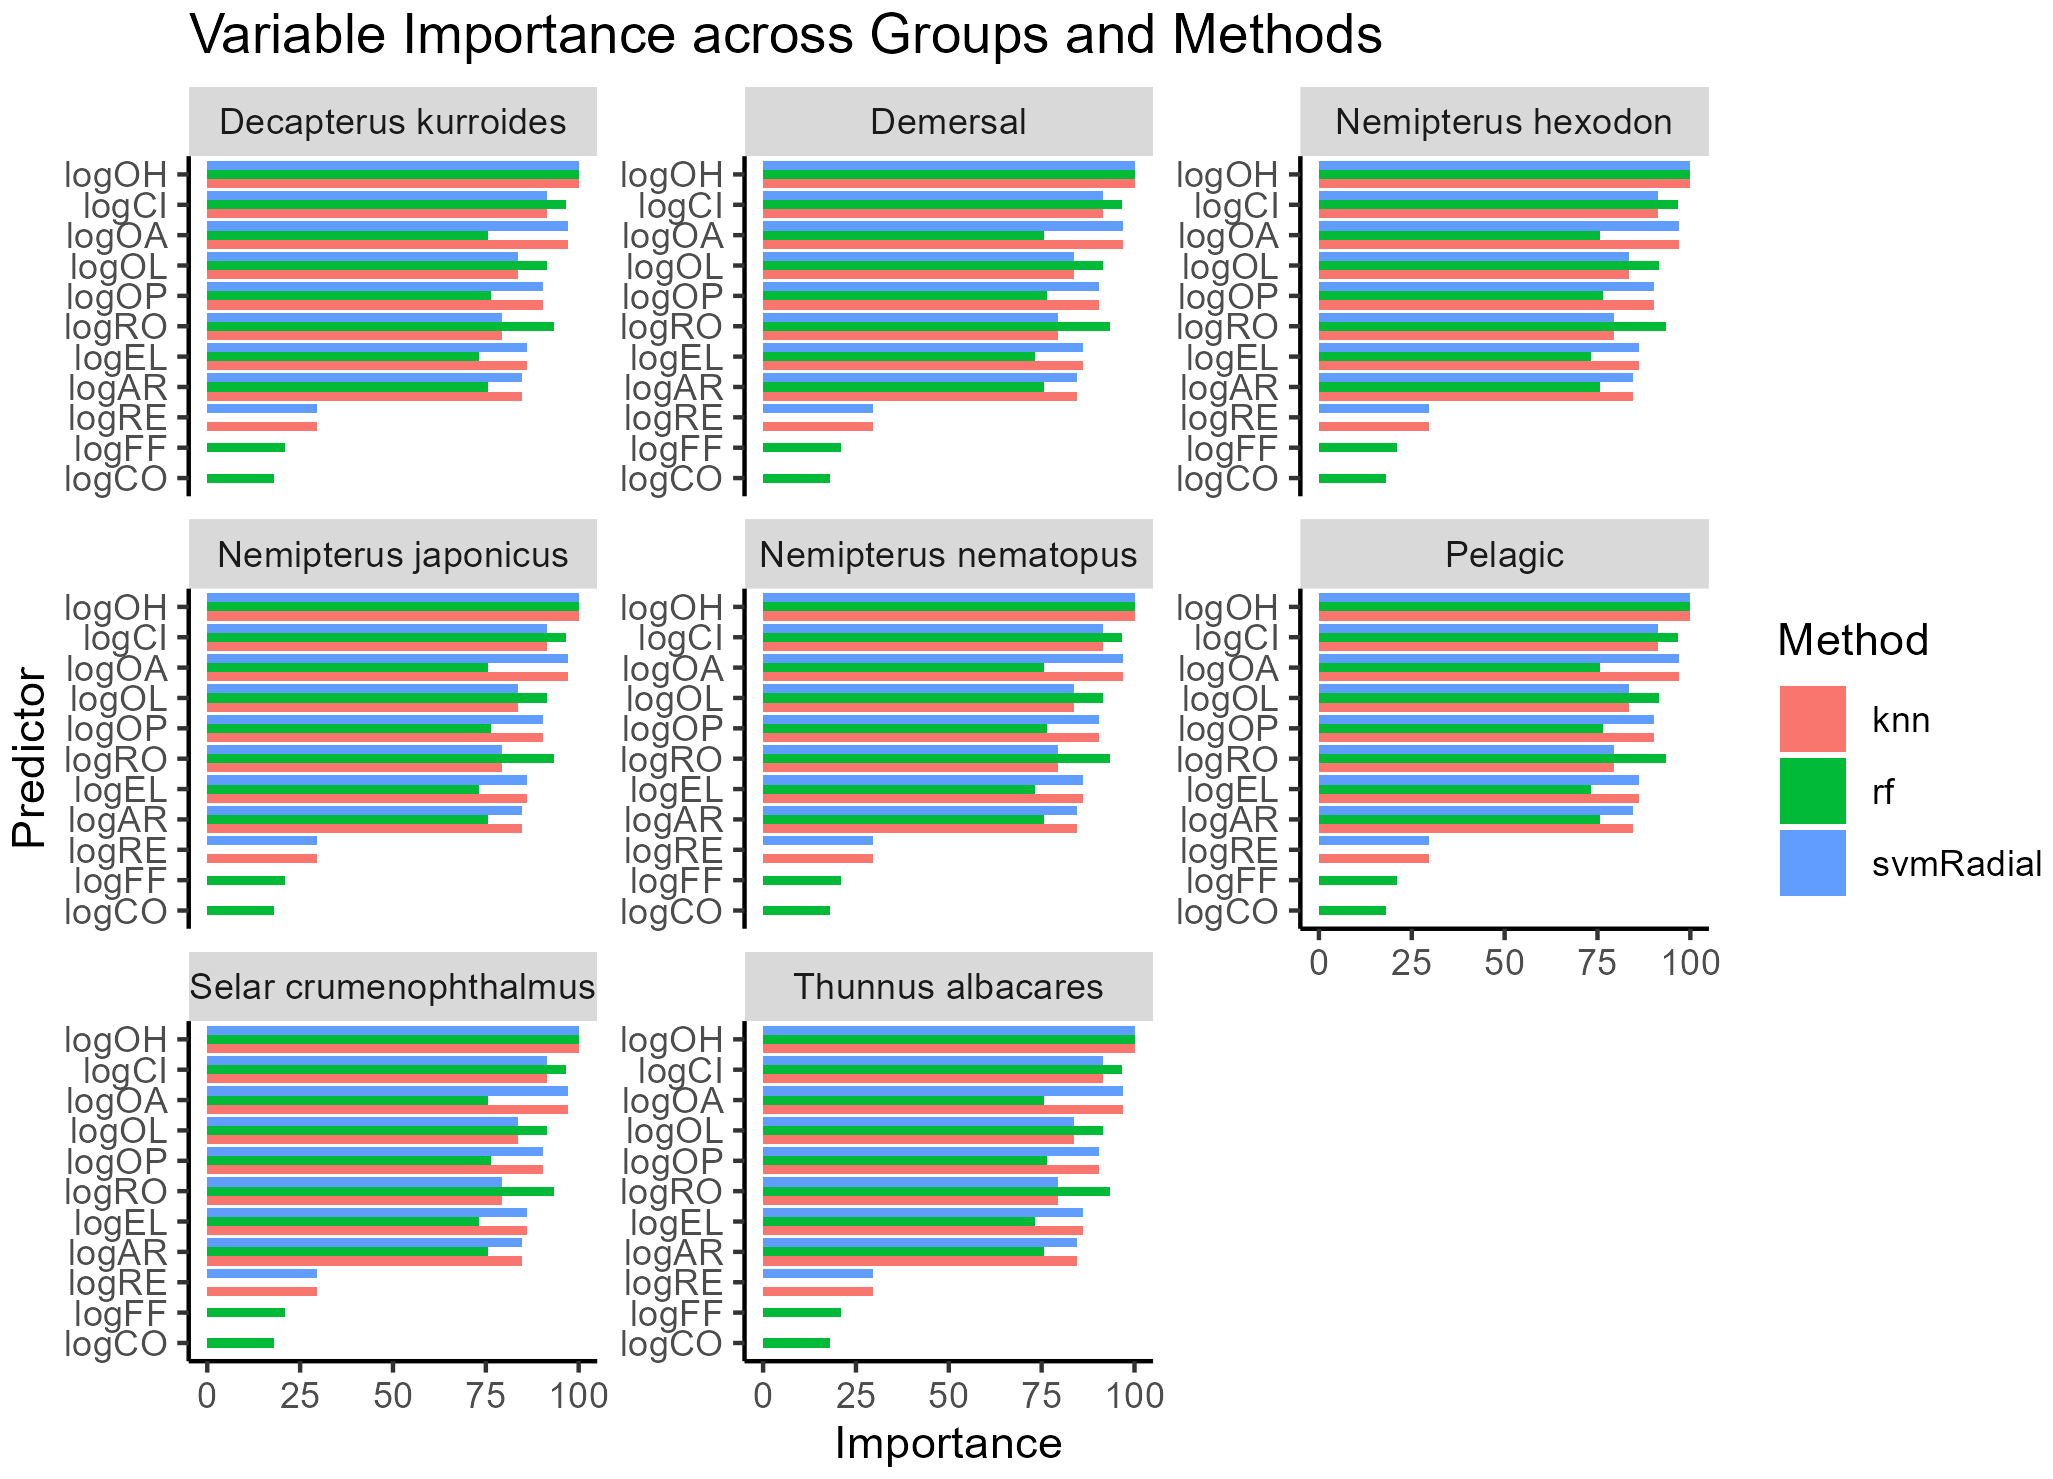
Bar plots showing the ranked mean Variable Importance across groups and machine learning (ML) methods.
Guild-level importance patterns also emerged: OP was relatively more important in pelagic species, while demersal species consistently relied more heavily on OH and OL. These results reinforce the cross-species robustness of OL and OA as the primary morphometric predictors of fish length.
3.5.2 Cross-validation and robustness
Cross-validation demonstrated high model stability, with RMSE values showing minimal variation across folds. Performance was consistently strong for D. kurroides and N. japonicus, while S. crumenophthalmus showed slightly lower accuracy. This is likely due to smaller sample size, greater within-species variability, and weaker linear scaling in otolith metrics. No evidence of overfitting was observed for any model, indicating that all ML approaches generalized well across species and guild categories.
3.6 Model performance comparison
Among all modeling approaches, ML models, particularly rf, yielded the highest overall predictive accuracy. However, improvements over simpler models (linear regression, nonlinear regression, and GAMs) were modest for species with strong and largely linear otolith-length relationships (e.g. D. kurroides). In such cases, simpler parametric models may be sufficient, whereas ML models provided clearer advantages for species exhibiting nonlinearities or less consistent relationships.
3.7 Comparative insights
Across all statistical and machine learning approaches, OL consistently emerged as the strongest single predictor of fish length, with OA serving as a reliable secondary predictor. ML models captured subtle nonlinear interactions, particularly between OL and OH, that were not as apparent in linear models or GAMs. Species- and guild-specific differences were evident: demersal species generally showed stronger, more predictable otolith-length relationships across all modeling frameworks, while pelagic species displayed greater variability. These findings underscore the broader applicability of otolith morphometrics, particularly OL and OA, for reconstructing fish length across diverse taxa.
4 Discussion
This study evaluated the predictive performance of 11 otolith morphometric and shape variables across six fish species from tropical Philippine fishing grounds, spanning both pelagic and demersal guilds, using linear and nonlinear regressions, GAMs, and Machine Learning (ML) approaches. Otolith length (OL) and otolith area (OA) consistently emerged as the strongest predictors of fish length, while otolith perimeter (OP) generally showed the weakest performance. These findings align with the well-established premise that otolith size scales proportionally with somatic growth (Campana and Thorrold, 2001). Regression models produced strong fits for demersal species and Decapterus kurroides, while GAMs captured moderate nonlinearities in species with variable growth histories. ML models (rf, knn, svmRadial) achieved the highest overall predictive accuracy, particularly for species exhibiting greater growth plasticity. Collectively, the results demonstrate that otolith–length relationships are highly species-specific but follow ecological patterns shaped by habitat stability, feeding behavior, and growth dynamics.
Clear interspecific and interguild differences emerged. Demersal species consistently showed stronger and more predictable relationships between otolith morphometry and fish length than pelagic species, a pattern consistent with previous work on Decapterus spp. (Athaa et al., 2023; Barnuevo et al., 2023; Morales et al., 2023) and demersal taxa (Nemipterus japonicus: , Aufy et al., 2023). Otolith dimensions in Thunnus albacares are known to correlate with body length but often with greater variability (Santana-Hernandez et al., 2008), consistent with our findings.
D. kurroides produced some of the highest values (), rivaling demersal species. Its midwater schooling ecology and association with relatively stable mesopelagic–neritic environments, including reef-associated waters (Smith-Vaniz, 1986) and FAD-linked foraging zones shared with other carangids, likely reduce environmental variability. Regular feeding in planktivorous fishes supports predictable somatic growth and consistent otolith accretion (Gagliano and McCormick, 2004), which may explain the strong otolith–fish length coupling observed in this species.
In contrast, Selar crumenophthalmus exhibited weak to moderate predictability () across modeling methods. This species inhabits dynamic epipelagic waters where temperature, plankton availability, and mixing depth fluctuate over short timescales (Widodo, 1997). Bigeye scads respond rapidly to upwelling and thermal shifts, patterns characteristic of small pelagic fishes in the region (Ushadevi et al., 2013). Their strong association with FADs (Babaran and Ishizaki, 2011; Macusi et al., 2017) increases stock mixing and introduces individuals with heterogeneous growth histories. These combined pressures—short-term prey variability, thermal fluctuations, and mixed-origin aggregations—likely weaken somatic–otolith coupling and generate inconsistent otolith accretion, explaining the lower performance of both classical and ML models (Campana and Thorrold, 2001; Hüssy, 2008b).
Findings for T. albacares reflect well-documented early-life growth variability. Juvenile yellowfin tuna (0–35 cm FL, as used here) experience rapid somatic expansion, strong ontogenetic shifts in diet and vertical habitat use, and high metabolic plasticity (Margulies et al., 2023; Wexler et al., 2007). These early stages occur in the dynamic surface waters of the West Philippine Sea, where fluctuations in temperature, prey availability, and oceanographic structure strongly influence otolith deposition. Environmental variability and ontogenetic transitions during juvenile phases weaken somatic–otolith coupling (Campana and Neilson, 1985; Lombarte and Lleonart, 1993; Hüssy, 2008a), contributing to the weaker predictive performance observed for this species relative to demersals and D. kurroides.
Alongside biological differences, spatial and environmental variability across sampling regions also plays a role. The West Philippine Sea (open ocean, high variability), Sulu Sea (deep basin with FAD-dominated fisheries), and Visayan Sea (semi-enclosed and environmentally stable) differ markedly in thermal structure, productivity, and prey dynamics. These conditions can influence otolith shape and growth. Differences in otolith morphology across regions have been widely documented (Cardinale et al., 2004; Rodgveller et al., 2017), and environmental factors such as temperature and feeding conditions are known drivers of otolith accretion (Gagliano and McCormick, 2004). Such regional heterogeneity mirrors broader challenges in tropical archipelagic fisheries, where high species diversity and limited reference material (i.e. Motomura et al., 2017) complicate morphometric applications.
Demersal species (N. japonicus, N. hexodon, N. nematopus) showed the most robust otolith–length relationships across all modeling approaches. Their benthic habitats (Russell, 2001), such as the relatively stable, semi-enclosed Visayan Sea, exhibit minimal short-term variability in temperature, productivity, and prey availability. Environmental stability is known to promote predictable somatic growth and consistent otolith accretion (Hüssy, 2008a; Miller and Hurst, 2020; Mahé et al., 2024), producing the high values observed across regression, GAMs, and ML methods. Pelagic species, in contrast, experience higher thermal variability, episodic prey dynamics, and energetically costly schooling and migration, all of which introduce growth plasticity and weaken the somatic–otolith scaling required for strong predictive models (Campana and Thorrold, 2001; Stormer and Juanes, 2016).
Model performance followed clear ecological and biological gradients. Regression models performed best for species with stable growth and predictable environments (demersals and D. kurroides). GAMs improved fits for species with moderate nonlinearities, such as S. crumenophthalmus and juvenile T. albacares, where growth transitions or variable environments influence otolith accretion. ML models, particularly random forest, outperformed classical methods where species exhibited heterogeneous growth trajectories, complex ecological drivers, or shape-related variability (OP, OH). ML captured interactions such as , which may reflect subtle structural differences in otolith shape linked to diet, energy allocation, or habitat complexity.
Otolith-based length estimation has substantial application in tropical mixed-species fisheries, where fish often arrive gutted, damaged, or filleted. OL and OA provide consistent, transferable metrics for reconstructing length across multispecies landings. Model choice should consider ecological context: regression models suffice in stable environments, but GAMs or ML are more appropriate in dynamic habitats, mixed-stock fisheries, and species with high growth plasticity. Given that most pelagic species sampled were FAD-associated, mixed-stock conditions may alter otolith morphology and growth signals; ML models handled this heterogeneity better than classical regressions. These findings are aligned with emerging fisheries tools such as automated otolith measurement, image-based species recognition, and large-scale port sampling systems.
Taken together, our results demonstrate that otolith morphometric variables can serve as robust predictors of fish length across multi-species tropical fisheries. Despite interspecific ecological differences, OA and OL consistently emerged as the strongest predictors across regression, GAMs, and ML approaches, while OP contributed less. The concordance of results across modeling frameworks highlights the reliability of these descriptors, particularly in demersal and midwater species with stable growth dynamics. These findings build on and extend previous single-species studies, offering a strong empirical foundation for standardized otolith-based size estimation and contributing valuable insights into growth ecology across diverse, ecologically and economically important marine taxa.
5 Conclusion
This study demonstrates that otolith morphometric variables, particularly otolith length (OL) and otolith area (OA), are powerful and reliable predictors of fish length across multiple pelagic and demersal species from major Philippine fishing grounds. By integrating linear and nonlinear regressions, generalized additive models (GAMs), and machine learning (ML) approaches, we show that the strength of otolith–somatic scaling is shaped by species-specific ecology, habitat stability, feeding dynamics, and life-history patterns. Demersal species and the midwater schooling D. kurroides exhibited the most predictable otolith-length relationships, reflecting the influence of stable benthic or midwater environments and consistent energy allocation on otolith accretion. In contrast, S. crumenophthalmus and juvenile T. albacares showed weaker and more variable predictability, consistent with their exposure to dynamic thermal regimes, fluctuating prey fields, FAD-associated stock mixing, and strong ontogenetic shifts that decouple somatic and otolith growth.
Regression models performed well for species with linear, stable growth trajectories, while GAMs and ML models (particularly Random Forest) captured nonlinearities, early-life plasticity, and subtle interactions among otolith predictors. These results accentuate the importance of matching modeling approaches to species ecology, data structure, and growth behavior. The consistent prominence of OL and OA across all model types highlights their value as standardized metrics for otolith-based length estimation in mixed tropical fisheries.
These findings have practical implications for fisheries science and monitoring in the Philippines and similar multispecies tropical systems. Otolith-based length reconstruction provides a valuable tool for data-limited fisheries where landed catch may be gutted, damaged, or mixed, and where reliable length frequencies are often unavailable. The strong performance of ML models also signals the potential for developing automated otolith measurement and species-identification systems for large-scale port sampling, bycatch monitoring, and historical reconstructions.
Future work should broaden species coverage within individual fishing grounds to isolate habitat-driven variability, incorporate environmental and spatial covariates (e.g. temperature, productivity, FAD distribution) to better quantify ecological drivers of otolith accretion, and explore additional ML approaches such as neural networks, gradient boosting, and ensemble stacking. Targeted evaluations of ontogenetic effects, particularly for highly migratory species such as T. albacares, are needed to clarify developmental influences on otolith-length scaling. Finally, there is strong potential to integrate image-based otolith classification with morphometric prediction models, contributing to the development of a Philippine Otolith Reference Atlas that will support fisheries assessment, biodiversity surveys, and long-term ecological monitoring.
Overall, this study provides new multispecies insights into the biological and ecological drivers of otolith-somatic relationships in tropical systems and establishes a robust methodological foundation for applying otolith morphometrics and ML to fisheries science in the Philippines.
Statements
Data availability statement
The original contributions presented in the study are included in the article/Supplementary Material. Further inquiries can be directed to the corresponding author.
Ethics statement
Ethical approval was not required for the study involving animals in accordance with the local legislation and institutional requirements.
Author contributions
CM: Conceptualization, Data curation, Formal analysis, Investigation, Methodology, Software, Validation, Visualization, Writing – original draft, Writing – review & editing. SL: Data curation, Funding acquisition, Investigation, Resources, Supervision, Writing – review & editing, Project administration. RB: Funding acquisition, Investigation, Resources, Supervision, Writing – review & editing, Validation, Data curation, Project administration.
Funding
The author(s) declared that financial support was received for this work and/or its publication. This study was funded by the UP system Emerging Inter-Disciplinary Research Program (OVPAA-EIDR-C08-011-R), Mentored Research Grant from the University of the Philippines Visayas Office of the Vice Chancellor for Research and Extension (OVCRE) for the project “Discrimination of yellowfin tuna stocks from putative nurseries in the Philippines using otolith chemistry” (SP 14-09), and “Marine Fisheries Assessment of Panay: Building Local Fisheries Information through Research Capability Enhancement in HEIs,” which was supported by the Commission on Higher Education (CHED). The University of the Philippines Visayas' Office of the Vice Chancellor for Research and Extension (UPV-OVCRE) has also provided support for the publication of the paper.
Acknowledgments
The authors acknowledge all individuals and partner institutions who contributed to this study, particularly those involved in fish sampling, otolith collection, and laboratory analyses. We also acknowledge collaborators who provided technical and logistical support throughout the study.
Conflict of interest
The authors declared that this work was conducted in the absence of any commercial or financial relationships that could be construed as a potential conflict of interest.
Generative AI statement
The author(s) declared that generative AI was not used in the creation of this manuscript.
Any alternative text (alt text) provided alongside figures in this article has been generated by Frontiers with the support of artificial intelligence and reasonable efforts have been made to ensure accuracy, including review by the authors wherever possible. If you identify any issues, please contact us.
Publisher’s note
All claims expressed in this article are solely those of the authors and do not necessarily represent those of their affiliated organizations, or those of the publisher, the editors and the reviewers. Any product that may be evaluated in this article, or claim that may be made by its manufacturer, is not guaranteed or endorsed by the publisher.
Supplementary material
The Supplementary Material for this article can be found online at: https://www.frontiersin.org/articles/10.3389/fmars.2025.1711110/full#supplementary-material
References
1
Athaa F. F. Djumanto Partusuwiryo S. Probosunu N. (2023). Correlation of otolith morphometrics with total length and weight of shortfin scad (Decapterus macrosoma) in the special region of Yogyakarta. AACL. Bioflux.16, 957–969. Available online at: https://www.bioflux.com.ro/2023.957-969.pdf (Accessed October 11, 2025).
2
Aufy L. A. Al-Jumaiee S. A. J. Al-atbee I. A. Al-Mansy K. A. (2023). The relationship between otolith dimensions and fish body size of Nemipterus japonicus (Bloch 1791) in Iraqi marine water. J. Surv. Fish. Sci.10, 5209–5215.
3
Babaran R. P. Ishizaki M. (2011). “ Profile of payao (floating artificial reef or Fish attracting device) fisheries in the Philippines,” in Global Change: Interactions mankind-marine Environments. Eds. CeccaldiH.-J.DekeyserI.GiraultM.StoraG. ( Springer Science, Dordrecht, Netherlands), 49–54.
4
Barnuevo K. D. E. Morales C. J. C. Calizo J. K. S. Delloro E. S. Jr. Añasco C. P. Babaran R. P. et al . (2023). Distinct stocks of the redtail scad Decapterus kurroides Bleeker 1855 (Perciformes: Carangidae) from the Northern Sulu and Southern Sibuyan Seas, Philippines revealed from otolith morphometry and shape analysis. Fishes8, 12. doi: 10.3390/fishes8010012
5
Battaglia P. Malara D. Ammendolia G. Romeo T. Andaloro F. (2015). Relationships between otolith size and fish length in some mesopelagic teleosts (Myctophidae, Paralepididae, Phosichthyidae and Stomiidae). J. Fish Biol.87, 774–782. doi: 10.1111/jfb.12744
6
Benson I. M. Helser T. E. Marchetti G. Barnett B. K. (2023). The future of fish age estimation: deep machine learning coupled with Fourier transform near-infrared spectroscopy of otoliths. Can. J. Fish. Aquat. Sci.80, 1482–1494. doi: 10.1139/cjfas-2023-0045
7
Bergenius M. A. J. Begg G. A. Mapstone B. D. (2006). The use of otolith morphology to indicate the stock structure of common coral trout (Plectropomus leopardus) on the Great Barrier Reef. Aust. Fish Bull.104, 498–511.
8
Bostanci D. Polat N. Kurucu G. Yedier S. Konta¸s S. Darçin M. (2015). Using otolith shape and morphometry to identify four Alburnus species (A. chalcoides, A. escherichii, A. mossulensis and A. tarichi) in Turkish inland waters. J. Appl. Ichthyol.31, 1013–1022. doi: 10.1111/jai.12860
9
Campana S. E. (2004). Photographic atlas of fish otolith atlas for the Western Mediterranean, North, and Central Eastern Atlantic. Sci. Mar.72, 7–198.
10
Campana S. E. Neilson J. D. (1985). Microstructure of fish otoliths. Can. J. Fish. Aquat. Sci.42, 1014–1032. doi: 10.1139/f85-127
11
Campana S. E. Thorrold S. R. (2001). Otoliths, increments, and elements: Keys to a comprehensive understanding of fish populations? Can. J. Fish. Aquat. Sci.58, 30–38. doi: 10.1139/f00-177
12
Cardinale M. Doering-Arjes P. Kastowsky M. Mosegaard H. (2004). Effects of sex, stock, and environment on the shape of known-age Atlantic cod (Gadus morhua) otoliths. Can. J. Fish. Aquat. Sci.61, 158–167. doi: 10.1139/f03-151
13
Christensen H. T. Rigét F. Backe M. B. Saha A. Johansen T. Hedeholm R. B. (2018). Comparison of three methods for identification of redfish (Sebastes mentella and S. norvegicus) from the Greenland East coast. Fish. Res.201, 11–17. doi: 10.1016/j.fishres.2018.01.003
14
Dehghani M. Kamrani E. Salarpouri A. Sharifian S. (2016). Otolith dimensions (length, width), otolith weight and fish length of Sardinella sindensis (Day 1878), as index for environmental studies, Persian Gulf, Iran. Mar. Biodivers. Rec.9, 44. doi: 10.1186/s41200-016-0039-0
15
Gagliano M. McCormick M. I. (2004). Feeding history influences otolith shape in tropical fish. Mar. Ecol. Prog. Ser.278, 291–296. doi: 10.3354/meps278291
16
Giménez J. Manjabacas A. Tuset V. M. Lombarte A. (2016). Relationships between otolith and fish size from Mediterranean and north-eastern Atlantic species to be used in predator-prey studies. J. Fish. Biol.89, 2195–2202. doi: 10.1111/jfb.13115
17
Hansen M. J. Nate N. A. Muir A. M. Chavarie L. Howland K. L. Krueger C. C. (2022). Usefulness of otolith weight for estimating age-based life history metrics of lake trout. N. Am. J. Fish. Manage.42, 1359–1371. doi: 10.1002/nafm.10829
18
Hare J. A. Cowen R. K. (1995). Effect of age, growth rate, and ontogeny on the otolith size – fish size relationship in bluefish, Pomatomus saltatrix, and the implications for back-calculation of size in fish early life history stages. Can. J. Fish. Aquat. Sci.52, 1909–1922. doi: 10.1139/f95-783
19
Harvey J. T. Loughlin T. R. Perez M. A. Oxman D. S. (2000). Relationship between fish size and otolith length for 63 species of fishes from the Eastern North Pacific Ocean. NOAA Technical Report NFMS 150 (Seattle, Washington: US Department of Commerce), 38.
20
Hüssy K. (2008a). Otolith shape in juvenile cod (Gadus morhua): Ontogenetic and environmental effects. J. Exp. Mar. Biol. Ecol.364, 35–41. doi: 10.1016/j.jembe.2008.06.026
21
Hüssy K. (2008b). Otolith accretion rates: Does size really matter? J. Exp. Mar. Biol. Ecol.362, 131–136. doi: 10.1016/j.jembe.2008.06.016
22
Jawad L. Al-Mamry J. Al-Busaidi H. (2011). Relationship between fish length and otolith length and width in the lutjanid fish, Lutjanus bengalensis (Lutjanidae) collected from Muscat City coast on the Sea of Oman. J. Black. Sea/Medit. Environ.17, 116–126.
23
Kuhn M. (2008). Building predictive models in R using the caret package. J. Stat. Software28, 1–26. doi: 10.18637/jss.v028.i05
24
Lishchenko F. Jones J. B. (2021). Application of shape analyses to recording structures of marine organisms for stock discrimination and taxonomic purposes. Front. Mar. Sci.8. doi: 10.3389/fmars.2021.667183
25
Lleonart J. Salat J. Torres G. J. (2000). Removing allometric effects of body size in morphological analysis. J. Theor. Biol.205, 85–93. doi: 10.1006/jtbi.2000.2043
26
Lombarte A. Lleonart J. (1993). Otolith size changes related with body growth, habitat depth, and temperature. Environ. Biol. Fishes.37, 297–306. doi: 10.1007/BF00004637
27
Macusi E. D. Katikiro R. E. Babaran R. P. (2017). The influence of economic factors in the change of fishing strategies of tuna FAD fishers in the face of declining catch, the Philippines. Mar. Policy78, 98–106. doi: 10.1016/j.marpol.2017.01.016
28
Mahé K. Clota F. Blanc M. O. Defruit G. B. Chatain B. de Pontunal H. et al . (2024). Otolith morphogenesis during the early life stages of fish is temperature-dependent: Validation by experimental approach applied to European seabass (Dicentrarchus labrax). J. Fish Biol.104, 2032–2043. doi: 10.1111/jfb.15736
29
Margulies D. Scholey V. P. Buchalla Y. Cusatti S. Wexler J. B. (2023). The early life history of yellowfin tuna (Thunnus albacares) in the eastern Pacific Ocean ( Inter-American Tropical Tuna Commission Special Report).
30
Miller J. A. Hurst T. P. (2020). Growth rate, ration, and temperature effects on otolith elemental incorporation. Front. Mar. Sci.7. doi: 10.3389/fmars.2020.00320
31
Morales C. J. C. Barnuevo K. D. E. Delloro E. S. Jr. Cabebe-Barnuevo R. A. Calizo J. K. S. Lumayno S. D. P. et al . (2023). Otolith morphometric and shape distinction of three redfin species under the genus Decapterus (Teleostei: Carangidae) from Sulu Sea, Philippines. Fishes8, 95. doi: 10.3390/fishes8020095
32
Motomura H. Alama U. B. Muto N. Babaran R. P. Ishikawa S. (2017). Commercial and bycatch market fishes of Panay Island, Republic of the Philippines (Kyoto: The Kagoshima University Museum, Kagoshima, University of the Philippines Visayas, Iloilo, and Research Institute for Humanity and Nature), 246.
33
Oksanen J. Simpson G. Blanchet F. Kindt R. Legendre P. Minchin P. et al . (2025). vegan: Community Ecology Package. doi: 10.32614/CRAN.package
34
Osman Y. Mahe K. El-Mahdy S. Mohammad A. Mehanna S. (2021). Relationship between body and otolith morphological characteristics of sabre squirrelfish (Sargocentron spiniferum) from the southern Red Sea: Difference between right and left otoliths. Oceans2, 624–633. doi: 10.3390/oceans2030035
35
Pierce G. J. Boyle P. R. (1991). A review of methods for diet analysis in piscivorous marine mammals. Oceanogr. Mar. Biol. Annu. Rev.29, 409–486.
36
Politikos D. V. Petasis G. Chatzispyrou A. Mytilineou C. Anastasopoulou A. (2021). Automating fish age estimation combining otolith images and deep learning: The role of multitask learning. Fish. Res.242, 106033. doi: 10.1016/j.fishres.2021.106033
37
Politikos D. V. Sykiniotis N. Petasis G. Dedousis P. Ordoñez A. Vabø R. et al . (2022). DeepOtolith v1.0: an open-source AI platform for automating fish age reading from otolith or scale images. Fishes7, 121. doi: 10.3390/fishes7030121
38
Popper A. N. Ramcharitar J. Campana S. E. (2005). Why otoliths? Insights from inner ear physiology and fisheries biology. Mar. Freshw. Res.56, 497–504. doi: 10.1071/mf04267
39
R Core Team (2023). R: A Language and Environment for Statistical Computing. R Foundation for Statistical Computing. Vienna, Austria. Available online at: https://www.R-project.org/
40
Rodgveller C. J. Hutchinson C. E. Harris J. P. Vulstek S. C. Guthrie C. M. III. (2017). Otolith shape variability and associated body growth differences in giant grenadier, Albatrossia pectoralis. PloS One12, e0180020. doi: 10.1371/journal.pone.0180020
41
Russell B. C. (2001). “ Nemipteridae. Threadfin breams (also whiptail breams, monocle breams, dwarf monocle breams and coral breams),” in FAO Identification Guide for Fishery Purposes. The Western Central Pacific, 5, Part 3 (Menidae to Pomacentridae). Rome, FAO: (Menidae to Pomacentridae) Eds. CarpenterK. E.NiemV., 3051–3089.
42
Santana-Hernandez H. Espino-Barr E. Gallardo-Cabello M. Garcia-Boa A. (2008). Morphologic and morphometric analysis of growth rings identification of otoliths: Sagitta, asteriscus, and lapillus of yellowfin tuna Thunnus albacares (Bonnaterre 1788) (Pisces: Scombridae) in the Eastern Pacific. Int. J. Zool. Res.4, 138–151.
43
Schwarzhans W. Carnevale G. Bannikov A. F. Japundžiæ S. Bradiæ K. Bratishko A. (2017). Otoliths in situ from Sarmatian (Middle Miocene) fishes of the Paratethys. Part I: Atherina suchovi Switchensk. Swiss. J. Palaeontol.136, 7–17. doi: 10.1007/s13358-015-0111-0
44
Smith-Vaniz W. F. (1986). “ Carangidae,” in Smiths’ sea fishes. Eds. SmithM. M.HeemstraP. C. ( Springer-Verlag, Berlin), 638–661.
45
Stormer D. G. Juanes F. (2016). Effects of temperature and ration on the otolith-to-somatic size relationship in juvenile Chinook salmon (Oncorhynchus tshawytscha): a test of the direct proportionality assumption. Mar. Freshw. Res.67, 913–924. doi: 10.101/MF15206
46
Tuset V. M. Lombarte A. Assis C. A. (2008). Otolith atlas for the western Mediterranean, north and central eastern Atlantic. Sci. Mar.72, 7–198. doi: 10.3989/scimar.2008.72s17
47
Tuset V. M. Rosin P. L. Lombarte A. (2006). Sagittal otolith shape used in the identification of fishes of the genus Serranus. Fish Res.81, 316–325. doi: 10.1016/j.fishres.2006.06.020
48
Ushadevi M. Jayaraman J. Remadevi R. Ambrose T. A. Vivekanandan E. (2013). Influence of coastal upwelling on the fishery of small pelagics off Kerala, south-west coast of India. Indian J. Fish.60, 37–42.
49
Vu Q. T. Pham T. D. (2025). ). Application of MobileNet and Xception neural networks to identify Sillago sihama populations in Vietnam’s coastal waters based on otolith morphology. J. Fish Biol. doi: 10.1111/jfb.70130. [early-view].
50
Wexler J. B. Chow S. Wakabayashi T. Nohara K. Margulies D. (2007). Temporal variation in growth of yellowfin tuna (Thunnus albacares) larvae in the Panama Bight 1990–97. Fish. Bull.105, 1–8.
51
Wickham H. (2016). ggplot2: Elegant Graphics for Data Analysis (New York: Springer-Verlag).
52
Wickham H. Averick M. Bryan J. Chang W. McGowan L. D. François R. (2019). Welcome to the tidyverse. J. Open Source Softw4, 1686. doi: 10.21105/joss.01686
53
Widodo J. (1997). Review of the small pelagic fisheries of Indonesia. In DevarajM.MartosubrotoP. (eds.). Small Pelagic Resources and their Utilization in the Asia-Pacific Region. Proceedings of the First Session of the PFIC Working Party on Marine Fisheries, Bangkok, Thailand, 13–16 May 1997. Asia-Pacific Fishery Commission.
54
Wood S. N. (2017). Generalized Additive Models: An Introduction with R. 2nd edition ( Chapman and Hall/CRC). doi: 10.1201/9781315370279
55
Yang T. Xiao P. Jiang X. Zhang Q. Zhao Y. (2024). Otolith morphometrics and variations between two populations of sillago sinica (Perciformes, sillaginidae) in the east China sea and the yellow sea. Thalassas40, 1007–1017. doi: 10.1007/s41208-024-00711-4
56
Zabel R. W. Haught K. Chittaro P. M. (2010). Variability in fish size/otolith radius relationships among populations of Chinook salmon. Environ. Biol. Fish.89, 267–278. doi: 10.1007/s10641-010-9678-x
57
Zhu G. P. Chen Y. W. (2023). Using a novel machine learning approach to alleviate the allometric effect in otolith shape-based species discrimination: the role of a triplet loss function. ICES. J. Mar. Sci.80(5), 1277–1290. doi: 10.1093/icesjms/fsado52
Summary
Keywords
data-limited fisheries, demersal and pelagic fish, generalized additive models (GAMs), K-nearest neighbors, otolith morphometry, random forest
Citation
Morales CJC, Lumayno SDP and Babaran RP (2025) Comparative analysis of statistical and machine learning approaches for predicting fish length from otoliths. Front. Mar. Sci. 12:1711110. doi: 10.3389/fmars.2025.1711110
Received
23 September 2025
Revised
26 November 2025
Accepted
28 November 2025
Published
22 December 2025
Volume
12 - 2025
Edited by
Josipa Ferri, University of Split, Croatia
Reviewed by
Salah Eddine Sbiba, Mohammed V University, Morocco
Karankumar Kishorkumar Ramteke, Central Institute of Fisheries Education (ICAR), India
Updates
Copyright
© 2025 Morales, Lumayno and Babaran.
This is an open-access article distributed under the terms of the Creative Commons Attribution License (CC BY). The use, distribution or reproduction in other forums is permitted, provided the original author(s) and the copyright owner(s) are credited and that the original publication in this journal is cited, in accordance with accepted academic practice. No use, distribution or reproduction is permitted which does not comply with these terms.
*Correspondence: Christian James C. Morales, ccmorales2@up.edu.ph
Disclaimer
All claims expressed in this article are solely those of the authors and do not necessarily represent those of their affiliated organizations, or those of the publisher, the editors and the reviewers. Any product that may be evaluated in this article or claim that may be made by its manufacturer is not guaranteed or endorsed by the publisher.