Abstract
Groundwater nutrient pollution is problematic as it bypasses upland and wetland filtering mechanisms, seeping biologically available forms of nitrogen and phosphorus directly into receiving surface waters and fueling primary production. There are few cases where coastal managers are adopting a groundwater adaptive management approach to address this hidden and potentially significant source of nutrient pollution. Water and habitat deterioration in the Indian River Lagoon (IRL) coastal estuary has become a serious concern of scientists, resource managers, and the community. Brevard County, FL implemented an Adaptive Management approach that relied on research to prioritize nutrient sources and evaluate projects for funding through the voter approved Save our Indian River Lagoon project plan. The research found significant differences in groundwater nutrient concentrations between communities with different wastewater treatments: 1) septic systems, 2) municipal sewer, and 3) municipal sewer with reclaimed wastewater for irrigation. Wastewater retrofit projects were implemented to reduce groundwater nutrient loads and pre-post retrofit groundwater nutrient concentrations were compared to evaluate the success of meeting objectives. More post-retrofit monitoring is needed to model the associated pollutant load reductions, which is the next phase of the adaptive management approach. Research results were shared with stakeholders to provide foundational knowledge, inform management strategies and policy changes, and demonstrate progress toward meeting prescribed load reductions. The deliberate and iterative nature of the County’s use of monitoring to establish baselines and guide resource management decisions is an example of a large-scale groundwater adaptive management (AM) approach to estuarine restoration.
1 Introduction
This study measured and compared groundwater nutrient concentrations at natural areas to residential areas served by septic systems, central sewer, or sewer with reclaimed water for irrigation to prioritize actions and inform adaptive management strategies that reduce nutrient loads to coastal waters. It has been well-established that land-based anthropogenic activities are increasing nutrient loads into coastal waters throughout the world, causing water quality degradation, hyper-eutrophication, algal blooms, anoxic conditions, fish kills, and habitat loss (Boyer et al., 2002; Driscoll et al., 2003; Galloway et al., 2008; Howarth et al., 1996; Rabalais et al., 2009; Wang et al., 2021). Global phosphorus (P) inputs have nearly tripled from anthropogenically increased sediment erosion and wastewater discharges and nitrogen (N) inputs have also substantially increased, driven primarily by the reliance on synthetic fertilizers for food production (Howarth et al., 2002; Dubrovsky et al., 2010; Badruzzaman et al., 2012). Because N is typically the limiting factor in estuarine primary production and trophic state, increasing N inputs has the greatest potential to alter ecosystem dynamics and function (D’Elia et al., 1986; Eppley and Peterson, 1979; Nixon, 1995; Ryther and Dunstan, 1971).
A major pathway for N to enter surface waterbodies from urban environments is through stormwater which typically carries organic forms of N that are not biologically available and thus take longer to fuel primary production (Jani et al., 2020). In groundwater, however, a greater portion of N is in the biologically available form of nitrate/nitrite that is easily assimilated and can fuel primary production in estuaries (Bowen et al., 2007; Katz et al., 2009; Shukla and Saxena, 2020). As human populations continue to increase in low-lying coastal areas, substantial inputs of biologically available N are entering estuarine waters through groundwater potentially fueling algal blooms and causing other cascading effects through the system (Bowen et al., 2007; Seaver, 2010). Some studies have estimated that as much as 75% of N inputs to coastal estuaries is from groundwater (Paerl, 1997; Jiang et al., 2015; Wilson et al., 2024).
Along Florida’s 2,170 km coastline, catastrophic harmful algal blooms have raised ecological and economic concerns as health impacts, beach closures, fish kills, and marine mammal mortalities threaten tourism revenues, property values, and residents’ quality of life (Anderson et al., 2021; Backer, 2009; Bechard, 2021; Court et al., 2021). Covering over one-third of Florida’s east coast (250 km), the Indian River Lagoon (IRL) is a long, shallow, bar-built coastal estuary that traverses subtropical and tropical climate zones and has tremendous spatial heterogeneity. Within the estuary’s 750 square kilometers (290 square miles) of surface water; physical characteristics like salinity, water temperature, water depth, water retention times, and freshwater inputs vary tremendously. The IRL is a nursery for many pelagic species and is considered to be one of the most biodiverse estuaries in the country (IRL Species Inventory, 2024). With long water residence times that can exceed 230 days/50% renewal in some areas (Smith, 1993) and excessive internal and external nutrient loads, the IRL is particularly vulnerable to hyper-eutrophication. Since 2011, the IRL has experienced increasing algal bloom severity and intensity, leading researchers to suggest that a regime shift was occurring in the system, as macrophytes in the system disappeared with increasing phytoplankton biomass (Adams et al., 2019; Phlips et al., 2021).
Most of the IRL surface water area (71%) is located within the jurisdictional boundary of Brevard County, FL (County) which includes portions of the Banana River Lagoon, the North IRL, and the Central IRL. After a massive fish kill in 2016, the County successfully passed a local sales tax to provide a ten-year funding mechanism for wastewater and stormwater retrofits and restoration projects aimed at reducing N loads. The County’s Save Our Indian River Lagoon Project Plan (SOIRLPP) prioritizes and recommends projects to reduce nutrient pollution. The SOIRLPP is updated annually with recommendations to the County Commission made by a knowledgeable and diverse community stakeholder Citizen Oversight Committee (COC) to incorporate new information and research results and direct funding toward projects that deliver the best results in the most cost-efficient manner.
The SOIRLPP performance monitoring and annual update process demonstrates a real-world adaptive management (AM) approach to coastal resource management by engaging stakeholders in an iterative process to clarify uncertainty, consider groundwater management alternatives, and adjust strategies as new knowledge is attained (Thomann et al., 2020, 2022; Williams et al., 2009; Williams, 2011). The County and COC assess current information and design performance monitoring studies with controls to understand complex system dynamics, source contributions, and the cost of nitrogen load reductions. The committee considers the cost-effectiveness and practical feasibility of implementing projects to meet pollutant load reductions goals. Proposed and alternative management strategies are updated annually along with the monitoring and modeling needed to evaluate their success. Initial data analyses conducted by the County indicated that groundwater contributed over 40% of external Total Nitrogen (TN) and 50% of external Total Phosphorus (TP) loading to the IRL (SOIRLPP, 2025; Figure 1). Stakeholders realized that the only way to restore healthy conditions to the IRL would be to address both groundwater and stormwater sources of nutrient pollution.
Figure 1
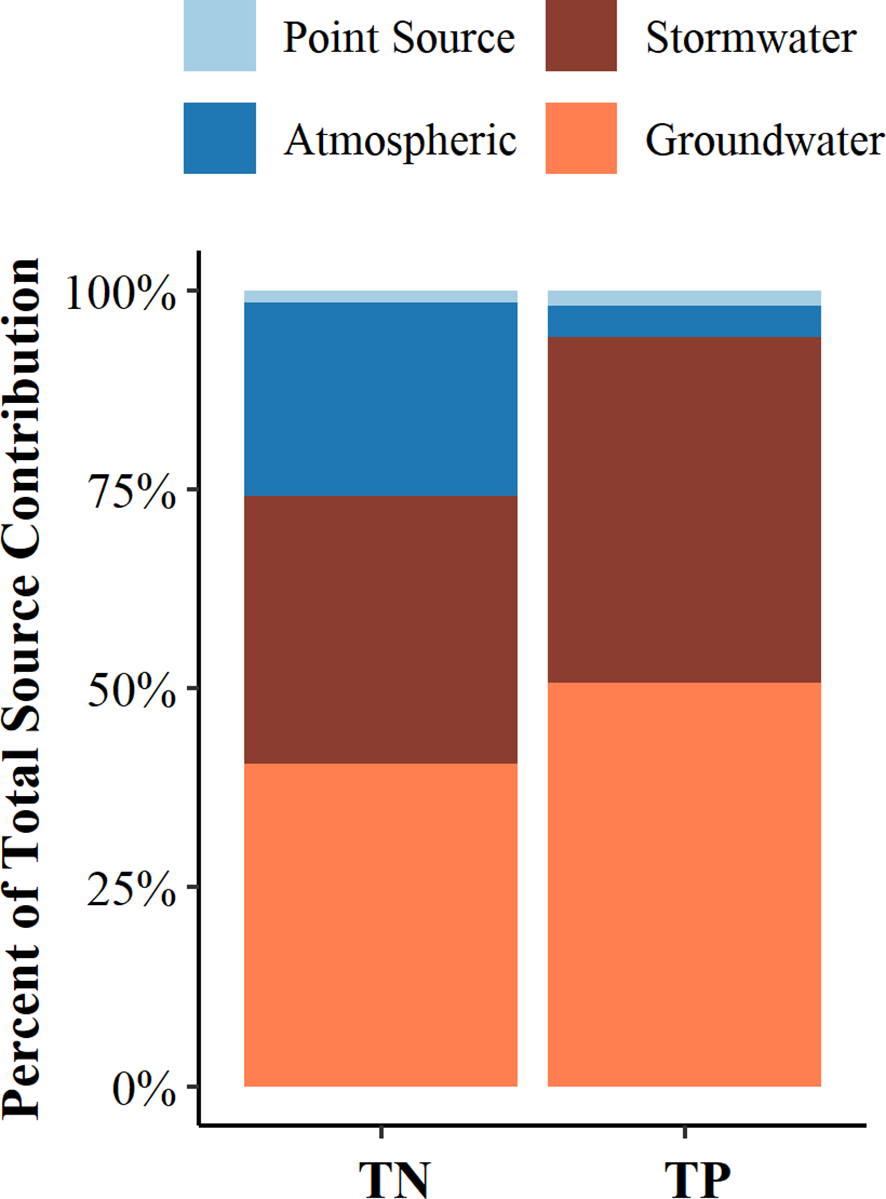
Source contribution of TN and TP loading to the Indian River Lagoon within Brevard County (SOIRLPP, 2025).
To field-verify modeled groundwater fate and transport loading estimates, validate pollution reduction project priorities, and evaluate project impacts, the County initiated a comprehensive study of groundwater nutrient concentrations in residential areas receiving different wastewater treatments: 1) septic systems, 2) central sewer, and 3) central sewer with reclaimed water for irrigation. Groundwater was also evaluated at natural sites representative of background concentrations for comparison. An important goal was to collect baseline data and continuously monitor a network of groundwater wells to evaluate changes in groundwater nutrient concentrations as retrofit projects were completed. This monitoring and modeling approach demonstrated the nutrient impacts to groundwater from various wastewater sources to guide policy and inform groundwater AM projects and program strategies.
There were about 62,226 residential septic systems identified in the County (SOIRLPP, 2025), although the lack of septic permitting prior to the 1980s and incomplete records of sewer connection infrastructure makes the number approximate (Barile, 2018). The extent that septic systems contribute nutrients to groundwater depends on physical and structural characteristics such as the vertical separation between the septic drainfield and the groundwater which has increased with regulatory requirements over time, groundwater flow path and distance to receiving surface water, soil conductance and velocity, soil denitrification potential, and soil organic matter (Cox et al., 2020; Hoghooghi et al., 2021; Lusk et al., 2017; Sayemuzzaman and Ye, 2015; Ye et al., 2017). Modeling these factors or their surrogates, were part of a comprehensive septic system fate and transport model that enabled the County to prioritize 15,737 septic systems in areas where they were most likely to be contributing significantly to nitrogen impairment of the IRL (SOIRLPP, 2025; Applied Ecology, Inc. (AEI), 2018). These priority areas were defined as groundwater vulnerability areas within which septic systems were prioritized for conversion to sanitary sewer where feasible; upgraded to enhanced, nitrogen reducing septic systems where conversion to sewer was not feasible, and where new development was required to connect to sewer or use enhanced, nitrogen reducing septic systems.
In addition to septic tanks, the SOIRLPP assessed wastewater treatment facilities (WWTFs) that provide reclaimed water for irrigation for their potential to pollute ground and surface waters. Treated (reclaimed) wastewater has been widely used for agricultural and urban irrigation to reduce direct discharges of wastewater effluent while preserving potable water supplies. Although the benefits of using reclaimed wastewater for irrigation to alleviate water shortages are evident, reclaimed irrigation water often contains pollutants like nutrients, heavy metals, and emerging contaminants that can impact water quality (Yin et al., 2016). Florida has the largest and most comprehensive inventory of permitted reclaimed systems in the country, and Brevard County is among the top 15 largest reclaimed water users in the state (Florida Department of Environmental Protection (FDEP), 2022; Toor and Rainey, 2009).
Based on flow volumes and average TN concentration in effluent, the SOIRLPP initially identified two WWTFs within the County that were contributing an excess of 20,000 lbs/year TN to the IRL after accounting for load attenuation in the soils (Palm Bay Water Reclamation Facility [WRF, 23,883 lbs TN/yr] and Titusville Osprey WWTF [34,579 lbs TN/yr]). Based on groundwater concentration data and the County’s groundwater AM process, eight more of 16 wastewater treatment plants in the County were subsequently prioritized for retrofits designed to reduce TN concentrations in the reclaimed discharge water.
This study design and long-term groundwater monitoring project were requested by the County with the goal to inform management decision-making through fulfilling three objectives: 1) Determine if there are measurable differences in groundwater concentrations based on wastewater treatment type; 2) Determine if changes in groundwater concentrations can be measured after groundwater remediation strategies are implemented; and 3) Use quantitative data presented in simple graphics to inform stakeholders and improve science-based decision-making.
The results of this long-term study have been used to establish baseline groundwater conditions, quantify major sources of groundwater pollution, calibrate and validate nutrient loading models, estimate current and projected nutrient loads conveyed by groundwater to the IRL, prioritize projects and focus areas for retrofits, inform stakeholders, and guide and evaluate pollution reduction strategies through an iterative, adaptive management approach.
2 Methods
2.1 Community selection
A quasi-experimental research design with three community “treatments” (septic systems, sewer, and sewer with reclaimed irrigation), and a natural area “control” was established in five different areas of Brevard County. Study areas were identified to represent various geographic and geological conditions including elevation, soil characteristics, and climate zone as well as mainland and beachside conditions. In each study area, a representative priority septic community was selected based on its likelihood to pollute the IRL through groundwater seepage or baseflow. The septic system community prioritization matrix considered (10) parameters: subdivision density; year built; distance to a connected open channel; distance to the Indian River/Banana River Lagoon; elevation (above mean sea level); soil organic matter; soil hydrologic group; hydraulic conductance; porosity; and depth to water. The prioritization matrix guided the initial selection of septic to sewer conversion projects for the SOIRLPP funding.
Four of the prioritized septic communities were selected for the study based on their polluting potential and retrofit implementation feasibility. Non-septic communities were identified within a 1-mile radius (1.6 km) of each septic community to represent the other community treatments (sewered & sewered with reclaimed irrigation) and a natural area. The selected study areas included 1) Turkey Creek, 2) Titusville, 3) Suntree, 4) Merritt Island, and 5) Beaches which included both Melbourne and Satellite Beaches (Figure 2). Turkey Creek was the initial pilot project study area, and it and the Beaches study area are the only areas with all 3 treatment types and a natural area control. The Titusville study area included a sewered community, a sewered community with reclaimed irrigation, and a natural area. The Suntree study area included a septic community, a sewered community, and a sewered community with reclaimed irrigation. The Merritt Island study area included a septic community and a sewered community. Merritt Island is a relic barrier island that is now internal within the Indian River Lagoon.
Figure 2
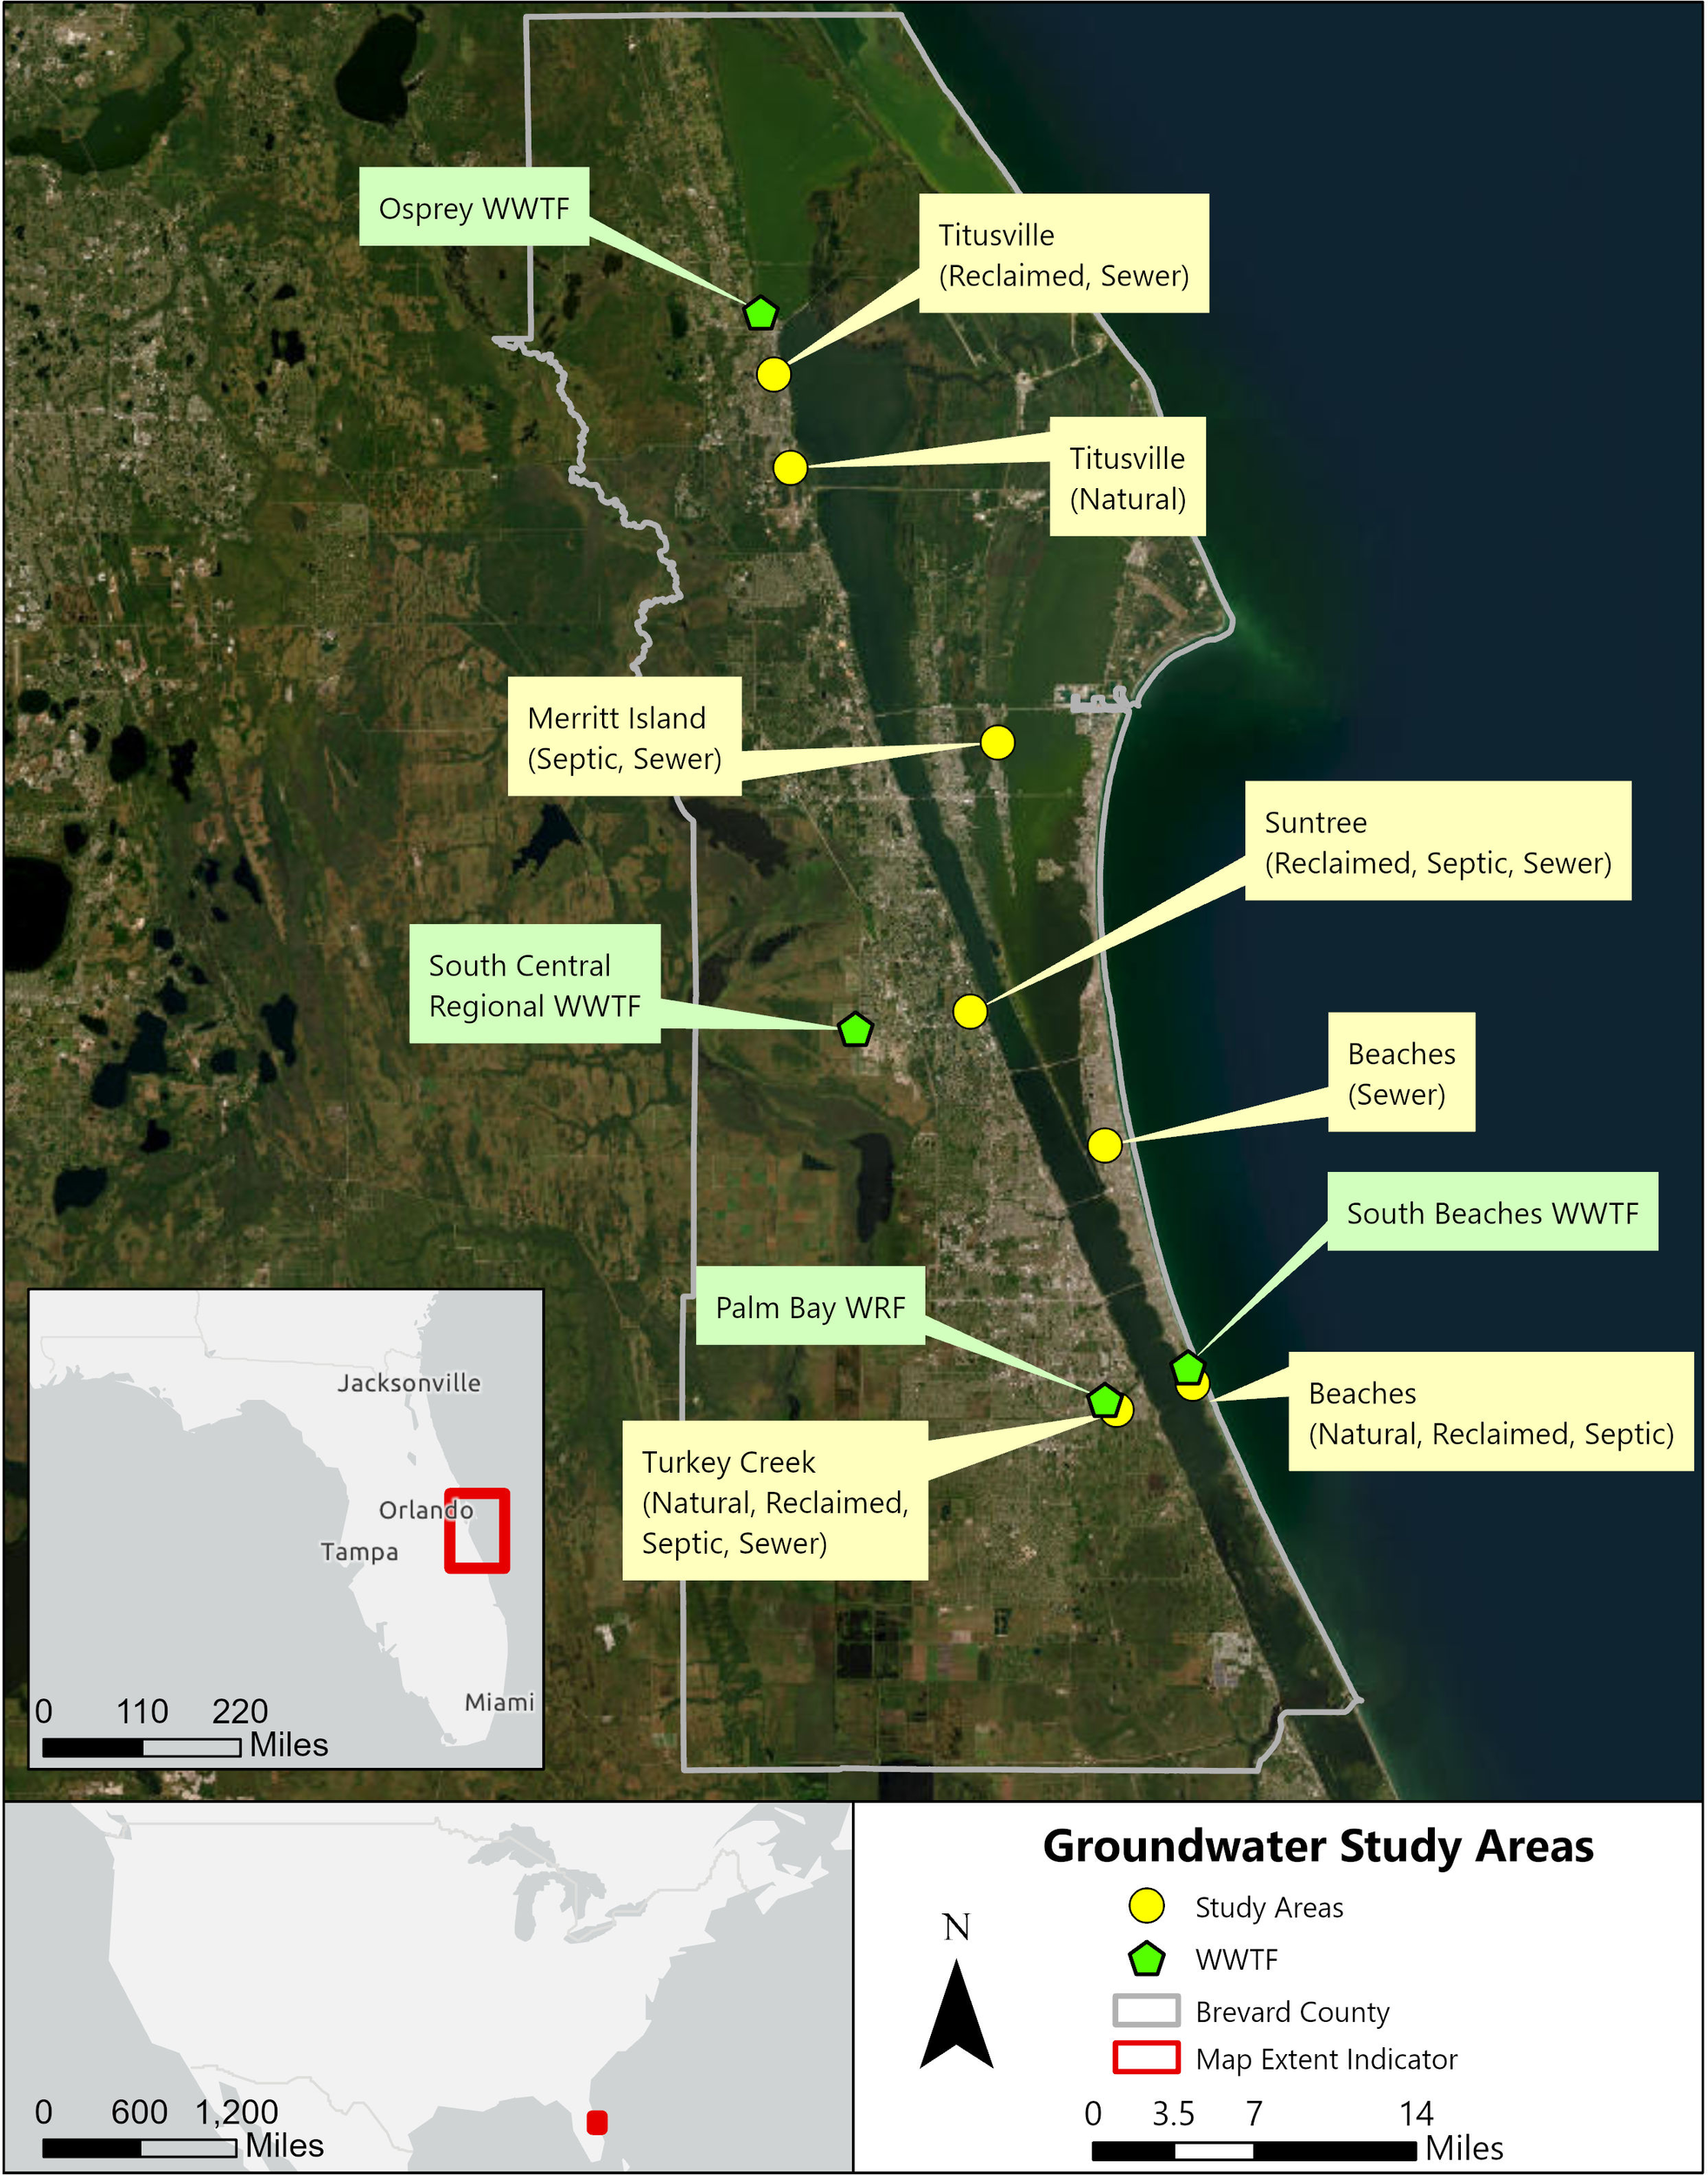
Study areas within the Indian River Lagoon within Brevard County.
One of the prioritized septic communities and two of the reclaimed irrigation communities within the groundwater monitoring study areas have been retrofit to date and monitoring in these communities is evaluating changes in groundwater nutrient concentrations attributed to the septic to sewer conversion and WWTF upgrades conducted to lower N concentrations in the effluent.
2.2 Monitoring well installation
Before monitoring wells were installed, extensive preliminary work was conducted to identify appropriate locations and secure property access. First, the ArcGIS-based Nitrogen Load Estimation Toolkit (ArcNLET) model developed by the Florida Department of Environmental Protection (Florida Department of Environmental Protection (FDEP), 2023) and Florida State University (FSU) was used to model the fate and transport of nitrate and ammonia in groundwater from septic system effluent (Rios et al., 2011, 2013; Sayemuzzaman and Ye, 2015). The septic system contaminant plumes were mapped to understand community groundwater flow direction and velocity. Thereafter, simple hollow steel push points were used to collect groundwater samples where groundwater was less than 2 meters deep. Over 100 push point samples were collected and analyzed to verify modeled concentrations and confirm nitrogen contaminant plumes. Based on these preliminary field observations, specific homes in each community were identified and recruited to allow monitoring well installation within the nutrient flow path. Homeowner access agreements were established to install and sample monitoring wells on private property.
A total of forty-six (46) surficial groundwater monitoring wells were installed to capture representative groundwater in the surficial aquifer. Twelve (12) wells were installed in septic communities, sixteen (16) in sewered communities, and twelve (12) in reclaimed communities. Additionally, six (6) monitoring wells were installed in natural areas to capture background conditions. All monitoring wells were constructed of 1.5- or 2-inch diameter PVC with 10 feet of pre-packed well screen (0.010-inch slot size and 20/30 sand filter packs), grouted to surface, and completed with a concrete pad and locking manhole. Most monitoring wells were constructed to a total depth of twelve (12) feet, with higher elevation communities like Titusville and the Palm Bay reclaimed community requiring wells installed to a total depth of twenty feet.
2.3 Groundwater sampling
After state approval of a formal Quality Assurance Project Plan (QAPP), the monitoring wells were sampled monthly for laboratory analyses and physical parameters were measured on site including temperature, pH, conductivity, turbidity, depth to groundwater, and dissolved oxygen (DO). As part of the approved QAPP, one equipment blank sample was collected for every 20 analyzed samples (5%) and additional trip blanks and duplicate samples were collected at a 5% rate. Properly preserved groundwater samples were placed on ice and transported to a NELAC (National Environmental Laboratories Accreditation Conference) certified laboratory for analysis of ammonia (NH3), Total Kjeldahl Nitrogen (TKN), nitrate+nitrite (NOx), TP, and orthophosphate (PO43-) and the calculation of TN as TKN + NOx.
2.4 Reclaimed wastewater nutrient inputs
Nutrient concentrations associated with wastewater reclamation effluent distributed for irrigation were measured at the irrigation system and in the groundwater receiving such irrigation. Effluent samples were collected directly from the irrigation systems in the Beaches, Titusville, and Suntree reclaimed communities. Monthly Wastewater Treatment Facility Discharge Monitoring Reports were obtained from FDEP’s OCULUS Electronic Document Management System to compare to nutrient concentrations measured in the irrigation water. TN concentrations from irrigation samples (n=64) and monthly WWTF effluent reports had a strong, significant correlation (R2 = 0.819, p<0.0001) and therefore, effluent concentrations from each plant’s monthly discharge monitoring reports were used as a proxy for irrigation water inputs to compare to reclaimed community groundwater nutrient concentrations.
2.5 Data analysis and statistics
Groundwater nutrient concentrations were evaluated for the 86-month study period (June 2018 to July 2025) in most study areas and the 98-month study period in the Turkey Creek communities where the pilot study initiated. All 98 months of Turkey Creek data were used in data analysis, summary statistics, and box plots, however, only 86 months of Turkey Creek data were used for the time series analyses to be consistent with other areas. Prior to December 2019, TP was not sampled on a monthly basis at all locations leading to increased variability in monthly geomean calculations. A vertical line denotes the beginning of consistent monthly TP sampling in the TP time series.
Shapiro-Wilk test and Levene’s test confirmed that the groundwater data did not follow a normal distribution and that the variances among treatment types were heterogenous. As a result, median values were used to measure central tendency and non-parametric Kruskal-Wallis comparison of independent samples, and Dwass-Steel-Critchlow-Fligner (DSCF) multiple pairwise comparison tests were used to compare differences in treatment types, wells, and regions. In cases where only two groups were being compared, a Mann-Whitney two-tailed test was used. Geometric mean concentrations (geomeans) were used in time-series figures. The percent composition of TN and TP constituents was calculated for each sample. All significant statistical findings are indicated and noted with a p-value<0.05. Analysis was completed using R statistical software (v4.5.0; R Core Team, 2025).
2.6 Modeling septic system nitrogen loading into the Indian River Lagoon
Nitrogen loading to the IRL from septic systems within the watershed basin were estimated using a customized ArcNLET model, which was calibrated with the groundwater monitoring data to provide an accurate estimate of site-specific loading potential (Sayemuzzaman and Ye, 2015; Applied Ecology, Inc. (AEI), 2018). As ArcNLET only provides results for NOx and NH3, the collected groundwater concentrations for the missing organic sources of nitrogen (i.e., TKN) were estimated - based on the average sample nitrogen composition - and added to the model to calculate the TN loading. Additionally, the model operates under the assumption of one septic tank per parcel, and thus, it was customized to account for more than one septic tank per parcel (for multi-family homes). For non-residential or commercial parcels, a regression between building size and water use consumption was performed to estimate nutrient effluent for TN loading calculations. Lastly, reduction factors were applied if parcels utilized enhanced nutrient-reducing (ENR) septic systems or were located within watershed basins partially diverted away from the IRL through pumped rediversion projects. These factors augmented the ArcNLET base model, allowing a more accurate depiction of current TN loading into the IRL from septic systems.
3 Results
Results first demonstrate differences in groundwater nutrient concentrations between each treatment type and the natural areas, as well as nutrient concentration reductions post-retrofit. Median concentrations for each community treatment type for the Period of Record are included in Table 1; the percent of each biologically available and organic portion of TN and TP are presented in Table 2; and monthly geomean TN and TP concentrations are presented over time in Figures 3 and 4. A discussion of each nutrient follows and thereafter, pre- and post-retrofit results are provided.
Table 1
| Analyte (mg/L) | Natural | Reclaimed | Septic | Sewer |
|---|---|---|---|---|
| TN | 0.29d | 4.11a | 2.71b | 1.17c |
| TKN | 0.26d | 0.65c | 1.10a | 0.72b |
| NH3 | 0.07c | 0.04c | 0.80a | 0.20b |
| NOx | 0.03d | 2.80a | 0.13b | 0.03c |
| TP | 0.10d | 0.12c | 0.65a | 0.14b |
| PO43- | 0.03c | 0.08b | 0.48a | 0.10b |
Median nutrient concentrations (mg/L) of community treatment types and natural control sites.
Different superscripts indicate row significant differences at p<0.05. Highest value is in bold.
Table 2
| Treatment | Median TN (mg/L) | Organic N TKN / NH3 (%) | Inorganic N NOx (%) | Median TP (mg/L) | Inorganic P PO43- (%) |
|---|---|---|---|---|---|
| Natural | 0.29 | 88 / 23 | 12 | 0.10 | 47 |
| Reclaimed | 4.11 | 42 / 17 | 58 | 0.12 | 78 |
| Septic | 2.71 | 65 / 48 | 35 | 0.65 | 84 |
| Sewer | 1.17 | 77 / 37 | 23 | 0.14 | 80 |
Average percentage of organic and inorganic components of groundwater TN and TP concentrations.
Highest column value is in bold.
Figure 3
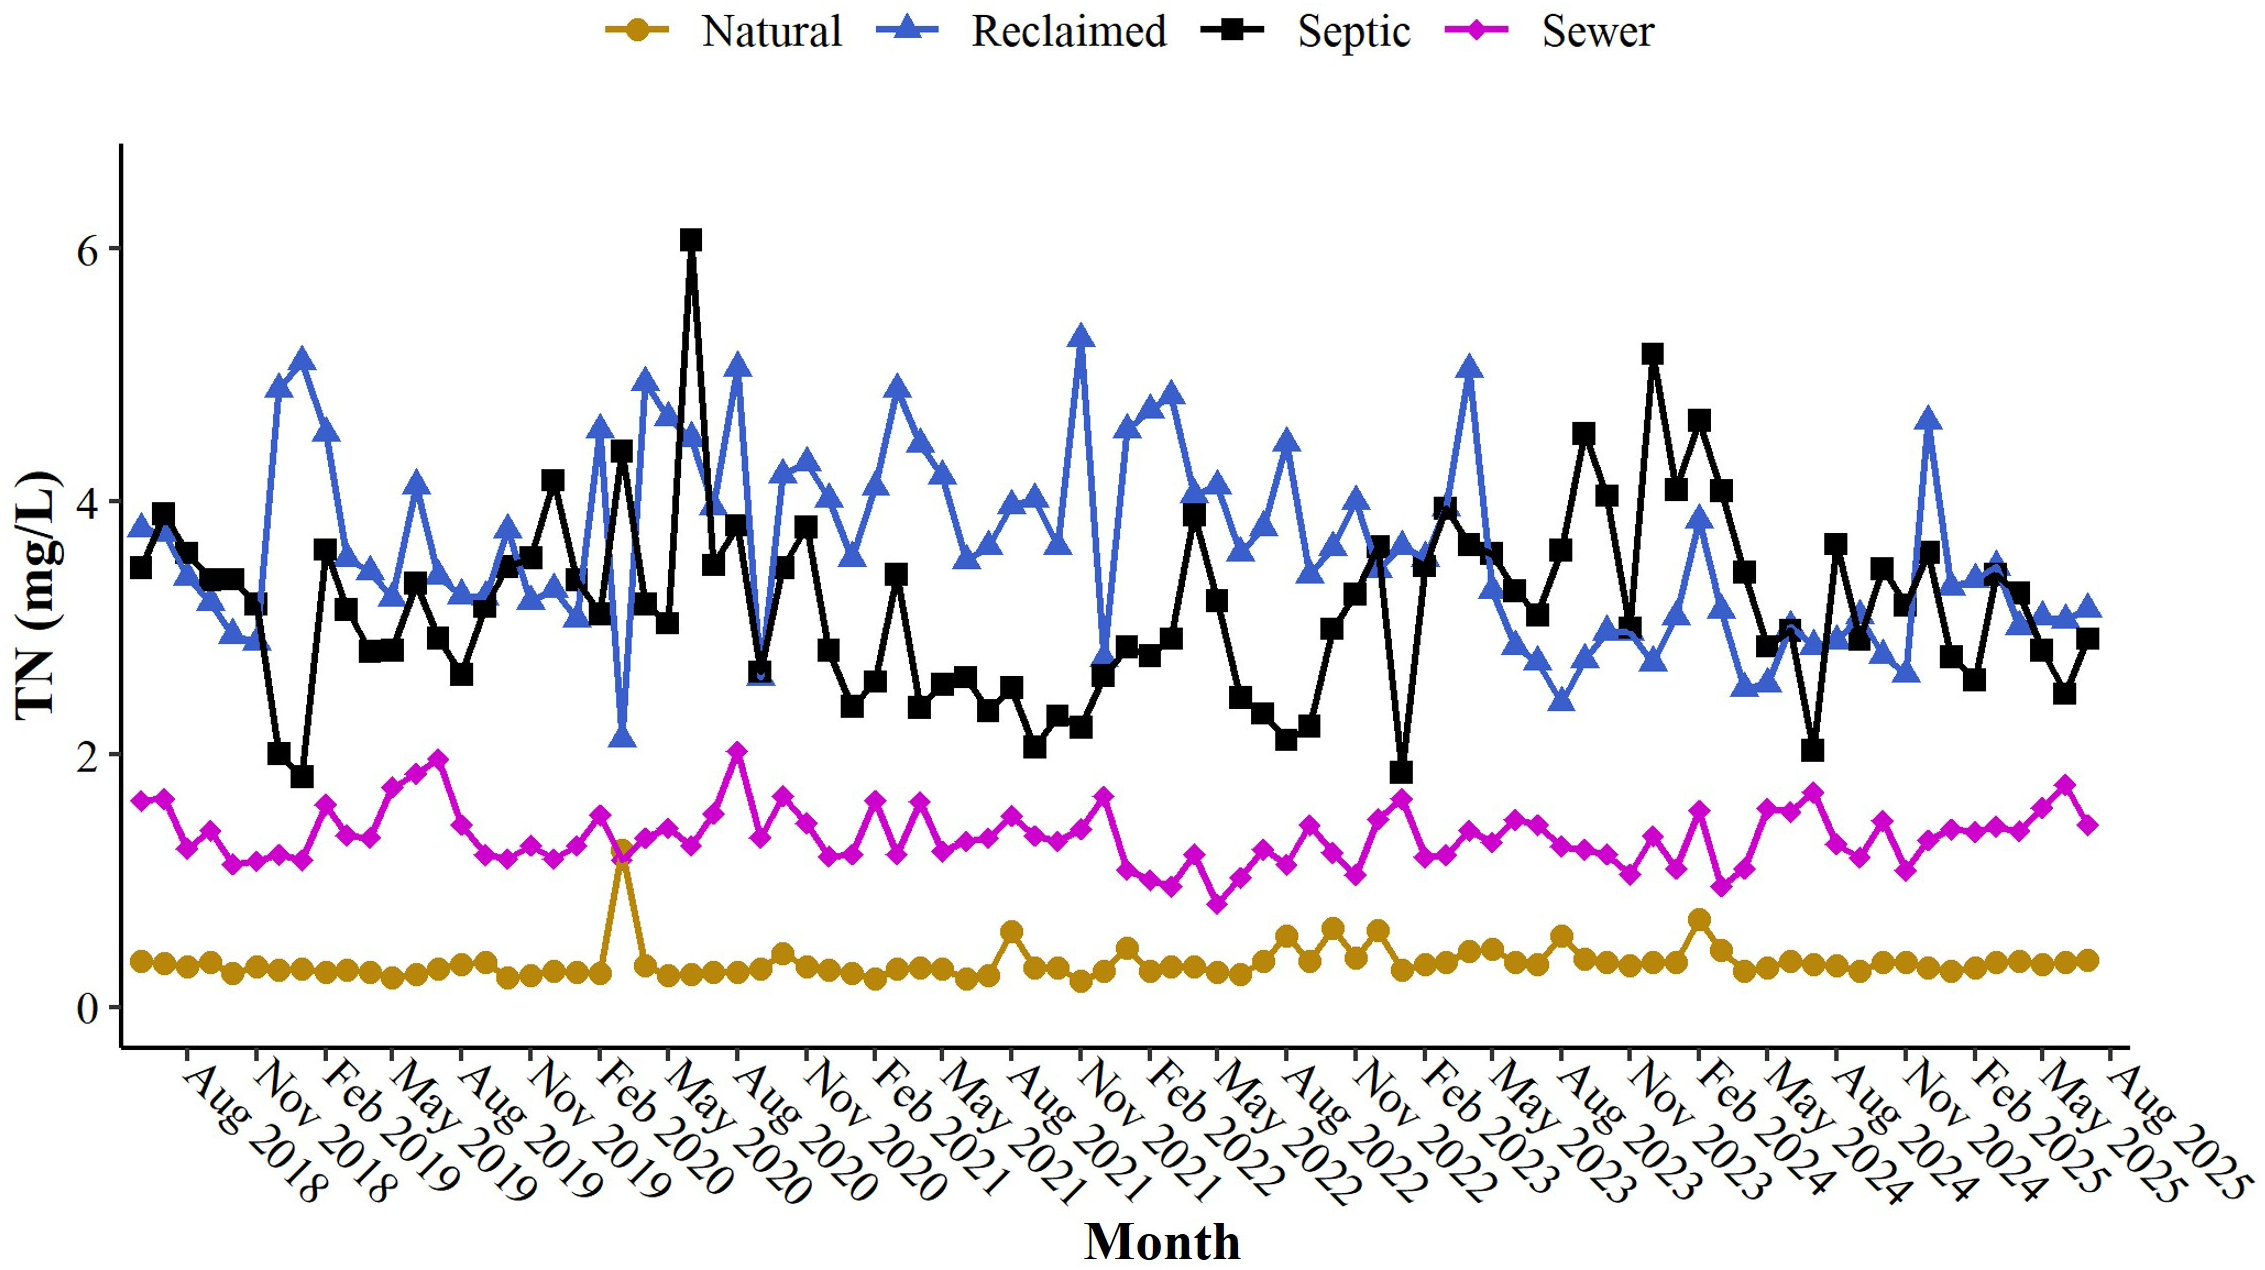
Total Nitrogen monthly geomean concentrations in groundwater among treatment types.
Figure 4
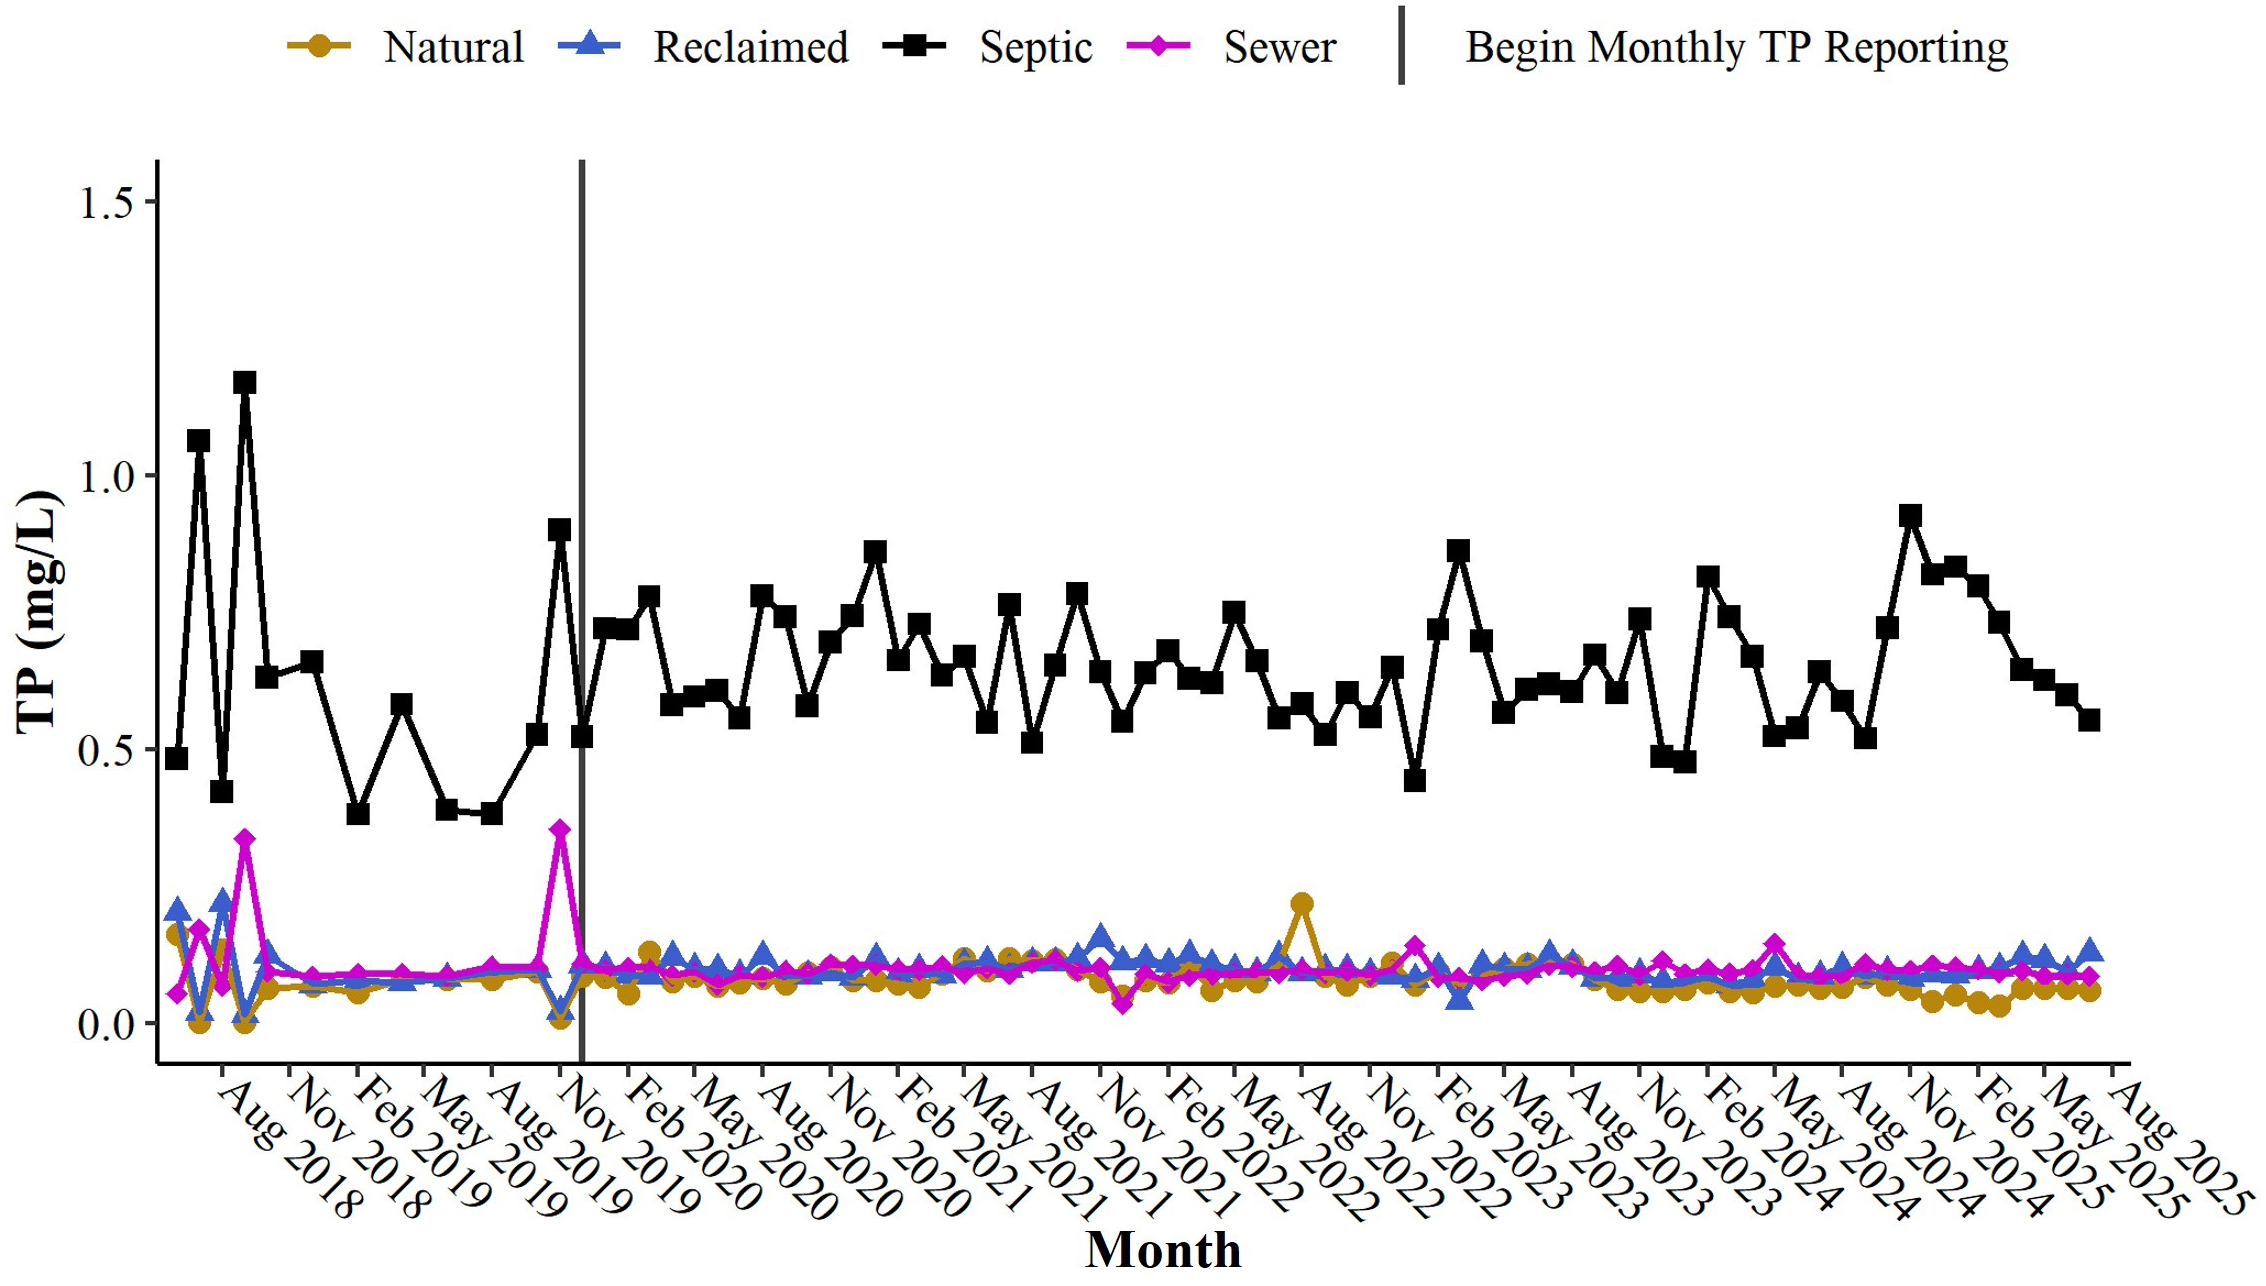
Total phosphorus monthly geomean concentrations in groundwater among treatment types.
3.1 Groundwater nitrogen
The reclaimed communities had significantly higher (p<0.0001) median TN concentrations (4.12 mg/L, n = 1,100) than the septic (2.71 mg/L, n = 1,004), sewer (1.17 mg/L, n = 1,196), or the natural areas (0.29 mg/L, n = 526, Table 1). The reclaimed communities also had the highest portion of TN made up of the biologically available inorganic NOx (58%, Table 2). In septic, sewer, and natural areas, organic TKN was the highest constituent of TN, making up 65%, 77%, and 88% of TN, respectively.
Monthly groundwater TN geomean concentrations varied over time and differed significantly among treatment types and the control (Figure 3). Reclaimed community sites generally had the highest month-to-month TN geomean concentrations (2.12 - 5.29 mg TN/L) followed closely by septic communities (1.82 – 6.06 mg TN/L). TN concentrations in the sewer communities (0.82 – 2.03 mg/L) and natural areas (0.21 – 1.24 mg/L) were consistently lower.
3.2 Groundwater phosphorus
The septic communities had the significantly highest (p<0.0001) median TP concentration (0.65 mg/L), roughly five to seven times higher than any other treatment type and was primarily bio-available orthophosphate (PO43-), which was consistent with the TP concentration differences (Table 1). Within all community treatments (septic, sewer, reclaimed), the percentage of TP that was comprised of PO43- (84%, 80%, and 78%, respectively) was higher than the natural areas (47%, Table 2).
Unlike TN concentrations which varied over time by treatment type, the monthly TP concentrations were consistently higher in the septic communities and ranged from 0.38 - 1.17 mg/L over the study (Figure 4). In the other three treatments, TP geomeans remained below 0.4 mg/L except for an occasional increase in sewer communities.
3.3 Septic community groundwater nutrients
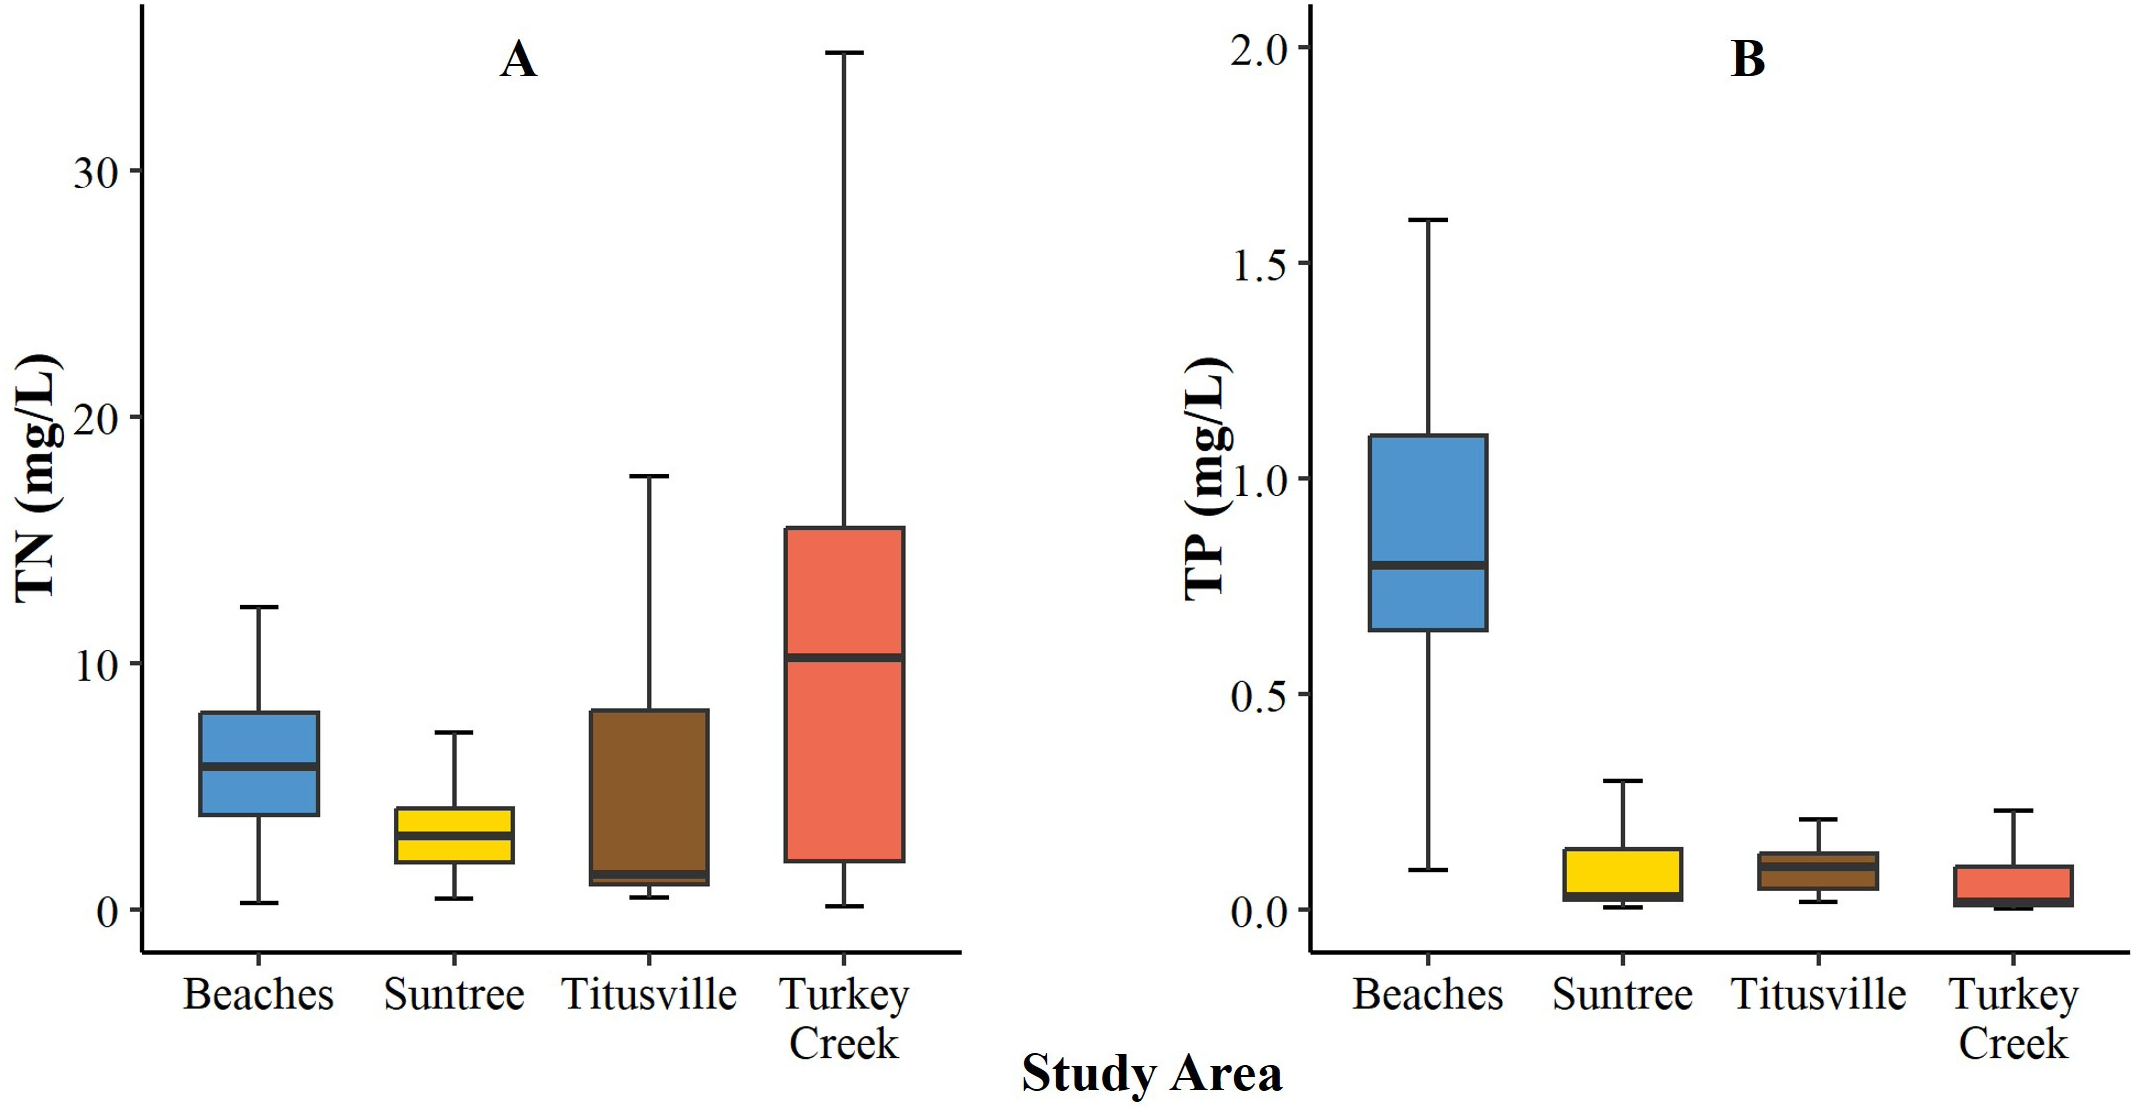
Although the septic communities had higher TP and PO43- concentrations than other treatments, interesting differences in nutrient concentrations were observed between septic communities that helped illuminate problem areas and prioritize septic communities based on their loading potential (Table 3; Figures 5A, B).
Table 3
| Analyte (mg/L) | Beaches | Merritt Island | Suntree | Turkey Creek |
|---|---|---|---|---|
| TN | 2.34b,c | 1.72c | 6.45a | 3.52b |
| TKN | 0.59b | 1.50a | 0.99a | 1.50a |
| NH3 | 0.08c | 1.20a | 0.34b | 1.30a,b |
| NOx | 1.70a | 0.03c | 0.67b | 0.03c |
| TP | 0.51a | 0.25b | 0.90a,b | 0.84a |
| PO43- | 0.50a | 0.22b | 0.16c | 0.80a |
Septic community median nutrient concentrations (mg/L).
Different superscripts indicate row significant differences at p<0.05. Highest value is in bold.
Figure 5
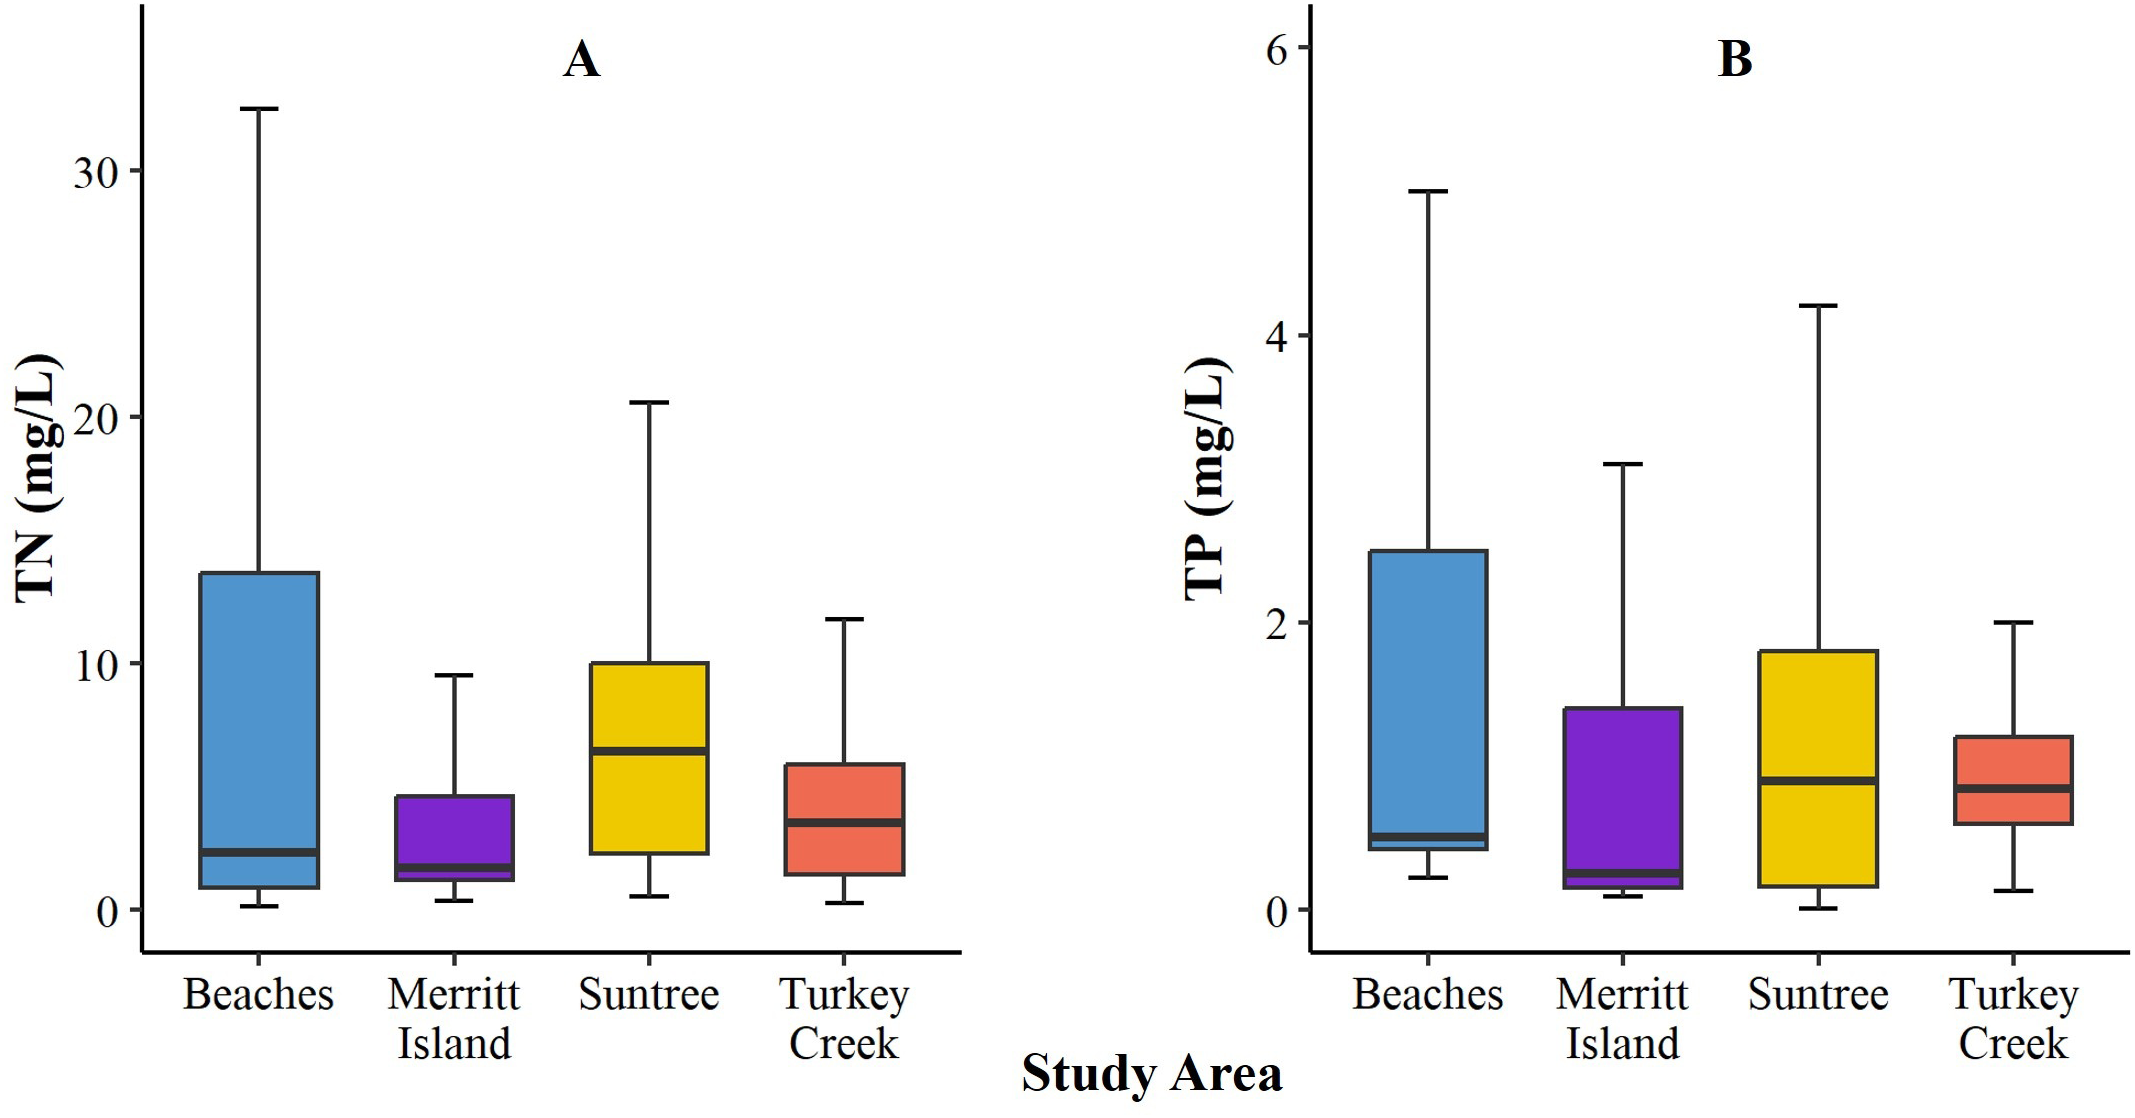
(A, B) Septic community median and data distribution for (A) TN concentrations and (B) TP concentrations with 1st to 3rd quartiles and whiskers.
3.3.1 Septic groundwater nitrogen
The Suntree septic community had a significantly higher median TN concentration (6.45 mg/L, p<0.0001) than the Turkey Creek (3.52 mg/L), Beaches (2.34 mg/L), and Merritt Island (1.72 mg/L) septic communities. The range of concentrations varied between septic communities, with the largest range of TN concentrations in the Beaches septic communities (Figure 5A). There were also significant differences in the amount of biologically available nitrogen that made up the TN. In the three mainland communities of Suntree, Turkey Creek, and Merritt Island, the TN was mostly organic TKN (56%, 79%, and 80%, respectively). In the Beaches septic communities, the groundwater TN was primarily inorganic nitrogen (60%, NOX).
3.3.2 Septic groundwater phosphorus
The Suntree septic communities also had the highest median TP concentration, although the difference between it and the other regions was not statistically significant (Table 3; Figure 5B). The Merritt Island septic communities had the lowest TP median concentration of all regions (0.25 mg/L), significantly lower than the Turkey Creek and the Beaches.
The majority of the TP concentrations within all septic communities was the biologically available form of PO43-, which made up 89% of the TP in the Merritt Island septic communities, 67% of the TP in the Suntree communities, 85% of the TP in Turkey Creek, and 95% of the TP in the Beaches septic communities. Similar to TN, the Beaches septic communities had the greatest range of groundwater TP concentrations (0.22 to 6.0 mg/L) with a median concentration of 0.51 mg/L.
3.3.3 Septic tank groundwater nutrient loading
To inform septic to sewer community prioritization based on polluting potential, TN loads were quantified for all septic tank parcels within the IRL watershed in Brevard County (Figures 6, 7). The estimated total of 396,857 lbs/TN/year entering the IRL from septic tanks was calibrated using groundwater monitoring data that elucidated loading hot spots. Residential septic parcels contributed the highest annual TN loads (312,941 lbs/TN/yr) followed by commercial septic parcels (62,045 lbs/TN/yr), and institutional septic parcels like churches and schools (15,006 lbs/TN/yr). The septic tank parcels within the unincorporated area of Brevard County contributed nearly half of the total TN loading (180,825 lbs/TN/yr) and nearly half of that was from septic systems on Merritt Island (68,958 lbs/TN/year).
Figure 6
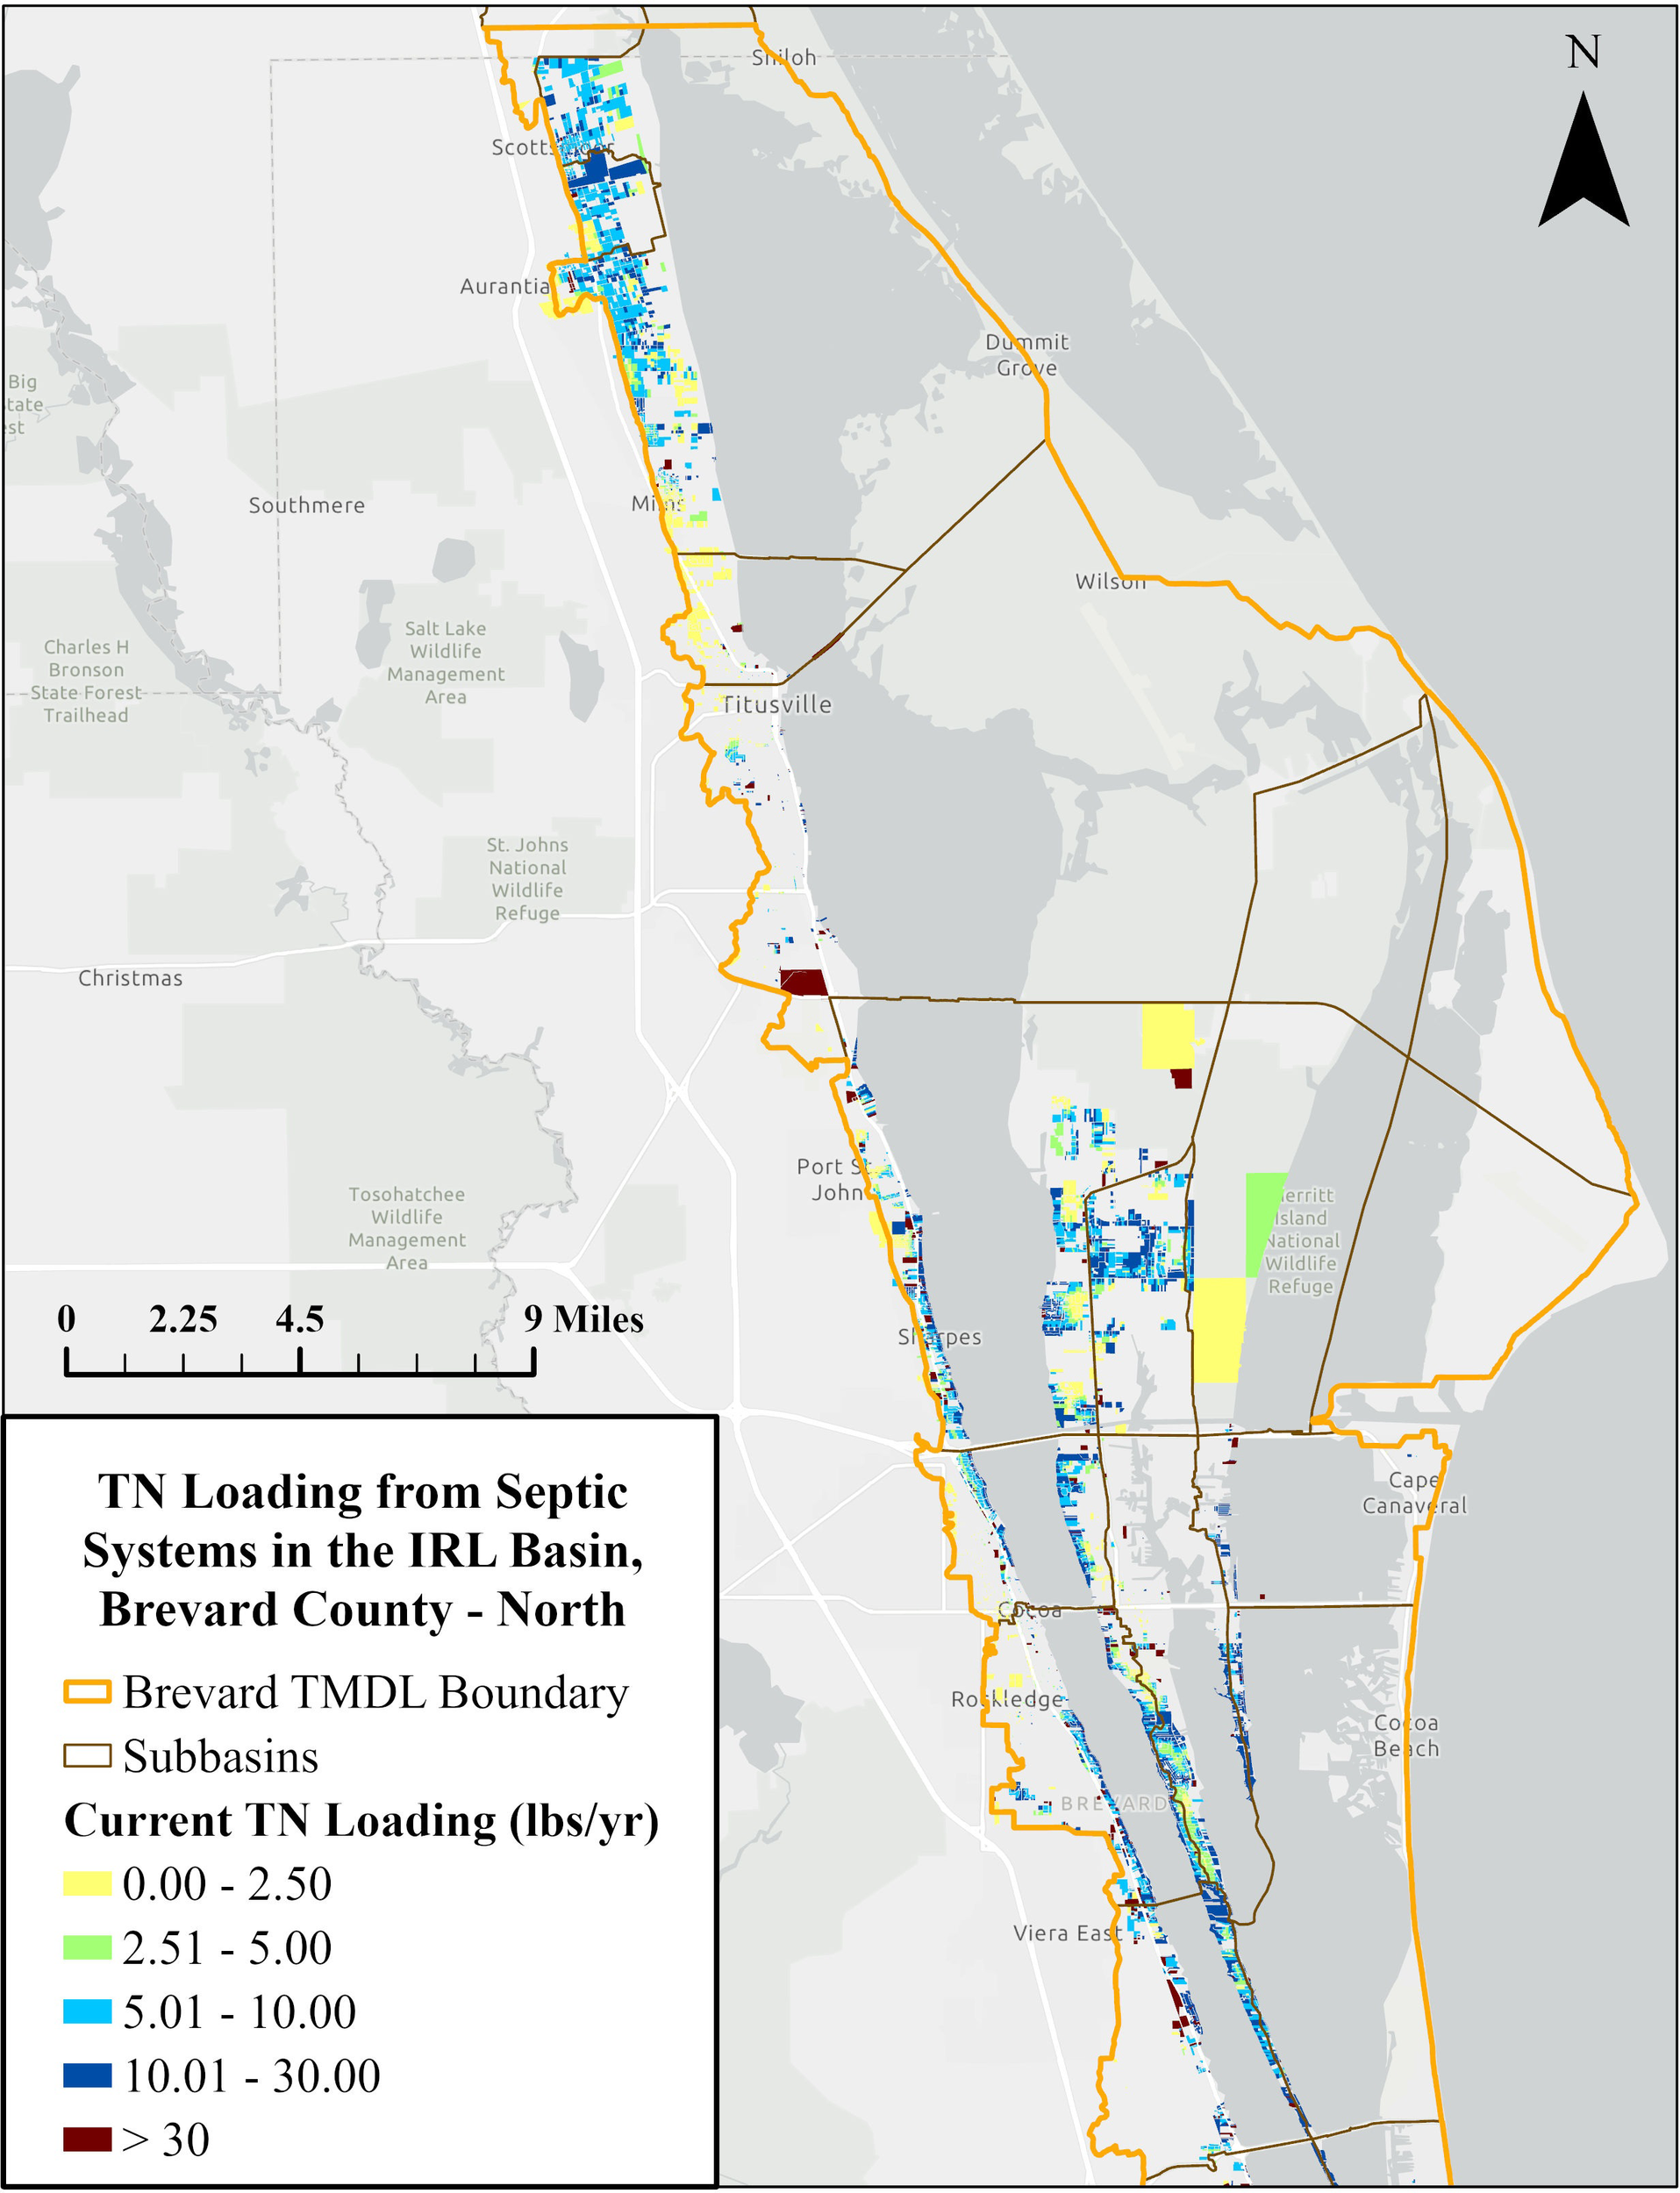
TN loading (lbs/year) to the IRL from septic parcels in Northern Brevard County.
Figure 7
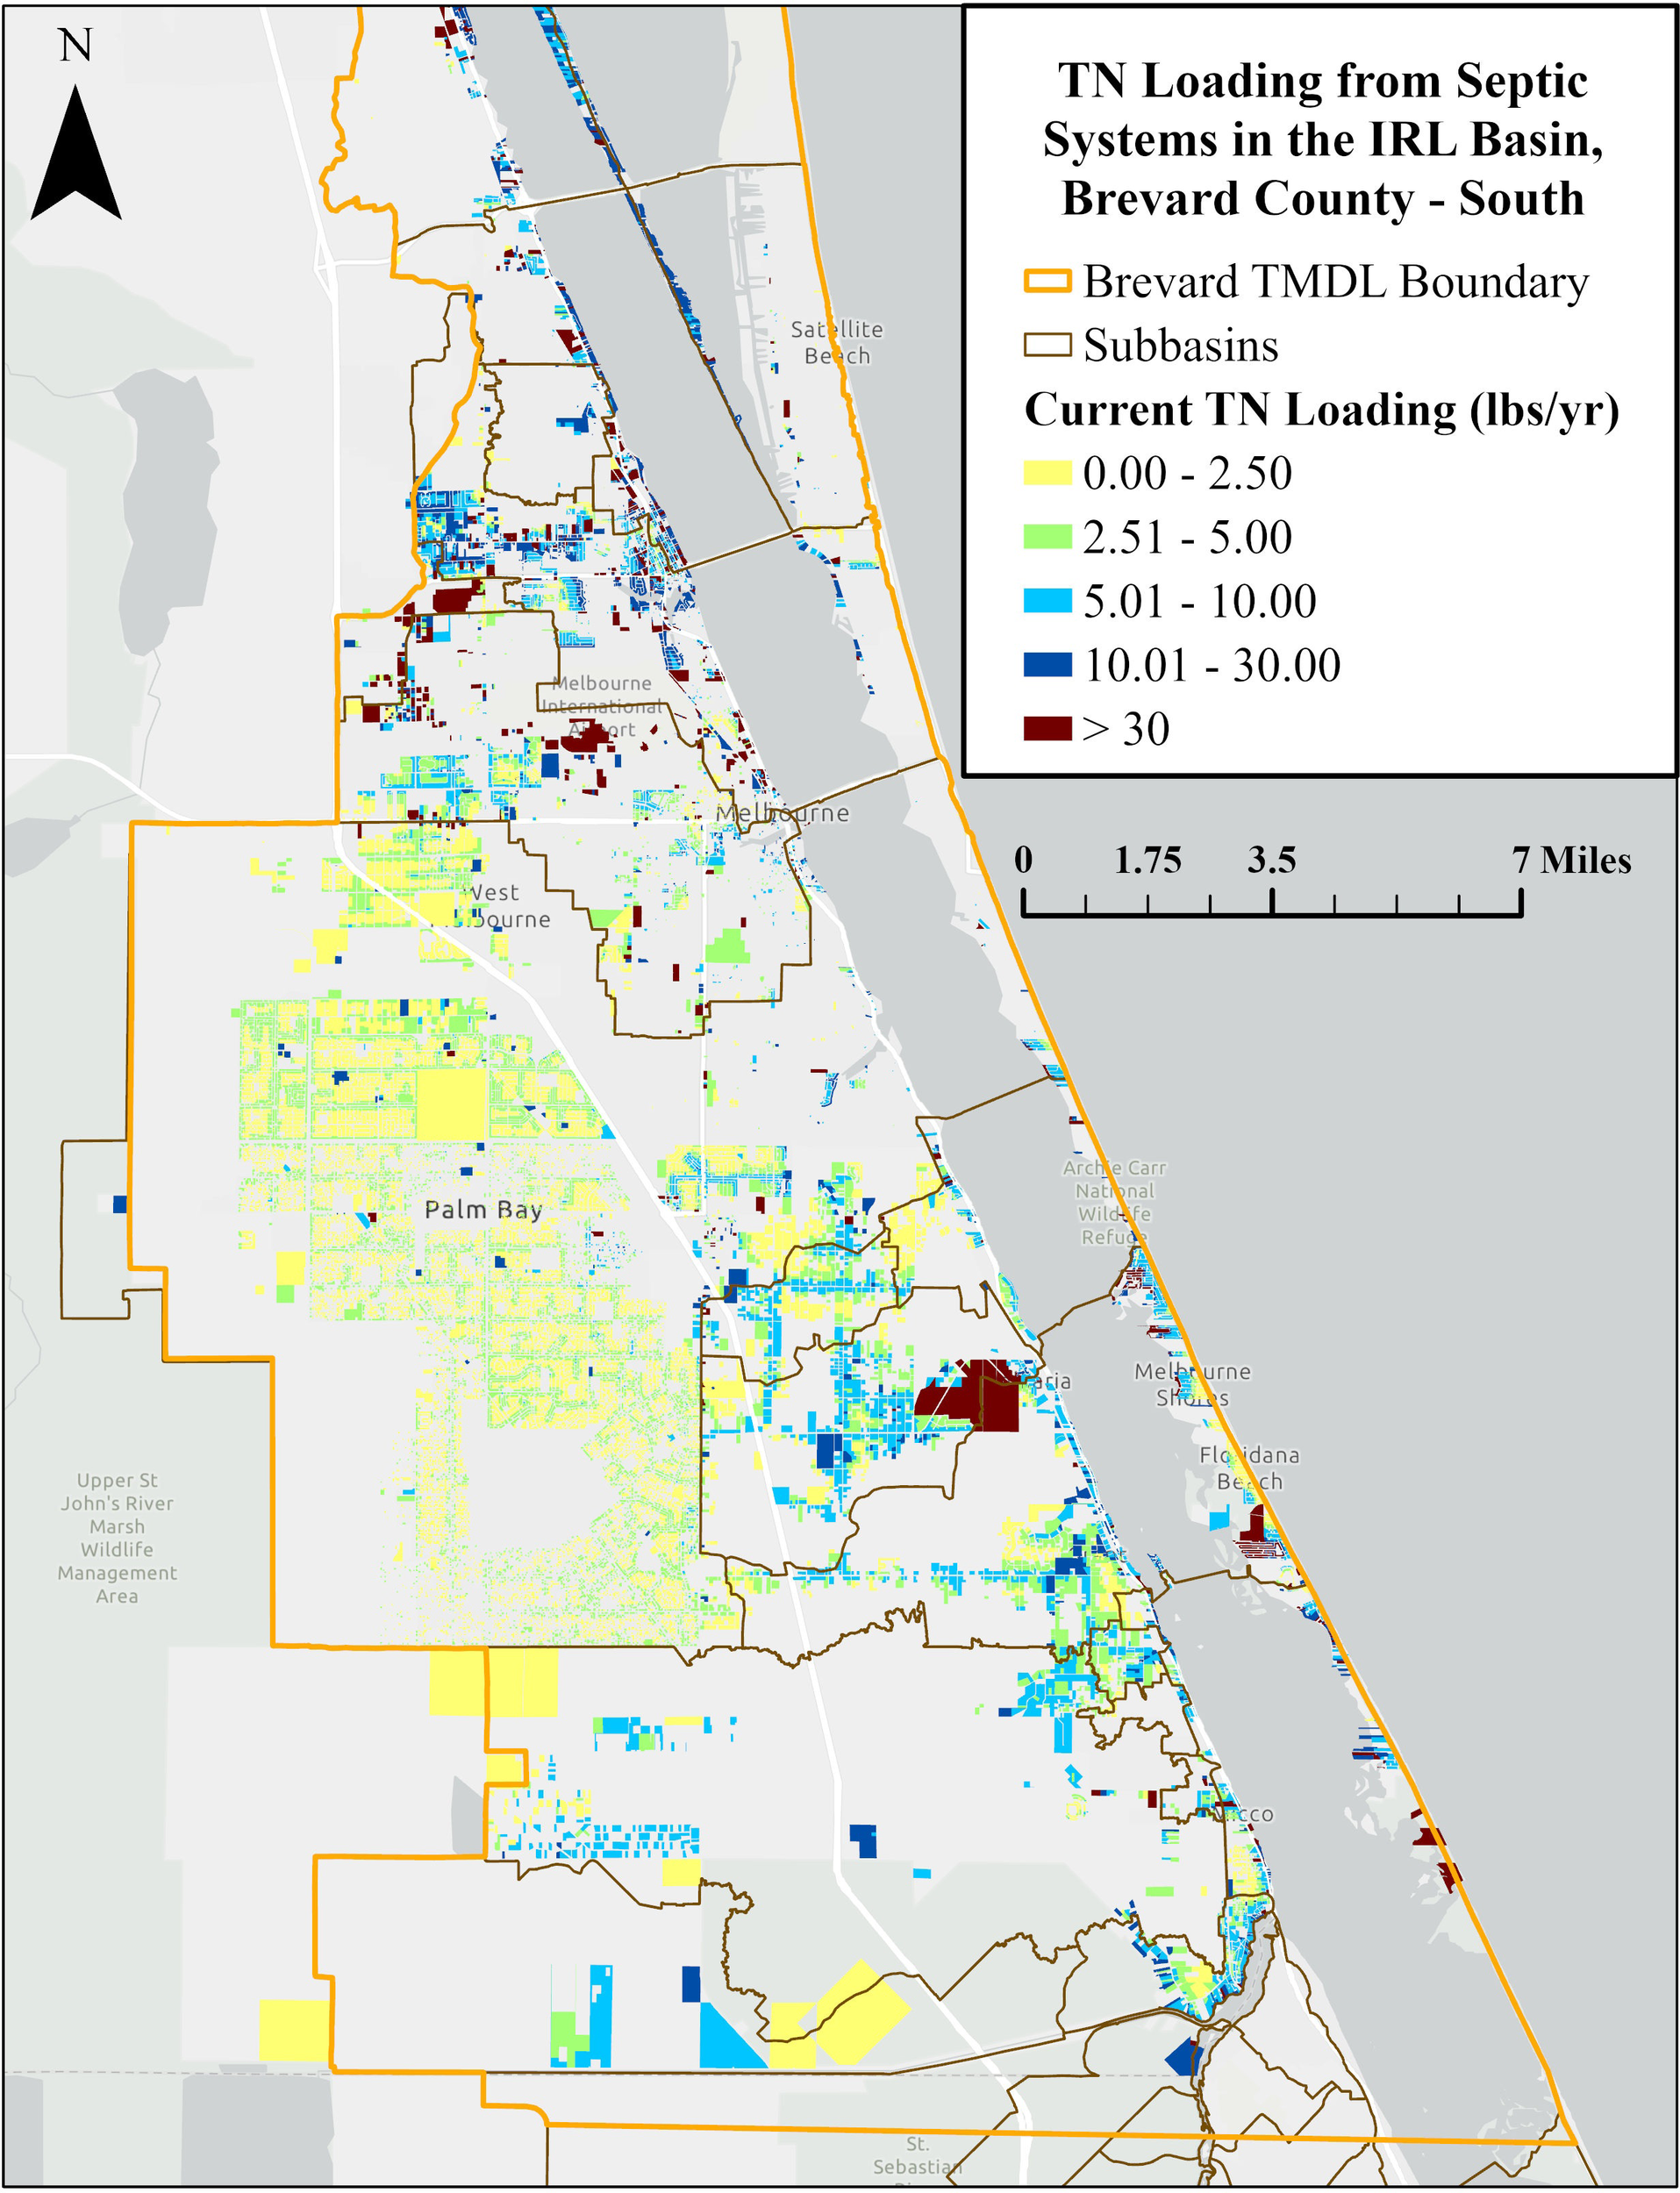
TN loading (lbs/year) to the IRL from septic parcels in Southern Brevard County.
3.3.4 Septic to sewer conversion upgrades
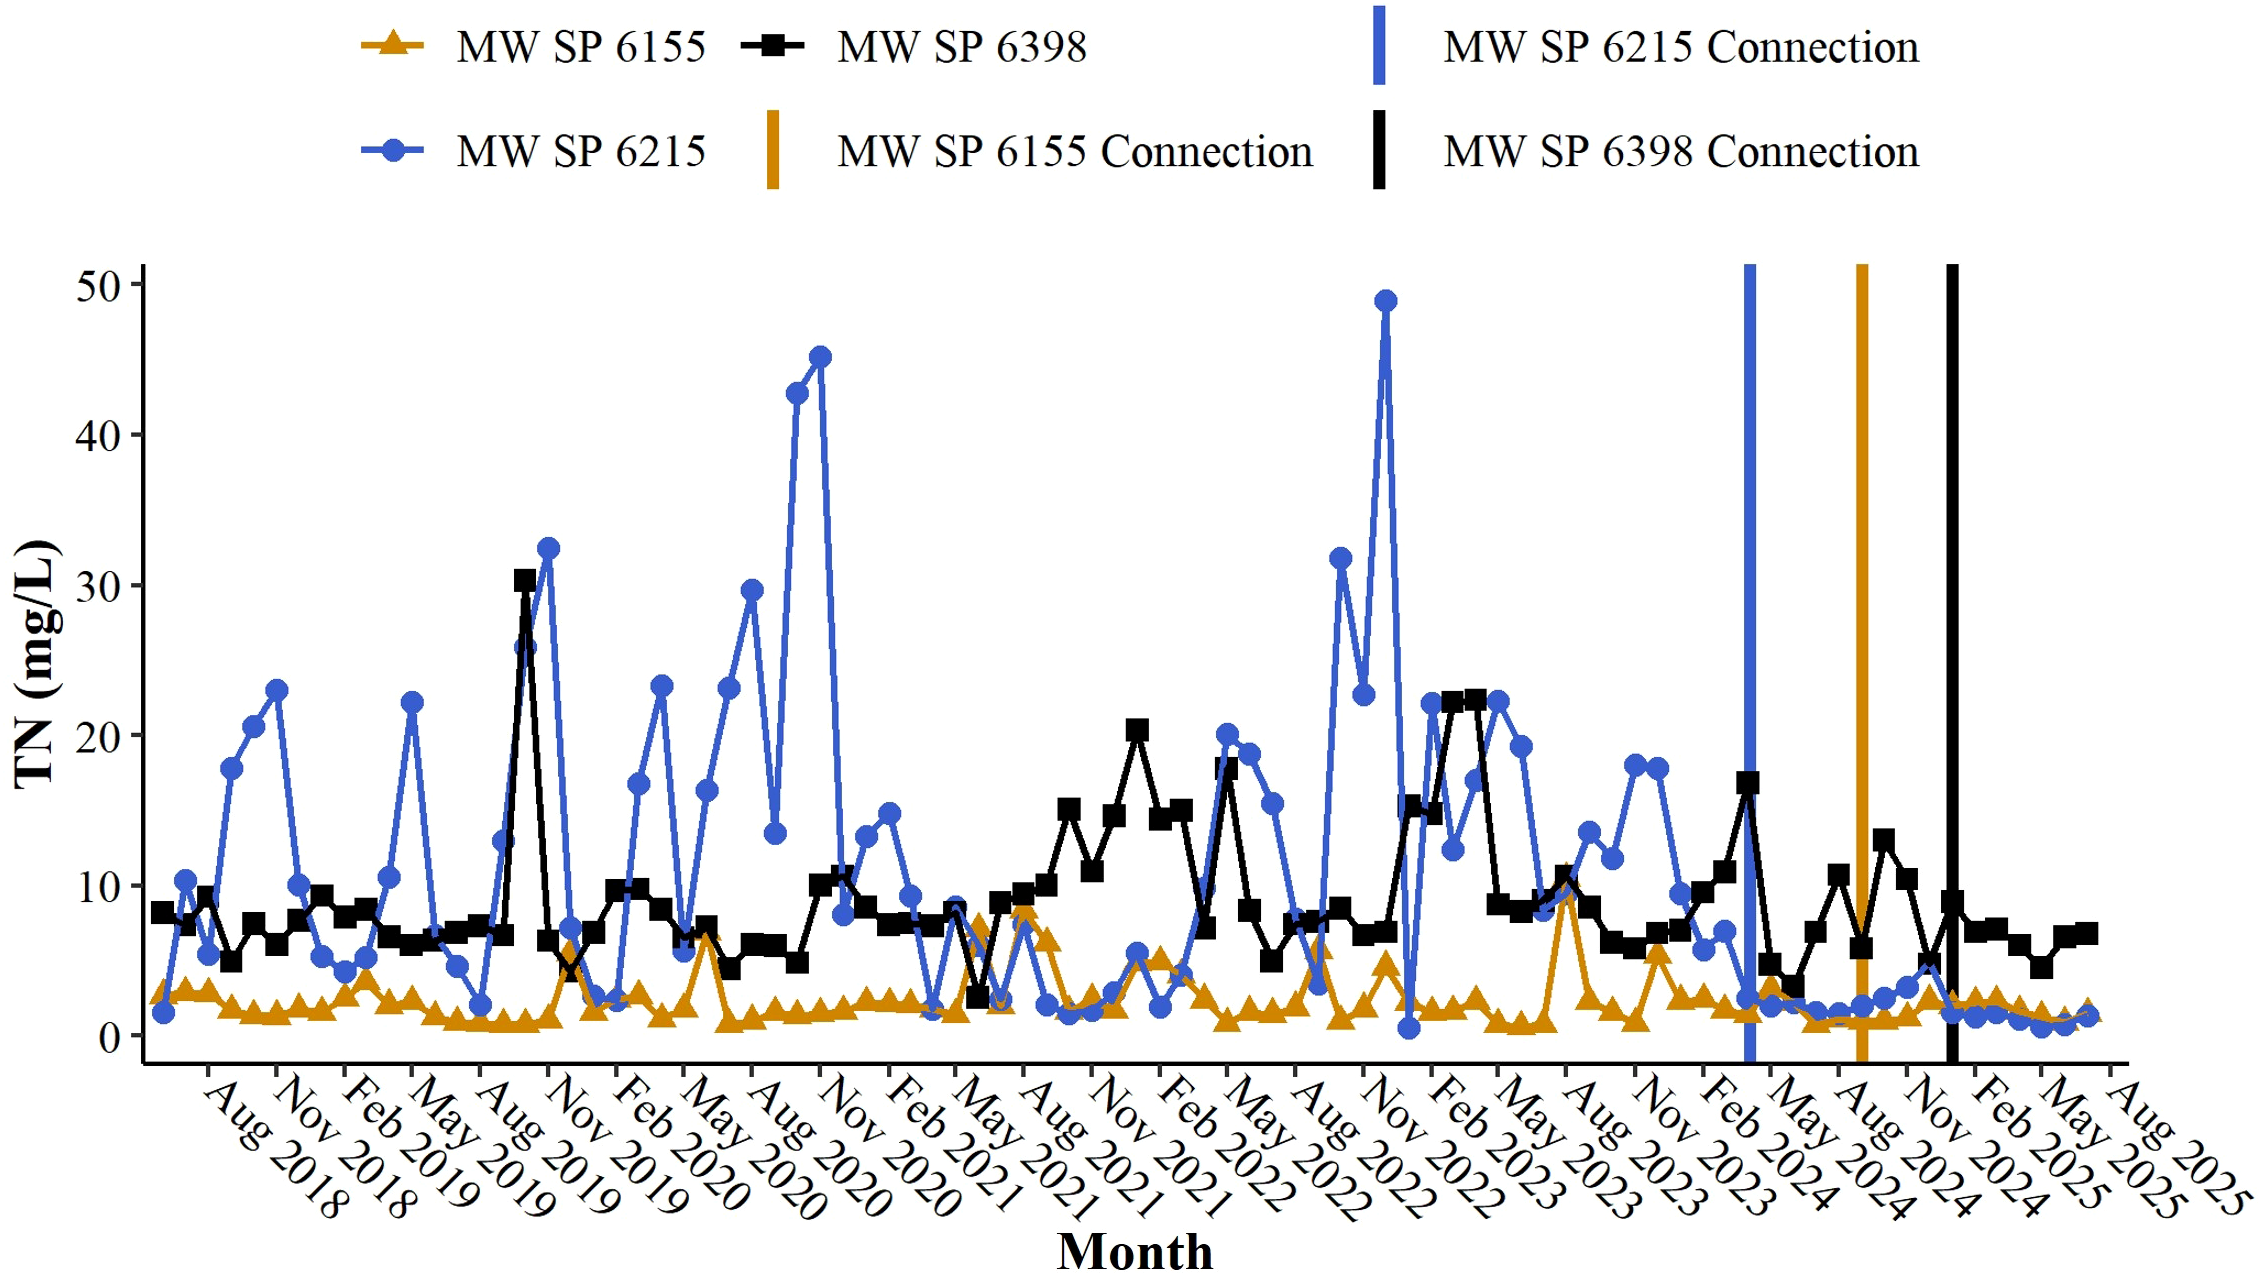
The Suntree septic community was converted to sanitary sewer on a rolling basis beginning in late 2023, with all study area homes connected by spring 2025. The three monitored properties were connected to sewer in April 2024, September 2024, and January 2025 and had stopped leaching nutrients for 15, 10, and 6 months, respectively. The three groundwater monitoring wells combined exhibited a 69% decrease in median TN and 54% decrease in NOx concentrations post-connection (Table 4, p<0.05). This change was primarily driven by the significant reduction in median TN (84%), NOx (87%), TP (39%), and PO43- (37%) concentrations in the individual monitoring well with the longest post-connection time frame (MW SP 6215). In addition, variability in monthly TN concentrations was reduced in all wells (Figure 8). We anticipate that more significant nutrient concentration declines will be measured in MW SP 6398 over time, as TN is already 14% lower and NOx is significantly lower (60%, p<0.05). However, we may not observe significant groundwater nutrient reductions in monitoring well MW SP 6155, which always measured pre-connection concentrations that were lower and less variable, similar to those measured in the sewered communities.
Table 4
| Monitoring Well | Analyte (mg/L) | TN | TKN | NOx | NH3 | TP | PO43- |
|---|---|---|---|---|---|---|---|
| MW SP 6215 (15 months) |
Pre-Connection | 9.94* | 0.20 | 9.75* | 0.035 | 1.20* | 1.05* |
| Post-Connection | 1.59 | 0.33* | 1.30 | 0.035 | 0.73 | 0.66 | |
| MW SP 6155 (10 months) |
Pre-Connection | 1.81 | 0.92 | 0.73* | 0.22 | 0.08 | 0.06 |
| Post-Connection | 1.51 | 1.20 | 0.03 | 0.94* | 0.26* | 0.06 | |
| MW SP 6398 (6 months) |
Pre-Connection | 7.90 | 7.60 | 0.05* | 8.20 | 1.90 | 0.04 |
| Post-Connection | 6.82 | 6.80 | 0.02 | 7.00 | 2.20 | 0.57 | |
| Suntree Wells Combined | Pre-Connection | 6.45* | 0.99 | 0.67* | 0.34 | 0.90 | 0.16 |
| Post-Connection | 2.00 | 0.73 | 0.31 | 0.15 | 0.66 | 0.49 |
Median groundwater concentrations in Suntree septic community wells pre- and post- septic-to-sewer connection with months since connection.
*Significant differences (p<0.05) pre- and post- connection by well. Higher significant value is in Bold.
Figure 8
TN concentrations (mg/L) at Suntree community wells pre- and post- septic-to-sewer connection.
3.4 Reclaimed community groundwater nutrient concentrations
Overall, the reclaimed communities had the highest median TN and NOX concentrations and consistently had the highest monthly TN geomean concentrations. There was tremendous variability in the median groundwater nutrient concentrations among the reclaimed communities (Figures 9A, B), with communities differing significantly for all parameters except PO43-. The Turkey Creek reclaimed community had the highest TN and NOx concentrations and the Beaches community highest in TP and PO43- (Table 5).
Figure 9
A/B. Reclaimed community median and data distribution for (A) TN concentrations and (B) TP concentrations with 1st to 3rd quartiles and whiskers.
Table 5
| Analyte (mg/L) | Beaches | Suntree | Titusville | Turkey Creek |
|---|---|---|---|---|
| TN | 5.82b | 3.02c | 1.43c | 10.24a |
| TKN | 0.20c | 2.50a | 1.10b | 0.09d |
| NH3 | 0.04c | 0.86a | 0.08b | 0.04d |
| NOx | 5.50b | 0.03d | 0.23c | 9.90a |
| TP | 0.80a | 0.03c | 0.10b | 0.02d |
| PO43- | 0.80a | 0.03b | 0.07b | 0.01c |
Reclaimed community median nutrient concentrations (mg/L).
Different superscripts indicate row significant differences at p<0.05. Highest row value is bolded.
3.4.1 Reclaimed community groundwater nitrogen
In Turkey Creek, the groundwater N was mostly inorganic NOX (91%), which was significantly higher (p<0.0001) than other reclaimed community regions. The TN in the Beaches reclaimed community groundwater was also primarily NOX, at a median concentration of 5.50 mg/L that was significantly higher (p<0.0001) than Titusville (0.23 mg/L) and Suntree (0.03 mg/L). The Suntree and Titusville reclaimed communities had the lowest TN concentrations (Figure 9A) and the largest composition of organic nitrogen (85% and 62% TKN, respectively).
3.4.2 Reclaimed community groundwater phosphorus
The Beaches reclaimed community had TP concentration (0.80 mg/L, p<0.0001) nearly 8 times higher than all other regions. The Titusville reclaimed community had the second highest TP median concentration (0.10 mg/L, p<0.0001), followed by Suntree (0.03 mg/L) and Turkey Creek (0.02 mg/L) communities (Figure 9B). The majority of the groundwater TP measured in all of the reclaimed communities was in the biologically available form (PO43-). The Beaches reclaimed community had the highest percentage of PO43- (97%), followed by the Suntree (77%), Turkey Creek (70%), and Titusville (55%) reclaimed communities.
3.4.3 Reclaimed community groundwater nitrogen after wastewater facility treatment upgrades
Two of the WWTFs serving reclaimed water to communities in the study have completed facility upgrades to enhance biological nutrient removal and reduce TN concentrations in advance of changing regulatory requirements (Chapter 403.086, Florida Statutes, 2010). One was the Palm Bay Water Reclamation Facility (WRF) that served the Turkey Creek reclaimed community and the other was the Titusville Osprey Wastewater Treatment Facility that served the Titusville reclaimed community. The Palm Bay upgrades have only recently become fully operational, however the Titusville Osprey WWTF was upgraded in August 2022, with the improvements fully operational in January 2023. TN concentrations in the effluent immediately declined after the upgrade and further decreases in TN concentrations to expected efficiencies by May 2023 (Figure 10). Since then, effluent TN geomean concentrations have been nearly half (42%) of pre-upgrade geomeans and consistently below 3.0 mg/L, meeting Florida’s Advanced Wastewater Treatment (AWT) standard.
Figure 10
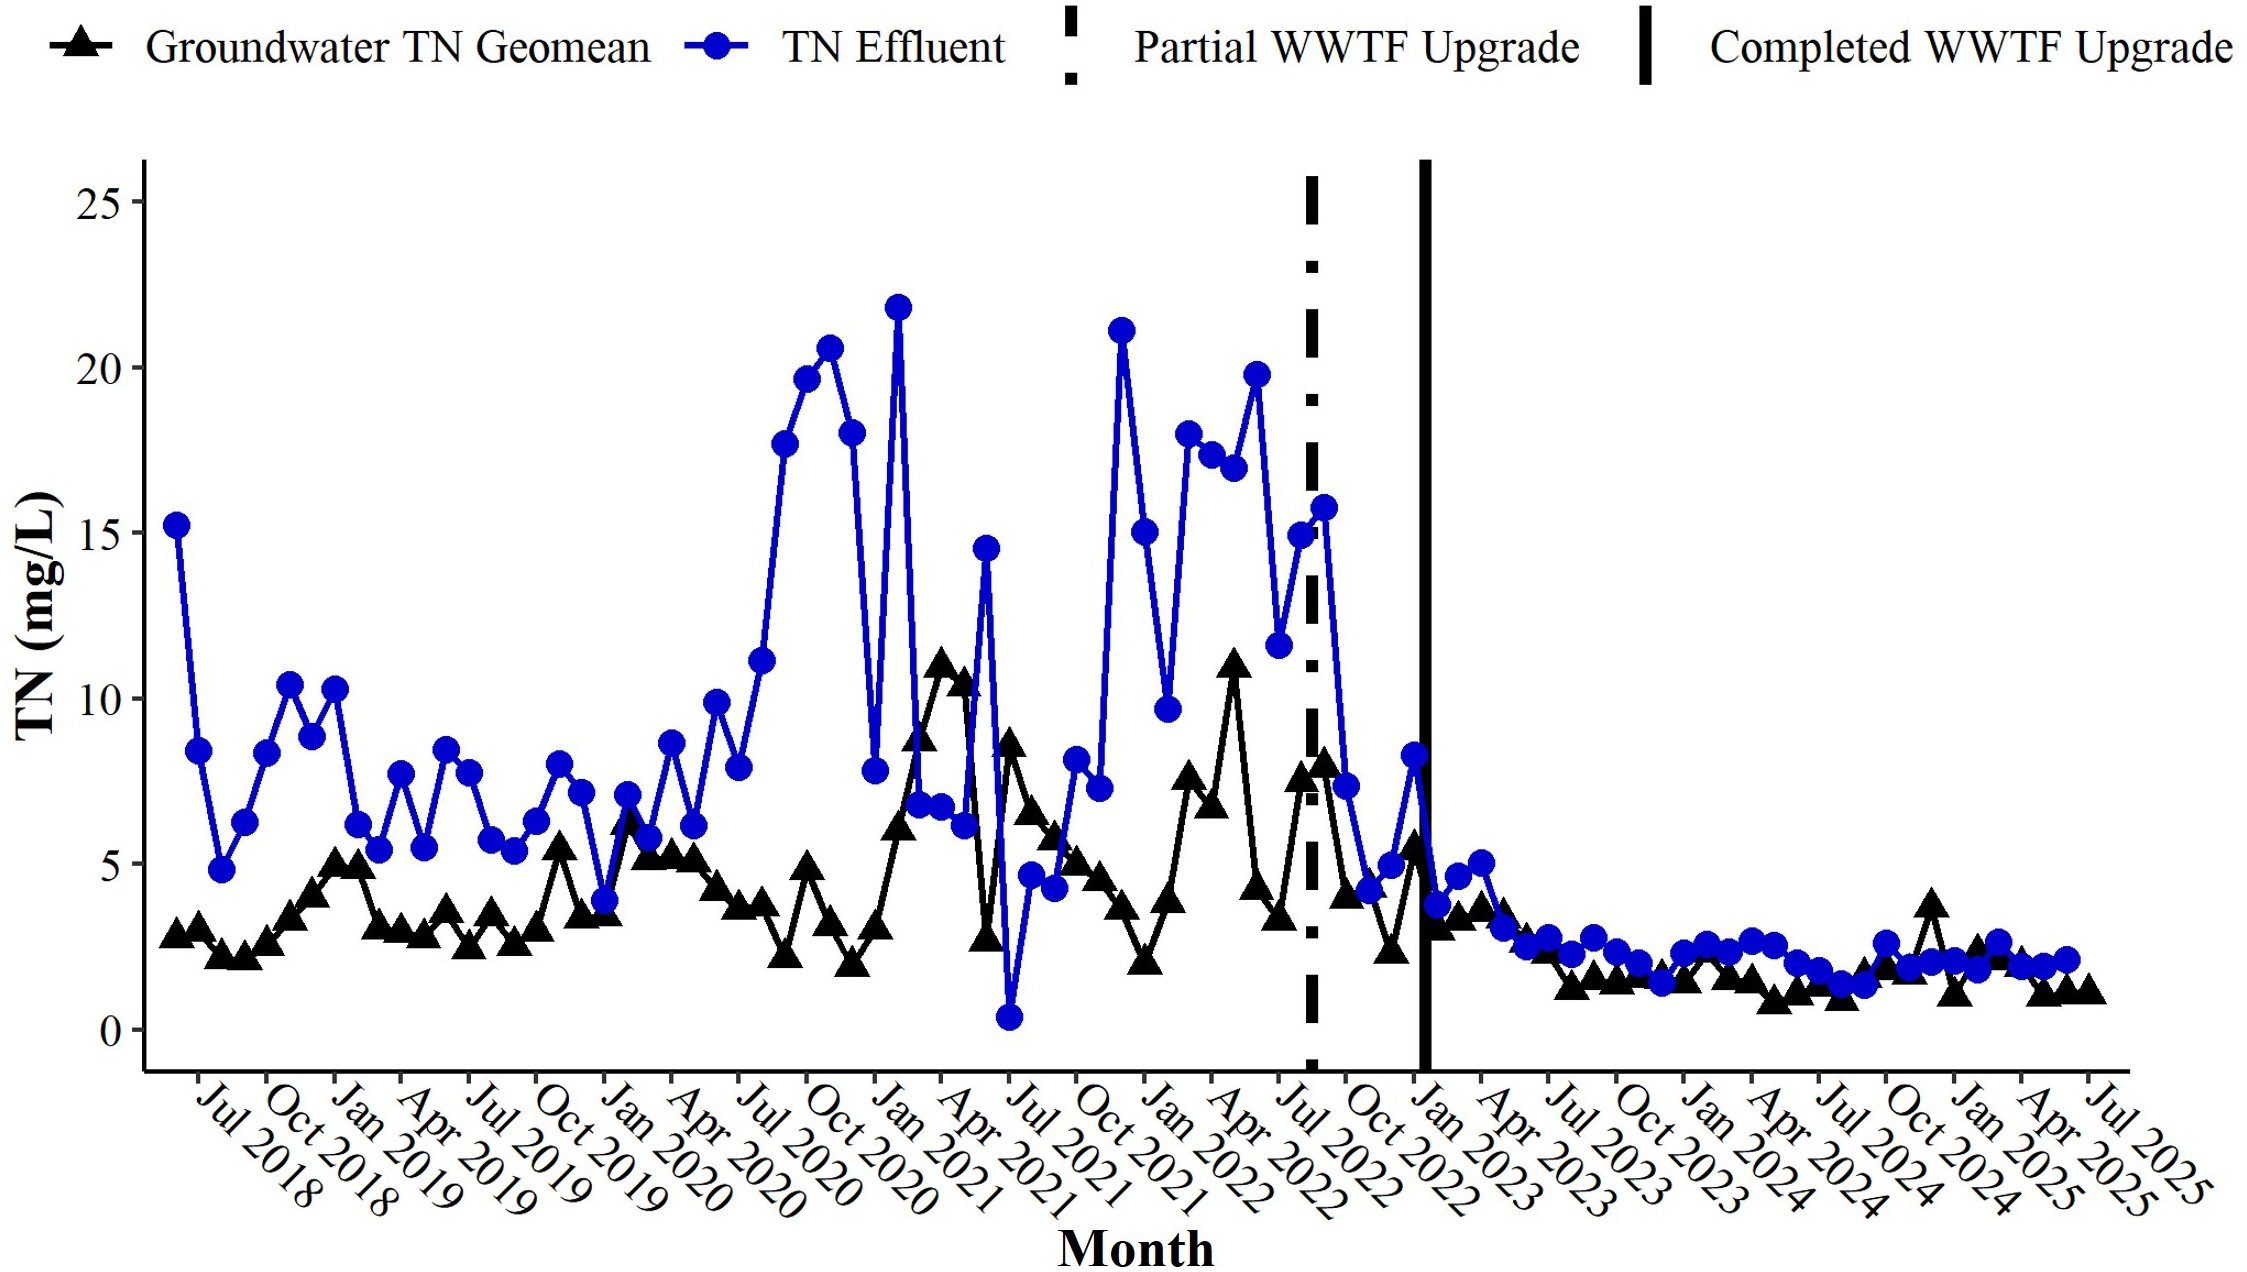
TN concentrations (mg/L) in Titusville reclaimed community groundwater and WWTF effluent pre- and post- upgrades.
With the decrease in WWTF effluent concentrations, there was a concomitant decrease in groundwater TN at the Titusville reclaimed community. Pre-post upgrade comparisons found significant differences in groundwater median TN concentrations in two of the three community monitoring wells. In one monitoring well, TN median concentrations decreased by nearly 70% from 9.70 mg/L to 3.00 mg/L (p<0.0001). The TN concentrations in the second monitoring well significantly decreased 36% after WWTF upgrade, from 1.43 mg/L to 0.92 mg/L (p<0.0001). The third monitoring well had low concentrations overall and showed no significant difference after the upgrade, suggesting this well was not as impacted by irrigation discharge concentrations possibly due to its location on the side of the house. The monthly geomeans of the monitoring wells included in Figure 10 clearly show the change in groundwater nutrients after WWTF upgrades were completed. There was no significant decrease in groundwater TP at the Titusville reclaimed community, but TP was not the target for WWTF upgrades and was not expected to decrease.
4 Discussion
Adaptive management is an iterative decision-making process that considers ongoing information to support or adapt prescribed management strategies, allowing stakeholders to learn and improve management over time (Williams et al., 2009; Williams, 2011). In their efforts to focus the SOIRLPP on the projects that would provide the greatest improvement to water quality, Brevard County adopted a Groundwater Adaptive Management process, requiring simplified spatial tools to clarify flow-dynamics, collecting (and modeling) baseline groundwater data, and continuously monitoring groundwater nutrient concentrations to provide feedback to evaluate and inform SOIRLPP strategies. The study results have been used to calibrate and validate models, estimate cost effectiveness, allocate funding, redirect funds to more groundwater pollution reduction projects, identify groundwater vulnerability areas, communicate pollutant loading impacts with stakeholders, and update load reduction benefits associated with wastewater retrofits. More details are presented below on how the groundwater study and long-term data informed adaptive management.
4.1 Septic community nutrient concentrations
One of the important management considerations for the SOIRLPP stakeholders was prioritizing septic communities for septic-to-sewer conversions based on the extent they contributed nutrients to impaired waterways. The polluting potential of septic systems in this study was assessed based on physical and structural characteristics such as the distance to groundwater, length and velocity of flow paths, soil conductance, and soil denitrification potential as well as the existing groundwater concentrations and loading estimates (Cox et al., 2020; Hoghooghi et al., 2021; Lusk et al., 2017; Sayemuzzaman and Ye, 2015; Ye et al., 2017). All of the septic communities in this study had high concentrations of organic nitrogen (TKN, NH3) in groundwater, suggesting that conditions were not ideal for nitrification to occur. This was especially the case in the Merritt Island community, where 80% of the groundwater TN was organic. Organic N is not as easily utilized by primary producers, who must first metabolize it into a biologically available form (Paerl, 1997).
Groundwater TP concentrations were much higher in the septic communities than the other wastewater treatment types and was found to be mostly in the biologically available form of inorganic PO43- which is common in septic effluent (Stewart and Tiessen, 1987; Lusk et al., 2017). The sorption of the dissolved PO43- onto particles is pH dependent, requiring the presence of oppositely charged positive ions (cations) like Al3+, Fe2+, Mn2+, Mg2+, or clay particles to bind the molecules through electrostatic forces (McCray et al., 2005; Lusk et al., 2017). The presence of high concentrations of biologically available PO43- suggests inadequate cationic exchange in soils throughout the communities in the study. The high concentrations of biologically available phosphorus can readily fuel algal blooms in P-limited systems.
Groundwater monitoring results confirmed the high priority of selected communities for conversion to sewer and informed prioritization of additional communities. In addition to the environmental variables, the feasibility of connecting a community on septic to a central sewer required important logistical considerations that impact project cost like: the density of septic systems in the community; proximity to gravity lines/lift stations; available right of way for sewer line installation; willing sellers for land needed for additional lift stations; and sufficient capacity in the conveyance system and the receiving WWTF.
The first septic community within the groundwater study area to receive sewer service was the Suntree community located directly along the IRL. Suntree was prioritized based on its high TN median concentration (6.45 mg/L), high conductance soils enabling rapid vertical and horizontal migration, and high groundwater elevation, limiting the vertical distance and time needed for soil bacteria to nitrify organic N to inorganic N (Cooper et al., 2016; Lusk et al., 2017). In addition, the Suntree septic community already had a sewer line proximal to the community and adequate WWTF capacity. The study provided important pre-conversion monitoring data to evaluate anticipated nutrient load reductions post-conversion (Mohammed, 2021).
The load calculations and groundwater concentration data document measurable TN and TP load reductions in groundwater following septic to sewer conversions. While TN reductions were anticipated, TP reductions were not. This study supports consideration of septic to sewer conversion as a management tool for reducing TP loading where soils have a limited ability to bind phosphorus year-round or through changing seasonal conditions. Where nutrient management is driven by government programs that mandate reductions, and especially in areas where algal blooms are driven by phosphorus inputs, both TN and TP reduction credits should be considered as an important incentive to encourage septic to sewer conversions.
4.2 Reclaimed community nutrient concentrations
TN concentrations in the reclaimed communities were higher than in any other community type and of the four reclaimed communities in the study, Turkey Creek had the highest groundwater TN, closely reflecting the high effluent concentrations from the Palm Bay WRF. This finding demonstrates the potential risk of groundwater contamination from reclaimed water used for irrigation in areas where soil and vegetation cannot assimilate or denitrify the nitrogen levels present in irrigation water before it reaches groundwater.
As reclaimed wastewater becomes increasingly used to augment water supplies, resource managers must consider the landscape receiving the irrigation water when establishing the effluent nutrient concentrations and the service area. If N is over-applied or not applied in appropriate ratios with other micronutrients, excess nitrogen in the soil and groundwater will increase (Chen et al., 2013). In addition to the discharge concentrations, the cost-effectiveness of upgrading WWTFs depends on the discharge concentrations reductions that are needed, the total treatment volume, and the cost of upgrading the existing type of WWTF to a system capable of achieving the targeted concentration reduction.
The Titusville reclaimed community received reclaimed irrigation water from the Osprey WWTF, which was upgraded in January 2023. Within two months, the reclaimed community groundwater TN concentrations had significantly decreased in a majority of the monitoring wells. Upgrades were initiated in June 2022 at the Palm Bay WRF that provided the reclaimed irrigation water for the Turkey Creek reclaimed community. The initial plant modifications appeared to reduce TN and TP concentrations in both effluent and reclaimed community groundwater. However, issues with the plant operations and supply chains delayed the project improvements becoming fully operational and effluent and community groundwater TN concentrations increased again. Operational improvements are currently underway with nutrient reductions becoming increasingly apparent in the effluent and groundwater. The close relationship between the WRF effluent and the community groundwater TN concentrations suggests that when the plant improvements are fully functional, there will be a resulting reduction in groundwater nutrient concentrations over time.
4.3 Study results and application to management
Restoring healthy water quality conditions in the IRL will require management of both stormwater and groundwater. This study demonstrates an example of groundwater adaptive management where the research design and data collection were specifically established to prioritize and evaluate projects implemented to address groundwater sources of nutrients. This study relied on modeling to locate, prioritize, and plan groundwater restoration projects, installing groundwater wells and monitoring representative groundwater throughout the county, implementing management strategies, evaluating the results, and refining and adjusting the modeling and management based on evaluation outcomes (Figure 11). The initial findings that groundwater TN was highest in reclaimed communities and TP was highest in septic communities were both unexpected, supporting changes in management priorities, policy incentives, and strategies.
Figure 11
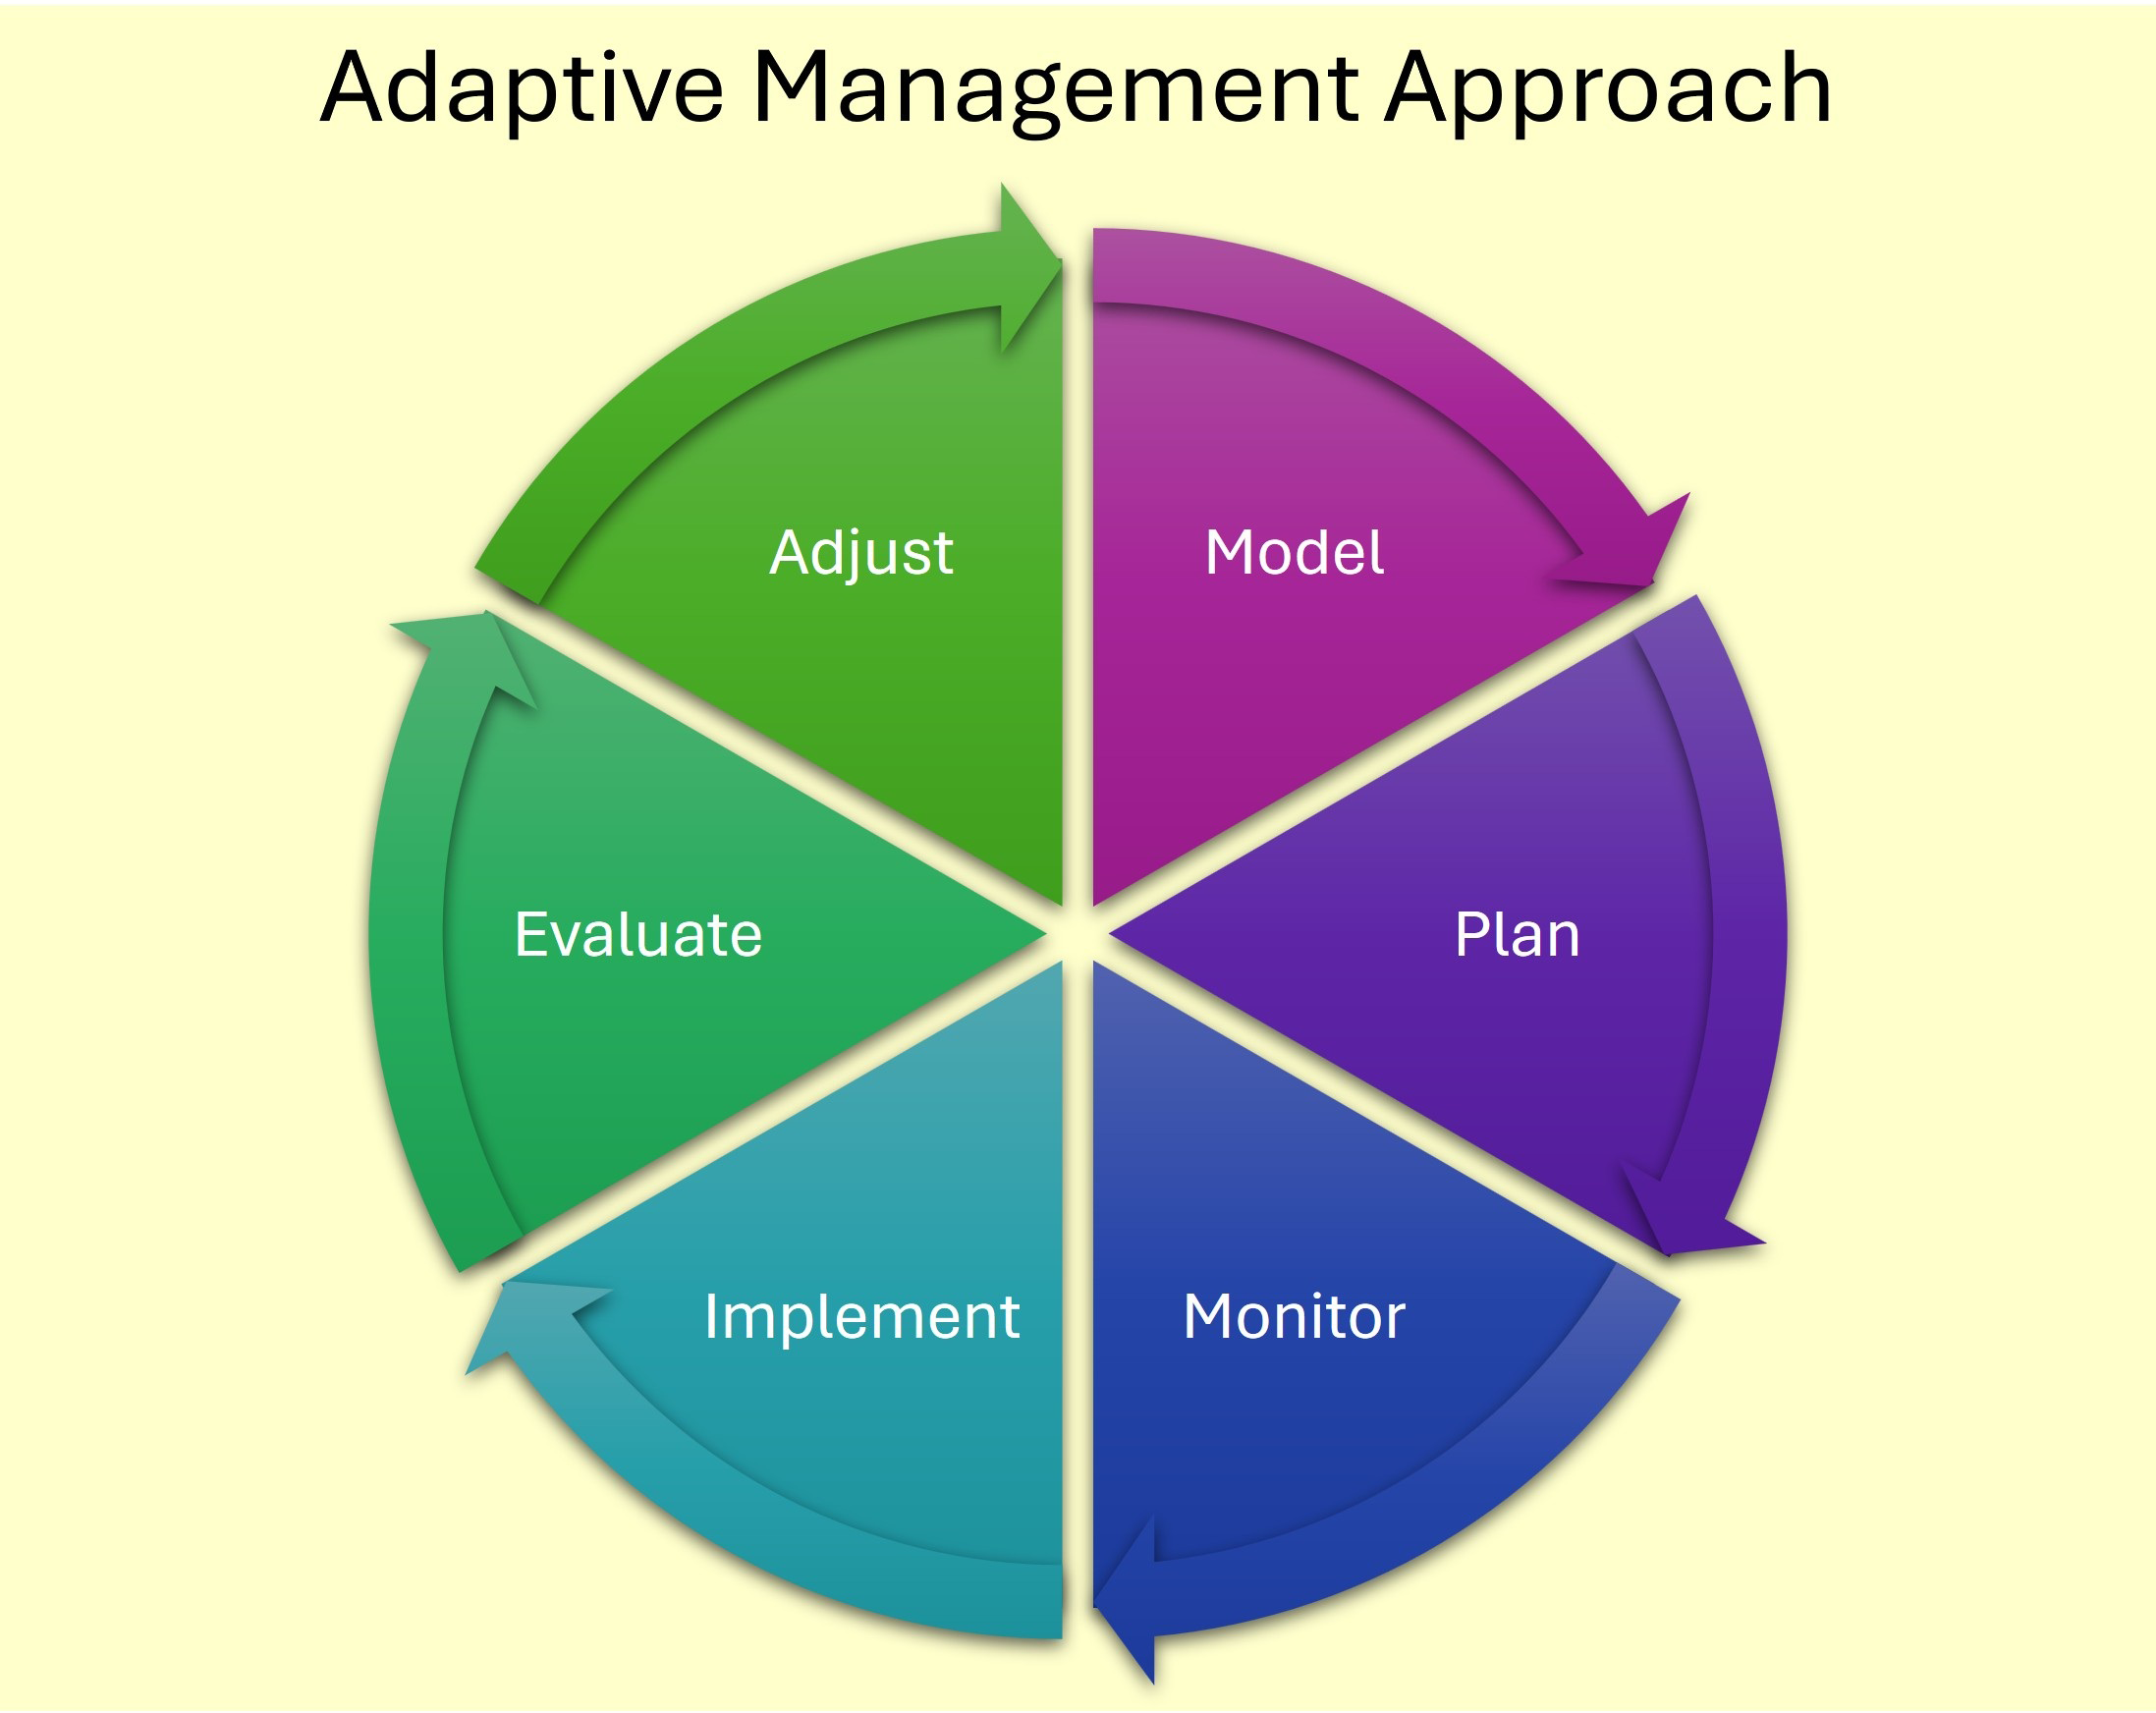
Adaptive management approach.
Consistent with the findings of others (Barile, 2018; Herren et al., 2021; Lapointe et al., 2017), the results of this study underscore the need to prioritize and address septic systems where they are significantly contaminating groundwater. The methods and modeling used as part of this research helped Brevard County prioritize over 5,000 septic systems for septic-to-sewer conversions based on their estimated load reductions and other practical considerations such as sufficient central sewer collection and treatment capacity as well as constructability. The anticipated load reduction benefits and associated cost-share funding for septic to sewer conversions were refined based on updated groundwater loading estimates and additional septic to sewer areas were allocated funding through annual program updates supported by AM principles.
The study provides multiple years of pre-retrofit project data to compare with post-retrofit data to evaluate the effectiveness of specific septic to sewer conversion projects. In priority areas where sewer service is not feasible, enhanced nutrient-reducing aerobic septic systems are being used to improve nitrification and denitrification efficiency (Lusk et al., 2017). Brevard County is currently evaluating the performance of innovative media for in ground nitrogen reducing biofilters as passive septic drainfield treatment. Improving the vertical and horizontal locations of septic systems is also important, requiring that regulatory agencies ensure there is adequate distance to the groundwater and organic soils with mid-ranged hydraulic conductivity. Lastly, as the state agency responsible for ensuring water quality standards are protected, the FDEP should consider providing TP reduction credits in addition to TN reduction credits when septic communities are converted to sewer.
The high groundwater nitrogen in the reclaimed communities supported the addition of more WWTF upgrades to the SOIRLPP. The findings in this study clarify the need to consider the permitted effluent nutrient concentrations before allowing the reclaimed wastewater to be reused for irrigation. Recent Florida legislation (Florida Clean Waterways Act of 2020) addresses this need with new WWTF effluent requirements to meet advanced treatment standards of 3.0 mg/L TN and 1.0 mg/L TP by the year 2025. This rule also required that IRL stakeholders develop a prioritization plan to address the most polluting septic systems in the watershed. Brevard County and the other IRL stakeholders have the data and loading estimates to support septic system prioritization planning.
The Brevard County SOIRLPP will continue to be updated annually with information from this groundwater study, involving regional stakeholders in decision-making using modeling and monitoring to inform management priorities. Additionally, the research findings support project priorities and nutrient load reduction credits for TN and TP. Watershed loading models can be updated with measured groundwater concentrations to calibrate model outputs and improve loading estimates parsed out by stormwater and baseflow sources. These stakeholder processes integrate new knowledge and understanding into long-term commitments and management strategies.
5 Conclusion
The findings of this study improved stakeholder understanding and provided important feedback to prioritize and evaluate groundwater nutrient reduction projects implemented to reduce nutrient inputs to the IRL coastal estuary. The high spatial and temporal variation in groundwater nutrient concentrations underscores the need to have several years of monthly data to confidently measure trends and significant differences between residential wastewater treatment types. The study demonstrates a scientific method to prioritize septic system communities based on their practical costs and environmental benefits and to measure success based on changes in groundwater concentrations after retrofit.
Groundwater monitoring results demonstrate the potential environmental impacts from the discharge of high-nutrient reclaimed wastewater for irrigation in areas with poor soil attenuation. Groundwater data in the investigated reclaimed communities mimicked discharge effluent concentrations, suggesting a significant transfer of nutrients to groundwater from reclaimed irrigation. The high groundwater concentrations of biologically available nutrients in the monitored residential communities demonstrate the importance of addressing groundwater as a significant conveyance of nutrient loading to surface waters and underscores the need for groundwater adaptive management.
An important finding of this research is that all residential communities in the study had higher groundwater nutrient concentrations than natural areas, including the sewered communities. In sewered communities, elevated nutrient concentrations were indicators of other pollution sources including fertilizers and other lawncare chemical use, pet waste, landscaping choices, lateral and gravity line leaks, lift station failures, and WWTF operational issues can result in sewage releases into surface and groundwaters. Although policy changes are encouraging WWTF upgrades, the ability of communities to upgrade their plants is dependent on practical, spatial, and fiscal constraints. There is no wastewater treatment process that is perfect.
Next steps in this research will refine pollutant load models to estimate potential reductions of TN and TP to the IRL from the current and prioritized septic system conversions or retrofits and WWTF upgrades. Ideally, this will be accomplished after more projects are completed and evaluated with post-monitoring data.
Statements
Data availability statement
The original contributions presented in the study are included in the article/supplementary material. Further inquiries can be directed to the corresponding author.
Author contributions
LS: Validation, Conceptualization, Writing – review & editing, Investigation, Funding acquisition, Methodology, Supervision, Formal analysis, Software, Data curation, Visualization, Resources, Writing – original draft, Project administration. CL: Validation, Project administration, Funding acquisition, Supervision, Writing – review & editing, Formal analysis, Investigation, Software, Methodology, Data curation, Visualization, Resources, Conceptualization. VB: Writing – review & editing, Conceptualization, Resources, Funding acquisition, Project administration. AG: Writing – review & editing. JA: Formal analysis, Writing – review & editing, Methodology, Data curation.
Funding
The author(s) declared that financial support was received for this work and/or its publication. Funding for this study was provided by a Florida legislative appropriation and Brevard County Save our Indian River Lagoon Program.
Acknowledgments
This study was completed at the request of Brevard County citizens who funded and supervised the implementation of the Save Our Indian River Lagoon Project Plan (SOIRLPP). Additionally, we thank the Brevard County staff who shared their insights and knowledge throughout the process, contributing tremendously to this team effort. Lastly, we must acknowledge and appreciate the community homeowners who volunteered to participate in the research by allowing access to their properties for well installation and monitoring.
Conflict of interest
The authors declare that the research was conducted in the absence of any commercial or financial relationships that could be construed as a potential conflict of interest.
Generative AI statement
The author(s) declare that no Generative AI was used in the creation of this manuscript.
Any alternative text (alt text) provided alongside figures in this article has been generated by Frontiers with the support of artificial intelligence and reasonable efforts have been made to ensure accuracy, including review by the authors wherever possible. If you identify any issues, please contact us.
Publisher’s note
All claims expressed in this article are solely those of the authors and do not necessarily represent those of their affiliated organizations, or those of the publisher, the editors and the reviewers. Any product that may be evaluated in this article, or claim that may be made by its manufacturer, is not guaranteed or endorsed by the publisher.
References
1
Adams D. H. Tremain D. M. Paperno R. Sonne C. (2019). Florida lagoon at risk of ecosystem collapse. Science365, 991–992. doi: 10.1126/science.aaz0175
2
Anderson D. M. Fensin E. Gobler C. J. Hoeglund A. E. Hubbard K. A. Kulis D. M. et al . (2021). Marine harmful algal blooms (HABs) in the United States: history, current status, and future trends. Harmful Algae.120, 101975. doi: 10.1016/j.hal.2021
3
Applied Ecology, Inc. (AEI) (2018). OSTDS Pollution Potential Analysis: Final Report. Brevard County Natural Resources Management Office. 1–159.
4
Backer L. C. (2009). Impacts of Florida red tides on coastal communities. Harmful Algae.8, 618–622. doi: 10.1016/j.hal.2008.11.008
5
Badruzzaman M. Pinzon J. Oppenheimer J. Jacangelo J. G. (2012). Sources of nutrients impacting surface waters in Florida: a review. J. Environ. Manage.109, 80–92. doi: 10.1016/j.jenvman.2012.04.040
6
Barile P. J. (2018). Widespread sewage pollution of the Indian River Lagoon system, Florida (USA) resolved by spatial analyses of macroalgal biogeochemistry. Mar. pollut. Bull.128, 557–574. doi: 10.1016/j.marpolbul.2018.01.046
7
Bechard A. (2021). Gone with the wind: Declines in property values as harmful algal blooms are blown towards the shore. J. Real Estate Finance Econ.62, 242–257. doi: 10.1007/s11146-020-09749-6
8
Bowen J. L. Kroeger K. D. Tomasky G. Pabich W. J. Cole M. L. Carmichael R. H. et al . (2007). A review of land–sea coupling by groundwater discharge of nitrogen to New England estuaries: Mechanisms and effects. Appl. Geochem.22, 171–191. doi: 10.1016/j.apgeochem.2006.09.002
9
Boyer E. W. Goodale C. L. Jaworski N. A. Howarth R. W. (2002). Anthropogenic nitrogen sources and relationships to riverine nitrogen export in the northeastern U.S.A. Biogeochemistry57, 137–169. doi: 10.1023/A:1015709302073
10
Chen W. Lu S. Jiao W. Wang M. Chang A. C. (2013). Reclaimed water: A safe irrigation water source? Environ. Dev.8, 74–83. doi: 10.1016/j.envdev.2013.04.003
11
Cooper J. A. Loomis G. W. Amador J. A. (2016). Hell and high water: Diminished septic system performance in coastal regions due to climate change. PloS One11, e0162104. doi: 10.1371/journal.pone.0162104
12
Court C. Ferreira J. Ropicki A. Qiao X. Saha B. (2021). Quantifying the socio-economic impacts of harmful algal blooms in Southwest Florida in 2018. ( University of Florida Institute of Food and Agricultural Sciences). Available online at: https://www.researchgate.net/profile/Joao-Ferreira-132/publication/353669784_Quantifying_the_Socio-Economic_Impacts_of_Harmful_Algal_Blooms_in_Southwest_Florida_in_2018/links/61098e7c169a1a0103dad6e2/Quantifying-the-Socio-Economic-Impacts-of-Harmful-Algal-Blooms-in-Southwest-Florida-in-2018.pdf (Accessed October 10, 2025).
13
Cox A. H. Surabian D. Loomis G. W. Turenne J. D. Amador J. A. (2020). Temporal variability in the vertical separation distance of septic system drainfields along the southern rhode island coast. Water Air Soil pollut.231, 107. doi: 10.1007/s11270-020-04488-z
14
D’Elia C. E. Sanders J. G. Boynton W. R. (1986). Nutrient enrichment studies in a coastal plain estuary: Phytoplankton growth in large scale, continuous cultures. J. Fish. Aquat. Sci.43, 397–406. Available online at: https://www.researchgate.net/profile/Christopher-Delia/publication/237182332_Nutrient_Enrichment_Studies_in_a_Coastal_Plain_Estuary_Phytoplankton_Growth_in_Large-Scale_Continuous_Cultures/links/546cb4270cf294bea7a633a7/Nutrient-Enrichment-Studies-in-a-Coastal-Plain-Estuary-Phytoplankton-Growth-in-Large-Scale-Continuous-Cultures.pdf.
15
Driscoll C. Whitall D. Aber J. Boyer E. Castro M. Cronan C. et al . (2003). Nitrogen pollution: Sources and consequences in the U.S. Northeast. Environ.: Sci. Policy Sustain. Dev.45, 8–22. doi: 10.1080/00139150309604553
16
Dubrovsky N. M. Burow K. R. Clark G. M. Gronberg J. M. Hamilton P. A. Hitt K. J. et al . (2010). The quality of our Nation’s waters—Nutrients in the Nation’s streams and groundwater 1992–2004. US geological survey Circular1350, 174. doi: 10.3133/cir1350
17
Eppley R. W. Peterson B. J. (1979). Particulate organic matter flux and planktonic new production in the deep ocean. Nature.282, 677–680. doi: 10.1038/282677a0
18
Florida Clean Waterways Act of 2020 Chapter 403, florida statutes. Available online at: https://www.flsenate.gov/Session/Bill/2020/712/BillText/er/HTML (Accessed July 15, 2025).
19
Florida Department of Environmental Protection (FDEP) (2022). “ 2021 reclaimed inventory. Division of water resource management,” ( Florida Department of Environmental Protection). Available online at: https://floridadep.gov/water/domestic-wastewater/documents/2021-reuse-inventory-report (Accessed August 3, 2025).
20
Florida Department of Environmental Protection (FDEP) (2023). “ Onsite sewage,” in program. Available online at: https://floridadep.gov/water/onsite-sewage.
21
Galloway J. N. Townsend A. R. Erisman J. W. Bekunda M. Cai Z. Freney J. R. et al . (2008). Transformation of the nitrogen cycle: Recent trends, questions, and potential solutions. Science.320, 889–892. doi: 10.1126/science.1126674
22
Herren L. W. Brewton R. A. Wilking L. E. Tarnowski M. E. Vogel M. A. Lapointe B. E. (2021). Septic systems drive nutrient enrichment of groundwaters and eutrophication in the urbanized Indian River Lagoon, Florida. Mar. pollut. Bull.172, 112928. doi: 10.1016/j.marpolbul.2021.112928
23
Hoghooghi N. Pippin J. S. Meyer B. K. Hodges J. B. Bledsoe B. P. (2021). Frontiers in assessing septic systems vulnerability in coastal Georgia, USA: Modeling approach and management implications. PloS One16, (8) e0256606. doi: 10.1371/journal.pone.0256606
24
Howarth R. W. Billen G. Swaney D. Townsend A. Jaworski N. Lajtha K. et al . (1996). Regional nitrogen budgets and riverine N & P fluxes for the drainages to the North Atlantic Ocean: Natural and human influences. Biogeochemistry.35, 75–139. doi: 10.1007/BF02179825
25
Howarth R. W. Sharpley A. Walker D. (2002). Sources of nutrient pollution to coastal waters in the United States: implications for achieving coastal water quality goals. Estuaries.25, 656–676. doi: 10.1007/BF02804898
26
IRL Species Inventory (2024). Available online at: https://irlspecies.org/index.php (Accessed August 7, 2024).
27
Jani J. Yang Y. Y. Lusk M. G. Toor G. S. (2020). Composition of nitrogen in urban residential stormwater runoff: Concentrations, loads, and source characterization of nitrate and organic nitrogen. PloS One15, e0229715. doi: 10.1371/journal.pone.0229715
28
Jiang Y. Nishimura P. van den Heuvel M. R. MacQuarrie K. T. Crane C. S. Xing Z. et al . (2015). Modeling land-based nitrogen loads from groundwater-dominated agricultural watersheds to estuaries to inform nutrient reduction planning. J. Hydrology529, 213–230. doi: 10.1016/j.jhydrol.2015.07.033
29
Katz B. G. Griffin D. W. Davis J. H. (2009). Groundwater quality impacts from the land application of treated municipal wastewater in a large karstic spring basin: chemical and microbiological indicators. . Sci. Total Environ407, 2872–2886. doi: 10.1016/j.scitotenv.2009.01.022
30
Lapointe B. E. Herren L. W. Paule A. L. (2017). Septic systems contribute to nutrient pollution and harmful algal blooms in the St. Lucie Estuary, Southeast Florida, USA. Harmful Algae.70, 1–22. doi: 10.1016/j.hal.2017.09.005
31
Lusk M. G. Toor G. S. Yang Y. Y. Mechtensimer S. De M. Obreza T. A. (2017). A review of the fate and transport of nitrogen, phosphorus, pathogens, and trace organic chemicals in septic systems. Crit. Rev. Env. Sci. Technol.47, 455–541. doi: 10.1080/10643389.2017.1327787
32
McCray J. E. Kirkland S. L. Siegrist R. L. Thyne G. D. (2005). Model parameters for simulating fate and transport of on-site wastewater nutrients. Groundwater.43, 628–639. doi: 10.1111/j.1745-6584.2005.0077.x
33
Mohammed J. A. (2021). An assessment of nutrient improvement in surface water due to the conversion of onsite sewage treatment and disposal systems to sewerage. USF Tampa Graduate Theses and Dissertations ( University of South Florida). Available online at: https://digitalcommons.usf.edu/etd/9190 (Accessed December 3, 2025).
34
Nixon S. W. (1995). Coastal eutrophication: A definition, social causes, and future concerns. Ophelia.41, 199–220. doi: 10.1080/00785236.1995.10422044
35
Paerl H. W. (1997). Coastal eutrophication and harmful algal blooms: Importance of atmospheric deposition and groundwater as “new“ nitrogen and other nutrient sources. Limnol. Oceanogr42, 1154–1165. doi: 10.4319/lo.1997.42.5_part_2.1154
36
Phlips E. J. Badylak S. Nelson N. G. Hall L. M. Jacoby C. A. Lasi M. A. et al . (2021). Cyclical patterns and a regime shift in the character of phytoplankton blooms in a restricted sub-tropical lagoon, Indian river lagoon, florida, United States. Front. Mar. Sci.8. doi: 10.3389/fmars.2021.730934
37
Rabalais N. N. Turner R. E. Díaz R. J. Justić D. (2009). Global change and eutrophication of coastal waters. ICES J. Mar. Sci.66, 1528–1537. doi: 10.1093/icesjms/fsp047
38
R Core Team (2025). R: A language and environment for statistical computing (Vienna, Austria: R Foundation for Statistical Computing). Available online at: https://www.R-project.org/ (Accessed September 3, 2025).
39
Rios J. F. Ye M. Wand L. Lee P. (2011). ArcNLET: an arcGIS-based nitrate load estimation toolkit user’s manual (Tallahassee, FL: Florida Department of Environmental Protection). Available online at: https://people.sc.fsu.edu/~mye/ArcNLET/users_manual.pdf (Accessed March 7, 2025).
40
Rios J. F. Ye M. Wang L. Lee P. Z. Davis H. Hicks R. W. (2013). ArcNLET: A GIS-based software to simulate groundwater nitrate load from septic systems to surface water bodies. Comput. Geosci.52, 108–116. doi: 10.1016/j.cageo.2012.10.003
41
Ryther J. H. Dunstan W. M. (1971). Nitrogen, phosphorus, and eutrophication in the coastal marine environment. Science.171, 1008–l 112. doi: 10.1126/science.171.3975.1008
42
Sayemuzzaman M. Ye M. (2015). Estimation of Nitrogen Load from Septic Systems to Surface Water Bodies in the Indian River Lagoon (Main-South Canal drainage basin) (Tallahassee, FL: Florida State University). Available online at: http://purl.flvc.org/fsu/fd/FSU_FALL2017_Lei_fsu_0071N_14260 (Accessed April 3, 2025).
43
Seaver G. A. (2010). Estuary response to an abrupt, large increase in groundwater nitrate input. Appl. Geochemistry25, 1453–1460. doi: 10.1016/j.apgeochem.2010.07.003
44
Shukla S. Saxena A. (2020). Sources and leaching of nitrate contamination in groundwater. Curr. Sci.118, 00113891. doi: 10.18520/cs/v118/i6/883-891
45
Smith N. P. (1993). Tidal and nontidal flushing of Florida’s Indian River Lagoon. Estuaries16, 739–746. doi: 10.2307/1352432
46
SOIRLPP (2025). Save our Indian river lagoon project plan 2024 update for brevard county, florida ( Tetra Tech, Inc. for Brevard County Natural Resources Management Department). Available online at: https://www.brevardfl.gov/SaveOurLagoon/ProjectPlan (Accessed August 4, 2025).
47
Stewart J. W. B. Tiessen H. (1987). Dynamics of soil organic phosphorus. Biogeochemistry.4, 41–60. doi: 10.1007/BF02187361
48
Thomann J. A. Werner A. D. Irvine D. J. (2022). Developing adaptive management guidance for groundwater planning and development. J. Environ. Manage322. doi: 10.1016/j.jenvman.2022.116052
49
Thomann J. A. Werner A. D. Irvine D. J. Currell M. J. (2020). Adaptive management in groundwater planning and development: A review of theory and applications. J. Hydrol586. doi: 10.1016/j.jhydrol.2020.124871
50
Toor G. S. Rainey D. P. (2009). History and current status of reclaimed water use in Florida. Institute Food Agric. Sci.2009, 1–5. doi: 10.32473/edis-ss520-2009
51
Wang Y. Liu D. Xiao W. Zhou P. Tian C. Zhang C. et al . (2021). Coastal eutrophication in China: Trend, sources, and ecological effects. Harmful Algae.107, 2058. doi: 10.1016/j.hal.2021.102058
52
Williams B. K. (2011). Adaptive management of natural resources—framework and issues. J.Environ. Manage.92, 1346–1353. doi: 10.1016/j.jenvman.2010.10.041
53
Williams B. K. Szaro R. C. Shapiro C. D. (2009). Adaptive management: the U.S. Department of the interior technical guide (Washington, D.C: Adaptive Management Working Group, U.S. Department of the Interior). Available online at: https://www.doi.gov/sites/doi.gov/files/migrated/ppa/upload/TechGuide.pdf (Accessed August 28, 2025).
54
Wilson S. J. Moody A. McKenzie T. Cardenas M. B. Luijendijk E. Sawyer A. H. et al . (2024). Global subterranean estuaries modify groundwater nutrient loading to the ocean. Limnology oceanography Lett.9, 411–422. doi: 10.1002/lol2.10390
55
Ye M. Sun H. Hallas K. (2017). Numerical estimation of nitrogen load from septic systems to surface water bodies in St. Lucie River and Estuary Basin, Florida. Environ. Earth Sci.76, 1–14. doi: 10.1007/s12665-016-6358-y
56
Yin S. Wu W. Liu H. Bao Z. (2016). The impact of river infiltration on the chemistry of shallow groundwater in a reclaimed water irrigation area. J. Contam. Hydrol.193, 1–9. doi: 10.1016/j.jconhyd.2016.08.004
Summary
Keywords
adaptive management, nutrient sources, groundwater, wastewater (WW), coastal eutrophication, Indian River Lagoon
Citation
Souto L, Listopad C, Barker V, Gubler A and Appelt J (2025) Groundwater nutrient concentrations in residential areas with different wastewater treatments: a long-term monitoring study to inform adaptive management strategies. Front. Mar. Sci. 12:1714078. doi: 10.3389/fmars.2025.1714078
Received
26 September 2025
Revised
10 November 2025
Accepted
25 November 2025
Published
10 December 2025
Volume
12 - 2025
Edited by
Kevin Brett Johnson, Tarleton State University, United States
Reviewed by
Kate Mulvaney, United States Environmental Protection Agency, United States
Qizhong Guo, Rutgers, The State University of New Jersey, United States
Updates
Copyright
© 2025 Souto, Listopad, Barker, Gubler and Appelt.
This is an open-access article distributed under the terms of the Creative Commons Attribution License (CC BY). The use, distribution or reproduction in other forums is permitted, provided the original author(s) and the copyright owner(s) are credited and that the original publication in this journal is cited, in accordance with accepted academic practice. No use, distribution or reproduction is permitted which does not comply with these terms.
*Correspondence: Leesa Souto, lsouto@appliedecologyinc.com
Disclaimer
All claims expressed in this article are solely those of the authors and do not necessarily represent those of their affiliated organizations, or those of the publisher, the editors and the reviewers. Any product that may be evaluated in this article or claim that may be made by its manufacturer is not guaranteed or endorsed by the publisher.