Abstract
Bays are active land–sea transition zones where the internal hydrodynamic processes control the material exchange between the bay and open sea. Yet, the differences and potential connectivity of those processes between adjacent bays and off-bay areas remains understudied. Using in situ observations during a spring tide in May 2020, complemented with satellite imagery and reanalysis dataset, this study examines sediment dynamics in two neighboring bays of central Fujian—Shenhu Bay (SHB) and Weitou Bay (WTB). Results show that SHB exhibits tidal asymmetry with strong offshore export, while WTB has weaker, vertically divergent residual currents with bottom-layer seaward suspended sediment flux. Outside the bays, residual currents and sediment flux follow a northeastward coastal pathway under late-spring circulation. Sediment transport from bay interiors to mouths and is further transported downstream by regional circulation, potentially entering adjacent bay through exchange between the bay and the open sea. Mechanism analysis indicates that Eulerian residual currents dominate net sediment transport, whereas tidal pumping is minor. These findings reveal sediment export pathways and inter-bay connectivity, advancing understanding of coastal sediment dynamics and material cycling in Fujian waters.
1 Introduction
Bays represent the most active transitional zones of land–sea interaction, within which hydrodynamic processes govern the sediment exchange between the bay and adjacent waters (Woodroffe, 2003). Driven by multiple forces such as tides, monsoons, coastal currents, and local topography, the sediment dynamic processes within bays are often complex (Gao et al., 2018, 2020; Lin et al., 2021; Yang et al., 2022). At a larger scale, adjacent bays can be connected through lateral sediment transport, which not only redistributes suspended matter between semi-enclosed systems but also regulates the pathways of nutrients, organic matter, and contaminants. Such cross-bay connectivity plays a crucial role in governing nearshore material exchange, influencing sediment budgets, and shaping the ecological evolution of coastal environments (Montoya et al., 2018; Song et al., 2021; Huang et al., 2024; Gao et al., 2023, 2024). However, existing studies mostly focus on individual bays, and understanding of the differences and potential connectivity of sediment dynamics between neighboring bays and off-bay areas remains limited.
The coastal waters off Fujian are influenced by the Zhejiang–Fujian coastal current (ZFCC), the Taiwan Warm Current (TWC), and monsoon-driven circulations, showing pronounced seasonal transport patterns (Guan and Fang, 2006; Yuan et al., 2008; Li et al., 2012; Liu et al., 2018). In winter, under the northeast monsoon, the coastal current dominates, and water flows southward. In summer, it reverses northward under the southwest monsoon and the TWC. During the late spring–early summer monsoon transition, coastal circulation enters a critical south-to-north shift, often exhibiting locally complex and unstable flow (Johnston et al., 2011; Zeng et al., 2012; Liu et al., 2015). Shenhu Bay (SHB) and Weitou Bay (WTB), two adjacent bays in central Fujian, are both influenced by tides and the coastal current. WTB is characterized by a regular semidiurnal tide with a large tidal range (average 4.2 m), where tidal currents exhibit a reciprocating pattern within the bay. SHB also experiences a regular semidiurnal tide with an average tidal range of nearly 4 m and represents a generally circular and open coastal embayment. Despite their proximity, they differ morphologically (Lin et al., 2013; Zhu et al., 2016), and the sedimentary dynamical differences and potential connectivity between them remains poorly understood.
In this study, we focus on SHB and WTB, using continuous in-situ observations from the late-spring high tide of 2020, combined with satellite imagery and background circulation data. We systematically analyzed the flow structure inside and outside the bays, suspended sediment dynamics and their net transport flux. This approach aims to reveal the dynamic differences of suspended sediment between adjacent bays and off-bay areas during the late-spring high-tide period.
2 Data and methods
2.1 Data
2.1.1 Field observation
The observation period was from May 24 to May 27, 2020, during the late-spring high tide, when winds were relatively weak (Figures 1b, c). Eight continuous observation stations (L335~L342, Figure 1a) were set to measure current velocity and suspended sediment concentration (SSC) for 25 hours with interval of 1 hour. Vertical profiles of current velocity magnitude and direction were recorded by the ADCP (Acoustic Doppler Current Profiler, 300k, RDI, USA). At each station, water samples were collected by the water sampler at surface, middle and bottom layer during each hour to measure SSC (every one hour) and their grain size (every three hours). Surface sediments of eight stations were collected during survey using grab sampler. The uppermost 1–2 cm of sediment was collected in a sample bag with a wooden spoon, and it was then sealed and stored for laboratory analysis.
Figure 1
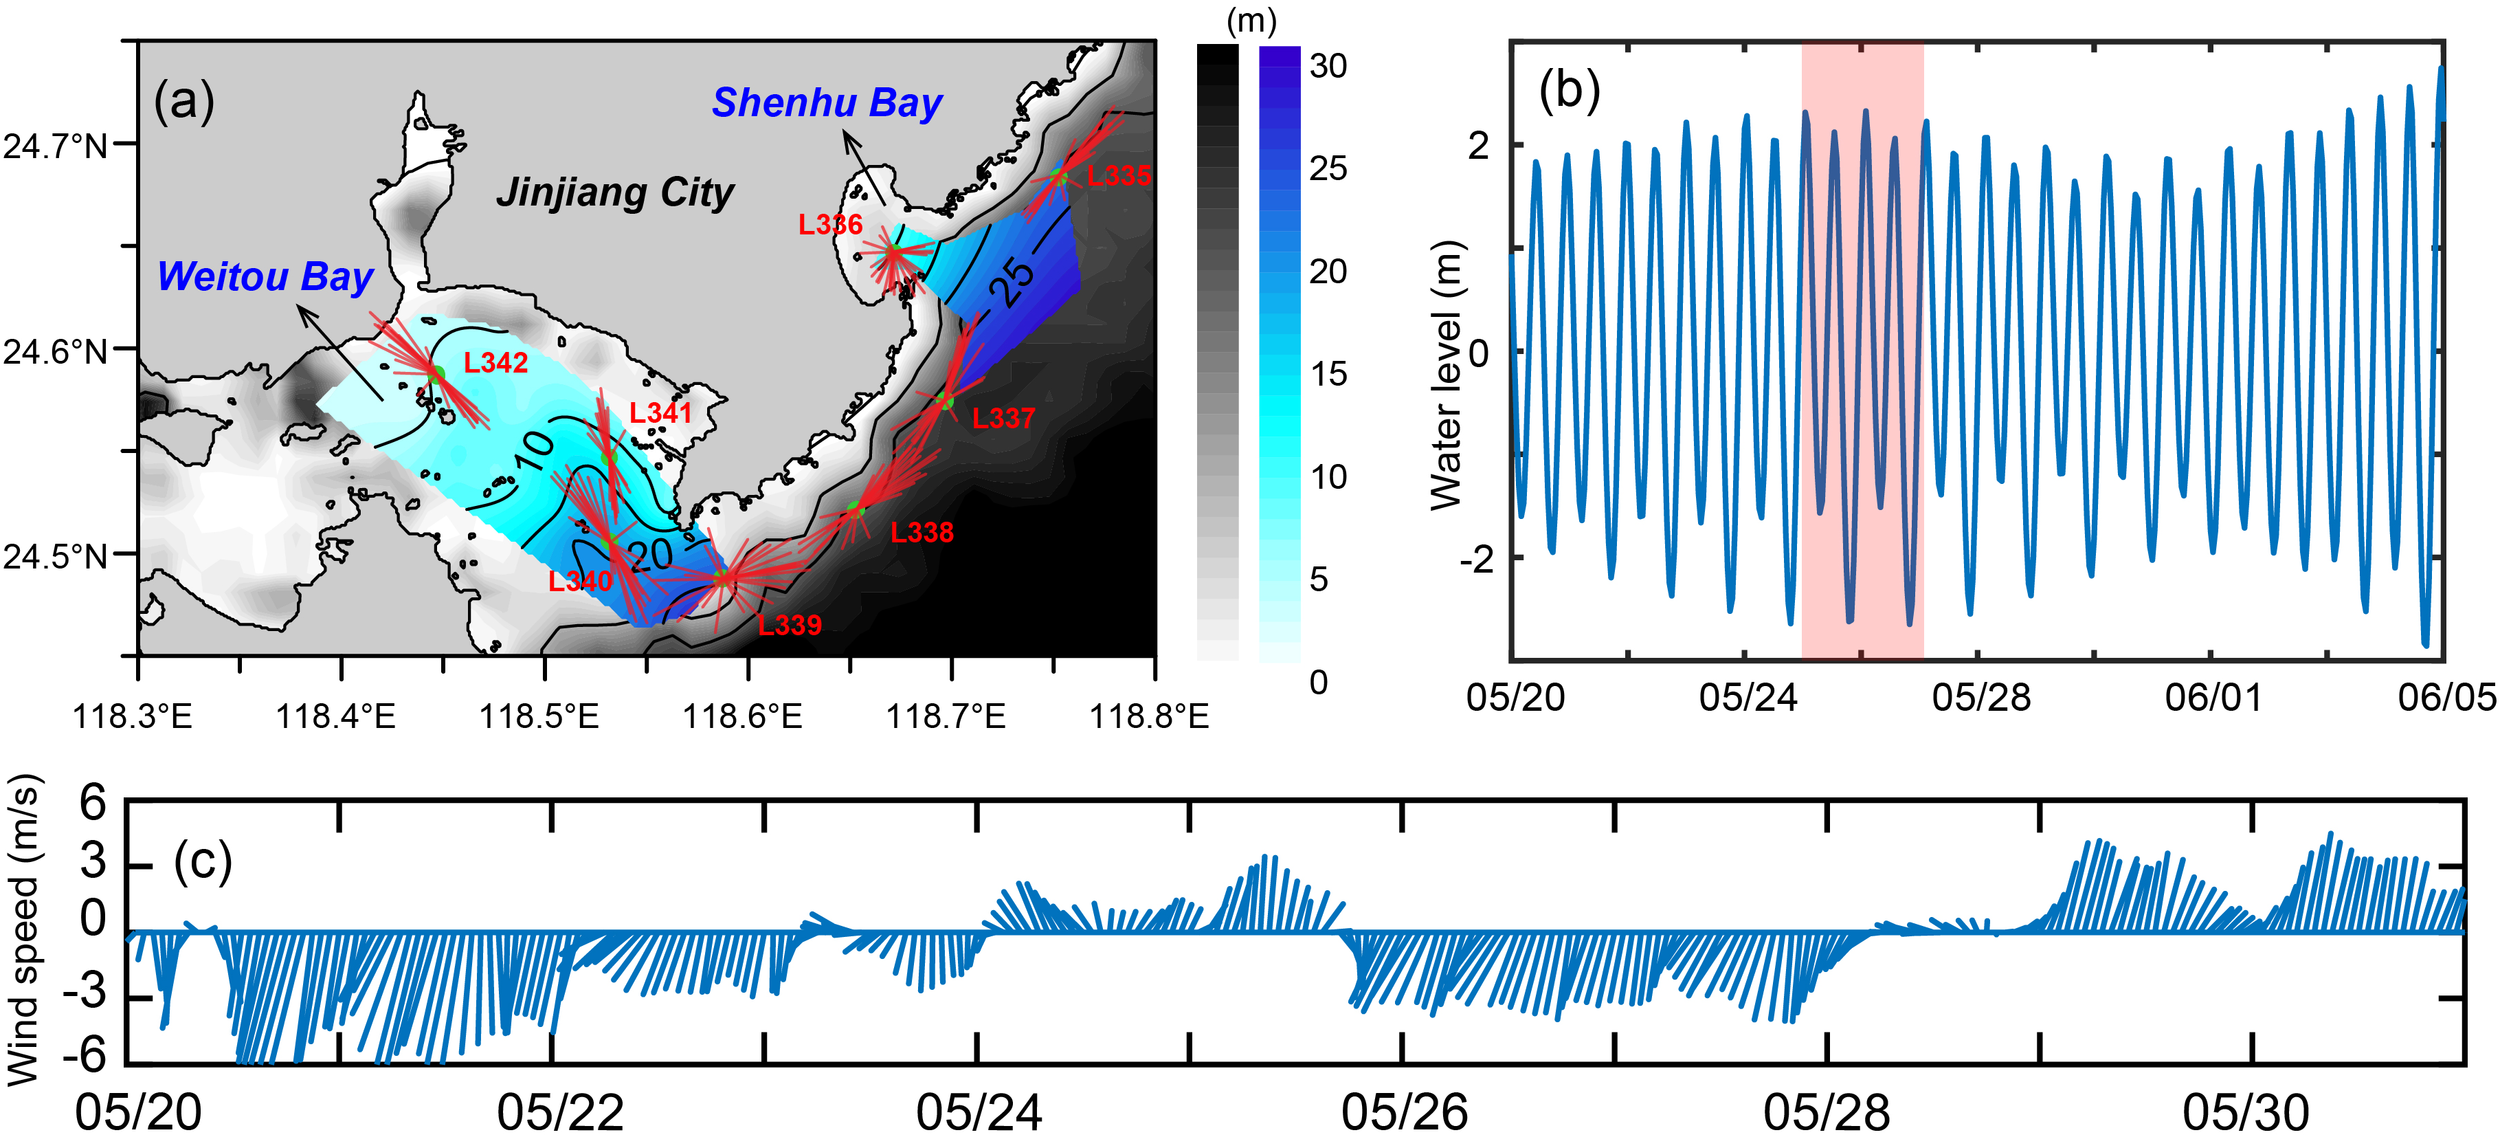
(a) Bathymetry and sampling stations. Black-and-white shading represents GEBCO bathymetry, and blue indicates measured water depths. Depth-averaged velocity vectors over 25 hours at each station are indicated as red lines. (b) Tide level and (c) wind field during the observation period.
2.1.2 Other data sources
This GOCI L2 satellite images used in this study were obtained from the Korea Meteorological Administration Satellite Data Portal (https://www.weather.go.kr/goci), with a spatial resolution of 500 m. The dataset directly provides retrieved suspended sediment concentration and was employed to analyze the characteristics of coastal suspended matter transport. Geostrophic current with a horizontal resolution of 0.25° were provided by CMEMS (Copernicus Marine service, http://marine.copernicus.eu). The wind field data were obtained from the NCEP Climate Forecast System Version 2 (CFSv2) Selected Hourly Time-Series Products, with a spatial resolution of 0.2° from https://rda.ucar.edu/datasets/ds094.1/. Regional bathymetry and topography were acquired from the General Bathymetric Chart of the Oceans (GEBCO_2024 grid).
2.2 Methods
2.2.1 Depth-averaged flow velocities and residual current calculation
The east () and north (v) components of the measured velocity (cm/s) were calculated as follows (Equations 1, 2):
in which is the direction of . A weighting method was used to calculate the depth-averaged flow velocity of each station at different times (Equations 3, 4):
where and are east and north components of flow velocity in different layers. The depth-averaged flow velocity (cm/s) was calculated as follows (Equations 5, 6):
in which is the direction of . The depth-averaged residual current velocity () over a period of 25 hours was calculated as follow (Equations 7, 8):
in which is the east (north) components of flow velocity in ith hour at jth layer. The direction of was calculated referring to Equation 6.
2.2.2 Net suspended sediment flux calculation
The net suspended sediment flux (SSF, mg/m/s) of unit area averaged over a period of 25 hours was calculated as follows (Equations 9, 10):
in which is suspended sediment concentration; is the thickness of water in ith hour at jth layer. The direction of was calculated referring to Equation 6.
2.2.3 Decomposition of suspended sediment flux
The instantaneous SSF was decomposed with respect to relative water depth. The tidally averaged, unit-width net SSF (D) over one tidal cycle (T) is calculated as follows (Equation 11; Zhao et al., 2013):
where and are the depth-averaged value and the tidal variation of water depth, respectively. Similarly, , and , represent the depth-averaged and tidal-varying components of velocity and SSC. and denote the deviations of each layer from their depth-averaged values. D1 represents SSF by tidal-mean currents (Eulerian residual transport). D2 is the correlation between tidal fluctuations and tidal currents (Stokes drift transport). D1 + D2 constitutes the advective transport, reflecting the Lagrangian residual transport. D3 denotes the correlation between tidal currents and tidal variations of depth-averaged SSC. D4 represents the correlation between water depth and tidal variations of depth-averaged SSC. D5 corresponds to the correlation among water depth, depth-averaged SSC, and tidal currents. Since D3, D4, and D5 all involve the tidal variation term ct, their sum (D3 + D4 + D5) is referred to as the “tidal pumping” transport component. D6 + D7 is referred to the vertical shear transport term, reflecting the contribution of vertical residual circulation to sediment transport.
2.2.4 Laboratory sample analyses
The grain-size of the suspended particles was measured with a laser particle sizer (Mastersizer 2000, Malvern Instruments, Ltd., UK) using water samples. Sedimentary grain-size measurement was done using a combination of laser analysis and traditional sieving methods: 0.5 g fresh sediment was weighed and placed in a beaker, 5 mL H2O2 was added to remove organic matter, 5 mL of dilute hydrochloric acid was added to remove shell debris after full reaction, then 5 mL of sodium hexametaphosphate dispersant was added after acid washing, and lastly the samples were fully dispersed and tested using a laser particle sizer.
2.2.5 Calculation of bed shear stress
The calculation equations of bed shear stress () are as follows (Equations 12, 13; van Rijn, 1993; Soulsby and Davies, 1995):
where is water density (here is 1.025 kg/m3), is the drag coefficient (applicable to depth-averaged current), is bed roughness length, is the median grain-size of bed sediment, and is the water depth.
The critical shear stress of sediment also needs to be estimated. Given the viscosity between sediment particles, we calculated the critical shear stress (, N/m2) of sediments as follows (Equation 14; van Rijn, 2007):
where the critical shear stress of non-cohesive sediments , the critical shields parameter , the dimensionless particle size , and the gelling volume concentration of sediments ; s is the ratio of densities of sediment and water; v is the kinematic viscosity of water (m2/s); α is the empirical coefficient (α =1 herein); is the maximum volume concentration of sandy sediments; g is the acceleration of gravity (m/s2); γ is the experience coefficient (generally 1.5), = 62.5 μm; is the sediment grain size; is the percentage of clay components; and ρ and ρs are the water and sediment particle density (kg/m3), respectively.
3 Results
3.1 Observed current velocity and SSC characteristics
During the observation period, the tidal range in the study area was nearly 4 m, characterized as an irregular semidiurnal tide, with two flood and two ebb phases occurring within 25 hours (Figures 2, 3). Except for station L336, flood currents at all stations were stronger than ebb currents, with longer flood durations, and were generally dominated by reciprocating flows (Figure 1a). At station L336 inside SHB, a pronounced tidal asymmetry was observed: currents were mainly directed seaward, with relatively weak flow. The maximum depth-averaged velocity reached ~0.30 m/s at 143°, occurring during the ebb tide. In WTB and at its mouth (stations L340, L341, L342), currents were aligned along the northwest–southeast direction, with maximum depth-averaged velocities of 0.68, 0.49, and 0.67 m/s, respectively. Outside the bays (stations L335, L337, L338, L339), currents followed a northeast–southwest orientation, i.e., along the coastline, with maximum depth-averaged velocities of 0.66, 0.61, 0.77, and 0.64 m/s (Table 1).
Figure 2
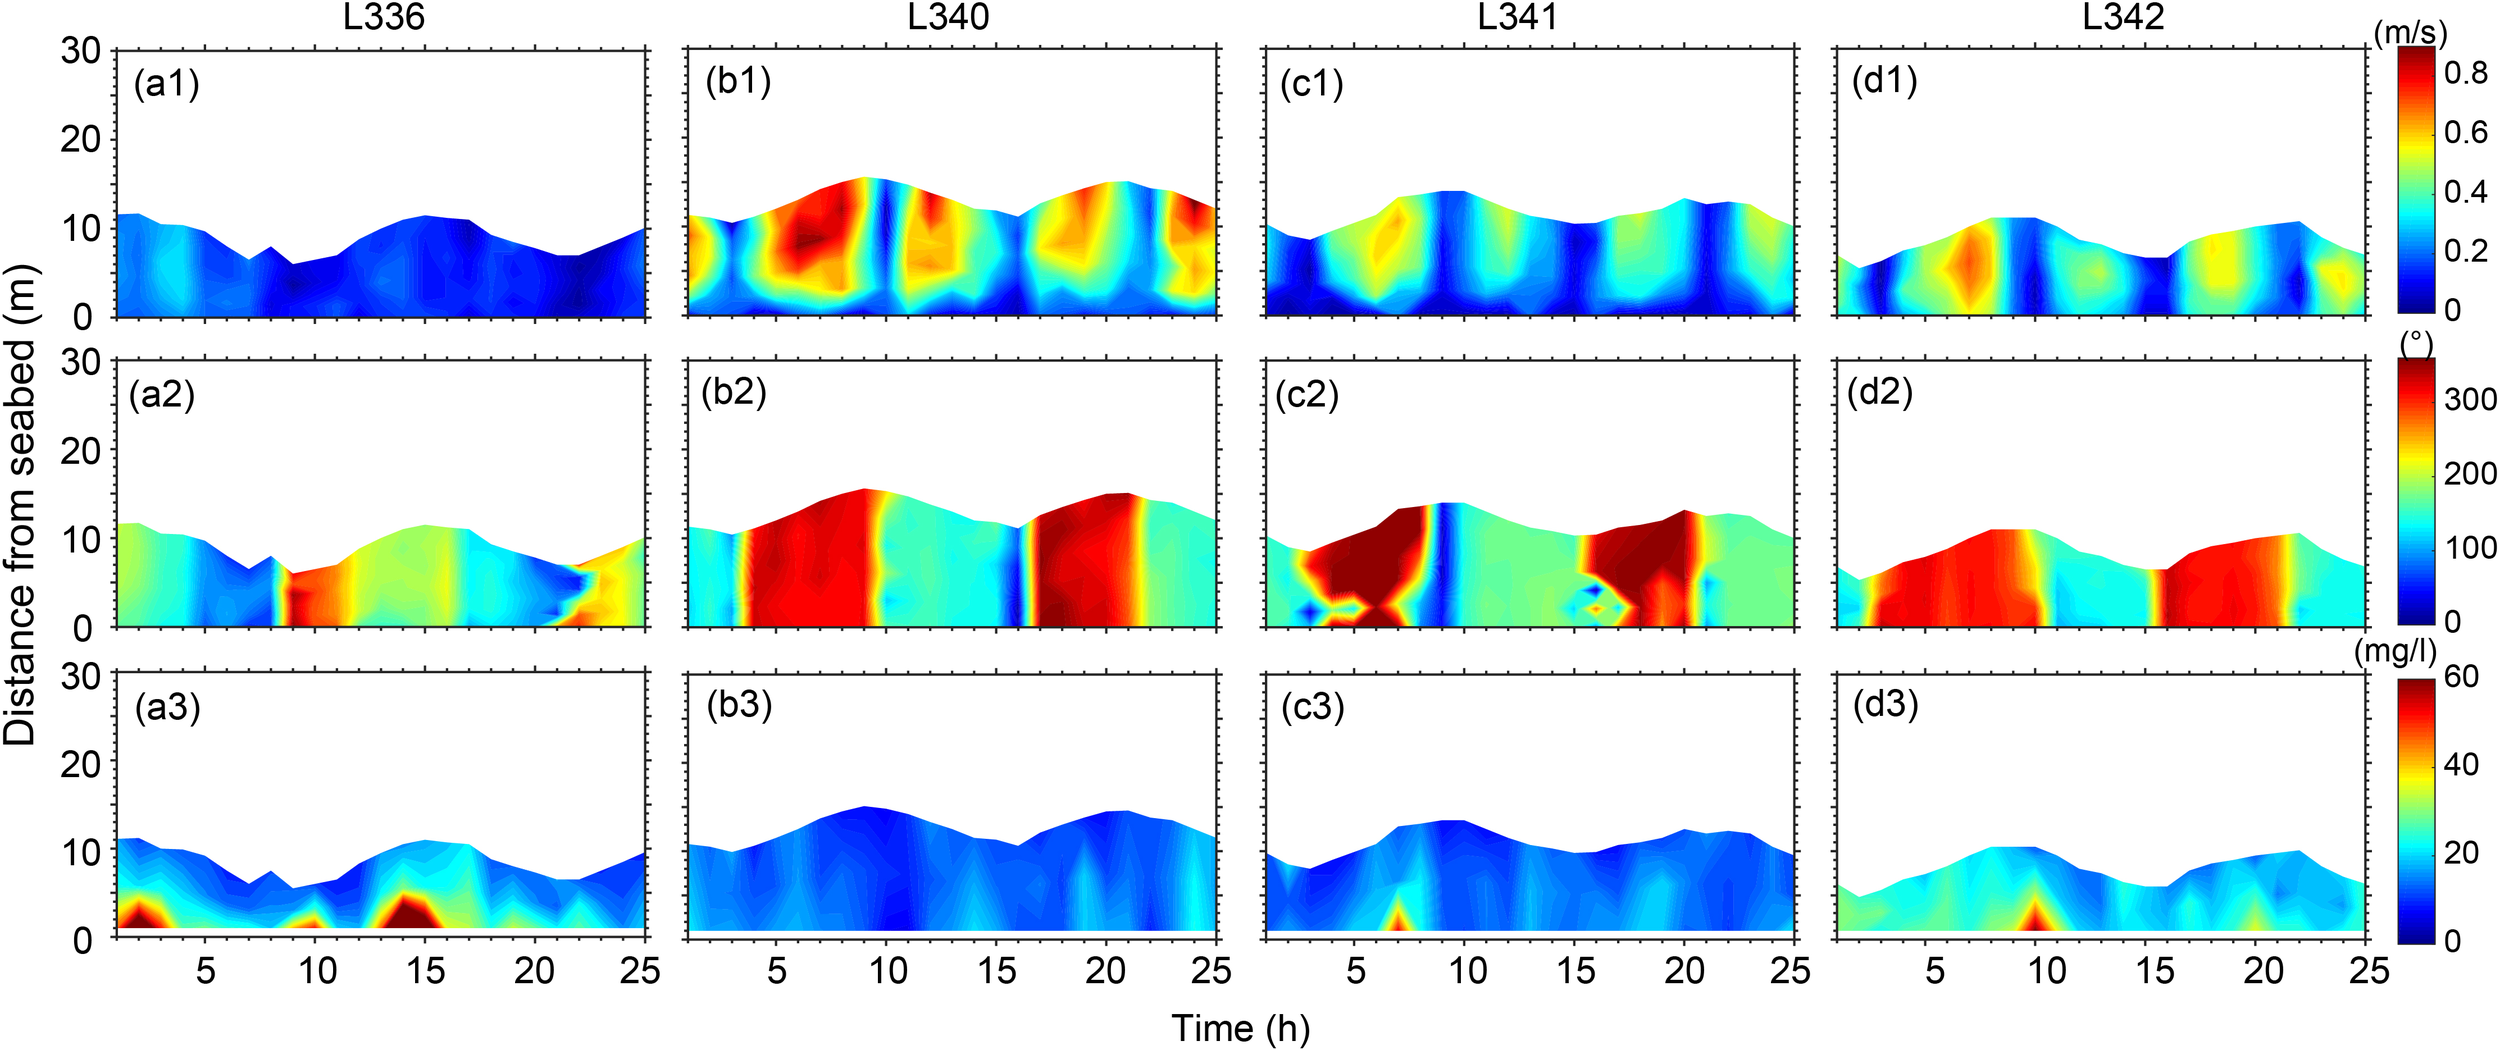
Panels showing (a1–d1) current velocity, (a2–d2) current direction, and (a3–d3) SSC at station L336 inside SHB and stations L340, L341, and L342 inside and at the mouth of WTB.
Figure 3
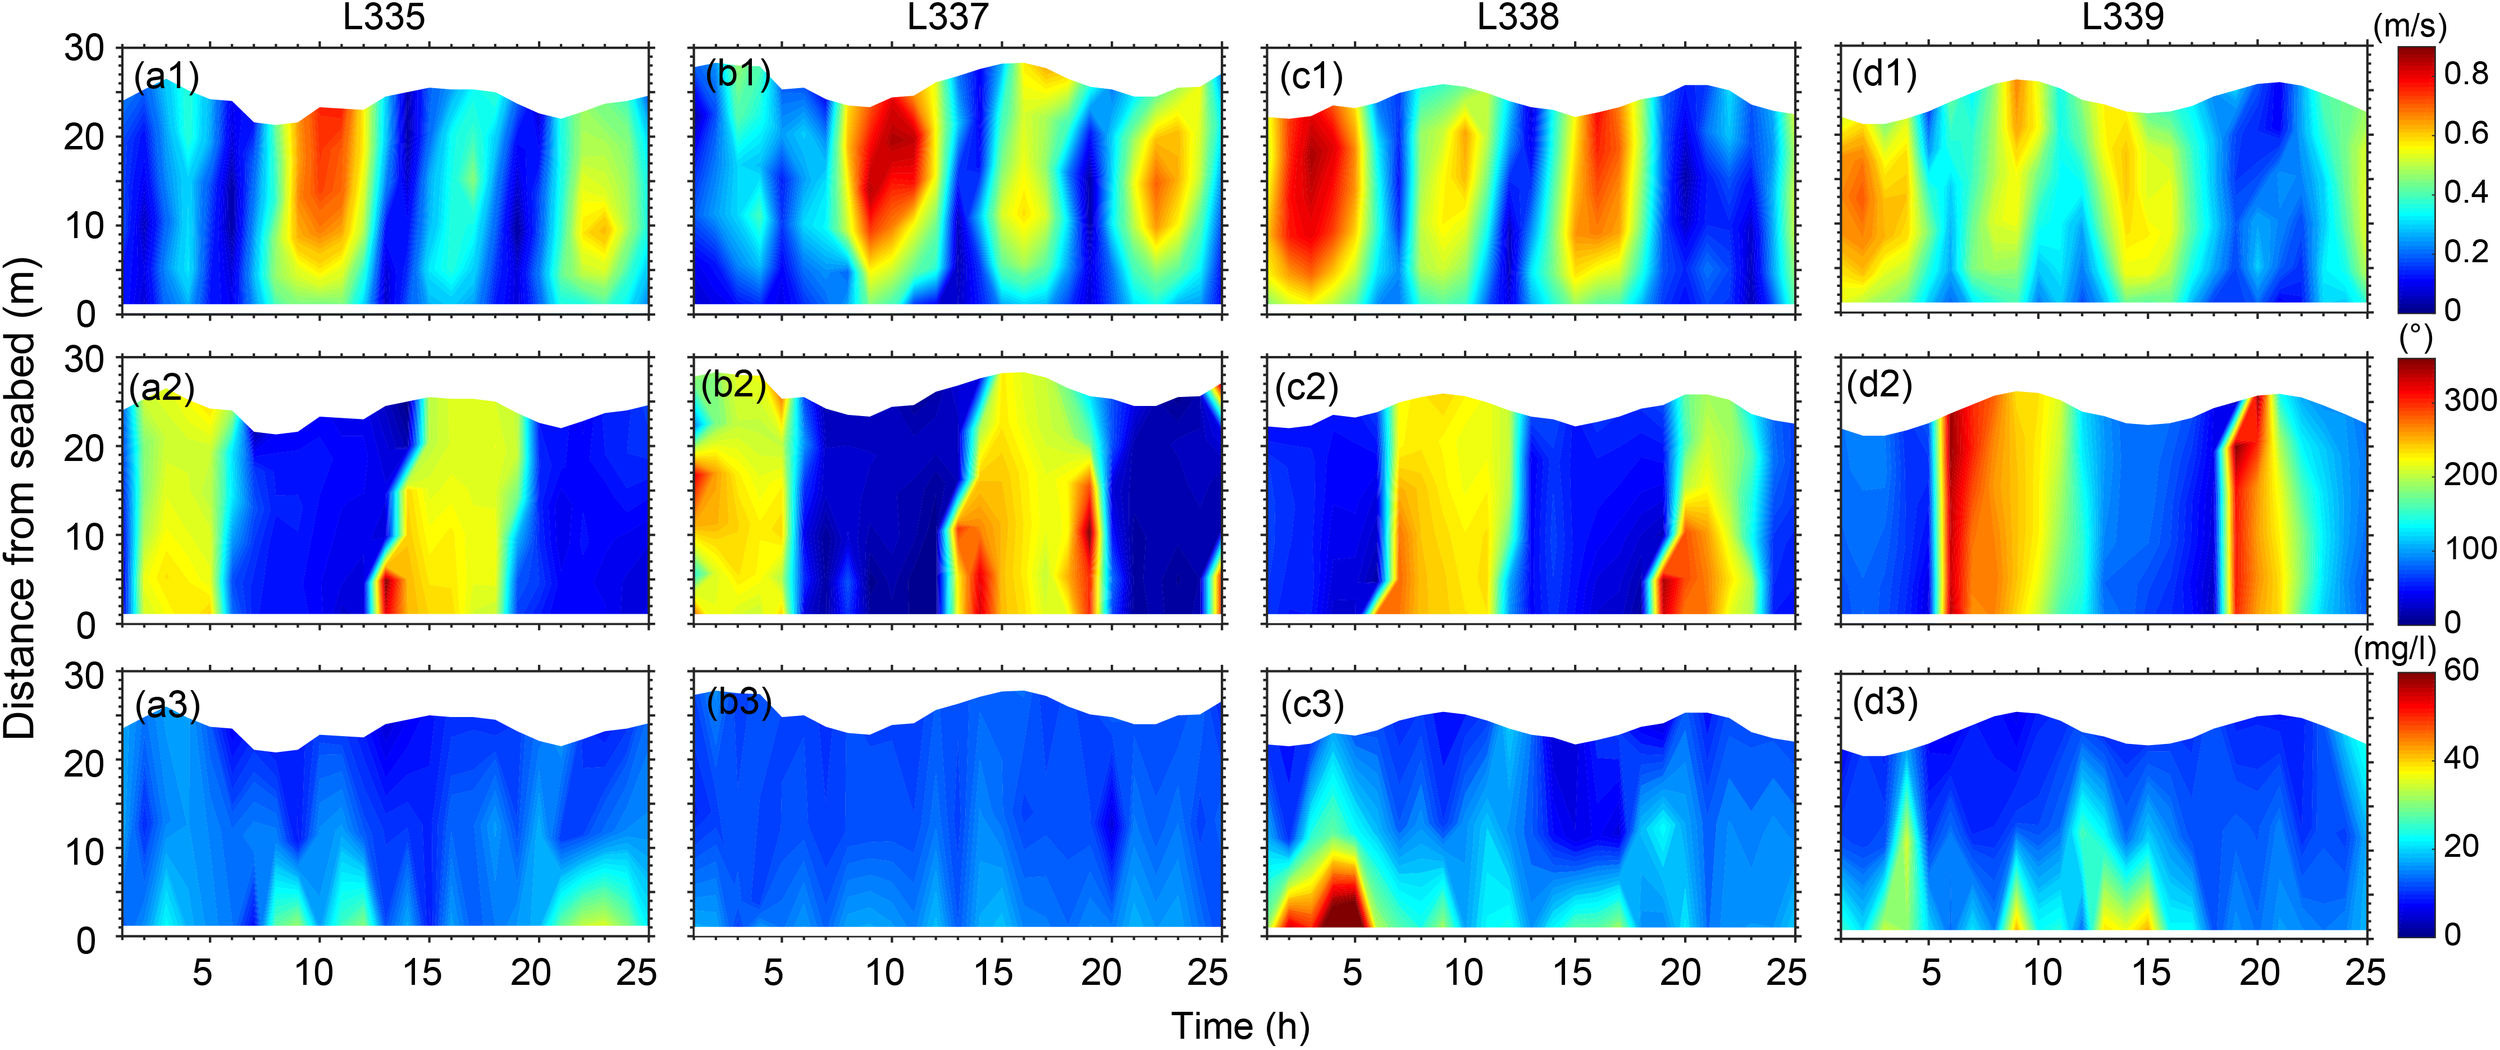
Panels showing (a1–d1) current velocity, (a2–d2) current direction, and (a3–d3) SSC at offshore stations L335, L337, L338, and L339.
Table 1
| Stations | Depth-averaged Max. velocity (m/s) | Max. SSC (mg/l) | Residual current (m/s) | Depth-averaged net SSF (mg/m2/s) | Net SSF (g/m/s) |
|---|---|---|---|---|---|
| L335 | 0.66 | 35.3 | 0.14 | 2278 | 54.75 |
| L336 | 0.3 | 106 | 0.09 | 2882 | 20.68 |
| L337 | 0.61 | 18.7 | 0.13 | 1537 | 40.18 |
| L338 | 0.7 | 74.6 | 0.13 | 3882 | 91.91 |
| L339 | 0.64 | 41.9 | 0.1 | 3227 | 76.21 |
| L340 | 0.68 | 26 | 0.04 | 535 | 5.66 |
| L341 | 0.49 | 54 | 0.02 | 153 | 1.69 |
| L342 | 0.67 | 61 | 0.07 | 128 | 10.63 |
The statistics of velocity, SSC, residual current and SSF.
The SSC ranged from 5 to 106 mg/L. At station L336 inside SHB, SSC rose during both flood and ebb, peaking during flood tide with a near-bottom maximum of ~106 mg/L, not coinciding with peak velocity (Figure 2a3). In WTB and its mouth (L340–L342), SSC was lower (26–61 mg/L), with modest tidal fluctuations mainly at peak flood and ebb, generally matching current maxima (Figures 2b2–d3). Offshore stations (L335, L337–L339) showed more complex patterns with time lags. L338 recorded the highest SSC (~75 mg/L), while nearby L337 remained much lower. Overall, SSC broadly followed current variations but with differing amplitudes across sites (Figures 4a1–h1).
Figure 4
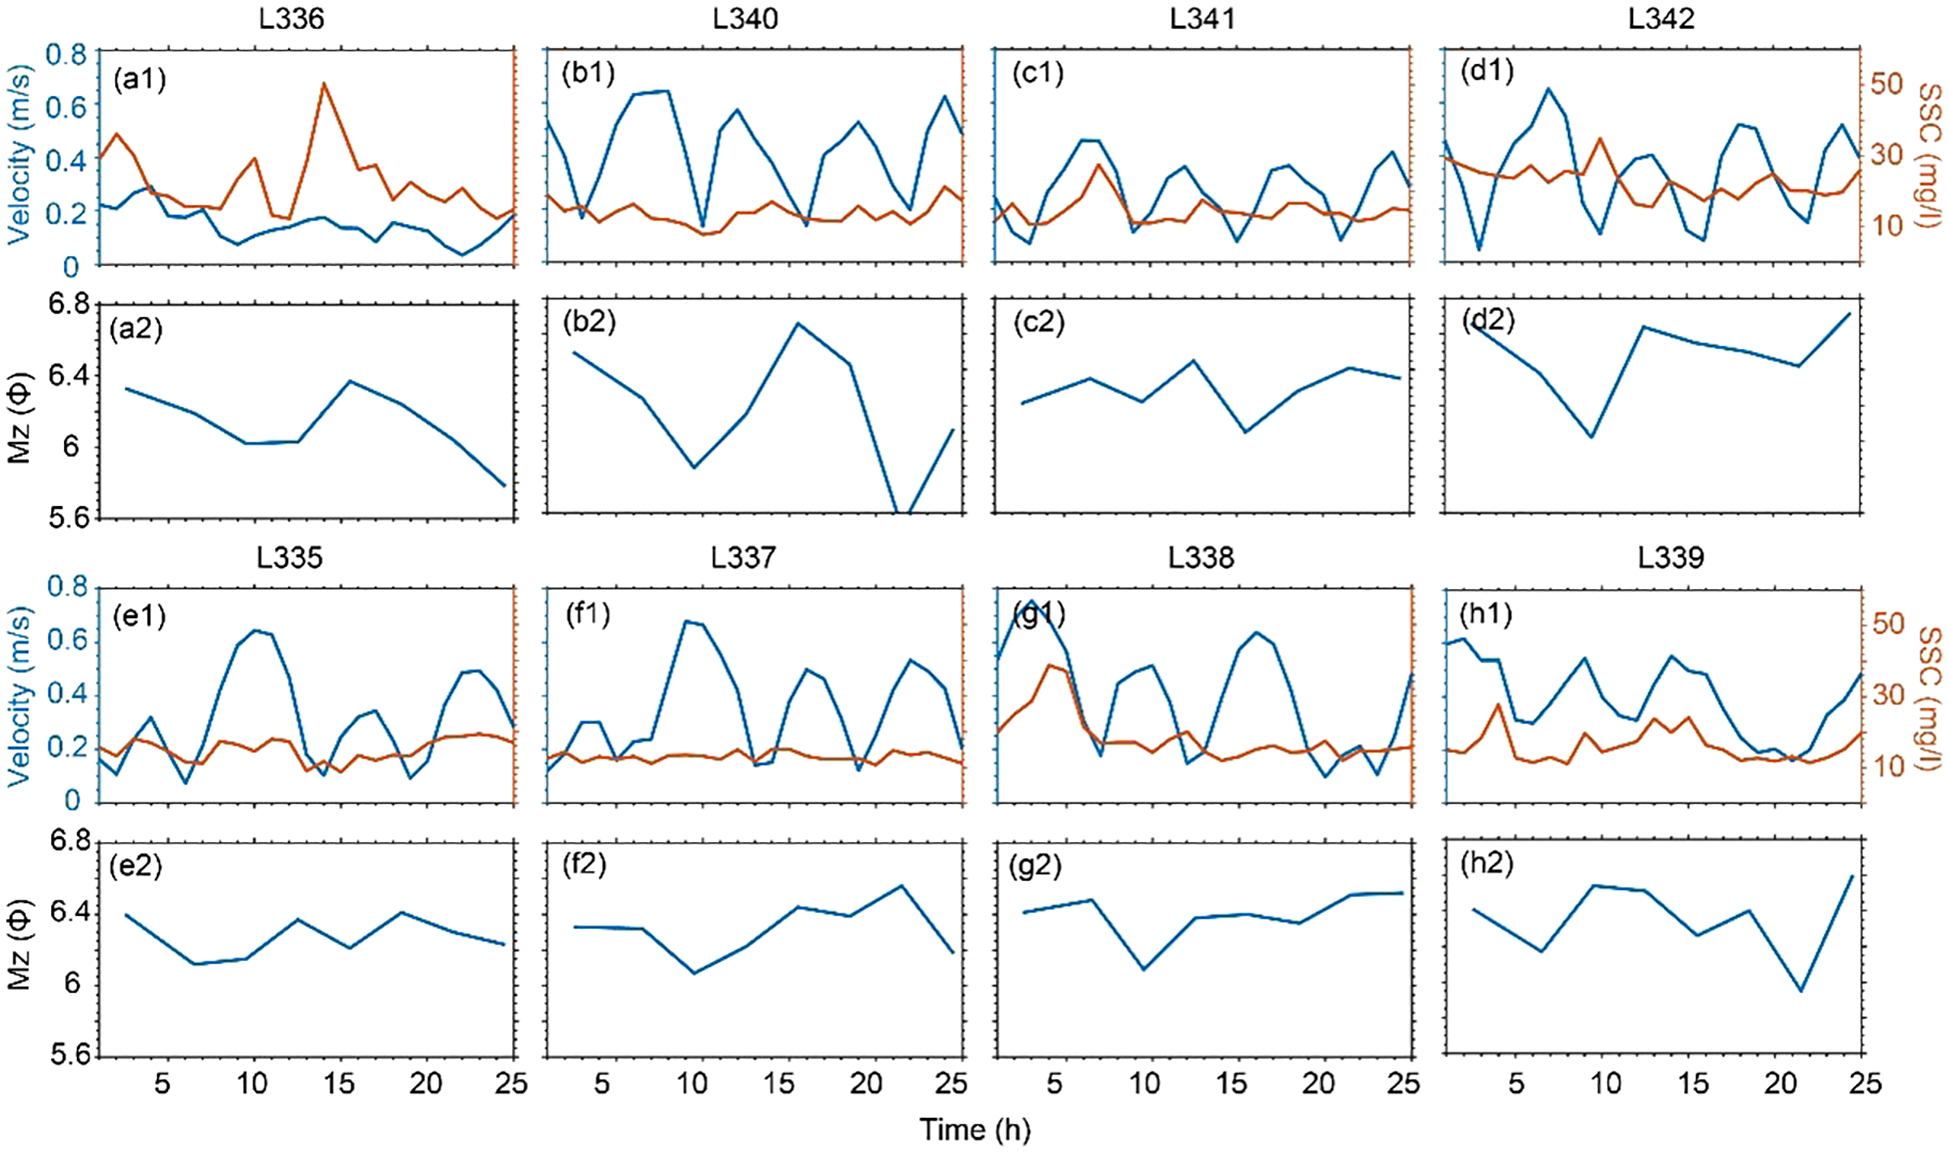
Depth-averaged current velocity and SSC (a1–h1) and sediment grain size (a2–h2) at station L336 inside SHB, stations L340, L341, and L342 inside and at the mouth of WTB, and offshore stations L335, L337, L338, and L339.
3.2 Residual current and net SSF
Depth-averaged residual currents at L336 inside SHB was directed seaward at ~0.09 m/s (Figure 5a). Residual currents in WTB and at its mouth (L340–L342) were weak (0.02–0.07 m/s), primarily westward. Offshore stations (L335, L337–L339) exhibited stronger residual currents (0.10–0.14 m/s), generally flowing northeastward along the coastline. At SHB and the four offshore stations, surface and bottom residual current directions were generally similar, except at L338, where slight deviations between the two layers were observed. Within WTB, surface and bottom residual currents at L342 were similar, whereas at L340 and L341, surface and bottom residual currents were oriented oppositely.
Figure 5
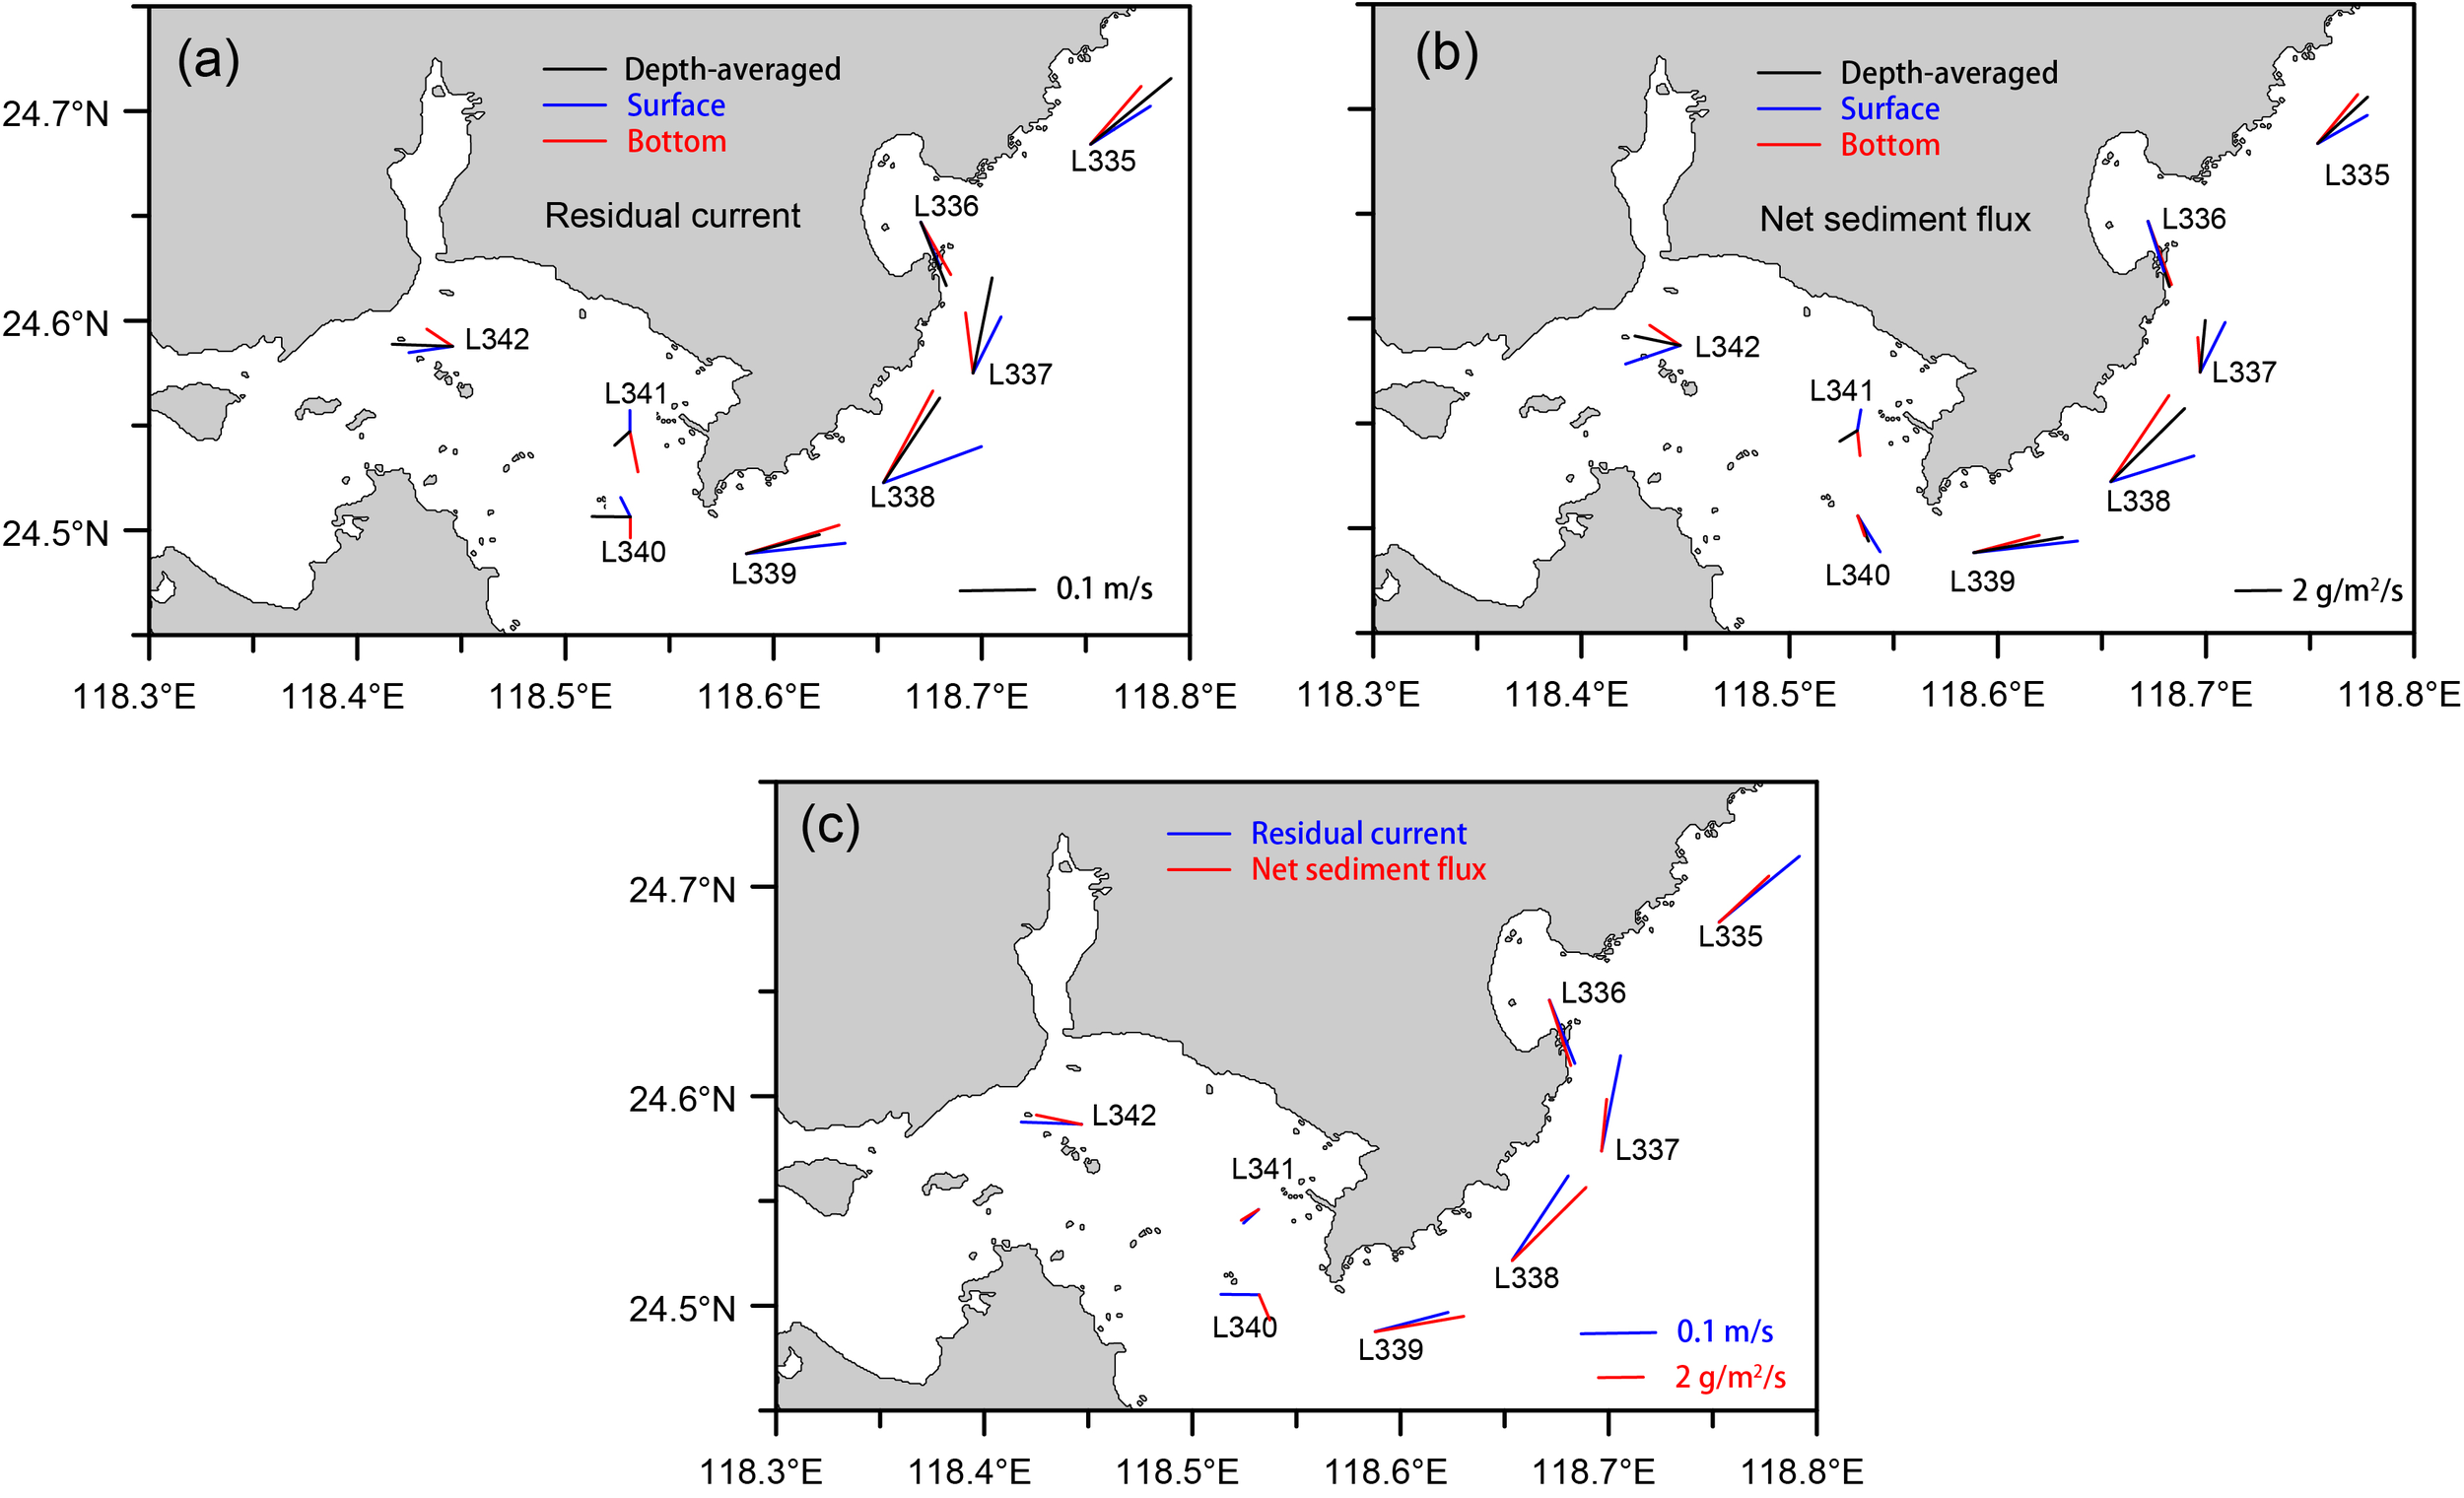
(a) Surface, bottom, and depth-averaged residual currents at SHB, WTB, and offshore stations; (b) surface, bottom, and depth-averaged net SSF at the same stations; (c) comparison of depth-averaged residual currents and net SSF.
Depth-averaged net SSF at L336 in SHB was directed seaward at 2278 mg/m²/s (Figure 5b). In WTB, depth-averaged net SSFs directions at L341 and L342 closely align with the residual currents, whereas at L340, they differ, with sediment transported seaward. The fluxes at these stations are relatively low (435, 153, 128 mg/m²/s). Offshore stations (L335, L337–L339) showed depth-averaged net SSFs generally aligned with residual currents, northeastward along the coast (2278, 1537, 3882, 3227 mg/m²/s). The directional difference at L338 was slightly larger (~10°), which is mainly related to the combined effects of tidal asymmetry, sediment grain size distribution, and local topography. Surface and bottom fluxes generally followed residual current patterns, consistent with depth-averaged fluxes in SHB and offshore, except at L338. Within WTB, surface and bottom residual currents at L342 and L340 were similar, while L341 flowed oppositely.
The depth-averaged net SSF generally followed residual current directions, except at L340, where they point to the inner and outer bay (Figure 5c). The total net SSF exhibited a strong sediment transport in the offshore stations (L335, L337–L339), and the SSF in SHB was higher than that in WTB. (Table 2). At L340, SSF and residual currents indicate material export to the open sea. Decomposition of net SSF into advective, tidal-pumping, and vertical residual circulation components shows advective transport dominates, with D1 (Eulerian residual transport) as the primary contributor (Table 2).
Table 2
| Stations | D1 | D1+D2 | D3+D4+D5 | D6+D7 |
|---|---|---|---|---|
| L335 | 109.10 | 109.60 | 6.12 | -5.01 |
| L336 | 30.85 | 32.27 | 1.69 | 0.13 |
| L337 | 111.16 | 111.17 | 1.33 | -4.27 |
| L338 | 170.85 | 168.51 | 12.70 | -12.69 |
| L339 | 145.13 | 143.69 | 7.00 | -6.18 |
| L340 | 74.20 | 73.80 | 3.00 | 2.50 |
| L341 | 41.80 | 41.69 | 1.24 | -3.11 |
| L342 | 67.03 | 66.48 | -1.60 | -0.73 |
Decomposition of SSF (unit: mg/m/s).
3.3 Grain size and bed shear stress variations
Suspended sediment grain size varied during the observation period but did not strictly correspond with tidal current velocity due to low sampling frequency (three hours). Variations in suspended sediment grain size were larger inside the bays and smaller offshore (Figure 4), with mean φ between 5.6 and 6.8 and roughly overlapping distribution curves (Figure 6a). Surface sediment grain sizes differed: at SHB and offshore stations (L335–L339), surface and suspended sediments were similar, with the coarsest surface sediment at L339 near WTB (φ = 5.56). Inside WTB (L340–L342), surface sediments were medium to coarse sand (φ = 0–2.11), while suspended sediments were silt-dominated (φ = 6.13–6.49).
Figure 6
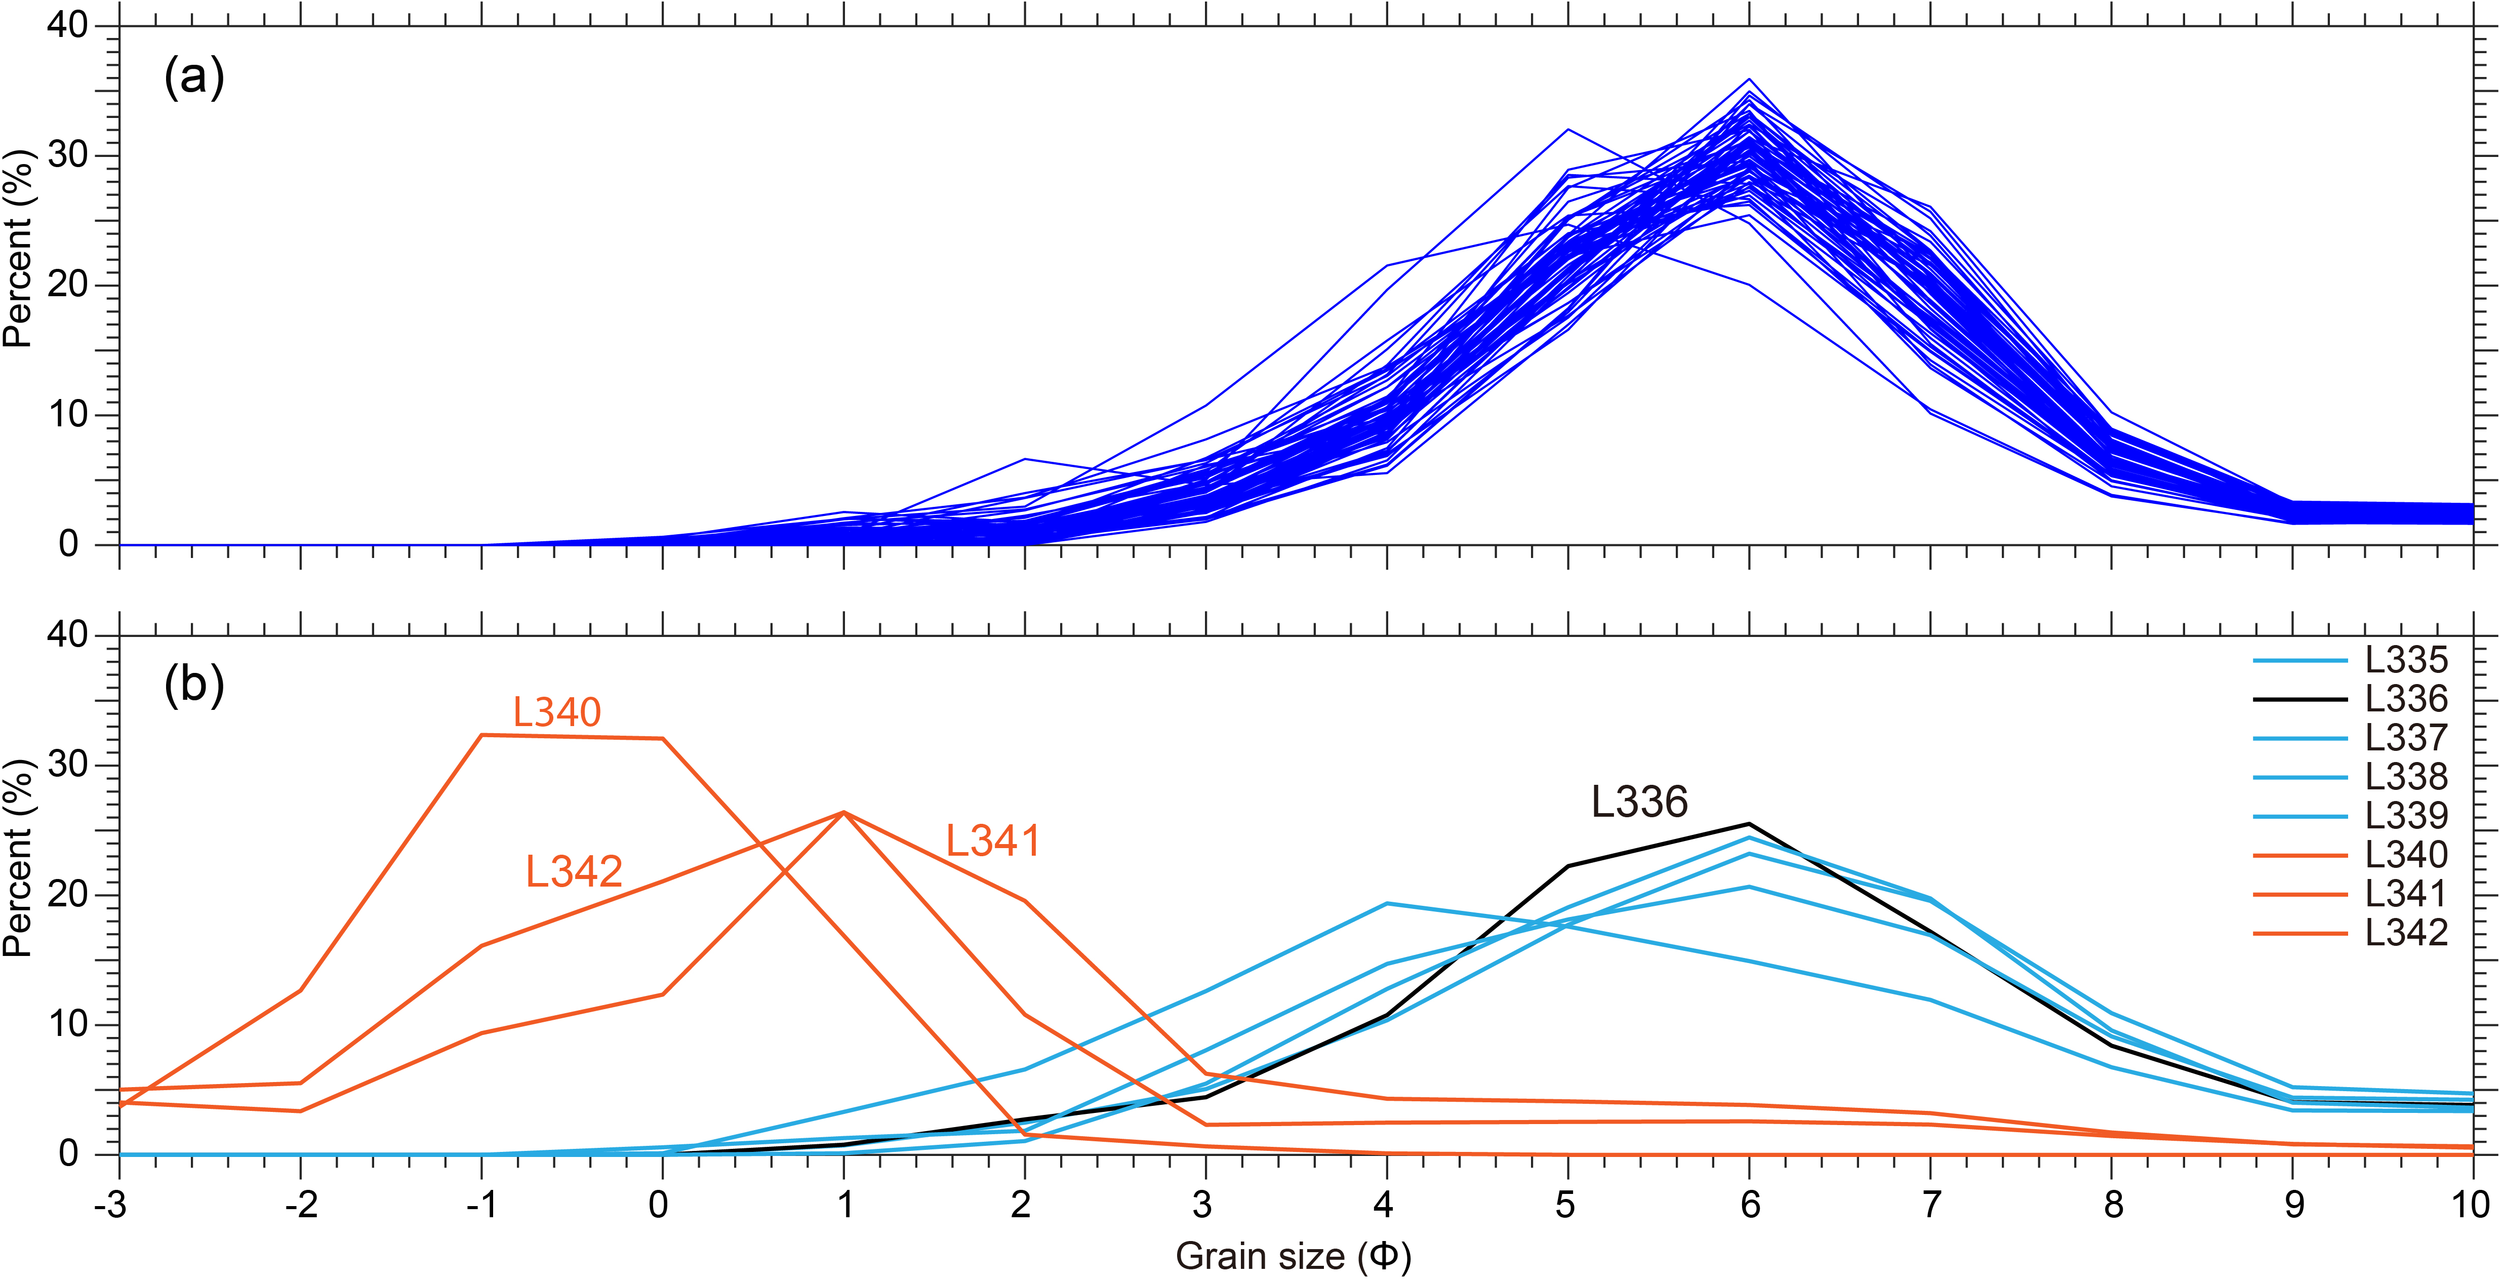
Grain size distribution curves of (a) suspended sediments and (b) surface seabed sediments at SHB, WTB, and offshore stations.
At L336 in SHB, bed shear stress exceeded the critical value about five hours earlier (Figure 7a), after which SSC increased, indicating local sediment resuspension. Later, bed shear stress stayed below the critical value, but elevated SSC persisted around hour 15 during flood tide, reflecting lateral sediment transport. In WTB (L340, L342), bed shear stress remained below the critical threshold, so only fine particles were resuspended, with SSC peaks corresponding to bed shear stress (Figures 2b2–c3, 7b, c). At L342, high SSC during low bed shear stress suggests combined resuspension and lateral transport. Offshore stations (L335, L337–L339) exceeded the critical bed shear stress, with SSC increases matching shear peaks, indicating resuspension dominance (Figures 3a3–d3, 7e–h).
Figure 7
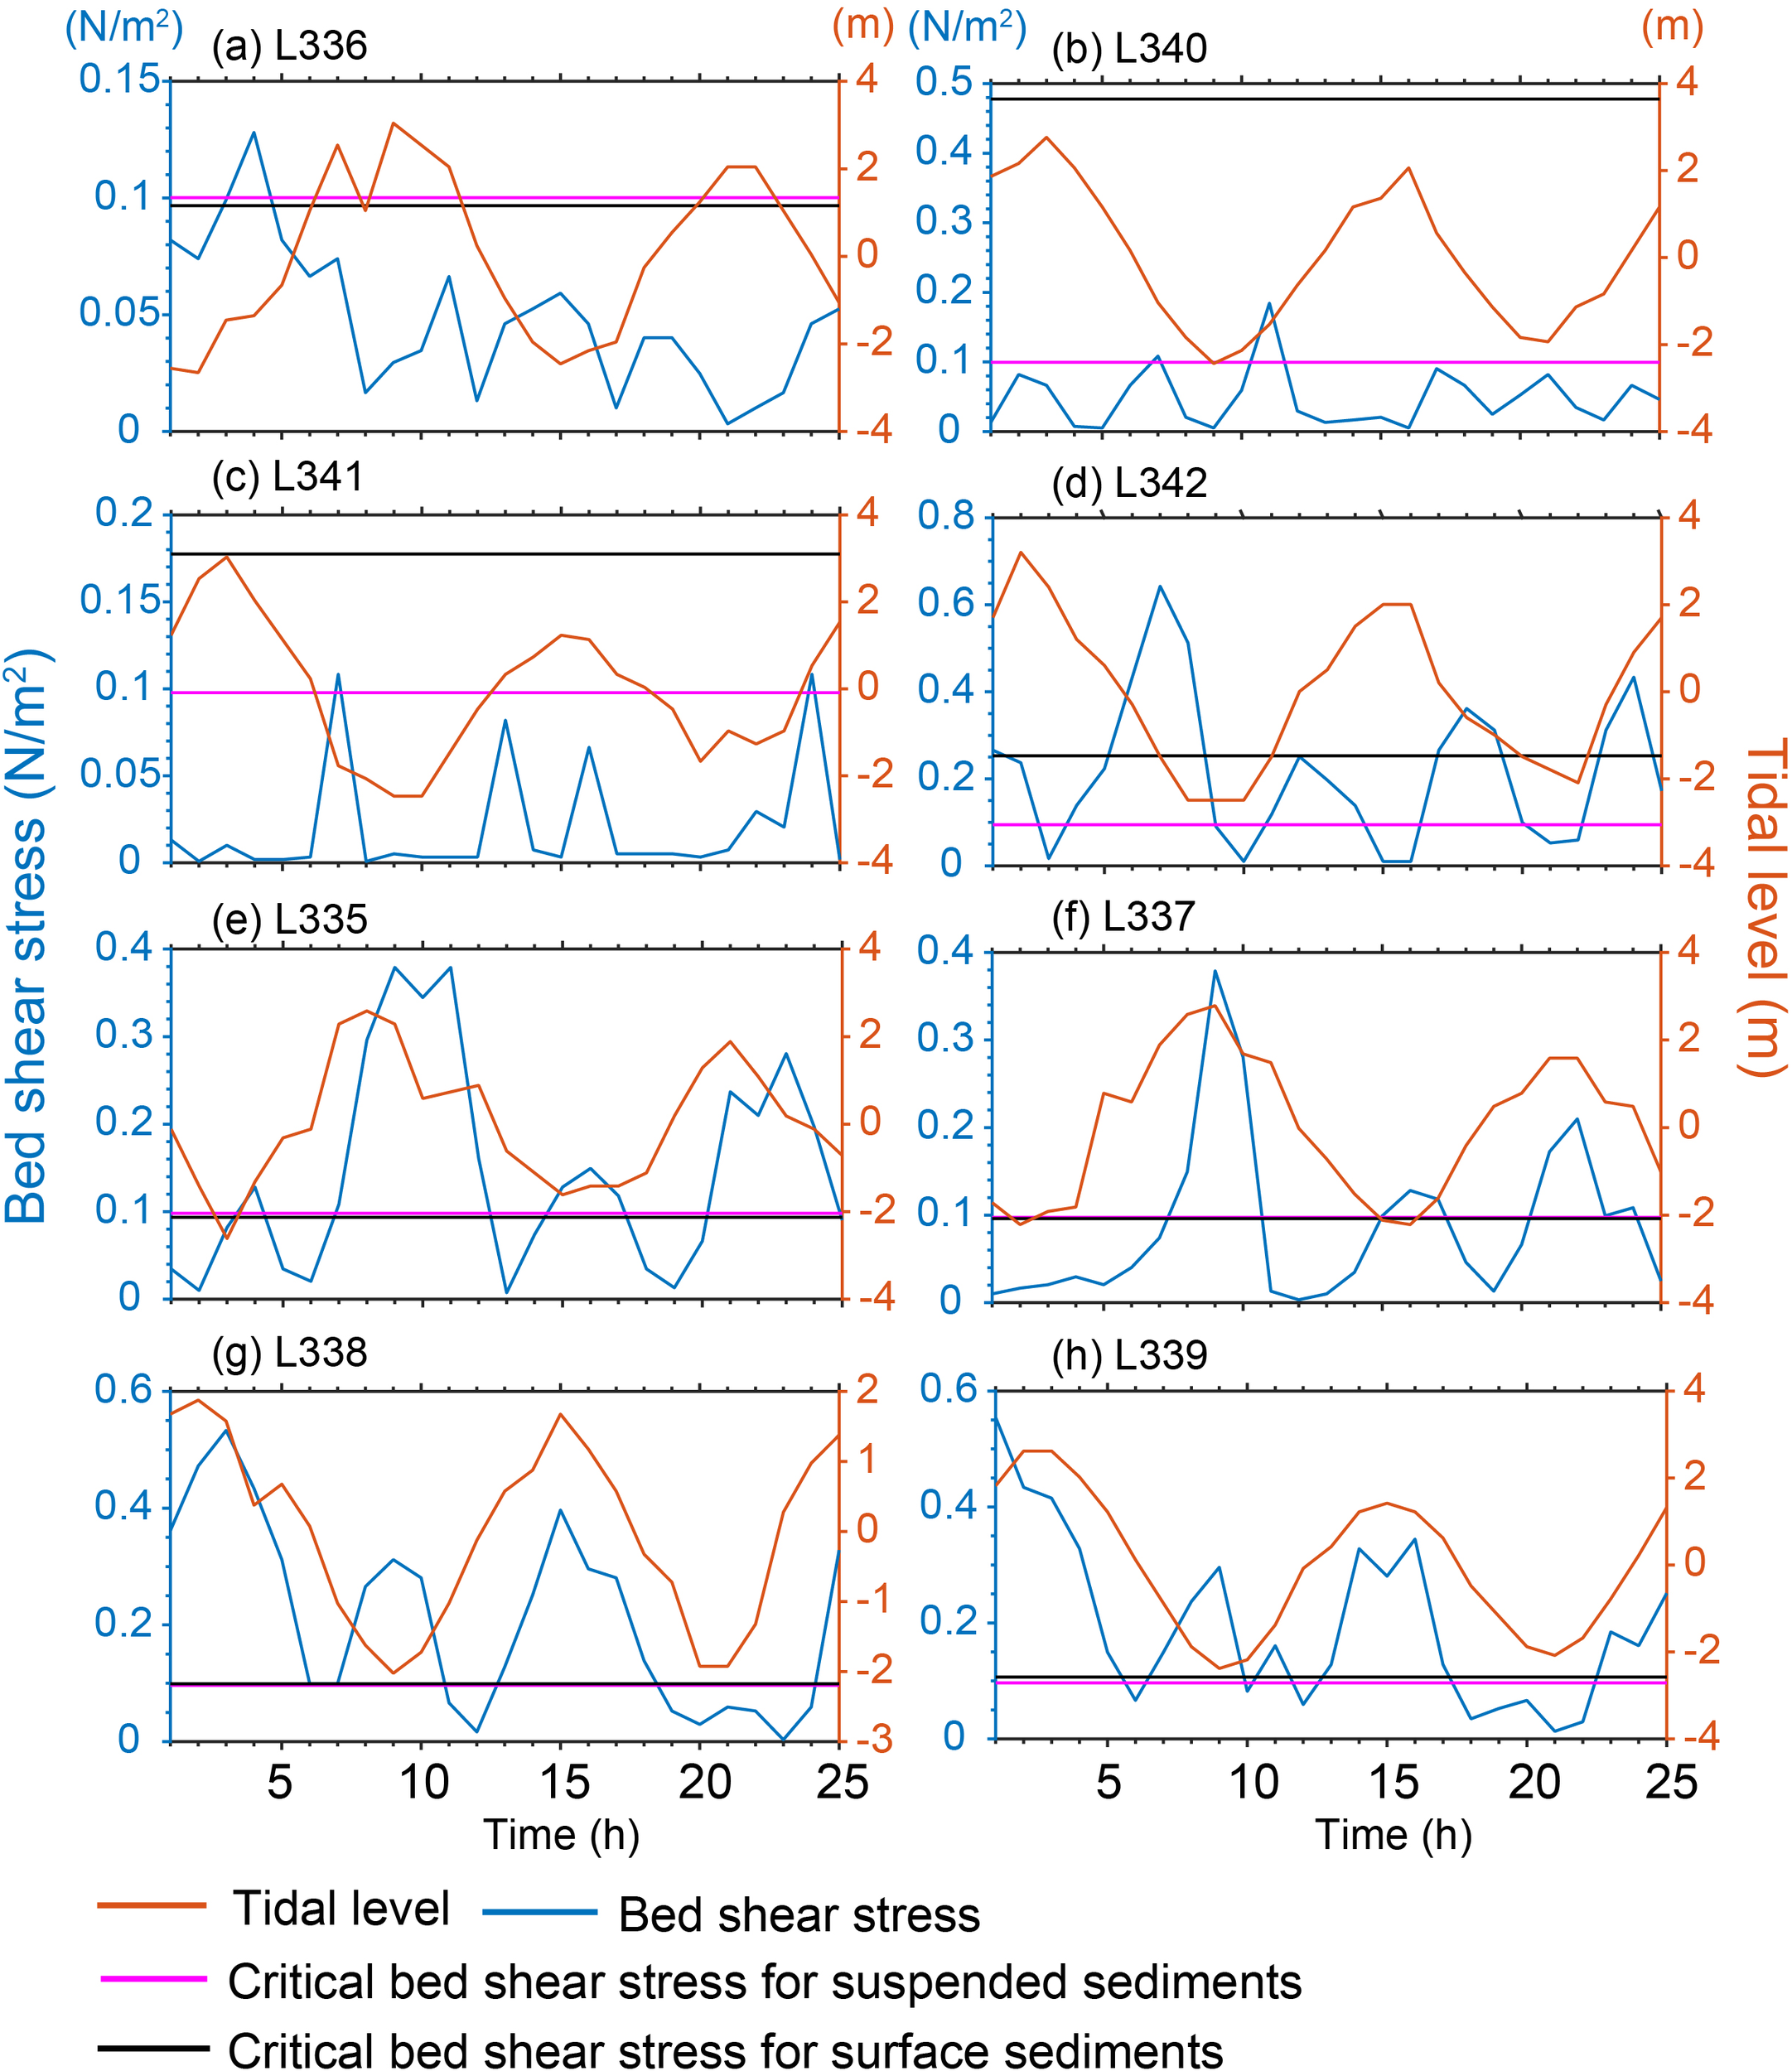
Variations in measured bed shear stress, the critical bed shear stress of suspended and surface sediments, and tidal level at SHB (L336 (a)), WTB (L340 (b), L341 (c) and L342 (d)), and offshore (L335 (e), L336 (f), L338 (g) and L339 (h)) stations during the observation period. Orange lines represent the tidal level, blue lines represent the bed shear stress, and the pink and black lines represent the critical bed shear stress for suspended and surface sediments, respectively. Time (h) is shown on the x-axis.
4 Discussion
4.1 Suspended sediment dynamics inside and outside the bays
Strong tidal asymmetry at L336, with flow mainly seaward, led to residual currents and net SSF toward the open sea (Figure 5). Such asymmetry affects both instantaneous transport and the direction of residual flux, a key mechanism controlling net SSF in tide-dominated systems (Zhou et al., 2025). At offshore stations, SSC lagged peak velocities (Figure 3), highlighting the phase difference between hydrodynamics and particle transport, likely influenced by resuspension thresholds, settling velocities, and flow duration (Poppeschi et al., 2024). At station L338, the maximum SSC reached 75 mg/L, which occurred only around 4–5 hours after the start of the observation. During this period, the SSC increased throughout the entire water column and subsequently decreased to below 40 mg/L, approaching the level observed at L337. This temporary increase at L338 may be attributed to the finer sediment at this site (Table 3) and the higher bed shear stress (Figure 7g), both of which favor sediment resuspension. Satellite imagery also shows higher nearshore concentrations around L338 (Figure 8). In addition, as this period corresponds to the ebb tide, nearshore high-concentration water masses may have been transported toward this station. The combined effects of these factors likely led to the significantly elevated SSC observed at L338 during that time. This elevated SSC consequently results in a slightly larger directional difference between the residual currents and depth-averaged net SSF at L338 compared to the adjacent stations (Figure 5c). At station L337, the correlation between SSC and current velocity is relatively weak. Although SSC exhibits a slight increase during periods of enhanced current velocity (Figure 4f1), the response is less pronounced compared to other stations. This discrepancy may be attributed to a combination of local hydrodynamic and sedimentary factors. Also, local potential lateral sediment transport could further modify the temporal correspondence between current velocity and SSC, leading to the observed phase lag or weakened correlation. Nevertheless, the residual current directions and sediment transport trends derived from the observations are consistent, which supports the overall reliability of the dataset.
Table 3
| Sediment | SHB | WTB | Out of Bay | |||||
|---|---|---|---|---|---|---|---|---|
| L336 | L340 | L341 | L342 | L335 | L337 | L338 | L339 | |
| Suspension (φ) | 6.13 | 6.18 | 6.29 | 6.49 | 6.27 | 6.31 | 6.39 | 6.36 |
| Seabed (φ) | 6.36 | 0.05 | 2.11 | 1.11 | 6.55 | 6.41 | 6.21 | 5.56 |
Mean grain sizes of suspended and surface sediment at different sites.
Figure 8
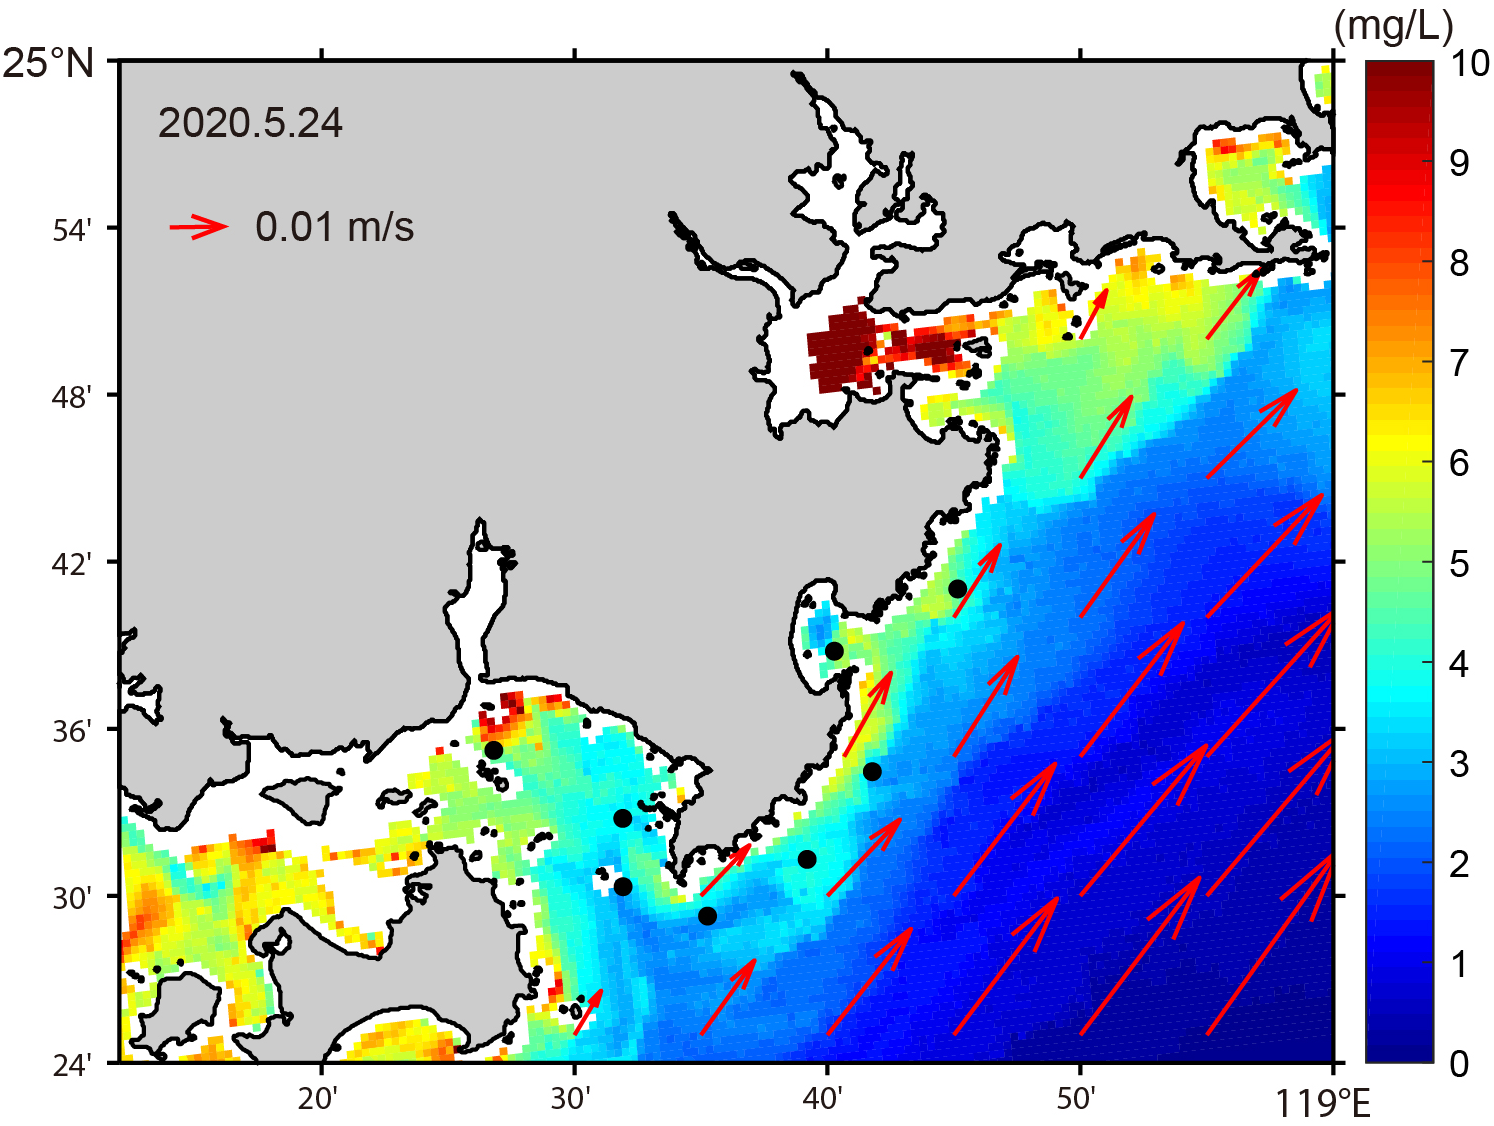
Spatial distribution of surface SSC derived from GOCI imagery (2020-5-24 05:16 UTC) and circulation from the CMEMS (2020.5.24). Black dots indicate observation stations. The length of arrows represents the current velocity magnitude.
Suspended sediment dynamics differ markedly between inside and outside the bays. In SHB and WTB, bed shear stress often remains below the critical threshold, so SSC is influenced by both weak local resuspension and lateral input, allowing elevated SSC even under low flow velocity (Figure 2). Offshore, stronger hydrodynamics generate sufficient shear for resuspension, with SSC peaks coinciding with flow maxima (Figure 3). These contrasts highlight the control of local topography, hydrodynamics, and sediment grain size: inside the bays, SSC is maintained by lateral transport and weak resuspension, while offshore it is dominated by tide-driven resuspension. Net SSF closely follows residual currents, with advective components—especially the Eulerian residual—dominating, and non-advective mechanisms such as tidal pumping contributing relatively little.
Grain-size differentiation reveals distinct sediment sources and hydrodynamic environments. In WTB, surface sediments are notably coarser than suspended sediments (Figure 6), indicating that suspended material primarily originates from fine-particle resuspension or lateral input rather than direct resuspension of local surface sediments, with internal rivers serving as important sources. In WTB, several small seasonal rivers (e.g., Daying Creek, Xiadian Creek, and Jiatang Creek) deliver terrigenous sediments to the bay. Under the combined influence of monsoon-driven waves and tidal currents, these sediments are continuously transported and deposited seaward. Grain-size analyses of surface sediments reveal that muddy deposits are predominant near the river mouths (Xiong, 2018). In SHB and offshore, the similarity between surface sediment and suspended sediment grain sizes also indicates a substantial contribution from resuspension.
4.2 Sediment transport between adjacent bays during the late spring high tides
Figure 8 shows SSC derived from GOCI imagery and concurrent circulation from the CMEMS model. SSC is higher nearshore than offshore, forming a typical nearshore high SSC belt. Inside WTB and SHB, SSC is elevated and extends outward near the bay mouths, indicating continuous tidal export (Figure 5), though values inside SHB are lower due to weaker internal hydrodynamics (Figure 2a1). Alongshore currents flow generally northeastward, consistent with SSC maxima, suggesting bay-exported sediments are transported along the Fujian coast. In late spring (late May), the Fujian Coastal Current transitions from southward to northward as the northeast monsoon weakens and the southwest monsoon and Taiwan Warm Current strengthen, with residual weak southward flow locally (Johnston et al., 2011; Zeng et al., 2012; Liu et al., 2015; Gao et al., 2021).
During the observation period, sediments in SHB and WTB were transported seaward and then northeastward along the coast (Figure 5). In SHB, both residual currents and net SSF were seaward, with possible clockwise circulation inside the bay (Figure 9; Lin et al., 2013). ADCP observations at the SHB mouth and numerical simulations of tracer concentration variations within the SHB during the spring season revealed a typical northward inflow and southward outflow pattern between the bay and the open sea (Liu et al., 2008). The half-exchange period of seawater in SHB was estimated to be approximately 14 days. SHB is a semi-enclosed, arcuate-shaped bay where ebb currents are stronger but shorter in duration, while flood currents are weaker and last longer due to nonlinear shallow-water effects. Under the influence of the Coriolis force, the flow tends to deflect northward during flood tides and southward during ebb tides. In addition, the northward intrusion of the Taiwan Warm Current further enhances the clockwise residual circulation within the bay. In WTB, bottom residual currents flowed outward and surface currents inward. The depth-averaged residual current at the WTB mouth (L340) is directed landward, consistent with previous numerical simulation results showing tide-induced residual currents flowing from the open sea into the bay (Jing et al., 2011; Qi, 2014; Cheng et al., 2011). Observations in the northwestern part of WTB indicate that the surface residual current flows westward during spring (Yao et al., 2024), which aligns with the direction observed at station L342. The residual circulation within WTB is influenced by the regional circulation pattern, with seawater entering the bay between Jinmen Island and Weitou Cape and exiting between Zhenhai Cape and Jinmen Island. Satellite imagery also reveals that low-SSC offshore water intrudes into the bay (Figure 9). However, the net SSF at the bay mouth (L340) is directed seaward, indicating a reverse transport of water and sediment (Figure 5c). At station L340, the seabed sediment is relatively coarse (Figure 6), and the bottom shear stress generated during the observation period did not exceed the critical shear stress corresponding to the mean grain size of the bed material (Figure 7b). It even remained below the critical shear stress of the suspended sediment for most of the time, indicating weak resuspension. Therefore, the resuspended particles were mainly very fine mud, and the sediment was primarily concentrated near the seabed. Consequently, the lateral sediment transport at this station was mainly controlled by the bottom currents, with the residual current directed seaward. In addition, the SSC during ebb tide is higher than during flood tide (Figure 2b3), leading to greater off-bay sediment transport during ebb periods and thus a tidal asymmetry in sediment transport. Overall, this explains why, at station L340, the residual current is directed landward, whereas the net SSF was directed seaward.
Figure 9
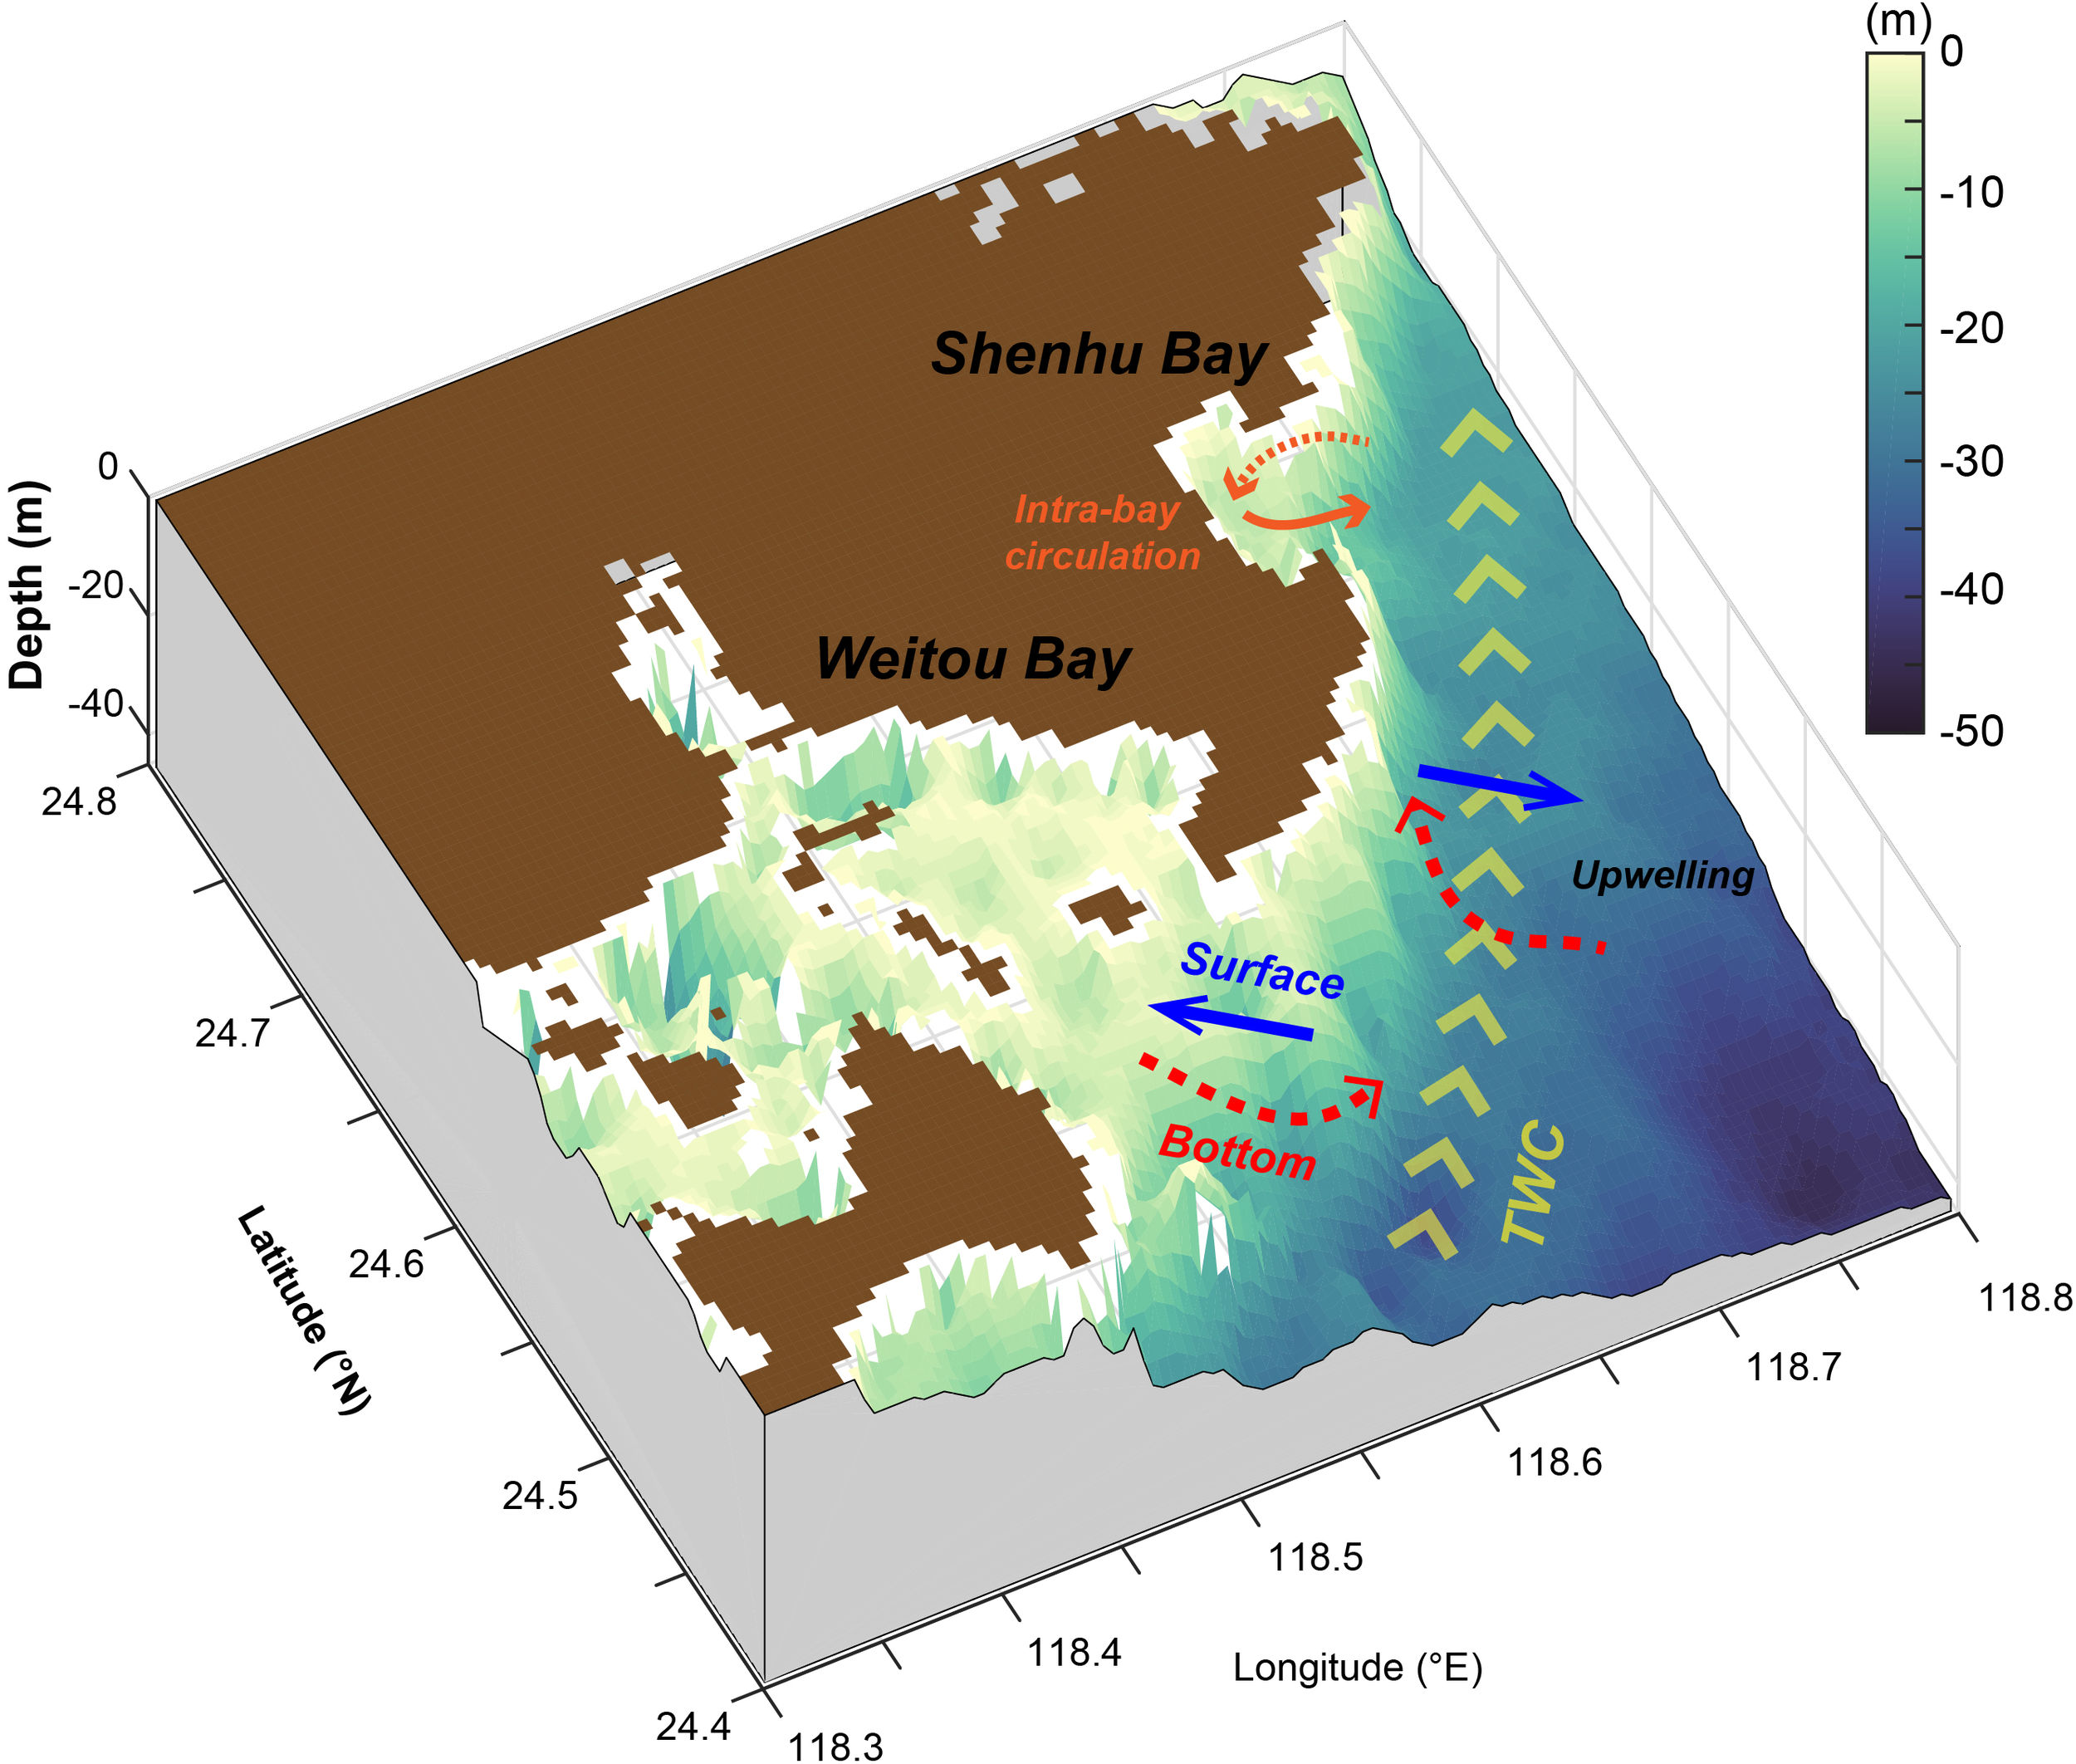
Sediment transport pathways during the observation period. Yellow arrows indicate the Taiwan Warm Current (TWC); blue arrows show surface net SSF; red dashed arrows represent bottom net SSF. Orange indicates the possible circulation structure within SHB, with solid orange lines showing L336 observations and dashed orange lines representing inferred circulation.
At the offshore stations, the alongshore flow was dominated by the northeastward TWC, whereas in the cross-shore direction, the surface residual currents and SSF showed an offshore transport trend, while the bottom residual currents and SSF were directed shoreward, suggesting a weak upwelling-like structure in the cross-shore direction. Strong coastal upwelling (wind-driven) usually appears off the Fujian coast during the southwesterly monsoon period (Jing et al., 2009; Hu et al., 2018). However, during the observation period, wind speeds were low and intermittent (Figure 1c), making it difficult for a stable coastal upwelling to form nearshore. Based on numerical simulation, Jing et al. (2007) found that although the weak TWC and northeasterly monsoon in winter are unfavorable for upwelling along the Fujian coast, a relatively weak upwelling still exists. In spring, as the TWC strengthens and the northeasterly monsoon weakens, the upwelling intensifies compared to winter. This upwelling is mainly generated as the TWC is lifted by the seabed topography and by the friction between the current and the seafloor. In summer, the additional influence of the southwesterly monsoon leads to the upwelling reaching its maximum intensity of the year.
Although wind speeds were generally weak during the observation period, their cumulative effects might influence the circulation structure and SSC distribution within the bays. According to the relationship between wind speed and surface current velocity proposed by the U.S. Minerals Management Service (MMS; Vince, 2006), a wind speed of approximately 3 m/s can generate a surface current velocity below 0.05 m/s. This value is much smaller than the tidal current velocities in WTB (L340–L342), accounting for less than one-tenth of the maximum tidal velocity, and about one-fifth to one-tenth of that in SHB. Therefore, such weak winds may have only a minor influence on the current structure in SHB. Persistent winds from a single direction could potentially induce alongshore flow by driving water accumulation; however, since wind directions varied during the observation period (Figure 1c), their effects on the circulation structure is considered limited. At the shallow stations (water depth ~10 m), the near-bed velocity was estimated using the empirical formula proposed by Soulsby (1997), Uc=(1/h)1/7Uh, where h is the height above the bed and Uh is the velocity at that height. The calculated near-bed velocity was approximately 0.03 m/s, indicating negligible resuspension effects, as it is far lower than the bed shear stress induced by tidal currents. Consequently, we infer that the weak wind conditions during the observation period exerted only a limited influence on the shallow-water stations.
Observations reveal a potential hydrodynamic connectivity between SHB and WTB, jointly sustained by tidal and residual flows. Both bays exhibit seaward residual transport, with net SSF indicating material export through the bay mouths. Although the limited number of observation stations does not allow for a fully quantitative description of the material exchange processes between the bays and the open sea, the stations located at the bay mouths are positioned along the main channels of water and sediment exchange. Therefore, they are considered representative to some extent and can effectively indicate the pathways of sediment transport. Supporting evidence is provided by Xiong (2021), who used a particle-tracking approach and demonstrated that, during spring, materials from WTB are exported seaward with the ebb current and subsequently transported northeastward along the coast. This finding is generally consistent with and reinforces the transport patterns inferred from our field observations. Overall, the bays are connected via bay-mouth hydrodynamics and lateral transport, though further study is needed on their regional sediment and nutrient contributions.
5 Conclusion
Based on continuous field observations during the spring tide in late-spring 2020, satellite imagery, and reanalysis dataset, this study systematically analyzed sediment dynamics in the adjacent Shenhu Bay (SHB) and Weitou Bay (WTB) in central Fujian. Results show that SHB exhibits pronounced tidal asymmetry, with residual currents and net suspended sediment flux (SSF) directed seaward, indicating dominant sediment export. In WTB, residual currents are weaker with notable surface–bottom differences, and net SSF is primarily seaward at the bottom layer. Offshore, residual currents and SSF are transported northeastward along the coast, reflecting regional circulation under the northward-advancing Taiwan Warm Current in late spring. Analysis of suspended sediment concentration (SSC) and bed shear stress indicates that offshore suspended sediments are mainly controlled by tide-driven resuspension, whereas bay sediments are maintained by lateral input combined with weak local resuspension. Decomposition results show that advective transport dominates, with tidal pumping and vertical circulation contributing little. During the spring tide in May 2020, both SHB and WTB exported sediments seaward, with a potential connectivity achieved through bay mouths and regional circulation.
Statements
Data availability statement
The original contributions presented in the study are included in the article/supplementary material. Further inquiries can be directed to the corresponding author.
Author contributions
ML: Formal Analysis, Methodology, Visualization, Writing – original draft. MH: Conceptualization, Writing – review & editing. JM: Data curation, Investigation, Methodology, Writing – review & editing. BL: Data curation, Investigation, Validation, Writing – review & editing. JG: Data curation, Investigation, Writing – review & editing. BY: Conceptualization, Data curation, Investigation, Methodology, Validation, Writing – review & editing. CH: Data curation, Investigation, Methodology, Writing – review & editing. RJ: Data curation, Investigation, Methodology, Validation, Writing – review & editing. YZ: Conceptualization, Data curation, Investigation, Methodology, Visualization, Writing – review & editing.
Funding
The author(s) declare financial support was received for the research and/or publication of this article. This work was supported by (1) China’s National Key R&D Program (No. 2022YFB3207400), (2) the National Natural Science Foundation of China (No. U2106223), (3) the National Natural Science Foundation of China (No. U21A20123).
Conflict of interest
Author JG was employed by the company Wuxi Haiying-Cal Tec Marine Technology Co., Ltd.
The remaining authors declare that the research was conducted in the absence of any commercial or financial relationships that could be constructed as a potential conflict of interest.
Generative AI statement
The author(s) declare that no Generative AI was used in the creation of this manuscript.
Any alternative text (alt text) provided alongside figures in this article has been generated by Frontiers with the support of artificial intelligence and reasonable efforts have been made to ensure accuracy, including review by the authors wherever possible. If you identify any issues, please contact us.
Publisher’s note
All claims expressed in this article are solely those of the authors and do not necessarily represent those of their affiliated organizations, or those of the publisher, the editors and the reviewers. Any product that may be evaluated in this article, or claim that may be made by its manufacturer, is not guaranteed or endorsed by the publisher.
References
1
Cheng P. Wang A. Wu J. Lin Y. Chen J. Chen N. (2011). An assessment of residence and influence times in Xiamen Bay, China. Estuar. Coast. Shelf Sci.262, 107595. doi: 10.1016/j.ecss.2021.107595
2
Gao J. Hui H. Liu Y. Shi H. (2024). Influences of Bragg reflection on harbor resonance triggered by irregular wave groups. Ocean Eng.305, 117941. doi: 10.1016/j.oceaneng.2024.117941
3
Gao J. Ma X. Dong G. Chen H. Liu Q. Zang J. (2021). Investigation on the effects of Bragg reflection on harbor oscillations. Coast. Eng.170, 103977. doi: 10.1016/j.coastaleng.2021.103977
4
Gao J. Ma X. Zang J. Dong G. Ma X. Zhu Y. et al . (2020). Numerical investigation of harbor oscillations induced by focused transient wave groups. Coast. Eng.158, 103670. doi: 10.1016/j.coastaleng.2020.103670
5
Gao J. Shi H. Zang J. Liu Y. (2023). Mechanism analysis on the mitigation of harbor resonance by periodic undulating topography. Ocean Eng.281, 114923. doi: 10.1016/j.oceaneng.2023.114923
6
Gao G. D. Wang X. Song D. Yin B. Yang D. Ding Y. et al . (2018). Effects of wave–current interactions on suspended-sediment dynamics during strong wave events in Jiaozhou Bay, Qingdao, China. J. Phys. Oceanogr.48, 1053–1078. doi: 10.1175/JPO-D-17-0259.1
7
Guan B. Fang G. (2006). Winter counter-wind currents off the southeastern China coast: a review. J. Oceanogr.62, 1–24. doi: 10.1007/s10872-006-0028-8
8
Hu J. Liang X. S. Lin H. (2018). “ Coastal upwelling off the China coasts,” in Coastal Environment, Disaster, and Infrastructure - A Case Study of China’s Coastline (London, England, UK: IntechOpen). doi: 10.5772/intechopen.80738
9
Huang J. Zhu J. Su J. Han X. Cai L. (2024). Suspended sediment exchange between the Changjiang Estuary and Hangzhou Bay and their key driving mechanisms. Estuar. Coast. Shelf Sci.305, 108876. doi: 10.1016/j.ecss.2024.108876
10
Jing Z. Hua Z. Qi Y. Cheng X. (2007). Numerical study on the coastal upwelling and its seasonal variation in the East China Sea. J. Coast. Res.50, 555–563. doi: 10.2112/JCR-SI50-106.1
11
Jing Z. Qi Y. Hua Z.-l. Zhang H. (2009). Numerical study on the summer upwelling system in the northern continental shelf of the South China Sea. Continent. Shelf Res.29, 467–478. doi: 10.1016/j.csr.2008.11.008
12
Jing C. Zhu X. Bao X. Song D. (2011). Three dimensional tidal current numerical simulation based on FVCOM in and around Xiamen Bay. J. Oceanogr. Taiwan Strait2011, 30. doi: 10.3969/J.ISSN.1000-8160.2011.01.016
13
Johnston T. M. S. Rudnick D. L. Pall`as Sanz E. (2011). Elevated mixing at a front. J. Geophys. Res.: Oceans116, C11033. doi: 10.1029/2011JC007192
14
Li Y. Wang A. Qiao L. Fang J. Chen J. (2012). The impact of typhoon Morakot on the modern sedimentary environment of the mud deposition center off the Zhejiang–Fujian coast, China. Cont. Shelf Res.37, 92–100. doi: 10.1016/j.csr.2012.02.020
15
Lin Y. Li Y. Wang L. Zheng B. Yin X. Xu Y. (2021). Typhoon Fung-Wong, (2008) induced heavy metals secondary pollution in Quanzhou Bay, southeast of China. Mar. pollut. Bull.164, 112047. doi: 10.1016/j.marpolbul.2021.112047
16
Lin F. Yuan D. Liu X. Lin S. Feng L. (2013). Distribution of total mercury and methyl mercury contents in samples collected from different environments of Shenhu Bay, Fujian. J. Appl. Oceanogr.32, 425–431. doi: 10.3969/J.ISSN.2095-4972.2013.03.017
17
Liu J. Hsu R. Yang R. Wang Y. Wu H. Du X. et al . (2018). A comprehensive sediment dynamics study of a major mud belt system on the inner shelf along an energetic coast. Sci. Rep.8, 4229. doi: 10.1038/s41598-018-22696-w
18
Liu H. Pan W. Luo Z. (2008). Study on water exchange characters in the Shenhu Bay. Mar. Environ. Sci.27, 4. doi: 10.3969/j.issn.1007-6336.2008.02.014
19
Liu S. Qiao L. Li G. Li J. Wang N. Yang J. (2015). Distribution and cross-front transport of suspended particulate matter over the inner shelf of the East China Sea. Continent. Shelf Res.107, 92–102. doi: 10.1016/j.csr.2015.07.013
20
Montoya V. Sciaudone E. Mitasova H. Overton M. (2018). Observation and modeling of the evolution of an ephemeral storm-induced inlet: Pea Island Breach, North Carolina, USA. Continent. Shelf Res.156, 55–69. doi: 10.1016/j.csr.2018.02.002
21
Poppeschi C. Verney R. Charria G. (2024). Suspended particulate matter response to extreme forcings in the Bay of Seine. Mar. Geology472, 107292. doi: 10.1016/j.margeo.2024.107292
22
Qi M. (2014). A Study on Numerical Simulation and Forecast of Tides and Tidal Currents in Xiamen Bay and its Adjacent Waters (China: Ocean University of China).
23
Song D. Wu W. Li Q. (2021). Effects of wave–current interactions on bay–shelf exchange. J. Phys. Oceanogr.51, 1637–1654. doi: 10.1175/JPO-D-20-0222.1
24
Soulsby R. (1997). Dynamics of Marine Sands: A Manual for Practical Applications (London: Thomas Telford Publications).
25
Soulsby R. Davies A. (1995). “ Bed shear stress due to combined waves and currents,” in Advances in Coastal Morpho Dynamics ( Delft Hydraulics, Delft, Netherlands).
26
van Rijn L. C. (1993). Principles of Sediment Transport in Rivers, Estuaries and Coastal Seas (Amsterdam, Netherlands: Aqua Publications).
27
van Rijn L. C. (2007). Unified View of Sediment Transport by Currents and Waves. I: Initiation of Motion, Bed Roughness, and Bed-Load Transport. J. Hydraul. Eng.133. 649–667.
28
Vince C. (2006). Hindcast data on winds, waves and currents in northern Gulf of Mexico in hurricanes Katrina and Rita (USA: Minerals Management Service), 1–26.
29
Woodroffe C. D. (2003). Coasts: Form, Process and Evolution (Cambridge: Cambridge University Press).
30
Xiong H. (2018). Study on speciation and distribution of heavy metals in surface sediments from Anhai Bay and Weitou Bay, Fujian Province. Xiamen University, China.
31
Xiong J. (2021). A preliminary study on the hydrological connectivity of Xiamen Bay. Xiamen University, China.
32
Yang G. Wang X. Zhong Y. Oliver T. (2022). Modelling study on the sediment dynamics and the formation of the flood-tide delta near Cullendulla Beach in the Batemans Bay, Australia. Mar. Geology452, 106910. doi: 10.1016/j.margeo.2022.106910
33
Yao H. Du Q. Liu S. Hong J. Chen K. (2024). Analysis of surface currents in the waters around Dadeng Island, Xiamen, based on smart navigational buoys. China Water Transport24:70–72.
34
Yuan D. Zhu J. Li C. Hu D. (2008). Cross-shelf circulation in the Yellow and East China Seas indicated by MODIS satellite observations. J. Mar. Syst.70, 134–149. doi: 10.1016/j.jmarsys.2007.04.002
35
Zeng D. Y. Ni X. B. Huang D. B. (2012). Temporal and spatial variability of the Zhe-Min coastal current and the Taiwan warm current in winter in the southern Zhejiang coastal sea. Sci. Sin. Terrae42, 1123–1134. doi: 10.1360/zd-2012-42-7-1123
36
Zhao F. Li Z. Li J. Chen W. (2013). Mechanism of water and suspended sediment transport from neap tide to spring tide in North Branch of Changjiang Estuary. J. Sediment Res.4, 55–62. doi: 10.3969/j.issn.0468-155X.2013.04.009
37
Zhou S. Zhu C. Lin J. Xie W. Zhang N. Guo L. et al . (2025). Multi-asymmetry on residual sediment transport in the branching channels of the Yangtze Estuary. J. Hydrol.655, 132947. doi: 10.1016/j.jhydrol.2025.132947
38
Zhu J. Meng Y. Tong C. Shi J. . (2016). Mechanism of suspended sediment transport in Weitou bay in Fujian. J. Waterway Harbor37, 121–127. doi: 10.3969/j.issn.1005-8443.2016.02.003
Summary
Keywords
sediment dynamics, residual current, bay, in-situ observation, coastal processes
Citation
Liu M, Hu M, Ma J, Liu B, Gu J, Yu B, Hu C, Jin R and Zhu Y (2025) Sediment dynamics in adjacent bays of Fujian during late-spring spring tide. Front. Mar. Sci. 12:1716912. doi: 10.3389/fmars.2025.1716912
Received
01 October 2025
Revised
04 November 2025
Accepted
04 November 2025
Published
21 November 2025
Volume
12 - 2025
Edited by
Dongfeng Xie, Zhejiang Institute of Hydraulics & Estuary, China
Reviewed by
Junliang Gao, Jiangsu University of Science and Technology, China
Jian Zhou, Hohai University, China
Updates
Copyright
© 2025 Liu, Hu, Ma, Liu, Gu, Yu, Hu, Jin and Zhu.
This is an open-access article distributed under the terms of the Creative Commons Attribution License (CC BY). The use, distribution or reproduction in other forums is permitted, provided the original author(s) and the copyright owner(s) are credited and that the original publication in this journal is cited, in accordance with accepted academic practice. No use, distribution or reproduction is permitted which does not comply with these terms.
*Correspondence: Mengying Hu, humengying@mail.cgs.gov.cn; Yingtao Zhu, zhuyt@tiwte.ac.cn
Disclaimer
All claims expressed in this article are solely those of the authors and do not necessarily represent those of their affiliated organizations, or those of the publisher, the editors and the reviewers. Any product that may be evaluated in this article or claim that may be made by its manufacturer is not guaranteed or endorsed by the publisher.