Abstract
Coastal areas have become industrialized, increasing the risk of heavy metal pollution. Industrial, agricultural, and domestic wastewater carrying heavy metal pollution enters Guanghai Bay via rivers or direct discharge, posing significant environmental dangers. These risks are detrimental to regional economic development and the bay’s ecosystem. Heavy metal concentrations in 29 seawater, 16 sediment, and 16 marine organism samples from Guanghai Bay were analyzed using atomic absorption spectroscopy and multiple pollution indices, such as the geo-accumulation index, potential ecological risk index, single factor pollution index, water quality index, single pollution index, bioaccumulation factor, and principal component analysis. The results showed that sediment and seawater heavy metals generally met Class I criteria, although high variation coefficients suggested notable external influences. Spatially, Cu, Pb, Zn, and Cd concentrations in sediments were highest in the northwestern estuary-influenced coastal waters, while Hg exhibited a distinct high-concentration zone between the Chuan River and Chuanshan Archipelago. In seawater, Cd and As hotspots were located near northwestern estuaries and Yutang Port, whereas Cu and Pb showed unique distribution patterns with significant spatial heterogeneity. Cd is the most damaging element in sediments, posing moderate to high ecological hazards in some areas. Mercury and lead showed moderate pollution in the seawater at certain locations, although the overall water quality remained clean. Marine organisms meet biological quality criteria but show strong bioaccumulation of certain metals. The principal component analysis identified terrestrial inputs, riverine transport, industrial/agricultural discharge, and traffic emissions as major causes of seawater pollution, whereas sediment metals were derived from both natural and anthropogenic sources. This study provides a scientific foundation for managing bay ecology in the face of rapid urbanization and economic growth. The novelty of this work lies in its integrated approach, combining multiple pollution indices and spatial analysis to identify pollutant sources and ecological risks in a typical estuarine-bay-archipelago system—a rarely studied ecosystem in the northern South China Sea. The study addresses the critical scientific problem of distinguishing between natural and anthropogenic contributions to heavy metal pollution, which is essential for targeted environmental management.
1 Introduction
Coastal ecosystems are critically important for global biodiversity, economic activities, and human settlement. However, rapid industrialization and urbanization in adjacent watersheds have made them primary receptors for various pollutants, with heavy metals posing a particularly significant threat due to their toxicity, persistence, and bioaccumulative potential (Zhang et al., 2025; Zhao et al., 2016). These metals originate from diverse anthropogenic sources—including industrial effluent, agricultural runoff, domestic wastewater, and atmospheric deposition—and enter coastal waters via rivers and direct discharge (Qiu et al., 2019). Once introduced, heavy metals can accumulate in sediments, act as a long-term secondary source of pollution, and be taken up by marine organisms, ultimately posing risks to ecosystem health (Kwok et al., 2014; Hoai et al., 2020).
Extensive research has been conducted globally to assess heavy metal contamination in coastal environments. For instance, studies in typical mangrove systems like Kakinada Bay have highlighted the role of sedimentary processes in metal distribution (Avvari et al., 2022), while work in highly industrialized estuaries like the Musa Estuary has focused on source apportionment and ecological risk speciation (Madadi et al., 2023). In China, significant research efforts have concentrated on major systems like the Pearl River Estuary, revealing complex patterns of metal transport and bioaccumulation influenced by intense anthropogenic pressures (Zhang et al., 2013; Yu et al., 2010). However, many of these studies focus on large river deltas or heavily industrialized harbors. In contrast, complex estuarine-bay-archipelago systems, which feature unique hydrodynamic conditions and interconnected yet distinct habitats, remain comparatively understudied, particularly in the northern South China Sea. These systems, where terrestrial inputs, marine processes, and island effects interact, may exhibit distinct metal fate and accumulation patterns that cannot be extrapolated from studies in other coastal types.
Guanghai Bay, located on the central coast of Guangdong Province, is a prime example of such a complex ecosystem. It functions as a critical transition zone receiving discharges from several rivers while also encompassing a nearshore bay and the adjacent Chuanshan Archipelago. The region is experiencing rapid economic development and urbanization, increasing the potential for pollution from surrounding industrial, agricultural, and domestic sources. While previous regional studies have provided a broad overview of metal distributions (Zhang et al., 2015; Zhao et al., 2016), a comprehensive, multi-compartmental assessment specifically targeting Guanghai Bay’s unique estuarine-bay-archipelago structure is lacking. Key scientific questions specific to this system remain unanswered: What are the primary sources and spatial patterns of heavy metals across its different environmental compartments (seawater, sediment, and organisms)? To what extent does the complex geography influence these patterns? Most importantly, how can we effectively distinguish between the natural geological background and anthropogenic contributions to accurately assess ecological risks and identify primary pollutants?
Addressing this last question—the differentiation of natural versus anthropogenic sources—is a critical scientific problem in environmental management. Without this distinction, formulating targeted and effective pollution control strategies is challenging. The innovation of this study, therefore, lies in its integrated approach applied to a rarely studied ecosystem type. We combine multiple established pollution indices (geo-accumulation index, potential ecological risk index) with spatial analysis and multivariate statistics (Principal Component Analysis) to not only evaluate the contamination status and ecological risks but also to trace the potential sources of heavy metals in seawater, sediments, and marine organisms of Guanghai Bay.
The primary objectives of this study are to: 1) determine the concentrations and spatial distribution of seven heavy metals (Cu, Pb, Zn, Cr, Cd, As, Hg) in the seawater, sediments, and representative marine organisms of Guanghai Bay; 2) quantify the level of pollution and potential ecological risk in sediments and seawater using a suite of indices; 3) evaluate the bioaccumulation potential of these metals in different biological groups (fish, crustaceans, mollusks); 4) identify the potential natural and anthropogenic sources of heavy metals through correlation analysis and PCA. By achieving these objectives, this research aims to provide a scientific foundation for the environmental management of Guanghai Bay and similar complex coastal ecosystems under increasing anthropogenic pressure.
2 Materials and methods
2.1 Sampling protocols and analytical procedures
In April 2015, 29 surface seawater, 16 surface sediment, and 16 marine organism samples were collected from the Guanghai Bay (Figure 1). Seawater samples were obtained using a water sampler and placed in clean 2.5-liter narrow-mouth polyethylene bottles. After collection, the samples were filtered through pretreated 0.45 μm Nuclepore membranes (Whatman International Ltd., Maidstone, UK) and kept in 500 mL polyethylene sample bottles. These bottles were then acidified with ultra-pure HNO3. Water samples were sealed, refrigerated, and transported to the laboratory for further processing and analysis.
Figure 1
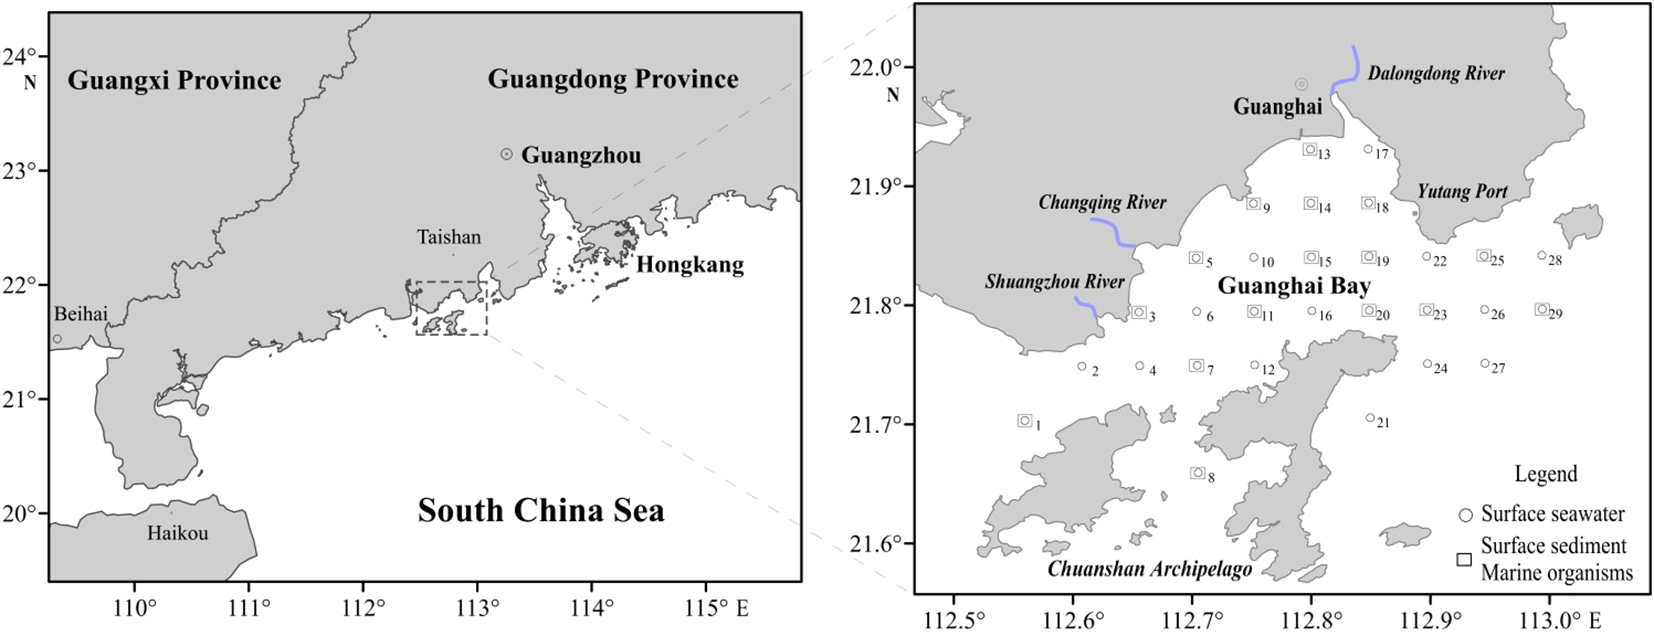
The sampling stations in Guanghai Bay.
Sediment samples were collected from the top 0–5 cm layer of the seabed using a grab sampler. The samples were then transferred to pre-cleaned polyethylene bags using a plastic spoon, sealed, refrigerated, and transported to the laboratory for processing and analysis. Trawl nets were used to harvest marine organisms. Species were selected based on their dominance in local catches and ecological relevance, including representative fish (e.g., Silurus asotus, O. ophuyseni), crustaceans (P. hungerfordi, P. sanguinolentus), and mollusks (L. duvernoyi, T. bacillum). For each species, a minimum of three individuals per sampling station were collected to ensure biological replication. In the laboratory, muscle tissues were dissected using ceramic knives to avoid metal contamination, freeze-dried, and homogenized prior to digestion. For each digestion cycle, 0.1 g of biological tissue was treated with 9 mL of nitric acid and 3 mL of hydrogen peroxide in Teflon vessels, following USEPA Method 3050B.
The concentrations of Cu, Pb, Zn, and Cd in seawater were determined using flameless atomic absorption spectrophotometry, which was also used for the analysis of Cu, Pb, and Cd in sediments and biological samples. Flame atomic absorption spectrophotometry was used to determine Zn in the sediments and biological samples. A Varian 240 FS atomic absorption spectrometer (Spectralab Scientific Inc., Markham, ON, Canada) was used for all the measurements. The As and Hg concentrations were quantified using an XGY1011A atomic fluorescence photometer (IGGE, Beijing, China). Rigorous quality assurance measures, including the use of blank reagents, replicate samples, and certified standard reference materials, were implemented to ensure data reliability. The recovery rates for all investigated elements consistently fell between 90 and 110%, indicating high accuracy. Furthermore, reproducibility was evaluated using triplicate analyses of 10% of the samples, yielding relative standard deviations (RSD) between 0.05% and 2.5%, confirming the precision of the analytical methods.
2.2 Analytical evaluation approaches
Several indices were used to evaluate heavy metal pollution risks and identify the sources, including the geo-accumulation index (Igeo), potential ecological risk index (RI), single factor pollution index (Cf), water quality index (WQI), single pollution index (Pi), bioaccumulation factor (BAF). These established indices were not developed specifically for Guanghai Bay but have been widely applied and validated in similar coastal environments worldwide. Their applicability to Guanghai Bay is supported by the bay’s typical estuarine characteristics and the indices’ previous successful use in comparable South China Sea ecosystems (Zhang et al., 2015; Zhao et al., 2016), ensuring relevant and interpretable assessments. Principal component analysis (PCA) was performed using the SPSS software (IBM, Armonk, NY, USA).
The Igeo was determined using the following formula (Equation 1):
Here, Ci represents the heavy metal concentration in the sediments and Bi represents the background concentration levels from Guangdong Province, China (CNEMC, 1990). The Igeo scale ranges from uncontaminated (Igeo ≤ 0) to severely contaminated (Igeo > 5), as defined by Muller (1981).
RI assesses ecological risks based on metal toxicity and background concentrations (Hakanson, 1980). It is calculated as (Equation 2):
In this instance, refers to the contamination factor of the ith heavy metal, with and being the measured concentration and natural background level, respectively. The parameter is the toxicity weighting factor unique to each metal. Hakanson (1980) assigns the following toxicity coefficients to the selected heavy metals: Zn = 1; Cr = 2; Cu = 5; Pb = 5; As = 10; Cd = 30; and Hg = 40. The comprehensive ecological risk index (RI) is determined by integrating the individual risks posed by different heavy metals. The single-metal ecological risk () and RI were classified into five and four distinct severity levels, respectively, as shown in Table 1 (Xu et al., 2021).
Table 1
| Pollution level | RI | Pollution level | Cf | Pollution level | WQI | Pollution level | |
|---|---|---|---|---|---|---|---|
| <40 | Low | <105 | Low | <1 | Low | ≤1 | Clean |
| 40–79 | Moderate | 105 = 210 | Moderate | 1–3 | Medium | 1–2 | Slight |
| 80–159 | Considerable | 210–420 | Significant | 3–6 | High | 2–3 | Medium |
| 160–319 | High | ≥420 | Very high | >6 | Serious | >3 | Serious |
| ≥320 | Very high |
Classification criteria for , RI, Cf, and WQI in assessing pollution levels in surface sediments and seawater.
Heavy metal pollution in seawater was assessed using the Cf and WQI (Küikrer and Mutlu, 2019), and were calculated as follows (Equations 3, 4):
where Cf represents the individual pollution index for heavy metal i; Ci is the measured metal concentration; Cs is the standard concentration from the Seawater Quality Standard (GB 3097-1997); and n is the number of metals tested. The relationships between , RI, Cf, WQI, and pollution levels are summarized in Table 1 (Macdonald et al., 1996).
The pollution index (Pi) was used to evaluate heavy metal contamination in marine organisms and was calculated as follows (Equation 5):
where Ci is the measured concentration of the pollutant and Si is the equivalent environmental standard or reference value. In China, explicit classification criteria for Pi are lacking. Nevertheless, it is widely accepted that a Pi value of less than 1.0 indicates compliance with safety standards, whereas a value of more than 1.0 implies contamination (Zhang et al., 2015).
In this study, BWAF and BSAF are the biological concentration coefficients for seawater and sediments, respectively. These values were calculated as follows (Equations 6, 7):
where Ci, Cw, and Cs are the heavy metal concentrations in organisms, seawater, and sediments, respectively.
3 Results and discussion
3.1 Heavy metal concentrations and spatial distribution patterns
The concentrations of the seven heavy metals in surface sediments and seawater are listed in Table 2. All measured heavy metal concentrations in the sediments and seawater fulfilled the first-class standards of the Marine Sediment Quality Criteria (AQSIQ, 2002) and the Seawater Quality Standard (GB 3097-1997) (AQSIQ, 1997). Heavy metal concentrations for marine organisms in Guanghai Bay ranged from 0.32–9.75 (Cu), 0.011–0.091 (Pb), 3.9–17.49 (Zn), 0.15–0.45 (Cr), 0.02–0.18 (Cd), 0.33–0.96 (As), and 0.0001–0.022 μg/g (Hg), with mean values of 4.12, 0.055, 12.48, 0.326, 0.11, 0.66, and 0.012 μg/g, respectively (Table 3). The average heavy metal concentrations throughout the three organism groups followed a steady trend, with Zn > Cu > As > Cr > Cd > Pb > Hg. The highest concentrations of Pb, Zn, As, and Hg were found in L. duvernoyi and T. bacillum mollusks, whereas Cu and Cr concentrations were highest in the crustaceans P. hungerfordi and P. sanguinolentus. The highest concentration of Cd was found in the fish species Silurus asotus. The fish species O. ophuyseni and S. albella contained the lowest quantities of all heavy metals.
Table 2
| Heavy metals | Cu | Pb | Zn | Cr | Cd | As | Hg |
|---|---|---|---|---|---|---|---|
| Surface sediments (unit: μg/g) | |||||||
| Range | 3.18-13.6 | 0.77-7.03 | 2.52-7.85 | 17.83-94.55 | 0.04-0.47 | 0.85-1.62 | 0.009-0.045 |
| Average | 7.47 | 4.65 | 5.77 | 47.17 | 0.24 | 1.24 | 0.03 |
| MSQ-1 | 35 | 60 | 150 | 80 | 0.5 | 20 | 0.2 |
| Surface seawaters (unit: μg/L) | |||||||
| Range | 0.84-3 | 0.02-4.52 | 0.36-12.36 | 0.32-10.36 | 0.05-0.49 | 0.34-1.84 | 0.01-0.071 |
| Average | 1.32 | 1.34 | 4.86 | 3.76 | 0.14 | 1.26 | 0.04 |
| SQS-1 | 5 | 1 | 20 | 50 | 1 | 20 | 0.05 |
Contents of heavy metals in the sediments and seawater in Guanghai Bay.
Table 3
| Species | Stations | Value | Cu | Pb | Zn | Cr | Cd | As | Hg |
|---|---|---|---|---|---|---|---|---|---|
| All | 16 | Range | 0.32-9.75 | 0.011-0.091 | 3.9-17.49 | 0.15-0.45 | 0.02-0.18 | 0.33-0.96 | 0.0001-0.022 |
| Average | 4.12 | 0.055 | 12.48 | 0.326 | 0.11 | 0.66 | 0.012 | ||
| Crustaceans | 5 | Range | 2.13-9.75 | 0.031-0.085 | 10.62-16.89 | 0.3-0.45 | 0.05-0.14 | 0.52-0.78 | 0.012-0.017 |
| Average | 5.47 | 0.060 | 12.87 | 0.398 | 0.10 | 0.64 | 0.013 | ||
| Mollusks | 7 | Range | 2.29-6.95 | 0.011-0.091 | 10.41-17.49 | 0.15-0.42 | 0.07-0.17 | 0.47-0.96 | 0.0001-0.022 |
| Average | 4.91 | 0.047 | 14.37 | 0.280 | 0.13 | 0.72 | 0.014 | ||
| Fish | 4 | Range | 0.32-3.05 | 0.031-0.09 | 3.9-11.33 | 0.18-0.42 | 0.02-0.18 | 0.33-0.72 | 0.0001-0.0129 |
| Average | 1.24 | 0.061 | 8.70 | 0.315 | 0.10 | 0.59 | 0.006 |
Contents of heavy metals in marine organism in Guanghai Bay.
Figure 2 shows the spatial distribution of heavy metals in the surface sediments of Guanghai Bay. Cu, Pb, Zn, and Cd concentrations were highest in the coastal waters near the estuary in the northwestern part of the study area, whereas the lowest concentrations were found near the waters outside Yutang Port. The eastern part of the Chuanshan Archipelago contained high quantities of Cr and As. The high-concentration zone of Hg was primarily located between the Chuan River and Chuanshan Archipelago. Significant positive correlations were observed among Cu, Zn, and Cd, whereas the association between Cd and Cr was of moderate strength. Most other elemental interrelationships were statistically insignificant or weak (Table 4).
Figure 2
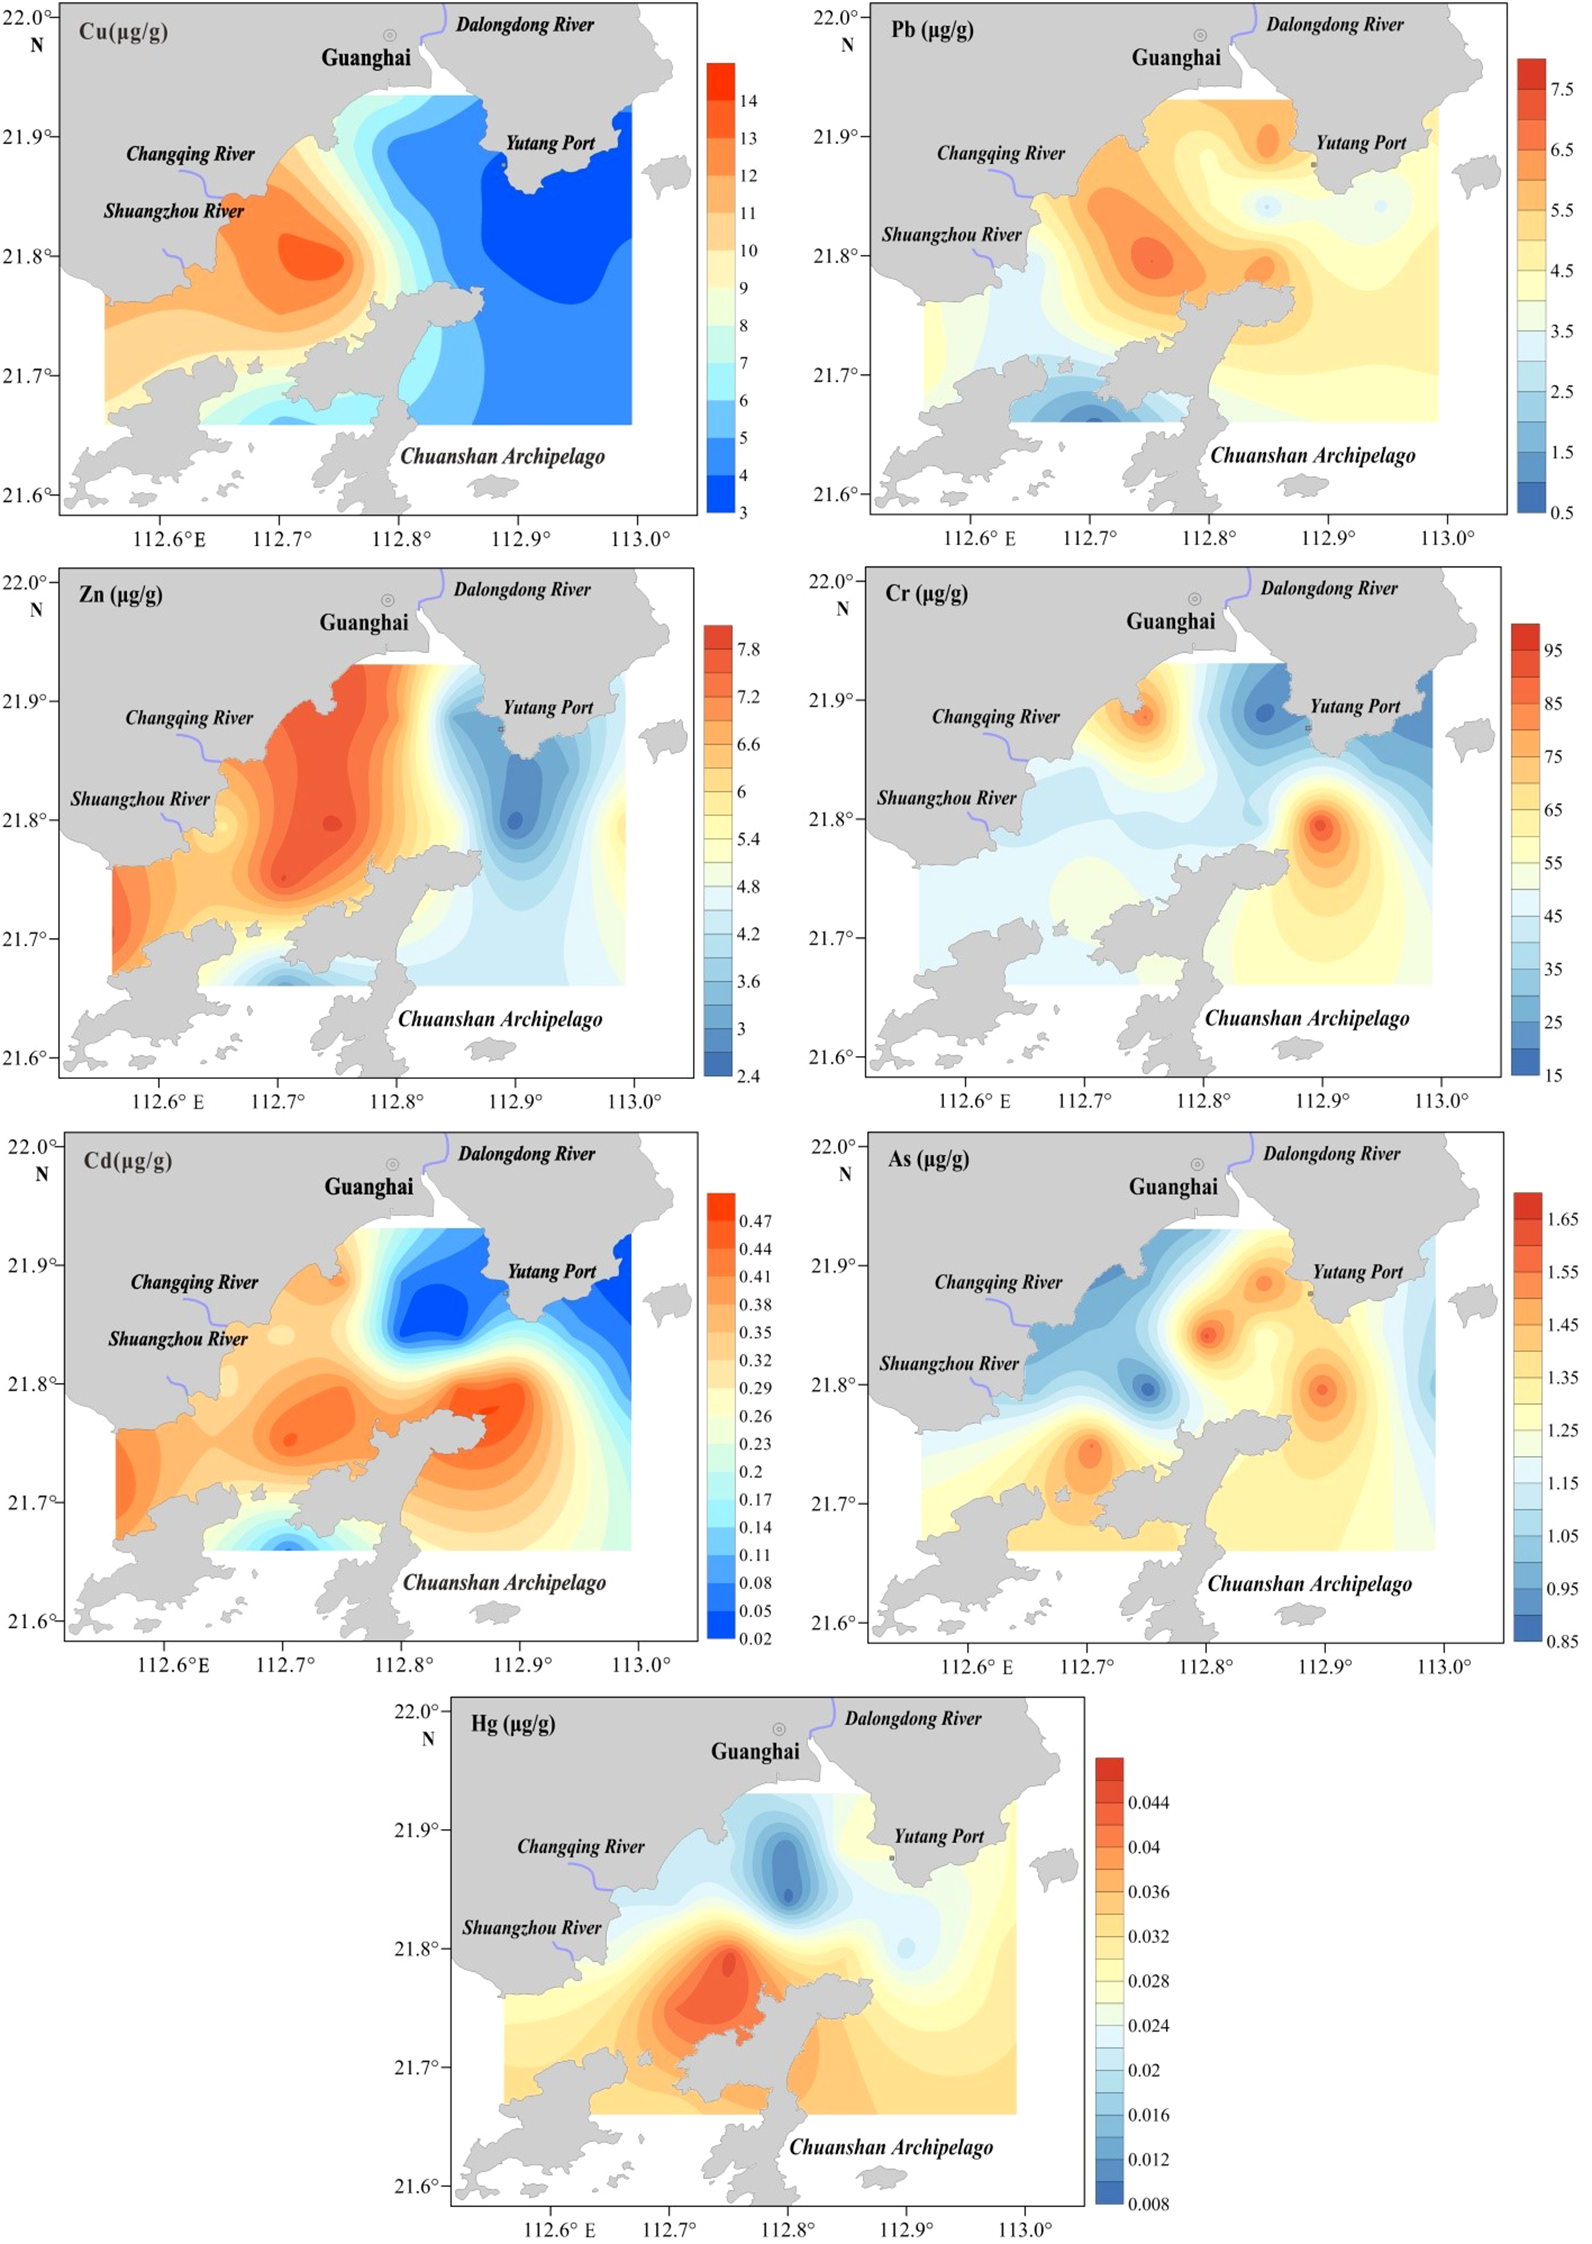
Spatial distributions of Cu, Pb, Zn, Cr, Cd, As, and Hg in the sediments.
Table 4
| Cu | Pb | Zn | Cr | Cd | As | Hg | |
|---|---|---|---|---|---|---|---|
| Cu | 1 | ||||||
| Pb | 0.29 | 1 | |||||
| Zn | 0.68** | 0.47 | 1 | ||||
| Cr | 0.33 | -0.06 | 0.07 | 1 | |||
| Cd | 0.71** | 0.39 | 0.36 | 0.54* | 1 | ||
| As | -0.35 | -0.26 | -0.46 | 0.12 | -0.14 | 1 | |
| Hg | 0.42 | 0.17 | 0.11 | -0.17 | 0.46 | -0.19 | 1 |
Pearson’s correlation matrix for the heavy metals in surface sediments.
**Correlation is significant at the 0.01 level (two-tailed).
*Correlation is significant at the 0.05 level (two-tailed).
Figure 3 shows the spatial distribution of heavy metals in surface seawater. Cr, Hg, and Zn distribution patterns were identical. Cd and As had comparable features, with high-concentration areas primarily located near estuaries (Dalongdong, Changqing, and Shuangzhou Rivers) in the northwest and Yutang Port in the east. In contrast, Cu and Pb had unique distributions. Pb showed significant spatial heterogeneity with extensive concentration variations, whereas Cu was concentrated near the Dalongdong River in the north-central region, and Pb was concentrated along the northwestern coast.
Figure 3
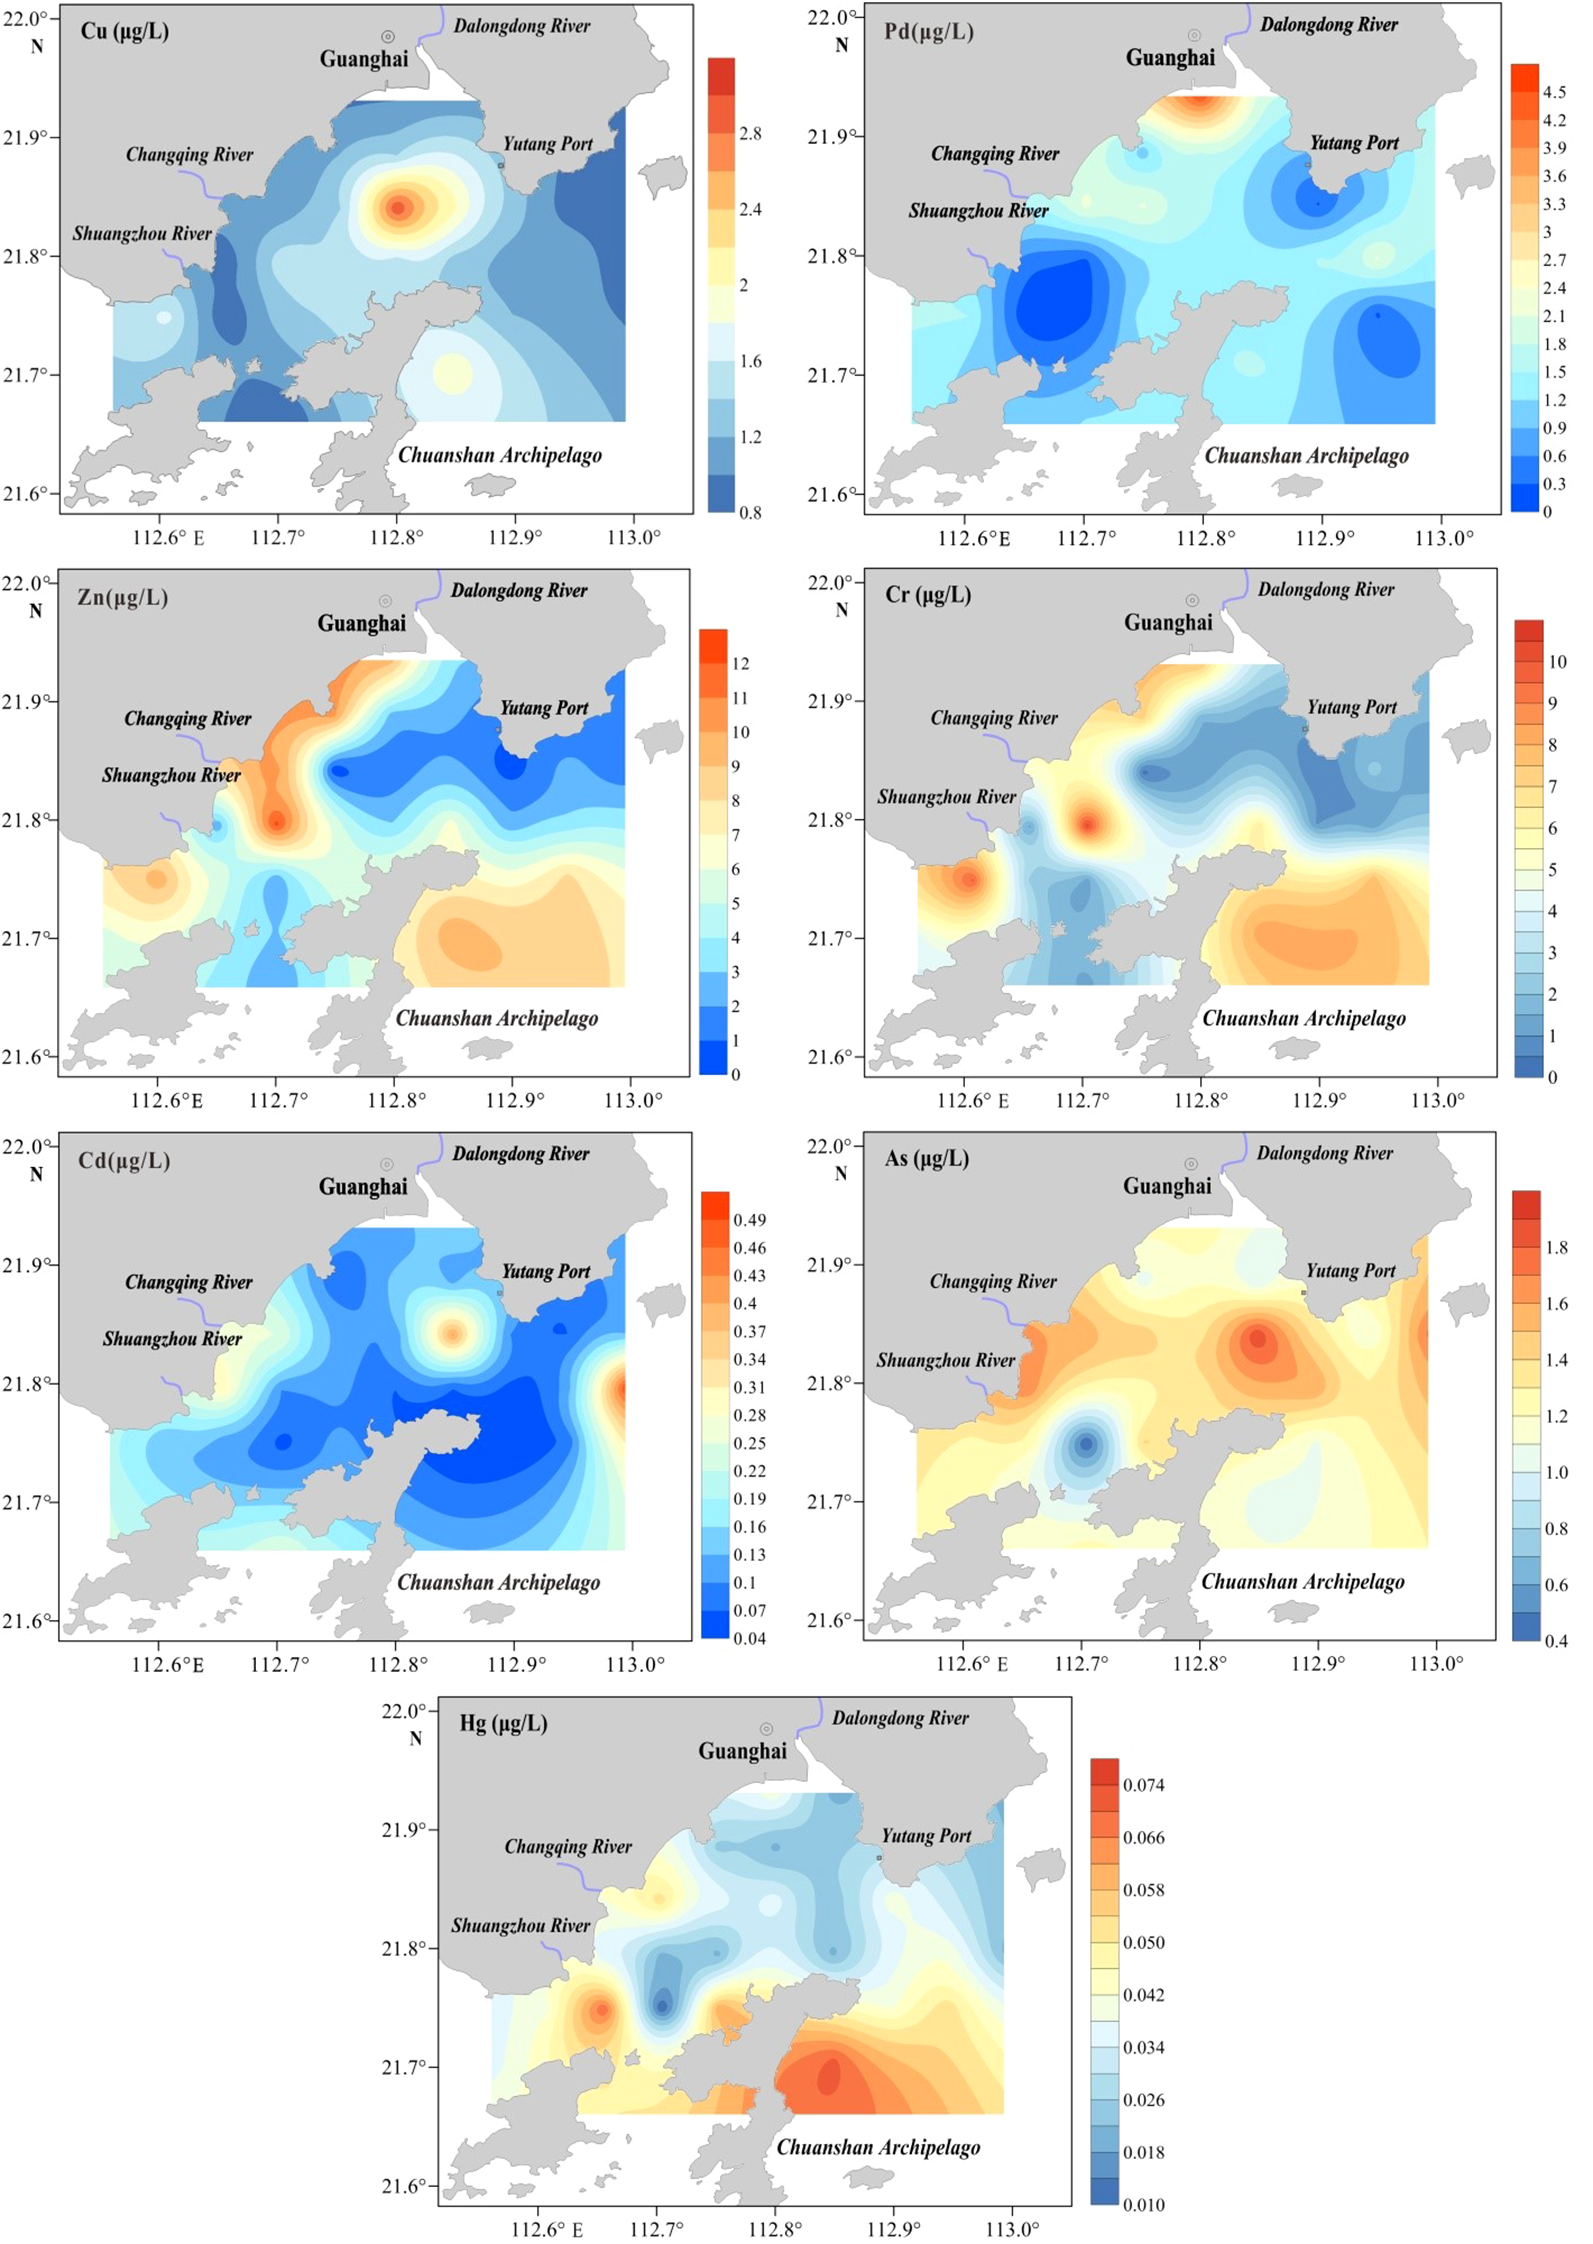
Spatial distributions of Cu, Pb, Zn, Cr, Cd, As, and Hg in the seawaters.
3.2 Assessment of heavy metal contamination in surface sediments
Igeo analysis of the seven heavy metals in the Guanghai Bay sediments revealed distinct contamination patterns. The measured Igeo ranges were as follows: Zn (-3 to -0.91), Cr (-6.13 to -2.94), Cu (-4.82 to -3.18), Pb (-2.09 to 0.32), Cd (-1.07 to 2.48), As (-3.97 to -3.04), and Hg (-3.7 to -1.38), with corresponding mean values of -1.93, -3.67, -3.71, -0.78, 1.03, -3.46, and -2.28 (Table 5). The contamination assessment showed that Cd had the highest mean pollution level, followed by Cr, Cu, Hg, As, Pb, and Zn. Notably, 62.5% of the sampling locations showed Cd contamination (Igeo > 0), whereas Cr exceeded background levels in 12.5% of the samples (Figure 4). According to Müller’s classification system (Muller, 1981), over 50% of the southwestern sediments were slightly to heavily contaminated by Cd (Igeo 0-3).
Table 5
| Parameters | Cu | Pb | Zn | Cr | Cd | As | Hg | |
|---|---|---|---|---|---|---|---|---|
| Surface sediments | ||||||||
| Mbackgrounda(μg/g) | 17 | 36 | 47.3 | 50.5 | 0.056 | 8.9 | 0.078 | |
| Igeo | Range | -3 to -0.91 | -6.13 to -2.94 | -4.82 to -3.18 | -2.09- 0.32 | -1.07-2.48 | -3.97 to -3.04 | -3.7 to -1.38 |
| Average | -1.93 | -3.67 | -3.71 | -0.78 | 1.03 | -3.46 | -2.28 | |
| Range | 0.94-4 | 0.11-0.98 | 0.05-0.17 | 0.71-3.74 | 21.43-251.79 | 0.96-1.82 | 4.62-23.08 | |
| Average | 2.20 | 0.65 | 0.12 | 1.87 | 130.58 | 1.39 | 13.37 | |
| RI (average) | 32.33-270.88 (150.03) | |||||||
| Contributions to RI | 1.46% | 0.43% | 0.08% | 1.25% | 86.95% | 0.93% | 8.90% | |
| Surface seawaters | ||||||||
| Cf | Range | 0.17-0.6 | 0.02-4.52 | 0.02-0.62 | 0.01-0.21 | 0.05-0.49 | 0.02-0.09 | 0.2-1.42 |
| Average | 0.26 | 1.34 | 0.24 | 0.075 | 0.14 | 0.063 | 0.72 | |
| WQI (average) | 0.13-0.91 (0.41) | |||||||
| Range | 0.84-3 | 0.1-22.6 | 0.02-0.62 | 0.01-0.41 | 1.5-14.7 | 0.17-0.92 | 8-56.8 | |
| Average | 1.32 | 6.71 | 0.24 | 0.15 | 4.34 | 0.63 | 28.69 | |
| RI (average) | 12.56-70.12 (42.08) | |||||||
| Contributions to RI | 3.14% | 15.93% | 0.58% | 0.36% | 10.32% | 1.50% | 68.17% | |
Background value, Igeo, , RI values for surface sediments and Cf, WQI, RI values for surface seawaters of heavy metals in Guanghai Bay.
Baseline values of heavy metals are the elemental values in the soil in Guangdong, China (CNEMC, 1990).
Figure 4
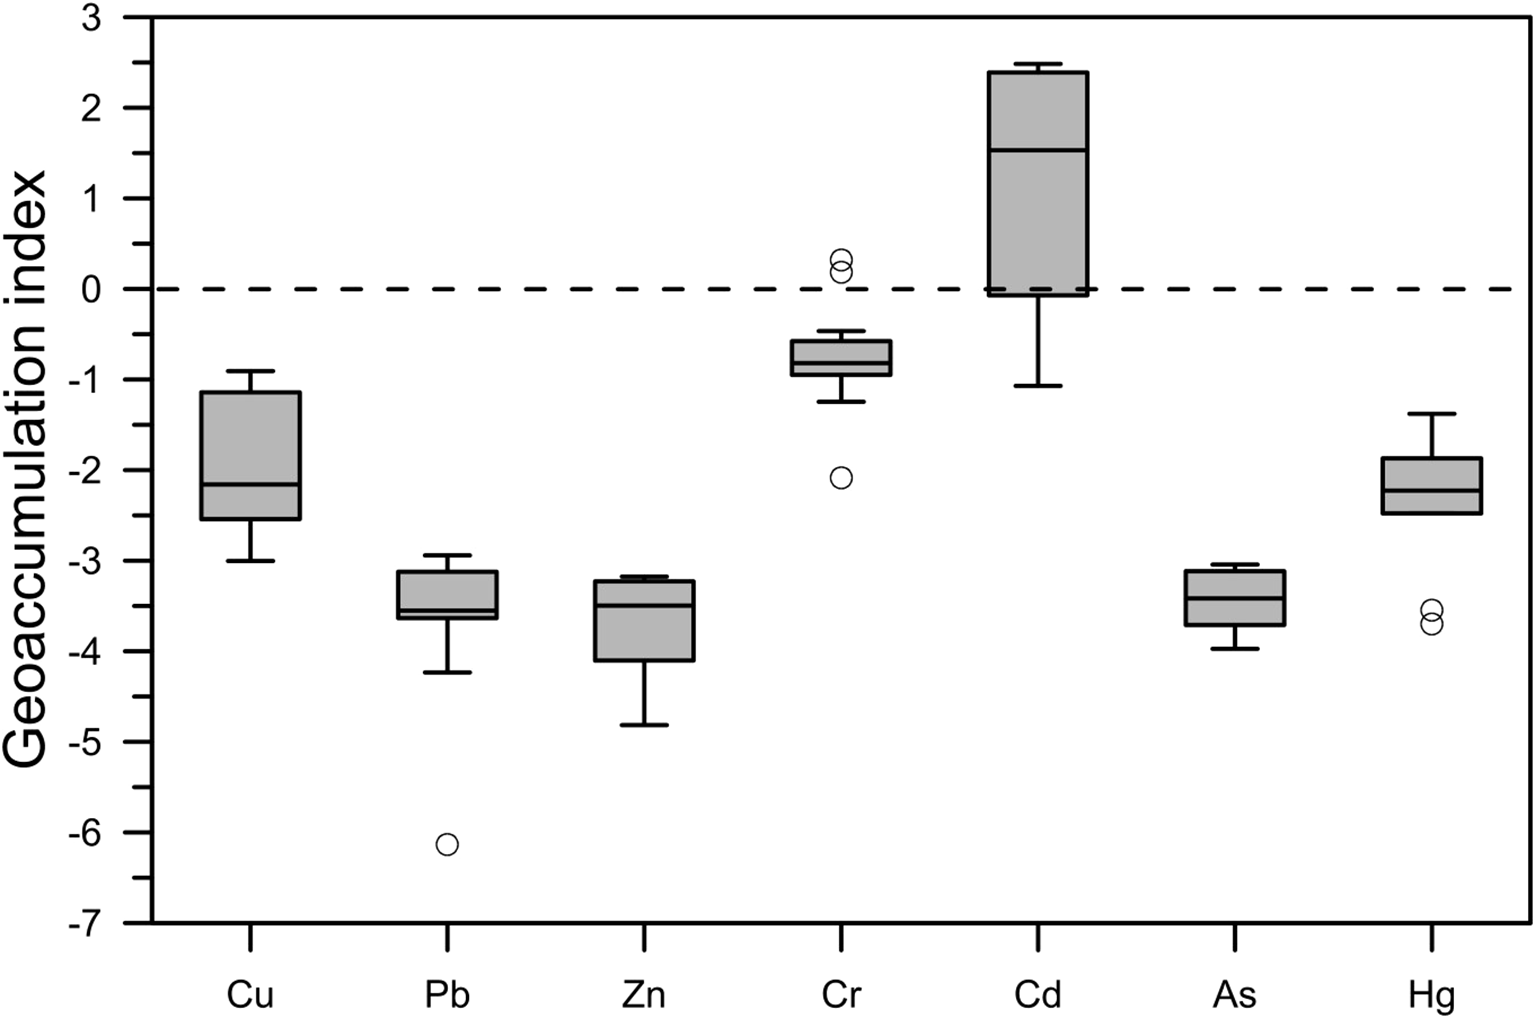
The Igeo of Cu, Pb, Zn, Cr, Cd, As, and Hg in the sediments in Guanghai Bay.
The ecological risk assessment revealed the following metal toxicity sequence: Cd > Hg > Cu > Cr > As > Pb > Zn (Table 5). Although most metals showed minimal risk (mean < 40), Cd raised ecological concerns with risk values ranging from 21.43 to 251.79, which correspond to moderate-to-high risk criteria established in previous studies. The total potential ecological risk index (RI) for the study area ranged from 32.33 to 270.88, with an average of 150.03 (Table 5), indicating a moderate overall ecological risk. Notably, six sampling stations in the central and western regions of the study area demonstrated substantial ecological risks, with RI values ranging from 210 to 420 (Figure 5). Further examination of the contributions of specific heavy metals to the overall RI revealed that Cd was the most significant contributor, accounting for 86.95% of the total risk (Table 5). This suggests that Cd contamination is the primary driver of ecological risk in the study area (Tam and Wong, 2000).
Figure 5
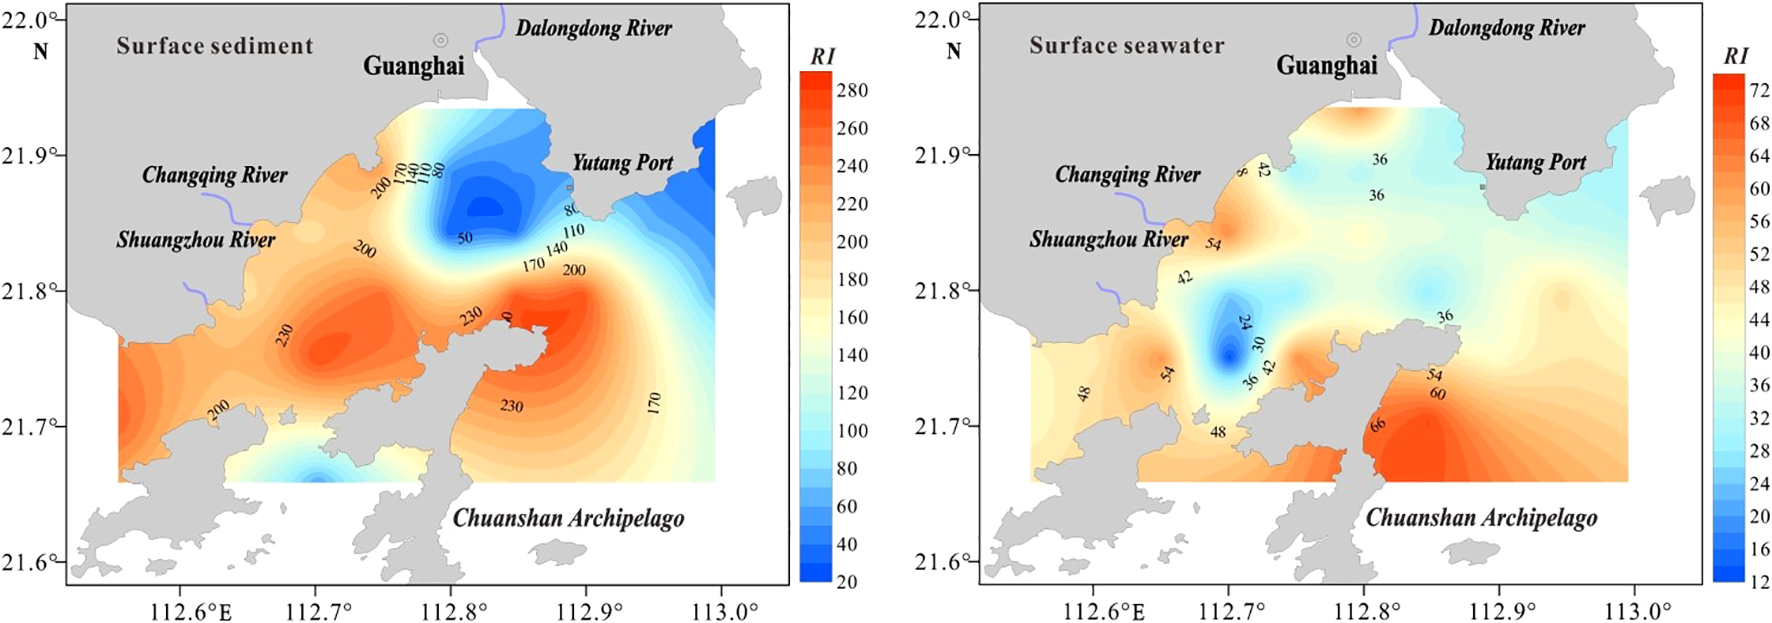
The distribution of the comprehensive potential ecological risk indexes in the sediment and seawater.
3.3 Pollution status and ecological evaluation of surface seawaters
The Cf values of the heavy metals in seawater are shown in Table 5. Notably, Hg contamination was most pronounced at six southern stations, where Cf values were above 1 but remained below 3, indicating moderate Hg pollution. Furthermore, approximately 80% of the stations had moderate Pb pollution, with one station classified as extremely polluted. The WQI across all sites ranged from 0.13 to 0.91, which was consistently less than 1, suggesting that the overall seawater quality in Guanghai Bay remained good (Ramadan et al., 2021).
Regarding ecological risk assessment, the single-factor potential ecological risk indices () for heavy metals in surface seawater were in the following descending order: Hg > Pb > Cd > Cu > As > Zn > Cr (Table 5). At all sampling sites, the levels remained below 40, indicating low ecological risk. The integrated potential ecological risk index (RI) ranged from 12.56 to 70.12, with an average of 42.08 (Table 5, Figure 5), consistent with previous findings (Küikrer and Mutlu, 2019) that confirmed a low overall ecological risk in the investigated region.
3.4 Bioaccumulation potential and ecotoxicological implications
The average standard index of heavy metal content exhibited distinct patterns across the three groups: in crustaceans, the order was Cr > Zn > As > Hg > Cd > Cu > Pb; in mollusks, As > Zn > Cr > Cu > Hg > Cd > Pb; and Zn > Cr > Cd > As > Cu > Pb > Hg (Table 6). Notably, all heavy metal standard indices in these marine organisms were less than one, indicating compliance with the established biological quality benchmarks.
Table 6
| Species | Stations | Value | Cu | Pb | Zn | Cr | Cd | As | Hg |
|---|---|---|---|---|---|---|---|---|---|
| All | 16 | Range | 0.02-0.15 | 0-0.05 | 0.04-0.28 | 0.03-0.3 | 0.01-0.3 | 0.05-0.14 | 0-0.08 |
| Average | 0.05 | 0.019 | 0.11 | 0.158 | 0.07 | 0.09 | 0.046 | ||
| Crustaceans | 5 | Range | 0.02-0.1 | 0.02-0.04 | 0.07-0.11 | 0.2-0.3 | 0.03-0.07 | 0.07-0.1 | 0.06-0.08 |
| Average | 0.04 | 0.032 | 0.09 | 0.265 | 0.05 | 0.08 | 0.065 | ||
| Mollusks | 7 | Range | 0.02-0.07 | 0-0.01 | 0.04-0.07 | 0.03-0.08 | 0.01-0.03 | 0.05-0.1 | 0-0.07 |
| Average | 0.05 | 0.005 | 0.06 | 0.051 | 0.02 | 0.07 | 0.047 | ||
| Fish | 4 | Range | 0.02-0.15 | 0.02-0.05 | 0.1-0.28 | 0.12-0.28 | 0.03-0.3 | 0.07-0.14 | 0-0.04 |
| Average | 0.06 | 0.030 | 0.22 | 0.210 | 0.16 | 0.12 | 0.021 |
Standard index (Pi) of heavy metal content in organisms in the study area.
The BSAF values for Cu, Zn, Cd, and Hg in marine organisms consistently exceeded one (Table 7), indicating their ability to accumulate these metals from surface sediments (Dean et al., 2007). Although heavy metal concentrations in seawater are typically low, pollutants can undergo biomagnification through the food chain, resulting in higher concentrations at higher trophic levels. Despite the low quantities of heavy metals in the surface seawater in Guanghai Bay, all metals examined had BWAF values of more than one, except Pb and Cr. This suggests that marine organisms in the study area have a high capacity to enrich heavy metals in seawater (Hoai et al., 2020). From a human health perspective, mollusks—particularly L. duvernoyi and T. bacillum—showed the highest accumulation of Pb, Zn, As, and Hg, suggesting potential health risks if consumed frequently from contaminated areas. The BAF values observed in Guanghai Bay are comparable to those reported in other industrialized bays in Southern China, such as the Pearl River Estuary (Zhang et al., 2015), but lower than those in heavily polluted systems like Ha Long Bay, Vietnam (Hoai et al., 2020). This indicates moderate but significant bioaccumulation potential, warranting continued monitoring, especially for locally consumed shellfish species.
Table 7
| Species | Stations | BSAF | BWSF | ||||||||||||
|---|---|---|---|---|---|---|---|---|---|---|---|---|---|---|---|
| Cu | Pb | Zn | Cr | Cd | As | Hg | Cu | Pb | Zn | Cr | Cd | As | Hg | ||
| Crustaceans | 5 | 0.21 | 0.012 | 1.80 | 0.009 | 0.16 | 0.61 | 0.60 | 2.45 | 0.03 | 1.28 | 0.07 | 0.20 | 0.41 | 0.24 |
| 7 | 0.48 | 0.018 | 2.15 | 0.008 | 0.31 | 0.33 | 0.40 | 4.40 | 0.39 | 7.16 | 0.33 | 2.33 | 1.53 | 1.67 | |
| 11 | 0.16 | 0.009 | 1.66 | 0.007 | 0.12 | 0.92 | 0.27 | 1.52 | 0.06 | 2.31 | 0.07 | 0.45 | 0.64 | 0.58 | |
| 13 | 0.94 | 0.006 | 1.48 | 0.009 | 0.74 | 0.56 | 0.55 | 6.97 | 0.01 | 1.13 | 0.06 | 1.17 | 0.46 | 0.28 | |
| 19 | 2.17 | 0.016 | 2.57 | 0.011 | 3.00 | 0.58 | 0.55 | 4.78 | 0.04 | 4.56 | 0.17 | 0.29 | 0.39 | 0.48 | |
| Mollusks | 3 | 0.39 | 0.010 | 2.22 | 0.010 | 0.32 | 0.59 | 0.86 | 4.97 | 0.07 | 5.55 | 0.31 | 0.33 | 0.38 | 0.59 |
| 8 | 0.75 | 0.039 | 5.65 | 0.004 | 1.00 | 0.41 | 0.35 | 4.89 | 0.02 | 7.30 | 0.15 | 0.28 | 0.47 | 0.22 | |
| 14 | 1.50 | 0.009 | 1.95 | 0.010 | 1.63 | 0.57 | 2.20 | 4.76 | 0.02 | 5.22 | 0.25 | 0.93 | 0.62 | 1.05 | |
| 15 | 0.40 | 0.020 | 1.60 | 0.003 | 4.25 | 0.59 | 0.82 | 0.76 | 0.06 | 8.26 | 0.15 | 1.55 | 0.72 | 0.21 | |
| 20 | 1.59 | 0.011 | 3.34 | 0.006 | 0.27 | 0.62 | 0.66 | 5.35 | 0.05 | 2.75 | 0.04 | 1.71 | 0.52 | 1.00 | |
| 25 | 1.36 | 0.016 | 4.34 | 0.007 | 1.60 | 0.39 | 0.59 | 4.80 | 0.05 | 6.08 | 0.09 | 2.29 | 0.45 | 0.46 | |
| 29 | 1.15 | 0.002 | 2.34 | 0.010 | 1.88 | 0.94 | 0.00 | 5.77 | 0.01 | 3.94 | 0.15 | 0.31 | 0.64 | 0.00 | |
| Fish | 1 | 0.29 | 0.020 | 1.50 | 0.009 | 0.41 | 0.49 | 0.40 | 2.26 | 0.07 | 2.02 | 0.10 | 0.82 | 0.50 | 0.36 |
| 9 | 0.04 | 0.007 | 1.18 | 0.004 | 0.05 | 0.73 | 0.00 | 0.27 | 0.03 | 0.86 | 0.05 | 0.29 | 0.71 | 0.00 | |
| 18 | 0.28 | 0.005 | 1.20 | 0.010 | 0.67 | 0.45 | 0.19 | 0.75 | 0.02 | 1.65 | 0.15 | 0.33 | 0.74 | 0.22 | |
| 23 | 0.01 | 0.019 | 4.21 | 0.003 | 0.32 | 0.21 | 0.32 | 0.37 | 0.06 | 4.72 | 0.30 | 2.50 | 0.21 | 0.19 | |
BAF of heavy metals in Guanghai Bay.
3.5 Potential sources of heavy metals
Identifying the sources of heavy metals is crucial for developing effective pollution control strategies. In this study, PCA was employed to discern the potential origins of heavy metals in the surface seawater and sediments of Guanghai Bay. The analysis extracted three principal components (PCs) for seawater and two for sediments (Table 8), with eigenvalues greater than 1, collectively explaining 66.68% and 64.63% of the total variance, respectively. To strengthen source attribution, Pearson correlation analysis was conducted alongside PCA (Table 4). This provides a robust basis for interpreting the underlying data structure and pollution sources (Waykar and Petare, 2016).
Table 8
| Parameter | Surface seawater | Surface sediments | |||
|---|---|---|---|---|---|
| PC1 | PC2 | PC3 | PC1 | PC2 | |
| Cu | 0.09 | -0.16 | 0.90 | 0.84 | 0.08 |
| Pb | 0.05 | 0.44 | 0.38 | 0.55 | 0.22 |
| Zn | 0.92 | 0.29 | -0.06 | 0.84 | -0.35 |
| Cr | 0.92 | 0.24 | 0.04 | 0.52 | -0.70 |
| Cd | -0.48 | 0.64 | -0.06 | 0.89 | 0.15 |
| As | -0.37 | 0.78 | 0.10 | -0.52 | 0.02 |
| Hg | 0.37 | 0.29 | -0.19 | 0.45 | 0.76 |
| Eigenvalues | 2.2 | 1.46 | 1.01 | 3.25 | 1.27 |
| Percentage of variance | 31.4 | 20.85 | 14.43 | 46.48 | 18.15 |
| Cumulative % eigenvector | 31.4 | 52.25 | 66.68 | 46.48 | 64.63 |
Extracted three principal component in surface seawater and two principal components for surface sediments.
For surface seawater, the PCA results revealed distinct source patterns:
PC1, which accounted for 31.4% of the total variance, was characterized by high positive loadings of Zn (0.92) and Cr (0.92). This component likely represents a mixed source influenced by terrestrial inputs and riverine transport. The rivers draining into Guanghai Bay, such as the Dalongdong, Changqing, and Shuangzhou Rivers, carry weathered crustal materials and soil particles, which are naturally enriched with Zn and Cr. Concurrently, this component also points to industrial emissions. The presence of industrial parks in the surrounding areas could contribute to these metals through discharges of wastewater, particularly from metal plating, alloy manufacturing, and tannery operations (Nour et al., 2022).
PC2, explaining 20.85% of the variance, showed strong positive loadings for As (0.78), Cd (0.64), and a moderate loading for Pb (0.44). This combination is highly indicative of anthropogenic activities related to agriculture and traffic. As and Cd are common constituents of pesticides, herbicides, and phosphate fertilizers used in intensive agricultural practices. The widespread agricultural land in the watershed of Guanghai Bay is a plausible source for these elements, which are carried into the bay via runoff. Pb, despite the phase-out of leaded gasoline, can still be released from vehicle emissions through the wear of tires and brakes, as well as from historical accumulations in soils. The significant spatial heterogeneity of Pb in the seawater, particularly along the northwestern coast with higher traffic density, supports this inference.
PC3, contributing 14.43% of the variance, was dominated by a very high loading of Cu (0.90). This suggests a more specific and localized source. Copper pollution often stems from industrial activities such as electronics manufacturing, shipbuilding, and marine antifouling paints used on vessels and aquaculture facilities. The presence of ports and shipping activities in and around Guanghai Bay could be a significant contributor to Cu levels. Alternatively, the dissolution of Cu from natural mineral deposits in the local geology cannot be entirely ruled out.
For surface sediments, the source identification showed a different pattern, reflecting the integrative and cumulative nature of sedimentary records:
PC1, which accounted for the largest proportion of variance (46.48%), exhibited high loadings for Cd (0.89), Cu (0.84), Zn (0.84), and a moderate loading for Cr (0.52). This component represents a complex mixture of both natural geological backgrounds and anthropogenic inputs. The parent rocks and soils in the Pearl River Delta region naturally contain these metals. However, the strong signal, especially for Cd, underscores substantial anthropogenic contributions. Industrial wastewater discharge from nearby manufacturing sectors, combined with agricultural runoff (as Cd is a known contaminant in fertilizers), are likely major pathways for these metals to enter the sedimentary environment. The fact that these metals co-vary in PC1 indicates they may share common sources or similar transport and deposition pathways into the bay. Strong correlations between Cd-Cu-Zn in sediments support their common anthropogenic origin in PC1.
PC2, explaining 18.15% of the variance, was defined by a very high loading for Hg (0.76) and a negative loading for Cr (-0.70). The strong association with Hg points to a specific anthropogenic source. Coal combustion in power plants and industrial boilers is a well-documented primary source of atmospheric Hg, which can be deposited over land and water bodies. Additionally, historical use in instruments, electrical equipment, and catalysts may contribute to its presence. The negative loading of Cr suggests that its distribution in sediments is controlled by a different set of processes or sources than the other metals, possibly related to its geochemical behavior or a distinct natural origin.
The PCA results are further corroborated by the spatial distribution patterns discussed earlier. The high concentrations of Cu, Pb, Zn, and Cd in the northwestern sediments adjacent to the estuaries align with the PC1 and PC2 interpretations, highlighting the role of riverine inputs carrying pollutants from inland agricultural and industrial areas. Similarly, the elevated Hg in sediments between the Chuan River and the Chuanshan Archipelago is consistent with atmospheric deposition or point sources related to PC2.
In summary, the heavy metal pollution in Guanghai Bay stems from a combination of natural geological weathering and multiple anthropogenic activities. Cadmium emerges as a pollutant of primary concern, with significant ecological risk in sediments likely originating from industrial discharges and agricultural practices. The presence of Hg and Pb in seawater and sediments underscores the ongoing influences of coal combustion and traffic-related emissions. The distinct sources identified for Cu suggest the need to scrutinize specific local industrial and shipping operations. These findings clearly indicate that human activities are the dominant driver of heavy metal enrichment in Guanghai Bay, necessitating targeted source control measures to safeguard the health of this economically and ecologically valuable estuarine-bay-archipelago ecosystem.
4 Conclusion
This study provides a comprehensive assessment of heavy metal pollution in the seawater, sediments, and marine organisms of Guanghai Bay, a typical estuarine-bay-archipelago ecosystem in the northern South China Sea. The main findings are summarized as follows:
The concentrations of heavy metals in seawater and sediments generally complied with Class I standards of Chinese marine environmental quality. However, spatial variability was high, indicating significant external influences. Cd was identified as the primary pollutant in sediments, with moderate to high ecological risks in certain areas, contributing over 86% to the RI. Hg and Pb also showed localized moderate pollution in seawater. Marine organisms generally met biological quality standards, though notable bioaccumulation of Cu, Zn, Cd, and Hg was observed, particularly in mollusks and crustaceans, highlighting their potential as bioindicators.
PCA revealed that heavy metals in seawater originated from terrestrial inputs, agricultural and industrial discharges, and traffic-related emissions. Sediment metals were derived from both natural weathering and anthropogenic activities, with Cd and Hg being particularly influenced by human sources. The study underscores that rapid urbanization and economic development in coastal regions like Guanghai Bay intensify heavy metal inputs, necessitating targeted pollution control and continuous monitoring.
In conclusion, while the overall environmental quality of Guanghai Bay remains acceptable, localized contamination and ecological risks—especially from Cd and Hg—warrant attention. Effective management strategies should focus on controlling industrial and agricultural discharges, regulating shipping activities, and strengthening the monitoring of key pollutants to safeguard the ecological health and sustainable development of this valuable coastal ecosystem.
It is important to note that this study is based on data collected in 2015. Given the rapid coastal development in the region, the absolute values reported here may not represent the current state of Guanghai Bay. However, the identified patterns and relationships provide a critical baseline for future comparative work.
Statements
Data availability statement
The raw data supporting the conclusions of this article will be made available by the authors, without undue reservation.
Author contributions
YJ: Writing – original draft, Funding acquisition, Data curation, Conceptualization. JL: Methodology, Writing – original draft, Formal Analysis. ZL: Project administration, Writing – original draft, Software. JD: Resources, Writing – original draft, Investigation. YW: Writing – original draft, Validation, Data curation. ZT: Methodology, Supervision, Writing – original draft, Investigation. WX: Writing – original draft, Validation, Resources. ZH: Methodology, Resources, Writing – original draft. CD: Supervision, Software, Writing – original draft.
Funding
The author(s) declared that financial support was not received for this work and/or its publication.
Conflict of interest
Authors WX, ZH, CD were employed by Shandong Luzhen Technology Engineering Co., Ltd.
The remaining authors declare that the research was conducted in the absence of any commercial or financial relationships that could be construed as a potential conflict of interest.
Generative AI statement
The author(s) declare that no Generative AI was used in the creation of this manuscript.
Any alternative text (alt text) provided alongside figures in this article has been generated by Frontiers with the support of artificial intelligence and reasonable efforts have been made to ensure accuracy, including review by the authors wherever possible. If you identify any issues, please contact us.
Publisher’s note
All claims expressed in this article are solely those of the authors and do not necessarily represent those of their affiliated organizations, or those of the publisher, the editors and the reviewers. Any product that may be evaluated in this article, or claim that may be made by its manufacturer, is not guaranteed or endorsed by the publisher.
References
1
Administration of quality supervision, inspection and quarantine of the People’s Republic of China (AQSIQ) (1997). Sea Water Quality Standard (GB 3097-1997) (Beijing: Standards Press of China).
2
Administration of quality supervision, inspection and quarantine of the People’s Republic of China (AQSIQ) (2002). Marine Sediment Quality of China (GB 18668-2002) (Beijing: Standards Press of China).
3
Avvari L. Basuri C. Chari H. Tirukkovalluri S. (2022). Assessment of heavy metal distribution in seawaters of Kakinada Bay, a tropical mangrove-rich coastal environment. Mar. pollut. Bull.181, 113877. doi: 10.1016/j.marpolbul.2022.113877
4
China National Environmental Monitoring Center (CNEMC) (1990). Chinese Elemental Background Values for Soils (Beijing: Chinese Environmental Science Press).
5
Dean R. J. Shimmield T. M. Black K. D. (2007). Copper, zinc and cadmium in marine cage fish farm sediments: an extensive survey. Environ. pollut.145, 84–95. doi: 10.1016/j.envpol.2006.03.050
6
Hakanson L. (1980). An ecological risk index for aquatic pollution control.a sedimentological approach. Water Res.14, 975–1001. doi: 10.1016/0043-1354(80)90143-8
7
Hoai N. Thanh ‘T. Manh H. Thung D. Johnstone R. (2020). An assessment of heavy metal contamination in the surface sediments of Ha Long Bay, Vietnam. Environ. Earth Sci.79, 436. doi: 10.1007/s12665-020-09192-z
8
Küikrer S. Mutlu E. (2019). Assessment of surface water quality using water quality index and multivariate statistical analyses in saraydüzŭ dam lake, Turkey. Environ. Monit. Assess.191, 1–16.
9
Kwok C. Liang Y. Wang H. Dong Y. Leung S. Wong M. (2014). Bioaccumulation of heavy metals in fish and Ardeid at Pearl River estuary, China. Ecotoxicol. Environ. Saf.106, 62–67. doi: 10.1016/j.ecoenv.2014.04.016
10
Macdonald D. D. Carr R. S. Calder F. D. Long E. R. Ingersoll C. G. (1996). Development and evaluation of sediment quality guidelines for Florida coastal waters. Ecotoxicology5, 253–278. doi: 10.1007/BF00118995
11
Madadi R. Mejjad N. De-la-Torre G. E. (2023). Geochemical speciation, ecological risk, and source identification of heavy metal(loid)s in sediments and waters from Musa Estuary, Persian Gulf. Mar. pollut. Bull.190, 114836. doi: 10.1016/j.marpolbul.2023.114836
12
Muller G. (1981). Die Schwermetallbelastung der sediment des Neckars und seiner Nebenflusse: eine Bestandsaufnahme. Chemiker Zeitung105, 157–164.
13
Nour H. E. Helal S. A. Wahab M. A. (2022). Contamination and health risk assessment of heavy metals in beach sediments of red sea and Gulf of Aqaba, Egypt. Mar. pollut. Bull.177, 113517. doi: 10.1016/j.marpolbul.2022.113517
14
Qiu J. Yin P. Liu J. Cao K. Wang S. (2019). Historical records of trace metals in core sediments from Jiangsu coastal are, China. Mar. pollut. Bull.149, 110625. doi: 10.1016/j.marpolbul.2019.110625
15
Ramadan F. Nour H. Aita S. Zahran H. (2021). Evaluation of heavy metals accumulation risks in water of the Qalubiya drain in East Delta, Egypt. Arab. J. Geosci.14, 1750. doi: 10.1007/s12517-021-08198-6
16
Tam N. F. Y. Wong Y. S. (2000). Spatial variation of heavy metals in surface sediments of Hong Kong mangrove swamps. Environ. pollut.110, 195–205. doi: 10.1016/S0269-7491(99)00310-3
17
Waykar B. Petare R. (2016). Studies on monitoring the heavy metal concentrations in the water, sediment and snail species in Latipada reservoir. J. Environ. Biol.37, 585–589.
18
Xu Y. Gao H. Wei X. Zhu J. (2021). Heavy metals and their ecological risk in the surface sediments of Laizhou Bay. Period. Ocean Uni. China51, 74–85. doi: 10.16441/j.cnki.hdxb.20200326
19
Yu X. Yan Y. Wang W. (2010). The distribution and speciation of trace metals in surface sediments fromthe Pearl River estuary and the Daya Bay, southern China. Mar. pollut. Bull.60, 1364–1371. doi: 10.1016/j.marpolbul.2010.05.012
20
Zhang L. Shi Z. Jiang Z. Zhang J. Wang F. Huang X. (2015). Distribution and bioaccumulation of heavy metals in marine organisms in east and west Guangdong coastal regions, south China. Mar. pollut. Bull.101, 930–937. doi: 10.1016/j.marpolbul.2015.10.041
21
Zhang P. Ye Z. Huang L. Wang X. Zhang W. (2025). Heavy metal alarm of marine fish consumption surrounding Qiongzhou Strait, the South China Sea. Front. Mar. Sci.12. doi: 10.3389/fmars.2025.1557963
22
Zhang D. Zhang X. Tian L. Ye F. Huang X. Zeng Y. et al . (2013). Seasonal and spatial dynamics of trace elements in water and sediment from Pearl River Estuary, South China. Environ. Earth Sci.68, 1053–1063. doi: 10.1007/s12665-012-1807-8
23
Zhao G. Lu Q. Ye S. Yuan H. Ding X. Wang J. (2016). Assessment of heavy metal contamination in surface sediments of the west Guangdong coastal region, China. Mar. pollut. Bull.108, 268–274. doi: 10.1016/j.marpolbul.2016.04.057
Summary
Keywords
heavy metal pollution, Guanghai Bay, bioaccumulation, ecological risk assessment, source identification
Citation
Jin Y, Luo J, Lu Z, Du J, Wang Y, Tian Z, Xu W, He Z and Dou C (2026) Comprehensive assessment and source apportionment of heavy metals in a typical estuarine-bay system: a case study of Guanghai Bay, South China Sea. Front. Mar. Sci. 12:1722611. doi: 10.3389/fmars.2025.1722611
Received
10 October 2025
Revised
18 November 2025
Accepted
21 November 2025
Published
05 January 2026
Volume
12 - 2025
Edited by
Qi Wang, Shandong Jianzhu University, China
Reviewed by
Junliang Gao, Jiangsu University of Science and Technology, China
Chao Chen, Suzhou University of Science and Technology, China
Updates
Copyright
© 2026 Jin, Luo, Lu, Du, Wang, Tian, Xu, He and Dou.
This is an open-access article distributed under the terms of the Creative Commons Attribution License (CC BY). The use, distribution or reproduction in other forums is permitted, provided the original author(s) and the copyright owner(s) are credited and that the original publication in this journal is cited, in accordance with accepted academic practice. No use, distribution or reproduction is permitted which does not comply with these terms.
*Correspondence: Ziwen Tian, tesewen@fio.org.cn
Disclaimer
All claims expressed in this article are solely those of the authors and do not necessarily represent those of their affiliated organizations, or those of the publisher, the editors and the reviewers. Any product that may be evaluated in this article or claim that may be made by its manufacturer is not guaranteed or endorsed by the publisher.