 Enyan Zhu
 Aohan Ye1
 Lisu Chen
- 1College of Transport and Communications, Shanghai Maritime University, Shanghai, China
- 2College of Ocean Science and Engineering, Shanghai Maritime University, Shanghai, China
Introduction: Rapid expansion of the shipping industry is not only boosting trade and economic growth, but also leading to increased CO2 emissions, which presents substantial challenges to climate change mitigation. Therefore, it is of great significant to simulate the berthing ship emission reduction potential under the context of global change.
Methods: Based on the spatial-temporal evolution as well as the driving factors of the port ship CO2 emissions, this study predicted the future port ship CO2 emission patterns in China.
Results: Results indicated an obvious divergence in CO2 spatial-temporal distributions, and the high-emission areas had shifted from the northern to the southern ports. The volume of waterway transportation, road transportation, Gross Domestic Product (GDP) and the proportion of the secondary industry were the primary drivers of the port ship CO2 emissions, though the influence degree of each factor varied across different ports.
Discussion: Finally, scenario-based forecasts suggested that advancing ship energy efficiency technologies and formulate robust emission reduction policies were urgently needed to mitigate the environmental impact of port activities.
Shipping industry serves as the cornerstone of international trade logistics, as it is the predominant transportation mode for global commerce. Statistical evidence indicated that maritime transportation accounted for approximately 80% of international trade logistics (Alzahrani et al., 2021). Meanwhile, the extensive maritime activity also contributed significantly to environmental problems, particularly carbon dioxide (CO2) emissions. According to the United Nations’ annual shipping industry report, the sector emitted roughly one billion tons of CO2 per year (Yang et al., 2017). Research indicated that CO2 emissions from ports were primarily attributed to ship activities and the operations of loading and unloading machinery, which together accounted for 59.80% of total emissions. Of this, emissions from ships at berth contributed approximately 38% (Gibbs et al., 2014). Statistically, approximately 70% of global shipping CO2 emissions originated from port coastal areas, with 60-90% occurring during ship berthing, resulting in emissions that were tenfold those of the ports’ own operations (Budiyanto et al., 2022; Kim et al., 2022; McDuffie et al., 2020). Thus, a systematic analytical framework is essential to bridge the historical evolution of berthing ship CO2 emissions and the forthcoming low-carbon transition pathways.
Researches on CO2 emission measurement have yielded substantial results, forming a CO2 emission measurement system that incorporated the bottom-up approach based on ship activities and top-down approach based on fuel consumption (Tovar and Wall, 2019; Villalba and Gemechu, 2011), but the research on CO2 emission measurement in ports has not yet formed a unified standard (Wang and Li, 2023). For top-down measurements, the findings of the CO2 emission model for Chinese intermodal ports suggest that increasing the proportion of rail-sea and river-sea transportation to an optimal level could lead to greater energy savings, reduced emissions, and improved economic benefits (Jiang et al., 2012). Additionally, further studies have identified container ships and car carriers as major sources of emissions within ports (Chang et al., 2013). CO2 emissions from ships were also calculated by considering factors such as transportation demand, transportation efficiency, and marine fuel consumption (Yang et al., 2017). Other scholars estimated CO2 emissions by calculating the carbon footprint (CF) (Botana et al., 2023). To address potential inconsistencies induced by advancements in port technologies and variations in operational productivity, this study introduces a refined classification of berthing ship types and employs a spatially explicit, bottom-up estimation framework for port ship CO2 emissions, thereby overcoming the limitations of traditional econometric regression approaches.
Spatial-temporal observing of port ship CO2 could provide a data foundation to devise effective energy-saving and emission reduction strategies. Generally, the area with the highest CO2 emission intensity in the port was found near the waterway and berth (Wang et al., 2020). Spatially, CO2 emissions from ports demonstrated significant local clustering, indicating ports with similar geographic locations exhibited similar emission patterns (Wang et al., 2020; Ji et al., 2025). Temporally, the CO2 emissions from Chinese ports varied monthly, with the lowest emissions in February and the highest in May, and this significant difference was attributed to cargo volume adjustments during the Lunar New Year (Yang et al., 2021). Visualization techniques revealed a more intuitive representation of the fluctuating characteristics of emissions over time, highlighting high-emission ship types and emission hotspots (Huang et al., 2017). For instance, ship CO2 emissions in the ports of the U.S. exclusive economic zone (EEZ) decreased by 5.7% from 32.629 Tg in 2019 to 30.741 Tg in 2020 due to the COVID-19 pandemic, and coastal ports exhibited significantly higher emission levels than inland ports (Mou et al., 2024). Moreover, a CO2 emission hotspot identification and extraction method using Data field theory (DFT) was able to both detect CO2 spatial clusters of emissions and reveal the temporal shifts in emission hotspots (Zhou et al., 2023).
For factors influencing port CO2 emissions, scholars utilized various analytical methods such as principal component analysis (Zeng et al., 2023), ordinary least squares (OLS) regression, ridge regression (Wang et al., 2022), Multiple Linear Regression (MLR) and Global Malmquist-Luenberger (GML) (Yu et al., 2022). These studies revealed that water rotation rate was a significant determinant of port CO2 emissions. Factors like hinterland GDP, number of berth, research and development investment (R&D Investment), and environmental regulation was found to have beneficial effects, while the primary business cost was observed to have negatively impacted emissions. However, since CO2 emissions had significant spatial autocorrelation, the assessment and quantification of impact factors should comprehensively consider their spatial effects (Zhu et al., 2022). Given that traditional econometric analysis models often overlook the spatial dependence of research subjects, potentially leading to biased results, this study utilized the geographical detector model (Wang et al., 2010, Wang et al., 2016), which can identify spatial divergence and reveal its driving factors, to analyze the determinants of port CO2 emissions.
For the CO2 future forecasting, studies have shown that regions adopting stringent emission standards were projected to see significant reductions in pollutant emissions, while the impact of global CO2 mitigation policies on future on-road vehicle emissions was relatively minor (Takeshita, 2011). And advanced carbon capture and sequestration (CCS) technologies were posited to enable deep transportation emission reductions exceeding 90% (Pietzcker et al., 2014). If advanced mitigation technologies were adopted, CO2 emissions could peak around 2035 (Ou et al., 2010). Overall, the majority of research concerning the future trajectory of transportation CO2 emissions relied on mathematical statistics or econometric methods, which made direct projections of CO2 emission trends based on economic growth, without taking into account changes in technology iteration, fuel switching and other factors, which may lead to differences in the range of CO2 emission trends under different scenario models. Thus, the scenario analysis method could be an alternative approach to enhance the future forecasting of berthing ship CO2 emissions, so as to help suggest the formulation of port emission reduction measures.
As a leading maritime nation, China is actively aligning national policies with international emission reduction commitments to advance the sustainable and low-carbon transformation of its maritime sector (Chen et al., 2023; Liu et al., 2024). To comprehensively reveal the historical evolution and future trajectories of ship CO2 emissions across China’s coastal ports, this study developed an integrated analytical framework that combined long-term multi-port emission estimation, spatial driver identification using the GeoDetector model, and scenario-based forecasting. In contrast to previous studies that focused on short-term analyses or individual ports, this spatio-temporal predictive framework provided a systematic perspective for examining how economic, industrial, and transportation factors jointly influence emission dynamics and offered empirical evidence to support sustainable port carbon governance strategies.
The main contributions of this study can be summarized as follows:
● Comprehensive Analytical Framework and Data Scope: A unified analytical framework is established to integrate long-term emission estimation, spatial driver identification, and scenario-based forecasting, supported by an extended dataset from 2001 to 2021 covering nine major Chinese coastal ports. The framework connects the historical evolution and future projection of port ship CO2 emissions and provides a robust methodological foundation for national-scale port carbon analysis.
● Mechanism Identification via GeoDetector: GeoDetector quantifies the spatial heterogeneity of port ship CO2 emissions and identifies how key socioeconomic and infrastructural determinants, together with their interaction effects, contribute to regional emission disparities, offering a more rigorous understanding of the dominant factors and their combined influence and thereby deepening insights into the mechanisms underlying variation in port-level carbon emissions.
● Scenario-Based Forecasting and Policy Implications: Multi-scenario simulations are conducted to evaluate the emission reduction potential and target feasibility under different development pathways. The results provide policy-relevant insights for differentiated carbon mitigation strategies and offer scientific guidance for advancing low-carbon transformation and sustainable governance of Chinese ports.
The remainder of the paper is organized as follows. Section 2 presents the study area, data sources, and methodological framework, including the bottom-up CO2 emission estimation model, temporal trend analysis, GeoDetector-based driver analysis, and scenario forecasting design. Section 3 reports the empirical results, covering the spatiotemporal evolution of port ship CO2 emissions, the identification of major driving factors, and the projection of future emission trajectories under multiple scenarios. Section 4 concludes with key findings, policy implications, and directions for future research to advance low-carbon and sustainable port development in China.
2 Methods and data source
2.1 Study area
Nine major coastal ports list as Table 1 were selected as the research cases (Figure 1).
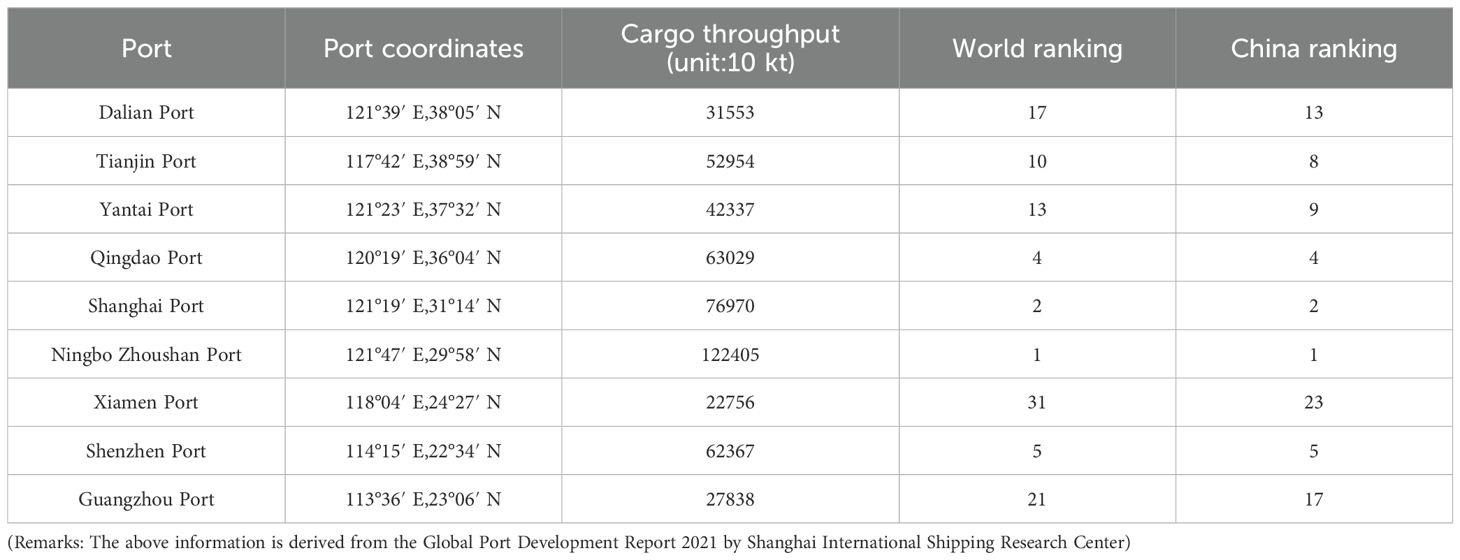
Table 1. Information in the nine ports.

Figure 1. Study area.
2.2 Data sources
The research interval spanned from 2001 to 2021, covering a period of 21 years. The geographical data were sourced from the National Geomatics Center of China (https://www.ngcc.cn/). The average values of energy use per unit of freight turnover for different ship types and the CO2 emission factors for various fuel oil types were derived from the International Maritime Organization (IMO) greenhouse gas studies and previous research (IMO, 2009, IMO, 2014, IMO, 2020; Lee et al., 2016). Data on other variables such as cargo turnover, port throughput, number of berths, wharf length, transportation volume, urban GDP, population size, industrial structure ratios, and energy consumption were obtained from the National Bureau of Statistics of China (NBSC) and annual provincial government reports. To ensure consistency across different data sources and time scales, time-series interpolation was used to fill missing records, and unit standardization was applied to unify measurement units and statistical definitions, improving data comparability and reliability.
2.3 Methods
2.3.1 Ship CO2 emissions
A bottom-up approach was adopted to establish a CO2 emission measurement model based on ship type segmentation. Due to the differences in energy consumption per unit turnover among different ship types and the fact that ship fuel consumption statistics were obtained from fuel supplier sales data or vessel monitoring systems, this study, guided by the IPCC (2006), IPCC (2019) and adapted to the operational characteristics of Chinese coastal ports, undertook the following revisions to the CO2 measurement formulae:
where Equation 1 denotes the total CO2 emissions from all ship types in year i, Equation 2 denotes the CO2 emissions produced by the fuel consumption of the j-th ship type in year i, Equation 3 denotes the energy consumption of the j-th ship type in year i, and represents the energy consumption per unit of freight turnover for the j-th ship type in year i. To refine these parameters, the unit energy consumption () for each ship type was adjusted with reference to previous studies on berthing duration and equipment utilization levels in Chinese ports (Sun et al., 2022; Tang et al., 2023; Yuan et al., 2022), and further localized based on empirical operational data. Meanwhile, the CO2 emission factors () were converted into t CO2 yr⁻¹ for annual accounting, ensuring consistency with the methodological frameworks of the IPCC and IMO.
2.3.2 Temporal tendency analysis
Slope analysis can be used to examine temporal trend of CO2 emissions from port ships with the following formula:
In Equation 4, n denotes the total duration from 2000 to 2021, (equal to 21). represents year i, with 2001 as the starting year, and represents the CO2 emissions corresponding to year i.
If Slope > 0, CO2 emissions display an upward trend over time. If Slope < 0, CO2 emissions demonstrate a downward trend over time. The Slope value quantifies the level of growth or decrease of CO2 emissions, i.e., the degree of tendency to increase or decrease (Zhao et al., 2016; Fang et al., 2016). Table 2 shows four types of CO2 emissions growth.
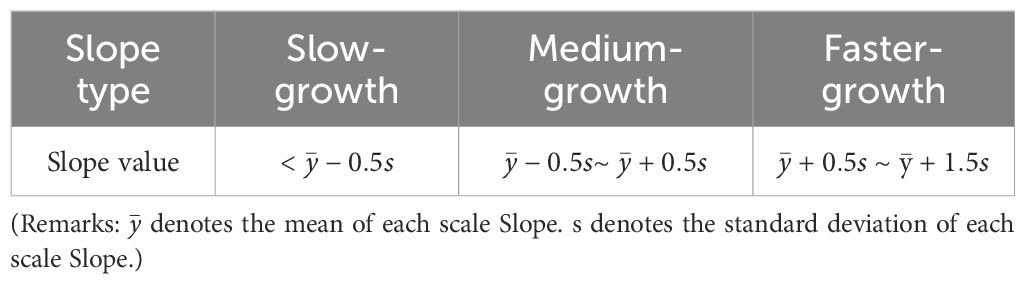
Table 2. Criteria for classifying trend changes.
2.3.3 Driving factor analysis
In this research, the Factor Detector and the Interaction Detector were used to examine the determinants of CO2 emissions and their interaction relationships in different ports. The Factor Detector was served to examine the determinants of the changes of CO2 emissions from port ships with influence value q within the interval [0, 1]. At a significance level of 0.05, a larger q value signifies a greater impact of the selected indicator, otherwise a weaker influence. The formula is provided below:
where Equation 5 represents the detection value of CO2 emission influencing factors, a higher q value indicates stronger explanatory power of the independent variable on ship CO2 emissions, while a lower value suggests weaker explanatory power. N and denote the total number of samples in the entire region and within the subregion, respectively. L refers to the categorization of all factors. and represent the variance of the dependent variable in the whole region and within the subregion, respectively. Equation 6 and Equation 7 stand for the total variance of the entire region and the within-stratum variance, respectively.
Prior to the analysis, Pearson correlation and variance inflation factor (VIF) tests were performed to confirm that no significant multicollinearity existed among the input variables (|r| < 0.8, VIF < 5). Subsequently, the Interaction Detector was employed to further examine the interaction relationships between factors, quantifying the synergistic and combined effects of multiple variables on CO2 emissions from port ships.
In this framework, each continuous variable was discretized into several strata to meet the requirement of spatial stratified heterogeneity while preserving significant intergroup variance, thereby ensuring a robust estimation of the q-statistic. Building on previous studies (Chen and Bi, 2022; Geng et al., 2015; Junling and Yihe, 2018; Liu et al., 2023) and taking into account data distribution, availability, and completeness, fifteen indicators covering transportation, production, economy, and society were selected to identify and explain the driving factors and mechanisms underlying port ship CO2 emissions. Detailed definitions of the variables are provided in Table 3.

Table 3. Model variable definitions.
2.3.4 Scenario analysis
This study considered freight turnover, energy consumption per unit of vessel, and CO2 emission factor as variables, and then applied statistical regression to predict their future changes.
Business-As-Usual (BAU) was the path that followed the established trend as usual without considering any additional policies. Under this path, freight turnover could be predicted by a general regression model. The general form was as follows:
In Equation 8 R serves as the dependent variable (i.e., ocean freight turnover for the six ship types), , ,…, are the independent variable (i.e., factors affecting cargo turnover). Through previous studies and algorithms, it was possible to predict the change in cargo turnover using only the GDP (Ma et al., 2020; Wang et al., 2021). The energy consumption per unit and ship CO2 emission factors were reasonably predicted mainly by the IMO report documents and China’s regulations on the management of CO2 emissions from ships.
Accelerated development scenarios (AD) were scenarios that compared with the baseline scenario. The design concept was to make appropriate fluctuations to individual variables under the baseline scenario, and then formed three additional adjusted development scenarios, S1, S2, and S3 (Table 4, 5 and 6). S1, S2, and S3 represented adjustments to freight turnover, energy consumption per unit of ship, and ship fuel utilization, respectively.

Table 4. Adjustments to freight turnover.
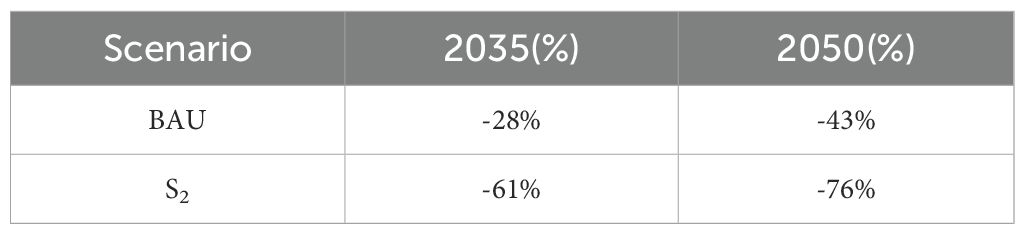
Table 5. Adjustment of energy consumption per unit of ship.

Table 6. Adjustments to ship fuel utilization.
In order to explore the predicted values of different CO2 emissions in a more detailed way, the settings of specific scenarios and related parameters are shown in the table below, as detailed in Table 7. BAU is the basic baseline scenario that do not consider the emergence of any new policies. AD1 to AD7 were the adjusted scenarios, of which AD7 was the most optimal development scenario mode.

Table 7. Scenario design.
Furthermore, CO2 emissions at both the aggregate and port levels were examined across multiple dimensions, including magnitude (Li et al., 2022), temporal evolution capturing both long-term trends and short-term variations (Wang et al., 2021; Li et al., 2023; Shi and Weng, 2021; Zou and Wang, 2025), and overall emission levels derived from national statistics (NBSC, 2002–2022). These comparative analyses confirm the reliability and robustness of the estimation method.
3 Results and discussion
3.1 CO2 emissions of different port ships
Ship CO2 emissions in the nine ports during the 21-year period are shown in Figure 2. The total CO2 emissions of the nine ports showed an increasing trend during 2001-2021. The highest value of 250,514,100 tons was reached in 2019, which was 4.49 times more than that of 2001. The annual growth rate was higher in 2004, 2011, 2016, 2017, and 2019, which reached 37.97%, 16.26%, respectively, 15.85%, 26.17%, and 10.48% respectively. This reflected the increased demand for water transportation in China and the growth in ship docking time, which led to increased pollution in ports. However, carbon emissions from the nine ports showed a clear downward trend with annual growth rates of -17.53%, -10.44%, and -3.78% in 2009, 2013, and 2020, respectively. Among different ports, Shanghai port always had the highest emissions, while the emissions of ports such as Tianjin, Dalian, and Qingdao ports fluctuated greatly.

Figure 2. Ship CO2 emissions in the nine ports during the 2001-2021.
The results of the ship CO2 emissions from nine coastal ports during 2001–2021 were differentiated by ship type, as illustrated in Figure 3. Throughout the study period, the CO2 emission trends at Dalian, Tianjin, Yantai, and Qingdao Ports initially increased but then declined. Conversely, Shanghai Port, Ningbo-Zhoushan Port, Xiamen Port, Shenzhen Port, and Guangzhou Port demonstrated a gradual upward trajectory in ship CO2 emissions. Among the ship types, container ships were identified as the predominant contributors to CO2 emissions, accounting for approximately half of the overall emissions from these ports. Following container ships, dry bulk carriers, product oil tankers, and roll-on/roll-off (ro-ro) vessels also accounted for a significant share of emissions. In contrast, chemical ships and crude oil tankers were found to emit the least amount of CO2. This discrepancy is primarily attributed to the vigorous growth of container ports in coastal areas, spurred by targeted policy support, which has led to a substantial increase in container ship throughput (Psaraftis and Kontovas, 2009). Additionally, container ships often operate at higher speeds to transport large volumes of cargo within shorter timeframes, resulting in increased fuel consumption and higher emissions. In comparison, chemical tankers and crude oil tankers typically operate at slower speeds, optimizing the efficiency of ship design and sailing characteristics, which results in lower fuel consumption and reduced CO2 emissions (Cariou, 2011). Furthermore, these vessels often do not face constraints in cargo space, allowing for more complete utilization of their carrying capacity, thereby minimizing CO2 emissions per unit of cargo.
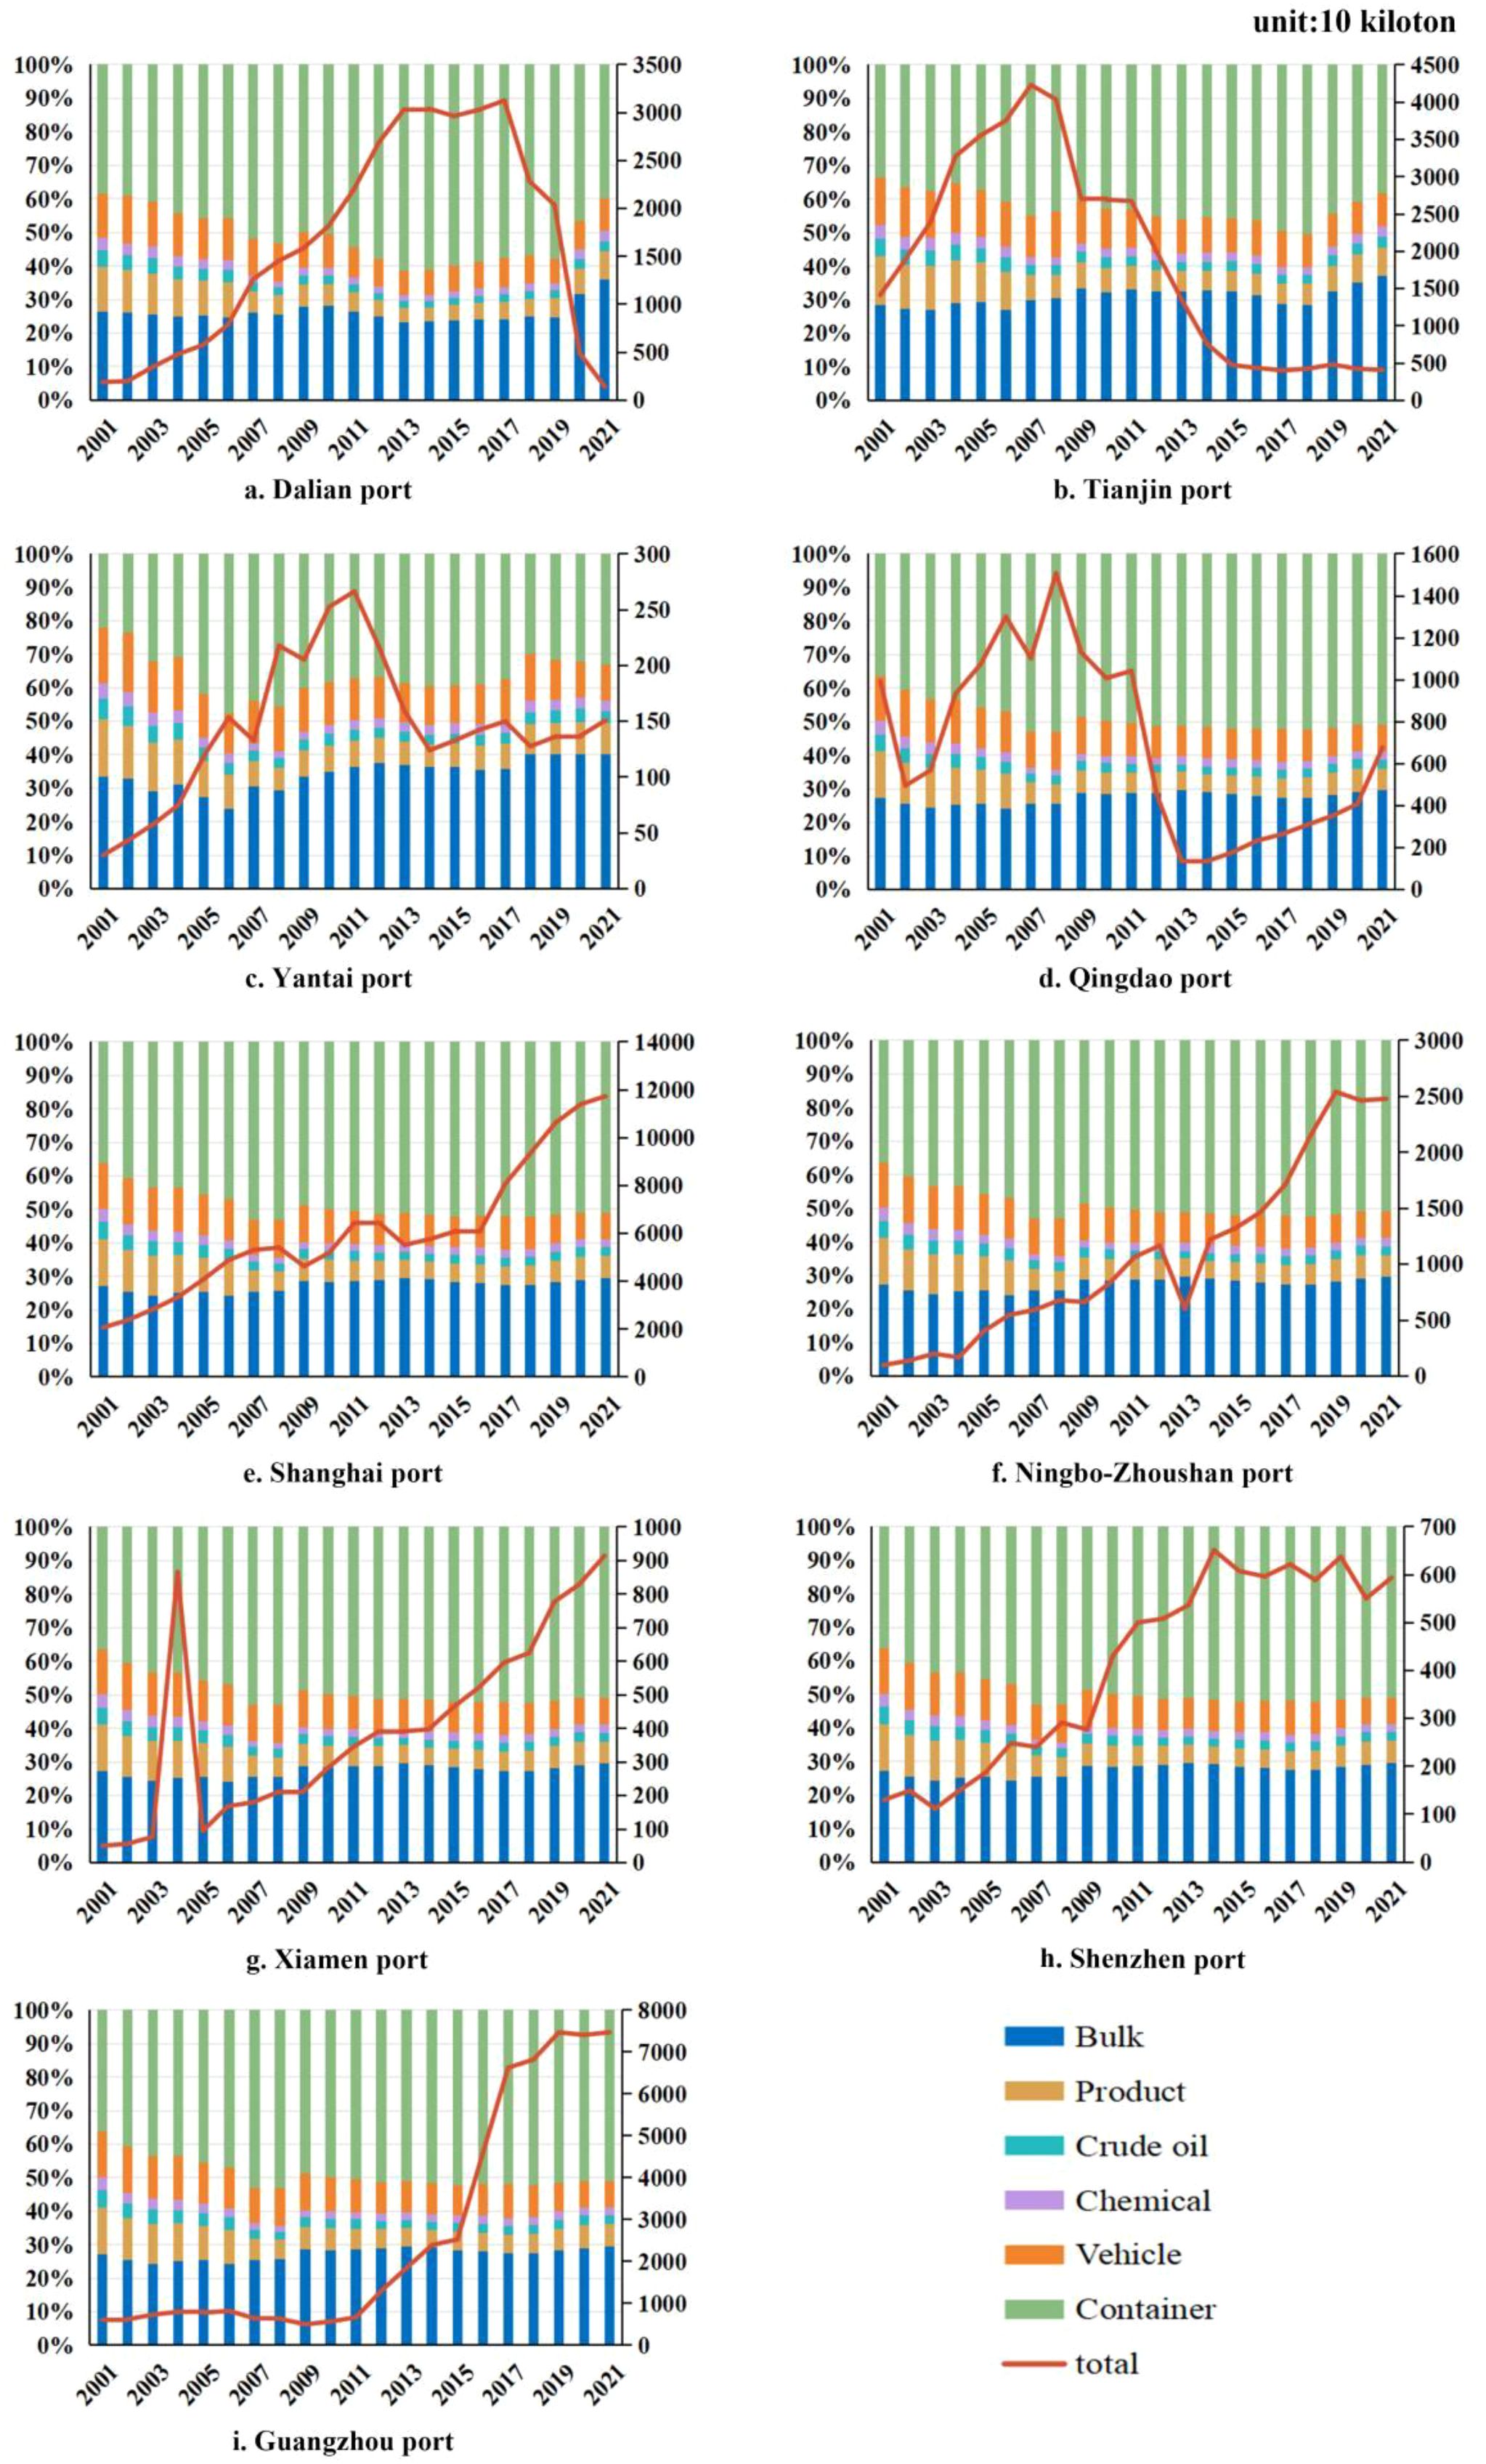
Figure 3. CO2 emissions by ship type in nine ports (the left axis indicates proportional contributions, and the right axis represents total emissions). (a) Dalian port; (b) Tianjin port; (c) Yantai port; (d) Qingdao port; (e) Shanghai port; (f) Ningbo–Zhoushan port; (g) Xiamen port; (h) Shenzhen port; (i) Guangzhou port.
Over the two decades, specific ports exhibited distinctive emission trends. Dalian Port reached its peak emissions in 2017 at 31,272,400 tons, followed by a marked annual decrease, with the most significant reduction occurring between 2019 and 2020 by 75.85%. Tianjin Port experienced its highest emissions in 2007 at 34,219,800 tons, with a consistent decline until 2015, and emissions remained relatively stable from 2015 to 2021. Yantai Port’s emissions peaked in 2011 at 2.664 million tons, with a significant reduction of about 1.4243 million tons by 2014. Qingdao Port saw its highest emissions in 2008 at 15.0845 million tons, subsequently decreased to its lowest in 2013 at 1.342 million tons, and then began a gradual increase to 6,769,200 tons in 2021.
The disparity in CO2 emission trends between northern and southern ports indicated the shifting center of gravity in China’s shipping trade from north to south, which is associated with the industrial profiles of the regions. Northern Chinese cities have relied heavily on traditional heavy industries such as coal, with little presence of high-value-added industries. Therefore, as traditional manufacturing industries decline and overcapacity issues prevail, the focus of China’s international trade has moved to the southern cities, which boast a higher proportion of light industry and advanced manufacturing sectors. This transition was further influenced by the reorganization of major shipping companies, such as the merger of China COSCO and China Shipping, which relocated their business headquarters from Tianjin and Dalian to Shanghai and Guangzhou (Wang and Ducruet, 2012; Wan and Luan, 2022).
The reduction in ship CO2 emissions from Tianjin Port was also partly attributed to the operational halts following the catastrophic explosion on August 12, 2015. Additionally, a decrease in CO2 emissions around 2020 from some ports may have been influenced by the global disruptions caused by the COVID-19 pandemic, which affected global commerce and port throughput (Gu and Liu, 2023).
3.2 Spatial-temporal evolution
3.2.1 Time evolution
The growth pattern of CO2 emissions for the nine ports is shown in Figure 4. Shanghai and Guangzhou had the most rapid growth in ship CO2 emissions, followed by Dalian, Ningbo, Xiamen and Shenzhen ports, which were of medium-speed growth, and the slow-growing ones were Tianjin, Yantai and Qingdao ports. This is inextricably linked to the degree of socio-economic advancement of each region. Specifically, Shanghai, Guangzhou and other more developed cities have a rapid growth in CO2 emissions, where the regional GDP rank in the forefront of China, making the shipping industry account for a relatively heavy proportion. On the other hand, Tianjin, Yantai and Qingdao, which have a lower level of urbanization and lag behind in the development of the shipping industry, also have a lower level of CO2 emissions from energy consumption, with relatively stable trends in emissions.

Figure 4. Overall slope analysis of nine ports from 2001-2021.
To further investigate the growth trend of CO2 emissions from port ships during 2001-2021, this study analyzed the time series in 5-year intervals, with results presented in Figure 5. The CO2 emissions of Tianjin port grew rapidly in 2001-2005, and then became slow-growth type. The CO2 emissions of Dalian port grew rapidly in 2005-2009, then became faster in 2009-2013, and rose slowly in other time periods. Shanghai port has always been a fast-growing type of CO2 emissions. For the Guangzhou port, two time periods of 2001-2005, 2005–2009 were at slow growth levels, while the three time periods of 2009-2013, 2013-2017, and 2017–2021 remained faster or rapid growth levels. The other ports exhibited slow to moderate growth trends. These results aligned with the analysis in Section 3.1, which indicated a gradual southward shift in the focus of China’s international shipping over the past 21 years.

Figure 5. Slope analysis for CO2 emissions of nine ports by time period.
3.2.2 Spatial evolution
As Figure 6 shows, the ports of Dalian, Tianjin, Qingdao, Guangzhou, and Ningbo-Zhoushan belonged to the high-emission area, while the port of Shenzhen fell into the low-emission area most of the time. The port of Yantai always maintained a low-emission or medium-low-emission status, and the port of Shanghai always maintained a high-emission status. It is worth noting that the high-emission areas were predominantly concentrated in the northern ports and Shanghai port before 2009, but mainly in the southeastern region after 2009. Regarding temporal changes, the count of high-emission areas reached the peak in 2009 and 2013, followed by a slight downward trend, and the main high-emission areas shifted from northern ports to southeastern ports.

Figure 6. Spatial-temporal distribution of ship CO2 emissions in nine major Chinese ports during 2001 to 2021.
Dalian port was a low-emission area in 2001 and became a high-emission area from 2005 to 2017, because it expanded in size and its facilities were gradually upgraded during these years, which made it convenient for ships to call and conduct cargo operations, resulting in a substantial rise in freight turnover and ship CO2 emissions. However, the port of Dalian became a low-emission area again in 2021, probably due to the decline in port throughput as a result of the COVID-19 Epidemic. The port of Tianjin, which has the most complete coastal port terminal functions and is the largest integrated port in the Bohai Rim, remained a high-emission state till 2013, and then it became a medium-low-emission area in 2017 and 2021, mainly due to the “8.12” bombing incident in 2015, which caused the port to stop cargo transportation for a long period. Although Yantai port is located in Shandong Peninsula, with a large number of port areas, it was always a low-emission or medium-low emission area due to the country’s vigorous development of the Bohai Rim and the low competence in attracting goods compared with Dalian, Qingdao and Tianjin. The slow development of the high-tech and service industries in Yantai, to some extent, also affected the port’s development. Qingdao Port belonged to the medium-high emission area in 2001, 2005 and 2009, mainly because of the wide waters and the perfect equipment in the port area, which made it convenient for ships entering, exiting and docking, attracting a large number of sources of passengers. It turned into a medium-low emission area in 2013 and later, due to a large number of trade customers lost from Yantai and Qingdao Port to Huanghua Port. Situated at the mouth of the Yangtze River, Shanghai port was always a high-emission area. Its extensive hinterland enhanced the port’s capacity for material distribution. And Shanghai, as an international shipping center, has a well-developed economy, which provides a basis for the development of the port, leading to a very serious situation of ship CO2 emissions. Ningbo-Zhoushan Port showed a low-emission trend in 2001, and with the support of national policies and the increase in port scale, it became a medium-high emission area in 2005, 2009 and 2013. Further, it transformed into a high-emission area in 2017 and 2021, mainly because of the establishment of Ningbo-Zhoushan Port Group Co. in September 2015, which promoted the substantial integration of the two ports through asset linkage. Xiamen Port was characterized as a low-emission area in 2001 and 2005 but experienced a short-term emission peak in 2004, driven by the rapid national economic expansion that led to temporary overheating in regional trade and port logistics. After 2006, the integration of port management within Xiamen Bay, the establishment of a new Port Administration, and the successive development of the Xiangyu Bonded Logistics Park, Haicang Bonded Port Zone, and the China (Fujian) Pilot Free Trade Zone approved by the State Council collectively promoted the port’s functional upgrading and its transition to a medium- to high-emission area. Guangzhou Port basically maintained a medium-high emission or high-emission situation, mainly due to the superior geographic location, which is near the South China Sea, and located in the mouth of the Pearl River and the center of the Pearl River Delta. Moreover, as the largest comprehensive main hub port in South China, Guangzhou Port has more than a hundred international container routes, attracting a large number of goods and causing serious pollution of CO2 emissions from ships. Shenzhen Port was always a low or medium-low emission area. During the initial phase of the study period, the development of Shenzhen port was slow. With the implementation of various talent introduction policies, the city’s rapid economic growth, and increasingly frequent foreign trade, Shenzhen Port has now become one of the top container ports worldwide, and created more than 200 international container liner routes. However, due to the port’s active pursuit of green development with various modernization measures, such as the construction of automated terminals, the growth in CO2 emissions from ships has stabilized.
3.3 Driving factors
The results of single-factor testing of CO2 emission driving of the nine ports are shown in Figure 7. Overall, among the four driving segments, the influence of transportation development level was the most prominent, owing to the fact that the port itself was a key node of transportation. Next were the port’s production capacity and the city’s industrial structure. As for the city’s economic level, its influence was fluctuate, with some ports are highly influenced by the economic level while other individual ports are almost unaffected by the economic level.

Figure 7. Single factor test results.
In terms of port issues, the ratio of waterway transportation, the ratio of primary industry and the percentage of secondary industry had the highest effects on the ship CO2 emissions in Tianjin Port, with the q-values of 0.951, 0.933 and 0.933, respectively. The area where Tianjin Port located receives industrial transfers from the Beijing-Hebei region and the inland hinterland, and the its industrial products are usually transported over long distances by sea transportation. Moreover, Tianjin Port also undertakes a large amount of food import transportation. The economic factor affected most of the port ship CO2 emissions of Guangzhou Port, Ningbo Zhoushan Port, and Shanghai Port, which indicated the fact that the progress of ports highly depended on the development of their regional economies. Since 2000, over 50% of China’s actual foreign investment has been directed towards the Pearl River Delta and Yangtze River Delta regions, which has driven local economic development, as well as the transfer of some polluting industries to the region, leading to a significant increase in CO2 emissions (Zhu et al., 2022).For Xiamen Port, the q-value did not reach 0.9, that is, these factors cannot absolutely explain the trend of ship CO2 emissions in Xiamen Port. Over the past period, in order to advance the high-quality development of the port, Xiamen Port has actively explored energy efficiency and emission reduction measures such as terminal shore power and port machinery “oil to electricity”. Furthermore, photovoltaic power generation effectively has reduced the dependence of port development on energy consumption growth (Zeng and Hou, 2023; Wang et al., 2023). There were many factors with q-value above 0.9 in Shenzhen harbor, indicating that these variables can well explain the CO2 emission in Shenzhen harbor. Among them, the proportion of the primary industry had the greatest explanatory power, with a q-value of 0.998. Previous study has indicated that rationalizing the city’s industrial structure can significantly reduce CO2 emissions. It also found that for every 1% increase in the index for upgrading the industrial structure, CO2 emissions were reduced by 0.171% to 0.194% (Gu et al., 2022). Social and industrial structures both have a better explanation for the CO2 emissions of Shenzhen port, reflecting the relative reasonableness of the industrial structure within its direct economic hinterland.
In terms of individual variables, the waterway transport volume had a significant impact on Dalian, Qingdao, and Ningbo-Zhoushan ports. The proportion of waterway transportation exerted a more significant influence on Tianjin, Yantai, and Xiamen ports. The city GDP most directly affected the CO2 emissions of Shanghai port. The road transport volume, the length of port terminals, and the port throughput had a greater explanatory power for Ningbo-Zhoushan port. The maximum explanatory power of Shenzhen port was the ratio of primary industry. The maximum explanatory power of Guangzhou port was the ratio of secondary industry. The above indicated that significant differences existed in the explanatory power of driving factors for ship CO2 emissions in different ports, and that the ship CO2 emissions in individual ports may not depend on the economic level of the city.
The number of berth and quay length usually directly indicate the intensity of shipping activities. However, this study found that these factors do not have a high influence on CO2 emissions from ships in individual ports. This is partly because large ports with many berths and long quays are more likely to be green ports with specialized equipment, which are designed with a greater emphasis on the balance between efficiency and energy saving and emission reduction (Yang, 2017). Waterway transport volume and road transport volume had a substantial effect on CO2 emissions from ships in ports. Generally speaking, the most direct mode of transportation in ports is waterway transportation, and road transportation is the primary mode of transportation for transshipment of goods from ports to the hinterland. Consequently, increased freight volumes generally lead to more shipping activities, which could result in higher CO2 emissions (Liu et al., 2021).
Port city GDP is also a key factor influencing CO2 emissions from ships in ports, which is closely related to port development. Generally speaking, the development of ports benefits from the prosperity of the maritime market, and the prosperity of the shipping market is inseparable from economic development. In turn, economic growth will advance the maritime trade and lead to the upgrading and iteration of ports. These three relationships are complementary and interrelated (Wan and Luan, 2022).
Although the energy consumption per unit of GDP had little effect on ship CO2 emissions in most ports, it had a greater explanatory effect on ship CO2 emissions in the ports of Dalian and Shanghai, which was related to the direct economic hinterland of both ports. The direct economic hinterland of the Dalian port includes three eastern provinces, mainly Liaoning, where most of the cities belong to resource-oriented region. Meanwhile, Shanghai’s direct hinterland, the Yangtze River Delta, including Shanghai itself, exhibited high energy consumption and contributed substantially to the local GDP.
Waterway transport volume and proportion of waterway transportation could explain the CO2 emissions of most ports, but the explanatory power for Shanghai port was not obvious. This primarily stem from the fact that Shanghai Port’s transportation system mainly adopts road transportation, with more than 50% of cargoes transshipped by road transportation. In other words, the cargo transshipment in Shanghai port does not absolutely rely on waterway transportation, so the waterway transport volume and waterway transportation ratio could not better explain the ship CO2 emissions in the port (Wang and Ducruet, 2012).
The results of the interaction factor test for CO2 emissions of the nine ports are shown in Figure 8. There were 105 factor pairs for each port at the significance level of 5%. These factor pairs were in the form of two-factor enhancement, indicating that the factors in the factor pairs had synergistic effects on CO2 emissions. The average interaction force of Ningbo-Zhoushan Port was 0.960, and the maximum value was 0.983 (X1∩X3). This factor pair exhibited one-factor attenuation, indicating that the presence of one factor inhibited another. In other words, the best explanation for CO2 emissions in Ningbo Zhoushan Port was the factor pair (X1∩X3), but there was a phenomenon of mutual inhibition between them. Combined with the findings from single-factor testing, the explanatory power value of the 14 factor pairs composed with waterway transportation volume was above 0.95, indicating that waterway transportation volume occupied an absolute explanatory position. Even if there were factors that played an inhibitory role in waterway transportation volume, they still made these factor pairs important factors in explaining the CO2 emissions.

Figure 8. Interaction Factor TEST Results. (a) Dalian port; (b) Tianjin port; (c) Yantai port; (d) Qingdao port; (e) Shanghai port; (f) Ningbo–Zhoushan port; (g) Xiamen port; (h) Shenzhen port; (i) Guangzhou port.
At the same time, there were many factor pairs exhibiting nonlinear enhancement in Dalian and Yantai ports. For Dalian port, X4∩X6, X4∩X10, etc., indicated that among the factors affecting CO2 emissions, there was a mutually reinforcing effect between air transportation volume and variables such as the number of berth, population, and energy consumption per unit of GDP. And the X14∩X2, X14∩X3, etc., of Yantai Port illustrated that among the factors affecting the CO2 emission of port ships, there was a mutual promotion between the ratio of the secondary industry and variables such as road transportation volume, and railroad transportation volume. Therefore, when formulating policies on energy conservation and emission reduction in Dalian and Yantai ports, consideration could be given to starting from the two ports’ own characteristics. For example, Dalian port could try to maximize the use of air transport for transshipment of goods, and Yantai port could utilize more specialized equipment, developing towards intelligent and green port construction.
There were more factor pairs exhibiting nonlinear attenuation in Xiamen port, such as X11∩X2, X11∩X7, X11∩X10, etc. Combined with the results of single-factor testing, these factors in factor pairs played a mutual inhibiting role in affecting the CO2 emissions of Xiamen Port. Therefore, when Xiamen Port considered formulating policies on energy conservation and emission reduction, it could start from the ways that could influence the above interactive factor pairs (Xu et al., 2021).
In summary, in the interactive factor test, most of the factor pairs showed two-factor enhancement and no independent relationship, indicating a strong link between the factors. It is necessary to note that among the interactive factor pairs, there were instances of one-way weakening or nonlinearity, that is, some factors did not have as much influence as individual factors on CO2 emissions from harbor ships when they existed in the form of factor pairs. In other words, there were some factor pairs that constrained each other (Su et al., 2020).
3.4 The forecasted future emissions
The forecasted future ship CO2 emissions of the nine ports are shown in Figure 9. Overall, except for Tianjin port, which was projected to continue to show a decreasing trend, the other eight ports were expected to experience an overall increase in CO2 emissions over the next 30 years. This suggests that the total CO2 emissions of most ports will continue to grow significantly, driven by the sustainable development of China’s economy and the trend of global trade globalization. Comparing BAU with AD1, AD2, and AD3, it was found that changing a single variable of cargo turnover, ship unit energy consumption, and CO2 emission factor would contribute to a roughly 10%, 40%, and 4% decrease in ship CO2 emissions, respectively, which meant that ship unit energy consumption had a stronger influence on the CO2 emissions of ships in ports compared to ship turnover and CO2 emission factor. This is consistent with previous findings (Li et al., 2023), which highlighted that energy consumption per unit of throughput is the most critical determinant of CO2 emission reduction. It also aligns with current port management practices, demonstrating the feasibility of technological pathways. Energy-efficiency improvements, including the electrification of cargo-handling equipment, optimized berthing schedules, and slow steaming, have been shown to effectively reduce vessel energy intensity (Lv et al., 2025).

Figure 9. Ship CO2 emission projections in nine major ports under different scenarios. (a) Dalian port; (b) Tianjin port; (c) Yantai port; (d) Qingdao port; (e) Shanghai port; (f) Ningbo–Zhoushan port; (g) Xiamen port; (h) Shenzhen port; (i) Guangzhou port.
Tianjin Port’s CO2 emissions were expected to maintain a downward trend over the next 30 years, decreasing to 1,112,400 tons and 730,000 tons in 2035 for BAU and AD7 scenarios, and to 240,000 tons and 150,000 tons in 2050 for the two scenarios, respectively. The primary reason of this change is the decrease in cargo turnover at Tianjin Port. As an important logistics hub, Tianjin Port not only pursues economic benefits but also actively strives for environmental protection and sustainable development. Since the prohibition of Bohai Sea ports from accepting coal transportation by automobile, the position of Tianjin Port in coal transportation among the Bohai Sea ports has gradually declined, and the original source of cargo from Tianjin Port has been continuously shifted to the neighboring ports such as Qinhuangdao, Caofeidian and so on. According to the study, the cargo throughput of Tianjin Port decreased by 1.83% in 2022, and would continue to decline after that. In addition, in the recent past, Tianjin Port had built a “smart zero-carbon” terminal, and the capacity of installed wind and solar power systems had reached 28,000 kilowatt-hours, which had the potential to conserve approximately 18,000 tons of standard coal and cut CO2 emissions by 50,000 tons each year. These measures were intended to aid in reducing CO2 emissions of Tianjin Port in the future.
Yantai and Shenzhen ports had a slight variation compared to the other six ports, with CO2 emissions maintaining a flat trend from around 2035 under scenarios AD2, AD4, AD6 and AD7. This suggests that Yantai and Shenzhen ports will reach “carbon peak” around 2035 after adopting a better level of energy conservation and emission reduction measures. According to the AD7 scenario, the CO2 emissions in 2050 will be 2.513 million tons and 5.2823 million tons, respectively. This may be related to the policy measures of the local government and port management organizations. Yantai Port has comprehensively promoted the use of shore power on ships since 2017, and the coverage rate of shore power berths at terminals reached 100% by 2020; the port’s loading and unloading process has adopted the use of hydrogen-powered automated rail cranes and other lifting equipment, and has vigorously carried out sea-railway intermodal transportation mode in the transshipment of dry bulk cargoes. Shenzhen Port is the first port in China to introduce low-sulfur fuel and on-shore electricity, and has built the largest LNG offshore refueling center in Asia-Pacific region. To some extent, this suggests that aligning policy and technology is a vital prerequisite for achieving mid-term carbon peaking goals. Moreover, global CO2 emissions may be reach the peak and begin to decline in around 2035, which will also affect the CO2 emission trends of Yantai and Shenzhen ports (Zeng and Hou, 2023).
Qingdao Port’s ship CO2 emissions showed an overall high growth rate under all scenarios. Under the baseline scenario, CO2 emissions in 2050 could reach 75.41 million tons, which is nearly 10 times the 2022 level. Even under the optimal scenario AD7, CO2 emissions would increase by more than six times. This is closely related to the increased investment and construction of Qingdao Port, which is now accelerating the development of an international shipping hub. According to a study by China Water Transportation News, the volume of international cargo throughput by Qingdao Port surpassed 660 million tons in 2023, an increase of 28.2% from 2019. Therefore, the CO2 emissions of Qingdao Port should be given particular attention, and targeted mitigation measures are required. In this context, strengthening the implementation of intelligent energy management systems, expanding green logistics corridors, and accelerating the transition to alternative marine fuels represent recommended pathways for low-carbon transformation.
Based on the forecast data, by 2050, the CO2 emissions of Dalian Port, Shanghai Port, Ningbo-Zhoushan Port, Xiamen Port, and Guangzhou Port under the baseline scenario would be 77,282,98, 17,347,75, 45,809,1, 16,545,1, and 13,290,820,000 tons, respectively. And under the optimal scenario, significant reductions in CO2 emissions would be achieved, bringing them down to 35,090,995, 90,696,6, 2302.77, 835.02, and 7895.76 million tons, respectively. It means that the implementation of energy conserving and emission reduction measures has a significant impact on reducing CO2 emissions and plays a critical role in the environmentally sustainable development of ports. According to the official websites of these ports and the Water Transportation Section of the Ministry of Transportation and Communications of China (https://www.wti.ac.cn/wti/), these ports have taken various energy conserving and emission reduction measures since 2010, such as promoting utilizing onshore power supply for vessels docking at ports, carrying out the work of oil-to-electricity switching for equipment and facilities, and installing exhaust gas cleaning systems for ships. In order to achieve peak CO2 emissions as soon as possible, some relevant organizations in China are also developing or applying power batteries or hydrogen fuel cells to drive transportation vessels.
Overall, linking the scenario outcomes with practical technological and managerial pathways enhances both the interpretability and policy relevance of the results. The BAU and AD scenarios represent different levels of policy and technological advancement, ranging from business-as-usual operations to the proactive adoption of clean energy technologies and carbon management systems, providing actionable insights for the decarbonization of Chinese coastal ports.
The global shipping industry greenhouse gas emission reduction roadmap released by IMO in 2018 clearly put forward a preliminary strategy, which for the first time proposed specific requirements for the target of reducing ship CO2 emissions, that is, the GHG emissions due to the international shipping should peak as soon as possible, so as to enter the CO2 emission reduction phase of the shipping industry. The grand and ideal emission reduction goal is that by 2050, the total annual global ship CO2 emissions should be reduced by at least 50% compared to that in 2008. Long-term emission trajectories of the nine ports under the scenario framework are shown in Figure 10. In terms of results, only Tianjin Port could meet the IMO’s emissions reduction target for 2050. Tianjin Port’s port throughput was at a lower level between 2015 and 2020 due to events such as the “8.12” bombing and the COVID-19 pandemic, which was taken into account when using the forward projection method to forecast its future CO2 emissions, so it performed a continuous decline in the port’s future CO2 emissions by 2050 (Hao et al., 2015). However, the nine ports selected are the busiest ports in China, and as international trade and shipping continue to expand, the activity will keep increasing, which will contribute to a further rise in CO2 emissions. Therefore, arduous effort is needed to reach the 2050 emission reduction target of IMO.

Figure 10. Projected CO2 emissions of the nine major ports (2050).
4 Conclusion
Shipping CO2 reduction is a critical topic in sustainable development. This study systematically analyzed the spatiotemporal evolution of ship-related CO2 emissions across nine major Chinese ports from 2001 to 2021, identified their principal driving factors, and projected emission trajectories for the next 30 years under multiple scenarios. The results revealed a gradual shift of high-emission areas from northern to southern ports, with waterway transport volume, highway transport volume, the ratio of secondary industry, and urban GDP identified as the dominant drivers of emission growth. Scenario analysis indicated that CO2 emissions at Tianjin Port were expected to decline to achieve the IMO (2009) 2050 reduction target, while the other eight ports will experience varying degrees of increase. Overall, this research expanded both the temporal span (2001–2021) and spatial coverage (nine major ports) of port-level emission analysis, and also established a comprehensive analytical framework that simultaneously characterized the historical evolution, driving mechanisms, and future trends of port CO2 emissions, offering methodological and applied extensions to the field. The findings revealed the spatiotemporal patterns and regional disparities of CO2 emissions across China’s coastal ports, providing scientific support for the formulation of differentiated mitigation strategies. Considering that port cargo throughput will continue to grow, future efforts should focus on improving ship energy efficiency, promoting low-carbon port technologies, and accelerating the transition toward cleaner energy structures to ensure sustainable port development while effectively reducing carbon emissions. Overall, this research expanded both the temporal span (2001–2021) and spatial coverage (nine major ports) of port-level emission analysis, and also established a comprehensive analytical framework that simultaneously characterized the historical evolution, driving mechanisms, and future trends of port CO2 emissions, offering methodological and applied extensions to the field. The findings revealed the spatiotemporal patterns and regional disparities of CO2 emissions across China’s coastal ports, providing scientific support for the formulation of differentiated mitigation strategies. Considering that port cargo throughput will continue to grow, future efforts should focus on improving ship energy efficiency, promoting low-carbon port technologies, and accelerating the transition toward cleaner energy structures to ensure sustainable port development while effectively reducing carbon emissions.
Data availability statement
The data analyzed in this study is subject to the following licenses/restrictions: The dataset is not publicly available due to data management policies, but it can be obtained from the corresponding author upon reasonable reques. Requests to access these datasets should be directed to ZXl6aHVAc2htdHUuZWR1LmNu.
Author contributions
EZ: Conceptualization, Methodology, Writing – review & editing, Supervision. AY: Data curation, Writing – original draft, Visualization. LC: Funding acquisition, Writing – review & editing. TZ: Data curation, Visualization, Investigation, Writing – review & editing. JY: Validation, Writing – review & editing, Visualization. TL: Visualization, Writing – review & editing, Software, Validation.
Funding
The author(s) declare financial support was received for the research and/or publication of this article.
Acknowledgments
This research was supported by the National Key R&D Program of China (Grant No. 2022YFE0115100), the National Science Foundation of China (Grant No. 72104139), and the Capacity Building Project of Local Universities funded by the Science and Technology Commission of Shanghai Municipality (Grant No. 23010502200).
Conflict of interest
The authors declare that the research was conducted in the absence of any commercial or financial relationships that could be construed as a potential conflict of interest.
Generative AI statement
The author(s) declare that no Generative AI was used in the creation of this manuscript.
Any alternative text (alt text) provided alongside figures in this article has been generated by Frontiers with the support of artificial intelligence and reasonable efforts have been made to ensure accuracy, including review by the authors wherever possible. If you identify any issues, please contact us.
Publisher’s note
All claims expressed in this article are solely those of the authors and do not necessarily represent those of their affiliated organizations, or those of the publisher, the editors and the reviewers. Any product that may be evaluated in this article, or claim that may be made by its manufacturer, is not guaranteed or endorsed by the publisher.
References
Alzahrani A., Petri I., Rezgui Y., and Ghoroghi A. (2021). Decarbonisation of seaports: A review and directions for future research. Energy Strategy Rev. 38, 100727. doi: 10.1016/j.esr.2021.100727
Botana C., Fernández E., and Feijoo G. (2023). Towards a Green Port strategy: The decarbonisation of the Port of Vigo (NW Spain). Sci. Total Environ. 856, 159198. doi: 10.1016/j.scitotenv.2022.159198
Budiyanto M. A., Habibie M. R., and Shinoda T. (2022). “Estimation of CO emissions for ship activities at container port as an effort towards a green port index2,” Energy Reports in Energy Rep., 2022 The 5th International Conference on Renewable Energy and Environment Engineering, 8, 229–236. doi: 10.1016/j.egyr.2022.10.090
Cariou P. (2011). Is slow steaming a sustainable means of reducing CO2 emissions from container shipping? Transp. Res. Part Transp. Environ. 16, 260–264. doi: 10.1016/j.trd.2010.12.005
Chang Y.-T., Song Y., and Roh Y. (2013). Assessing greenhouse gas emissions from port vessel operations at the Port of Incheon. Transp. Res. Part Transp. Environ. 25, 1–4. doi: 10.1016/j.trd.2013.06.008
Chen C. and Bi L. (2022). Study on spatio-temporal changes and driving factors of carbon emissions at the building operation stage- A case study of China. Build. Environ. 219, 109147. doi: 10.1016/j.buildenv.2022.109147
Chen K., Guo J., Xu X., Zhang T., and Zhang W. (2023). Port sustainability through integration: A port capacity and profit-sharing joint optimization approach. Ocean Coast. Manage. 245, 106867. doi: 10.1016/j.ocecoaman.2023.106867
Fang C., Liu H., and Li G. (2016). International progress and evaluation on interactive coupling effects between urbanization and the eco-environment. J. Geographical Sci. 26, 1081–1116. doi: 10.1007/s11442-016-1317-9
Geng J., Li M.-W., Dong Z.-H., and Liao Y.-S. (2015). Port throughput forecasting by MARS-RSVR with chaotic simulated annealing particle swarm optimization algorithm. Neurocomputing Adv. Self-Organizing Maps Subtitle special issue: Selected Papers Workshop Self-Organizing Maps 2012 (WSOM) 2012) 147, 239–250. doi: 10.1016/j.neucom.2014.06.070
Gibbs D., Rigot-Muller P., Mangan J., and Lalwani C. (2014). The role of sea ports in end-to-end maritime transport chain emissions. Energy Policy 64, 337–348. doi: 10.1016/j.enpol.2013.09.024
Gu R., Li C., Li D., Yang Y., and Gu S. (2022). The impact of rationalization and upgrading of industrial structure on carbon emissions in the beijing-tianjin-hebei urban agglomeration. Int. J. Environ. Res. Public. Health 19, 7997. doi: 10.3390/ijerph19137997
Gu B. and Liu J. (2023). COVID-19 pandemic, port congestion, and air quality: Evidence from China. Ocean Coast. Manage. 235, 106497. doi: 10.1016/j.ocecoaman.2023.106497
Hao H., Geng Y., and Ou X. (2015). Estimating CO2 emissions from water transportation of freight in China. Int. J. Shipp. Transp. Logist. 7, 676–694. doi: 10.1504/IJSTL.2015.072682
Huang L., Wen Y., Geng X., Zhou C., Xiao C., and Zhang F. (2017). Estimation and spatio-temporal analysis of ship exhaust emission in a port area. Ocean Eng. 140, 401–411. doi: 10.1016/j.oceaneng.2017.06.015
IPCC (2006). 2006 IPCC guidelines for national greenhouse gas inventories. Geneva, Switzerland: Intergovernmental Panel on Climate Change.
IPCC (2019). 2019 refinement to the 2006 IPCC guidelines for national greenhouse gas inventories. Geneva, Switzerland: Intergovernmental Panel on Climate Change.
Ji X., Ding X., Hu W., and Qiu Y. (2025). The effect of shipping efficiency on marine petroleum pollution: An empirical analysis of China’s 11 coastal regions. Front. Mar. Sci. 12. doi: 10.3389/fmars.2025.1645175
Jiang B., Li J., and Mao X. (2012). Container ports multimodal transport in China from the view of low carbon. Asian J. Shipp. Logist. 28, 321–343. doi: 10.1016/j.ajsl.2013.01.003
Junling L. and Yihe S. (2018). Research on mid- and long-term low-carbon development pathways for the chinese transportation sector. Adv. Climate Change Res. 14, 513. doi: 10.12006/j.issn.1673-1719.2018.052
Kim H., Bui H.-D., and Hong S. (2022). Estimation of air pollution from ships in port area: A case study of yeosu and gwangyang ports in korea. Atmosphere 13, 1890. doi: 10.3390/atmos13111890
Lee T.-C., Lam J. S. L., and Lee P. T.-W. (2016). Asian economic integration and maritime CO2 emissions. Transp. Res. Part Transp. Environ. 43, 226–237. doi: 10.1016/j.trd.2015.12.015
Li H., Jia P., Wang X., Yang Z., Wang J., and Kuang H. (2022). Ship carbon dioxide emission estimation in coastal Domestic Emission Control Areas using high spatial–temporal resolution data: A China case. Ocean Coast. Manage. 232, 106419. doi: 10.1016/j.ocecoaman.2022.106419
Li Y., Xie W., Yang Y., Mei Q., Wang Z., Li Z., et al. (2023). Research on the carbon emissions traceability inventory and multi-horizon prediction of ship carbon emissions: A case study of Tianjin Port. Front. Mar. Sci. 10. doi: 10.3389/fmars.2023.1174411
Liu L., Zhang Y., Chen C., Hu Y., Liu C., and Chen J. (2021). Is the spatial-temporal dependence model reliable for the short-term freight volume forecast of inland ports? A case study of the yangtze river. China. J. Mar. Sci. Eng. 9, 985. doi: 10.3390/jmse9090985
Liu M., Lai K. H., Wong C. W. Y., Xu X., and Lun V. Y. H. (2025). Smart ports for sustainable shipping: Concept and practices revisited through the case study of China’s Tianjin port. Maritime Econ Logistics. 27, 50–95. doi: 10.1057/s41278-024-00291-3
Liu X., Wang X, and Meng X. (2023). Carbon emission scenario prediction and peak path selection in China. Energies 16, 2276. doi: 10.3390/en16052276
Lv W., Ye Y., Cui T., Chen S., Xu D., Yu W., et al. (2025). Sustainable electrified seaports: A coordinated energy and logistics scheduling approach for future maritime hubs. Appl. Energy 401, 126645. doi: 10.1016/j.apenergy.2025.126645
Ma Y., Zhu J., Gu G., and Chen K. (2020). Freight transportation and economic growth for zones: sustainability and development strategy in China. Sustainability 12, 10450. doi: 10.3390/su122410450
McDuffie E. E., Smith S. J., O’Rourke P., Tibrewal K., Venkataraman C., Marais E. A., et al. (2020). A global anthropogenic emission inventory of atmospheric pollutants from sector- and fuel-specific sources, (1970–2017): an application of the Community Emissions Data System (CEDS). Earth Syst. Sci. Data 12, 3413–3442. doi: 10.5194/essd-12-3413-2020
Mou N., Zhang X., Yang T., Xu H., Zheng Y., Wang J., et al. (2024). Carbon footprints: Uncovering multilevel spatiotemporal changes of ship emissions during 2019–2021 in the U.S. Sci. Total Environ. 912, 169395. doi: 10.1016/j.scitotenv.2023.169395
National Bureau of Statistics of China (NBSC) (2002–2022a). China statistical yearbook, (2001–2021) (Beijing: China Statistics Press).
Ou X., Zhang X., and Chang S. (2010). Scenario analysis on alternative fuel/vehicle for China’s future road transport: Life-cycle energy demand and GHG emissions. Energy Policy 38, 3943–3956. doi: 10.1016/j.enpol.2010.03.018
Pietzcker R. C., Longden T., Chen W., Fu S., Kriegler E., Kyle P., et al. (2014). Long-term transport energy demand and climate policy: Alternative visions on transport decarbonization in energy-economy models. Energy 64, 95–108. doi: 10.1016/j.energy.2013.08.059
Psaraftis H. N. and Kontovas C. A. (2009). CO2 emission statistics for the world commercial fleet. WMU J. Marit. Aff. 8, 1–25. doi: 10.1007/BF03195150
Shi K. and Weng J. (2021). Impacts of the COVID-19 epidemic on merchant ship activity and pollution emissions in Shanghai port waters. Sci. Total Environ. 790, 148198. doi: 10.1016/j.scitotenv.2021.148198
Su Y., Li T., Cheng S., and Wang X. (2020). Spatial distribution exploration and driving factor identification for soil salinisation based on geodetector models in coastal area. Ecol. Eng. 156, 105961. doi: 10.1016/j.ecoleng.2020.105961
Sun H., Zhang C., Li J., and Wang Y. (2022). Carbon emission reduction of shore power from Chinese ports. Front. Mar. Sci. 9. doi: 10.3389/fmars.2022.1077289
Takeshita T. (2011). Global scenarios of air pollutant emissions from road transport through to 2050. Int. J. Environ. Res. Public. Health 8, 3032–3062. doi: 10.3390/ijerph8073032
Tang D., Liu S., Zhang T., and Wu X. (2023). Assessing the potential for energy efficiency improvement through cold ironing: A monte carlo analysis with real port data. J. Mar. Sci. Eng. 11, 1780. doi: 10.3390/jmse11091780
Tovar B. and Wall A. (2019). Environmental efficiency for a cross-section of Spanish port authorities. Transp. Res. Part Transp. Environ. 75, 170–178. doi: 10.1016/j.trd.2019.08.024
Villalba G. and Gemechu E. D. (2011). Estimating GHG emissions of marine ports—the case of Barcelona. Energy Policy 39, 1363–1368. doi: 10.1016/j.enpol.2010.12.008
Wan S. and Luan W. (2022). Hinterland evolution and port growth decomposition: The case of Shanghai. J. Transp. Geogr. 100, 103334. doi: 10.1016/j.jtrangeo.2022.103334
Wang C. and Ducruet C. (2012). New port development and global city making: emergence of the Shanghai–Yangshan multilayered gateway hub. J. Transp. Geogr. Special Section Accessibility Socio-Economic Activities: Methodological Empirical Aspects 25, 58–69. doi: 10.1016/j.jtrangeo.2012.07.008
Wang T., Fan Q., Li M., Li X., Wu D., Liu C., et al. (2021). Ship emissions around China under gradually promoted DECA policy. Atmos. Chem. Phys. 21, 13835–13851. doi: 10.5194/acp-21-13835-2021
Wang H., Han J., Su M., Wan S., and Zhang Z. (2021). The relationship between freight transport and economic development: A case study of China. Res. Transp. Econ. Policies prompting Sustain. transport urban areas 85, 100885. doi: 10.1016/j.retrec.2020.100885
Wang L. and Li Y. (2023). Estimation methods and reduction strategies of port carbon emissions - what literatures say? Mar. pollut. Bull. 195, 115451. doi: 10.1016/j.marpolbul.2023.115451
Wang J., Li X., Christakos G., Liao Y., Zhang T., Gu X., et al. (2010). Geographical detectors-based health risk assessment and its application in the neural tube defects study of the Heshun Region, China. Int. J. Geographical Inf. Sci. 24, 107–127. doi: 10.1080/13658810802443457
Wang B., Liu Q., Wang L., Chen Y., and Wang J. (2023). A review of the port carbon emission sources and related emission reduction technical measures. Environ. pollut. 320, 121000. doi: 10.1016/j.envpol.2023.121000
Wang S., Luo Y., Liu Z., and Lu B. (2022). Analysis on Energy Conservation and Emission Reduction Efficiency and Influencing Factors for Ports around Bohai in China under the Low Carbon Target. Sustainability 14, 14765. doi: 10.3390/su142214765
Wang L., Peng C., Shi W., and Zhu M. (2020). Carbon dioxide emissions from port container distribution: Spatial characteristics and driving factors. Transp. Res. Part Transp. Environ. 82, 102318. doi: 10.1016/j.trd.2020.102318
Wang J. F., Zhang T. L., and Fu B. J. (2016). A measure of spatial stratified heterogeneity. Ecol. Indic. 67, 250–256. doi: 10.1016/j.ecolind.2016.02.052
Xu L., Du H., and Zhang X. (2021). Driving forces of carbon dioxide emissions in China’s cities: An empirical analysis based on the geodetector method. J. Clean. Prod. 287, 125169. doi: 10.1016/j.jclepro.2020.125169
Yang Y.-C. (2017). Operating strategies of CO2 reduction for a container terminal based on carbon footprint perspective. J. Clean. Prod. 141, 472–480. doi: 10.1016/j.jclepro.2016.09.132
Yang L., Cai Y., Zhong X., Shi Y., and Zhang Z. (2017). A carbon emission evaluation for an integrated logistics system—A case study of the port of shenzhen. Sustainability 9, 462. doi: 10.3390/su9030462
Yang H., Ma X., and Xing Y. (2017). Trends in CO2 emissions from China-oriented international marine transportation activities and policy implications. Energies 10, 980. doi: 10.3390/en10070980
Yang L., Zhang Q., Zhang Y., Lv Z., Wang Y., Wu L., et al. (2021). An AIS-based emission inventory and the impact on air quality in Tianjin port based on localized emission factors. Sci. Total Environ. 783, 146869. doi: 10.1016/j.scitotenv.2021.146869
Yu Y., Sun R., Sun Y., and Zhu W. (2022). China’s port carbon emission reduction: A study of emission-driven factors. Atmosphere 13, 550. doi: 10.3390/atmos13040550
Yuan Z., Li J., and Wang H. (2022). Pathway for integrated development of waterway transportation and energy in China. Strategic Study CAEs (Engineering) 24, 167–175. doi: 10.15302/J-SSCAE-2022.03.019
Zeng Y. and Hou B. (2023). Analysis of carbon emission reduction at the port of integrated logistics: the port of shanghai case study. Sustainability 15, 10914. doi: 10.3390/su151410914
Zhao Y., Wang S., and Zhou C. (2016). Understanding the relation between urbanization and the eco-environment in China’s Yangtze River Delta using an improved EKC model and coupling analysis. Sci. Total Environ. 571, 862–875. doi: 10.1016/j.scitotenv.2016.07.067
Zhou C., Huang H., Liu Z., Ding Y., Xiao J., and Shu Y. (2023). Identification and analysis of ship carbon emission hotspots based on data field theory: A case study in Wuhan Port. Ocean Coast. Manage. 235, 106479. doi: 10.1016/j.ocecoaman.2023.106479
Zhu E., Qi Q., Chen L., and Wu X. (2022). The spatial-temporal patterns and multiple driving mechanisms of carbon emissions in the process of urbanization: A case study in Zhejiang, China. J. Clean. Prod. 358, 131954. doi: 10.1016/j.jclepro.2022.131954
Keywords: port, ship CO2 emission, spatial-temporal analysis, driving factor, scenario analysis, 1 Introduction
Citation: Zhu E, Ye A, Chen L, Zhang T, Yao J and Liu T (2025) Mapping the evolution and future prediction of berthing ship CO2 emissions in China. Front. Mar. Sci. 12:1723361. doi: 10.3389/fmars.2025.1723361
Received: 12 October 2025; Accepted: 17 November 2025; Revised: 14 November 2025;
Published: 03 December 2025.
Edited by:
Xu Xin, The Hong Kong Polytechnic University, Hongkong SAR, ChinaReviewed by:
Hongxiang Feng, Ningbo University, ChinaXina Ji, Ningbo University of Finance and Economics, China
Copyright © 2025 Zhu, Ye, Chen, Zhang, Yao and Liu. This is an open-access article distributed under the terms of the Creative Commons Attribution License (CC BY). The use, distribution or reproduction in other forums is permitted, provided the original author(s) and the copyright owner(s) are credited and that the original publication in this journal is cited, in accordance with accepted academic practice. No use, distribution or reproduction is permitted which does not comply with these terms.
*Correspondence: Lisu Chen, bHNjaGVuQHNobXR1LmVkdS5jbg==