Abstract
The performance of the Edinburgh Duck wave energy converter (ED-WEC) shows great potential when integrated with oceanic structures. In the present study, the wave energy extraction performance of an ED-WEC integrated with a box-type floating breakwater (FBW) is investigated based on small-amplitude wave theory, with the aim of harnessing maximum wave energy from the scattered and reflected waves in the presence of offshore structures. The scattered and reflected waves from marine structures approach the WEC, which, in turn, increases the wave power absorption of the WEC. The associated scattered and reflected waves for wave interactions with hybrid structures are studied, and the capture width ratio (CWR), wave power absorption, motion amplitude, and mean interaction factors of the ED–FBW hybrid system are discussed. The hydrodynamic coefficients play an important role in evaluating the CWR, wave power absorption, and mean interaction factor. The numerical results are analyzed for different structural and geometrical parameters, such as the width of the ED, the draft of the ED, the distance between the ED-WEC and the FBW, and the wave incident angle. Further, the numerical results obtained for the box-type FBW are compared with those for trapezoidal-type FBW, FBW, parabolic type FBW and semi-circular type FBW. The power absorbed by the integrated ED-WEC is noted to increase in the narrow region of wave period. In addition, the increase in draft of the ED results in increase of submergence volume and variation in the hydrodynamic coefficients. In the case of an isolated system for deep water depth, the variation in CWR in is observed to be within while in , it is . The study performed will be helpful in optimizing the ED-WEC-FBW configuration in the real sea state condition and provide a potential solution of generating power along with the coastal defence structure.
1 Introduction
Since the global industrial revolution, the use of fossil fuels has increased rapidly, resulting in the depletion of non-renewable resources and creating negative environmental impacts. The oil crisis in 1974 was the first alarming situation for the world to utilize renewable energies, which are available in abundance in different forms (Vicinanza et al., 2014). Due to the Kyoto Protocol and the Paris Agreement under the United Nations Framework Convention on Climate Change, interest in the development of renewable energy resources (cleaner technologies) has accelerated (Kim et al., 2018). Energy storage devices can support more sustainable energy systems with zero carbon emissions when coupled with cleaner technologies. Among the known available resources on Earth, wave energy is one of the most promising forms of ocean renewable energy, and oceans cover 71% of the Earth’s surface. A major advantage of wave energy is that it has huge reserves, high energy density, wide distribution, and good predictability (Isaacs and Seymour, 1973). The estimated wave energy potential is approximately 32,000 TWh per year (Taveira-Pinto et al., 2015). In recent years, the growing global demand for clean and sustainable energy has intensified interest in wave energy converters (WECs), which offer a predictable and high-density renewable power source compared with wind and solar. Among the various WEC concepts, the Edinburgh Duck (ED-WEC) has demonstrated excellent hydrodynamic efficiency because of its unique pitching motion and favorable capture-width characteristics. However, in offshore environments, standalone WECs often face challenges such as reduced survivability, inconsistent energy absorption under varying wave conditions, and high installation and maintenance costs.
Further, floating breakwaters (FBWs) are widely deployed as coastal protection structures to attenuate wave energy and safeguard harbors, aquaculture farms, and offshore operations. Integrating a WEC with a floating breakwater presents an attractive dual-function solution: the breakwater enhances operational stability for the WEC, while the WEC improves the energy-dissipation capability of the breakwater by absorbing part of the incident wave energy. This synergy has the potential to significantly improve the economic feasibility of wave energy projects by combining coastal protection with renewable energy harvesting.
The concept of the Edinburgh Duck WEC was first proposed by Salter et al. (1975), and thereafter various configurations of WECs have been developed. WECs are generally categorized into three major types (Zhao et al., 2019a; Zhang et al., 2021), namely oscillating water column (OWC) (Wang et al., 2020), oscillating buoy (OB) (Jin et al., 2019), and overtopping WEC (Contestabile et al., 2020). Among these three, the oscillating-buoy-type WEC exhibits higher energy-conversion efficiency and greater flexibility. Since 1974, thousands of different WECs have been patented (Mustapa et al., 2017), and many devices have reached model-testing stages (Hayward et al., 2012). A detailed study on the ED was carried out by Salter, and the study concluded that ED-WEC is much more efficient in achieving high energy conversion over a wider frequency region when compared with heaving OB-type WECs such as the Berkeley Wedge WEC (Madhi et al., 2014) and the triangle-baffle WEC (Zhang et al., 2020). Under ideal conditions, the ED-WEC has been reported to reach almost 100% conversion efficiency. However, the commercialization of WECs is currently restricted by two important factors: (i) high construction and mooring costs and (ii) low energy-conversion efficiency. Due to these challenges, the Edinburgh Duck WEC proposed by Salter in 1980 was rejected by the United Kingdom government (Cruz, 2008). Salter later implemented a commercial system using an array of a large number of ED-WECs placed with a rotating shaft joined to spines. The rotation shaft is kept fixed at the support for smooth ED operation. In addition to the mooring system, the power take-off (PTO) system is also installed inside the ED-WEC, resulting in greater structural complexity and maintenance requirements. Thus, to reduce construction costs and increase conversion efficiency, researchers have integrated WECs with oceanic structures (Cruz, 2008).
Studies on the integration of WECs with oceanic structures suggest that this approach can be a promising solution to address both cost-effectiveness and WEC-efficiency challenges (Mustapa et al., 2017). The oceanic structure works as a dissipating or reflecting body for incident waves, sending reflected or scattered waves back toward the WEC, which then benefits from increased wave power generation (McCartney, 1985). The conversion efficiency of a WEC can be improved through various methods, such as replacing a single large WEC with multiple small WECs, modifying WEC shapes or PTO systems, and arranging WECs in arrays (Ning et al., 2018). A study by Zhao and Ning (2018) on a two-pontoon system with an OB-type WEC and a fixed pontoon concluded that the two-pontoon system can achieve better energy-extraction performance than a single-pontoon system.
Various numerical and experimental studies have been undertaken for ED-WEC to analyze the efficiency of the device. Jeffrey et al. (1976) performed an experimental study on an improved ED-WEC and concluded that for very large roll-amplitude values, the tip of the ED-WEC becomes submerged, and waves pass over it, resulting in a violation of the small-wave-amplitude assumption as waves break due to the disturbances created by the submerged tip. Mynett et al. (1979) studied ED-WEC performance using potential flow theory for conversion efficiency, wave-induced motion, and reaction forces. The study concluded that under ideal conditions, the conversion efficiency can reach 100%. Wu et al. (2017a) investigated the optimization of power-capturing performance for an isolated ED-WEC, and subsequently Wu et al. (2017b) analyzed the power-capturing performance of isolated ED-WECs arranged in arrays. Zhang et al. (2019) performed a similar experimental study on ED-WEC and concluded that the pitch amplitude is relatively large for a given capture width ratio (CWR). Since wave breaking is not considered in numerical models based on potential flow theory in previous studies, the need for computational fluid dynamics (CFD) arises. Using a CFD model, Li and Teng (2021) investigated wave power absorption of ED-WEC with different power take-off (PTO) systems and concluded that the absorbed power reaches its peak near the resonance values of the system. Recently, Praisilin et al. (2025a) presented a progressively detailed examination of wave–structure interactions relevant to floating breakwaters and hybrid coastal-protection systems. The study offered a broad synthesis of hydrodynamic factors governing the motion responses of offshore structures, with emphasis on design implications for combined floating-breakwater and wave-energy-converter systems. Furthermore, Praisilin et al. (2025b) investigated the effect of trench configurations on scattering and radiation characteristics for different floating-breakwater geometries, demonstrating the sensitivity of wave-attenuation performance to seabed modifications. In addition, Praisilin and Chandru (2025c) introduced a novel fibrillar-adhesive floating breakwater and examined its interaction with nearby rigid and porous structures over a sloping seabed, highlighting important effects of proximity and seabed gradient on hydrodynamic behavior. Finally, Praisilin et al. (2025d) extended the analysis to dynamic response, added mass, and damping of the fibrillar breakwater near a porous structure atop an oscillatory Gaussian seabed, revealing modifications to the device’s motion characteristics.
According to the literature, the hydrodynamic interaction between the Edinburgh Duck WEC and a floating breakwater remains insufficiently explored. The present integrated system introduces complex fluid–structure interactions, including modified radiation and diffraction effects, altered motion responses, and variations in energy capture due to the proximity of structural boundaries. A detailed understanding of these coupled dynamics is essential for optimizing design parameters, improving power-extraction efficiency, and ensuring structural safety. Therefore, this study investigates the wave power extraction performance of an Edinburgh Duck WEC when integrated with a floating breakwater. The motivation lies in addressing key knowledge gaps related to integrated-system behavior, improving the performance of WEC–breakwater hybrids, and contributing to cost-effective, multifunctional offshore infrastructure capable of both wave attenuation and renewable energy generation.
The present paper investigates wave interaction with a hybrid ED-WEC system using different FBW shapes. Wave power extraction, capture width ratio, motion amplitude, and mean interaction factor are examined for varied structural and geometrical parameters, such as ED width, ED draft, distance between the ED-WEC and FBW, and incident wave angle. The theoretical formulation of the hybrid system and the numerical validation are performed using data available in the literature. The numerical results obtained from the study are discussed for both the isolated ED-WEC and the ED-WEC–FBW hybrid system. The investigation will aid efforts to develop an efficient and reliable form of ED-WEC capable of harnessing maximum wave energy while functioning with floating breakwaters as a coastal-defense structure during the initial stages of design.
2 Theoretical formulation
In the present study, the Edinburgh Duck wave energy converter (ED-WEC) is integrated with a box-type floating breakwater (FBW). The configurations used for the theoretical formulation are shown in Figures 1a, b. The global Cartesian coordinate system is introduced at the origin, with its line of action passing through with the YZ plane exposed to incident waves, and the OXY plane lies on still-water surface level. The ED is symmetrical about the dashed line and the radius at the stern portion is R. The angle of inclination of the ED is defined by . An impermeable and floating box-type BW of width B, height , length , thickness and draft is considered. The distance from the edge of the FBW to the center of rotation of ED-WEC is taken as .
Figure 1
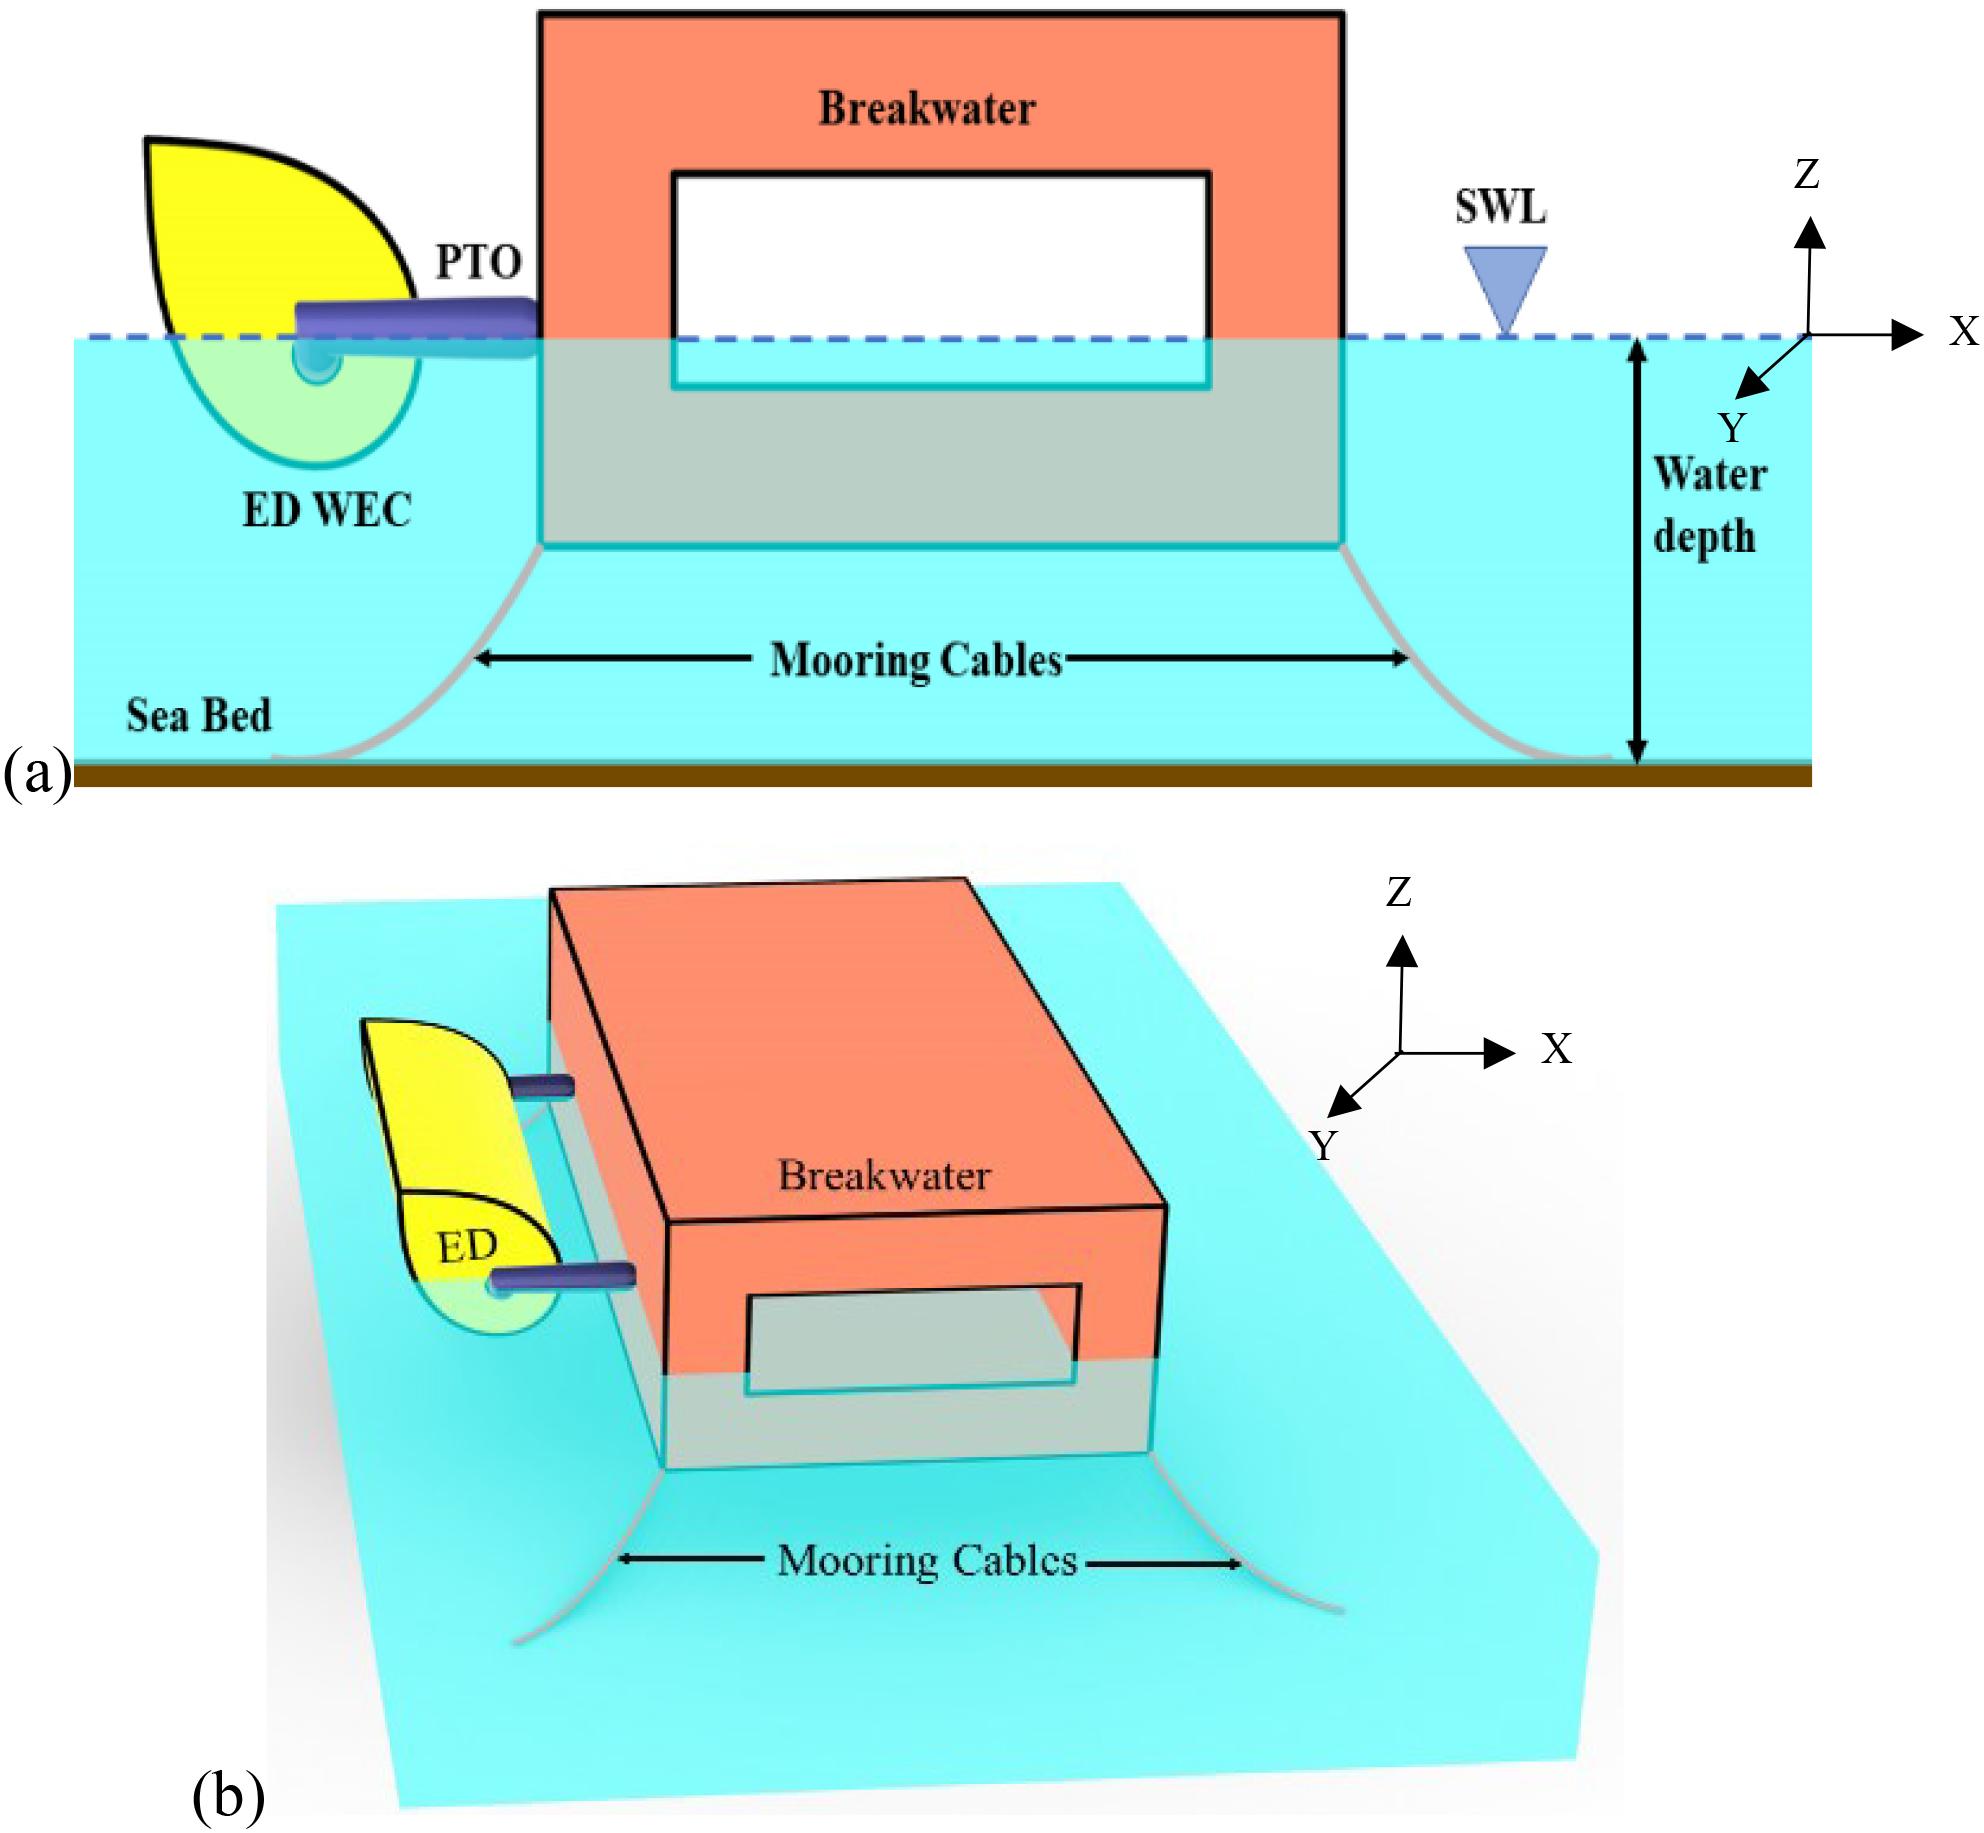
Schematic representation of ED-WEC with a box-type floating breakwater (a) side view and (b) perspective view.
2.1 Governing equations
In the present study, the fluid is assumed to be ideal, and a velocity potential exists that satisfies the Laplace equation (Equation 1) expressed as
The linear free-surface boundary condition (Equation 2) at is given by,
For wave interaction with the ocean structure, the velocity potential of the initial incoming sinusoidal wave system on the wetted body surface (Equations 3, 4) is given by,
The seabed boundary condition (Equation 5) is expressed as,
The wave-excitation force and radiation force are obtained for the floating body. In the analysis of wave diffraction and wave radiation, first-order potential theory is employed. The fluid flow field as in Equation 6 surrounding the floating body is given by,
where is the incident wave amplitude, t is the time period, is the angular wave frequency and is the space location with respect to the origin or fixed reference axes. The rotational and translational motions of the floating body excited by the incident wave of unit amplitude as in Equation 7 are given by,
The total potential can be considered as a summation of incident wave potential , diffracted wave potential and radiated wave potential . All these three velocity potentials must satisfy the Laplace equation’s and can be mathematically written as Equation 8 given by ,
where is the first order incident wave potential with unit wave amplitude, is the diffraction wave potential and is the radiation wave potential due to the motion with unit wave motion amplitude.
In the present study, the potential flow theory is used to study the hydrodynamic performance of ED-WEC integrated with a breakwater. The potential flow theory plays a crucial role in determining hydrodynamic coefficients because it provides an efficient and sufficiently accurate framework for predicting fluid-structure interactions in offshore and marine environments. By assuming the fluid to be incompressible, inviscid, and irrotational, the potential flow theory simplifies the governing equations of motion, allowing the flow to be described using a velocity potential function. This simplification enables the calculation of key hydrodynamic coefficients such as added mass, radiation damping, and wave excitation forces, which quantify how a floating or submerged body interacts with incident waves and radiated waves generated by its own motion.
2.2 Equations of motion
The general governing equation for the heaving of a point-absorber wave energy converter can be expressed as Equation 9 as,
where m is the mass of the point absorber, is the excitation force due to the incident wave, is the radiation force, is a hydrostatic force derived from the buoyancy and the gravity force, is the forced applied by the power take off system, is the damping force occurring due to the viscosity of the fluid interacting the body, represents the vertical displacement, velocity, and acceleration of the floating body respectively. The force represents the force introduced due to the dynamic pressure of undisturbed waves, while is caused by disturbed waves due to the existence and oscillation of the point absorber. The excitation force can be obtained by integrating the dynamic pressure of the incident waves on the oceanic structure over the mean wetted surface area of the oscillating buoy WEC, and the dynamic pressure can be mathematically represented Equations 10, 11 as,
where g is the gravitational acceleration, h is the water depth, is the fluid density, is the wave direction and k is the wave number of the incident wave.
2.3 Power take-off system
The governing equation for the direct mechanical driven PTO system in heave can be represented as Equation 12 given by,
where is the equivalent mass () of the PTO system, is the equivalent damping coefficient (), is the spring coefficient (not considered), is the PTO force and is the friction force (not considered). is the added mass of the system, M is the mass of the body, C is the restoring force coefficient due to the difference between the hydrostatic force and the weight of the body. The optimal value of the equivalent damping coefficient (Bellew et al., 2009) as in Equation 13 can be obtained as,
The governing equation of motion for and DOF for ED-WEC can be determined as in Equation 14 given by,
where are the angular velocity and acceleration of the rotating body, I is the rotational moment of inertia, is the mechanical damping torque, is the elastic torque of the generator, is the torque produced by combining pressure and viscous torque and is the torque due to gravity. The clockwise direction is taken as the positive direction for the formulation. The optimal (Sun et al., 2018) can be expressed as in Equation 15 given by,
where is the radiation damping coefficient and is the restoring torque coefficient.
2.4 Power absorption
The investigation of the equilibrium forces acting on the ED-WEC integrated with a box type FBW leads to the motion differential equations. The average power output for a heaving WEC can be calculated as in Equations 16, 17 given by,
where is the wave excitation force in heave and is the linear velocity of WEC in heave DOF. In addition, the average output power for and can be calculated as in Equations 18, 19 of the form,
where is the moment due to fluid and gravity and is the WEC motion period.
2.5 Relative capture width ratio
The relative capture width ratio (CWR) is defined as the ratio of the extracted wave power to the input wave power as in Equation 20 given by,
where is the average output power and is the input power of the waves in the domain as in Equation 21. CWR is interpreted as the wave front width of the WEC.
where is the incident wave height.
2.6 Mean interaction factor
The hydrodynamic response of the hybrid structure in the fluid domain is dependent on due to the diffracted and radiated waves generated by the oscillations of the WEC devices. Due to this interaction, both the power and response output of a body in hybrid system differ from those of the same body in isolation. A measure of these differences, representing the hydrodynamic coupling between devices in hybrid and isolation modes, is given by the mean interaction factor as in Equation 22 and is defined as
The mean interaction factor of indicates that the hybrid system is producing the same power as the power produced in isolation, whereas and indicates the constructive and destructive interaction of the system.
3 Numerical solution
The forces acting on the structure can be obtained by integrating the pressures over the wetted surface of the hybrid system. To determine the forces and moments acting on the structure, the equations of motion for the translational and rotational responses of the rigid body are applied. The generalized form of the first-order hydrodynamic force and moment as in Equation 23 can be expressed as
where is the mean wetted surface of the ED-WEC. The forces due to the fluid are categorized into active and reactive components. The active component, or wave exciting force, consists of the Froude–Krylov and the diffraction force. The reactive force consists of radiation force due to radiation waves induced on the body. The total first-order hydrodynamic force is obtained from the solution of Equation 23 and then is divided into its active and reactive components. The active component is the first-order hydrodynamic force for Froude-Krylov due to the incident wave and the total first-order hydrodynamic force as in Equation 24 can be written as
while for the diffracting force due to diffraction wave, the equation for diffracted wave force as in Equation 25 is given as,
and the radiation force for unit amplitude of reactive force as in Equation 26 is given as,
and the radiation wave potential can be expressed for real and imaginary parts as in Equation 27 is given by.
and is substituted into Equation 26 to produce the linear added mass and wave radiation damping coefficients as in Equations 28, 29 and is written as.
where is the linear added mass and is the wave radiation damping and is expressed as in Equations 30, 31 given by
The solution obtained from the Laplace equations for the diffraction and radiation problems can be combined with the equation of motion of the floating breakwater to analyze the dynamic response of the structural system in the time domain. The equation of motion as in Equation 32 is expressed as,
where is added mass, is the hydrodynamic damping, K is the total stiffness matrix of the system (including spring stiffness), is the total external force acting on the system, which has constant amplitude. On implementing the convolution integral form in Equation 32, the equation of motion as in Equation 33 can be expressed as,
where c is the damping matrix including radiation damping and V is the velocity impulse function. The RAO is the motion of FBW in six DOFs (Surge , Sway , Heave , Roll , Pitch and Yaw ) due to the hydrodynamic wave force. RAO are utilized as input data for the calculation of displacement (), acceleration () and velocity () at a given location in the space. Generally, RAO is calculated using the ratio of response amplitude to the wave amplitude for linear motion which is expressed as in Equation 34 given by,
and for the rotational motion, RAO is defined as the ratio of the response amplitude of the breakwater to the wave slope angle as in Equation 35 given by.
All wave forces interacting with the structure in the hybrid system are function of and is independent of the structural mass characteristics of the body. The in Equation 16, is expressed by,
where is the wave excitation force, is the mechanical damping, is the hydrostatic stiffness given by where is the water plane area.
The response amplitude of an oscillating WEC due to incident frequency can be obtained by integrating the velocity expressed in Equation 36 in heave motion, is presented in Equation 37 given by,
Solving Equations 17, 19 to obtain the power output, the periodic motion of waves system is assumed as , the response amplitude is finally expressed as,
Similar results are obtained for . Further Equation 38 can be also rewritten for heave Roll and Pitch as in Equations 39, 40 is represented as,
The maximum power absorbed is represented as in Equation 41 given by,
The term is the energy absorbed per unit surface and is the maximum power absorbed by the hybrid system of WEC integrated with floating breakwaters.
4 Numerical model setup
The numerical modeling is performed using a 3D hybrid system consisting of the ED integrated with the box-type FBW on the sea side of the hybrid system (Ansys-AQWA, 2021) for the wave-structure interaction. Zhou et al. (2021, 2022) conducted a study using a 2D numerical water tank in CCM+ CFD software for a rectangular type FBW, only for DOF, respectively. Similar investigation is carried out in for 2D numerical model of FBW as an OB (Zhang et al., 2020) and a hybrid system of WEC and FBW (Zhang et al., 2020, 2021). The present study is compared with the results obtained from the different shapes of FBW such as trapezoidal type, , parabolic type and semi-circular type FBW. The design of ED-WEC body is governed by a curvature equation expressed in Equation 42. Stern portion of the duck body is of circular arc of radius and is symmetrically divided about dotted red dash line of length (Figure 2). The ED has an inclination of with respect to the still water level. The scaled weight of ED-WEC is and is scaled down to .
Figure 2
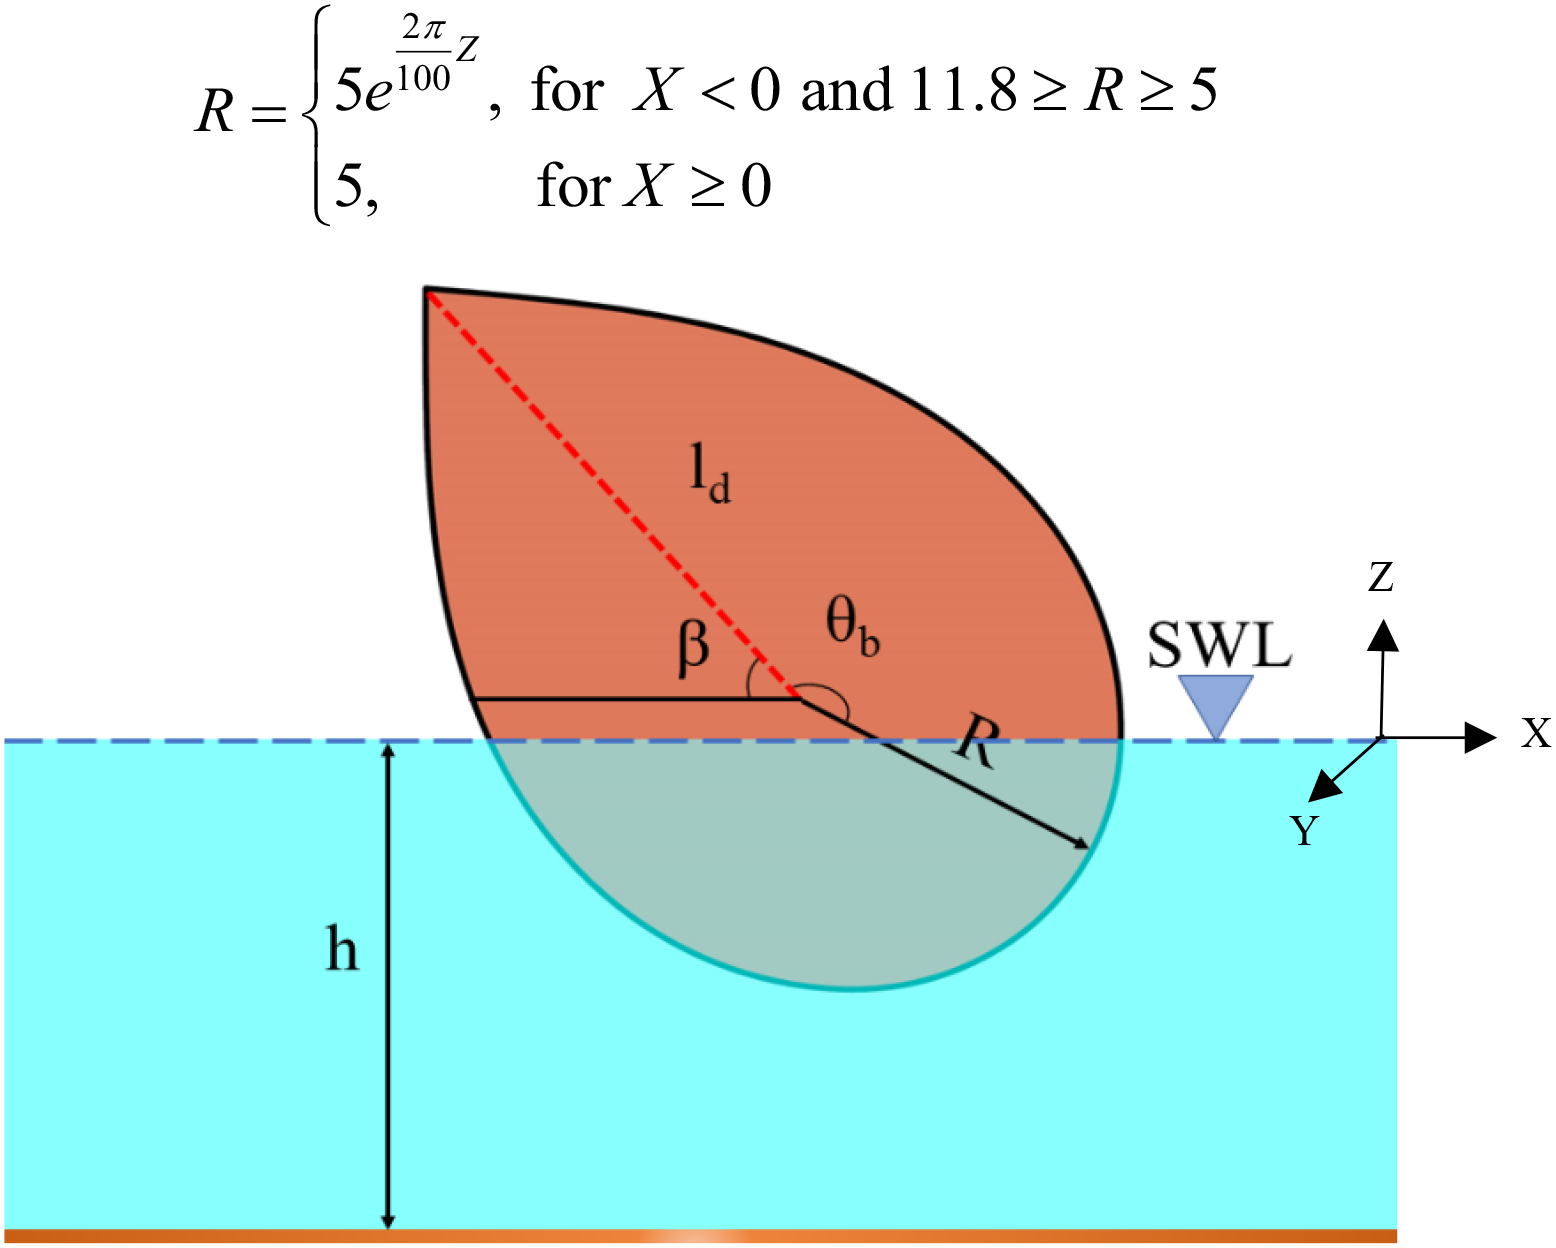
Schematic representation of the ED-WEC.
where is the distance from the curvature of the duck at stern to the center of rotation of the duck’s body and is expressed as,
The ED curvature mentioned in Equation 43 is integrated into different shapes of FBWs and the details are mentioned in Table 1. The common parameters for all shapes of breakwaters are , weight of FBW is and .
Table 1
| Shape of floating breakwater | Parameters | Values |
|---|---|---|
| Box type FBW | Draft of FBW | 3.0m |
| Thickness of box | 1.5m | |
| Height of center open of box | 2.0m | |
| Submerged open area height | 1.5m | |
| Trapezoidal type FBW | Draft of FBW | 2.24m |
| Base at water surface level | 9.31m | |
| Base at bottom of FBW | 6.72m | |
| Slope of FBW | ||
| π type FBW | Draft of FBW | 4.0m |
| Top width of FBW | 12.0m | |
| Depth of top deck | 2.0m | |
| Height of leg of FBW | 4.5m | |
| Thickness of leg of FBW | 2.25m | |
| Parabolic type FBW | Draft of FBW | 2.5m |
| Mouth of parabolic FBW | 3.0m | |
| Depth of parabolic FBW | 0.75m | |
| Focus of parabolic FBW | 0.75m | |
| Thickness of FBW at top & bottom | 1.0m | |
| Semi-circular type FBW | Draft of FBW | 2.7m |
| Radius of Semi-Circle | 2.2m | |
| Thickness of FBW at top & bottom | 0.5m |
Parametric details of floating breakwaters.
Different shapes of FBW shown in Figure 3 are used for analysis and for comparison with the box-type FBW. The FBW geometries are taken from the literature and are applied to the box-type FBW without changing their rational dimensions. The submergence volume of the system is kept the same for all FBWs by varying their drafts.
Figure 3
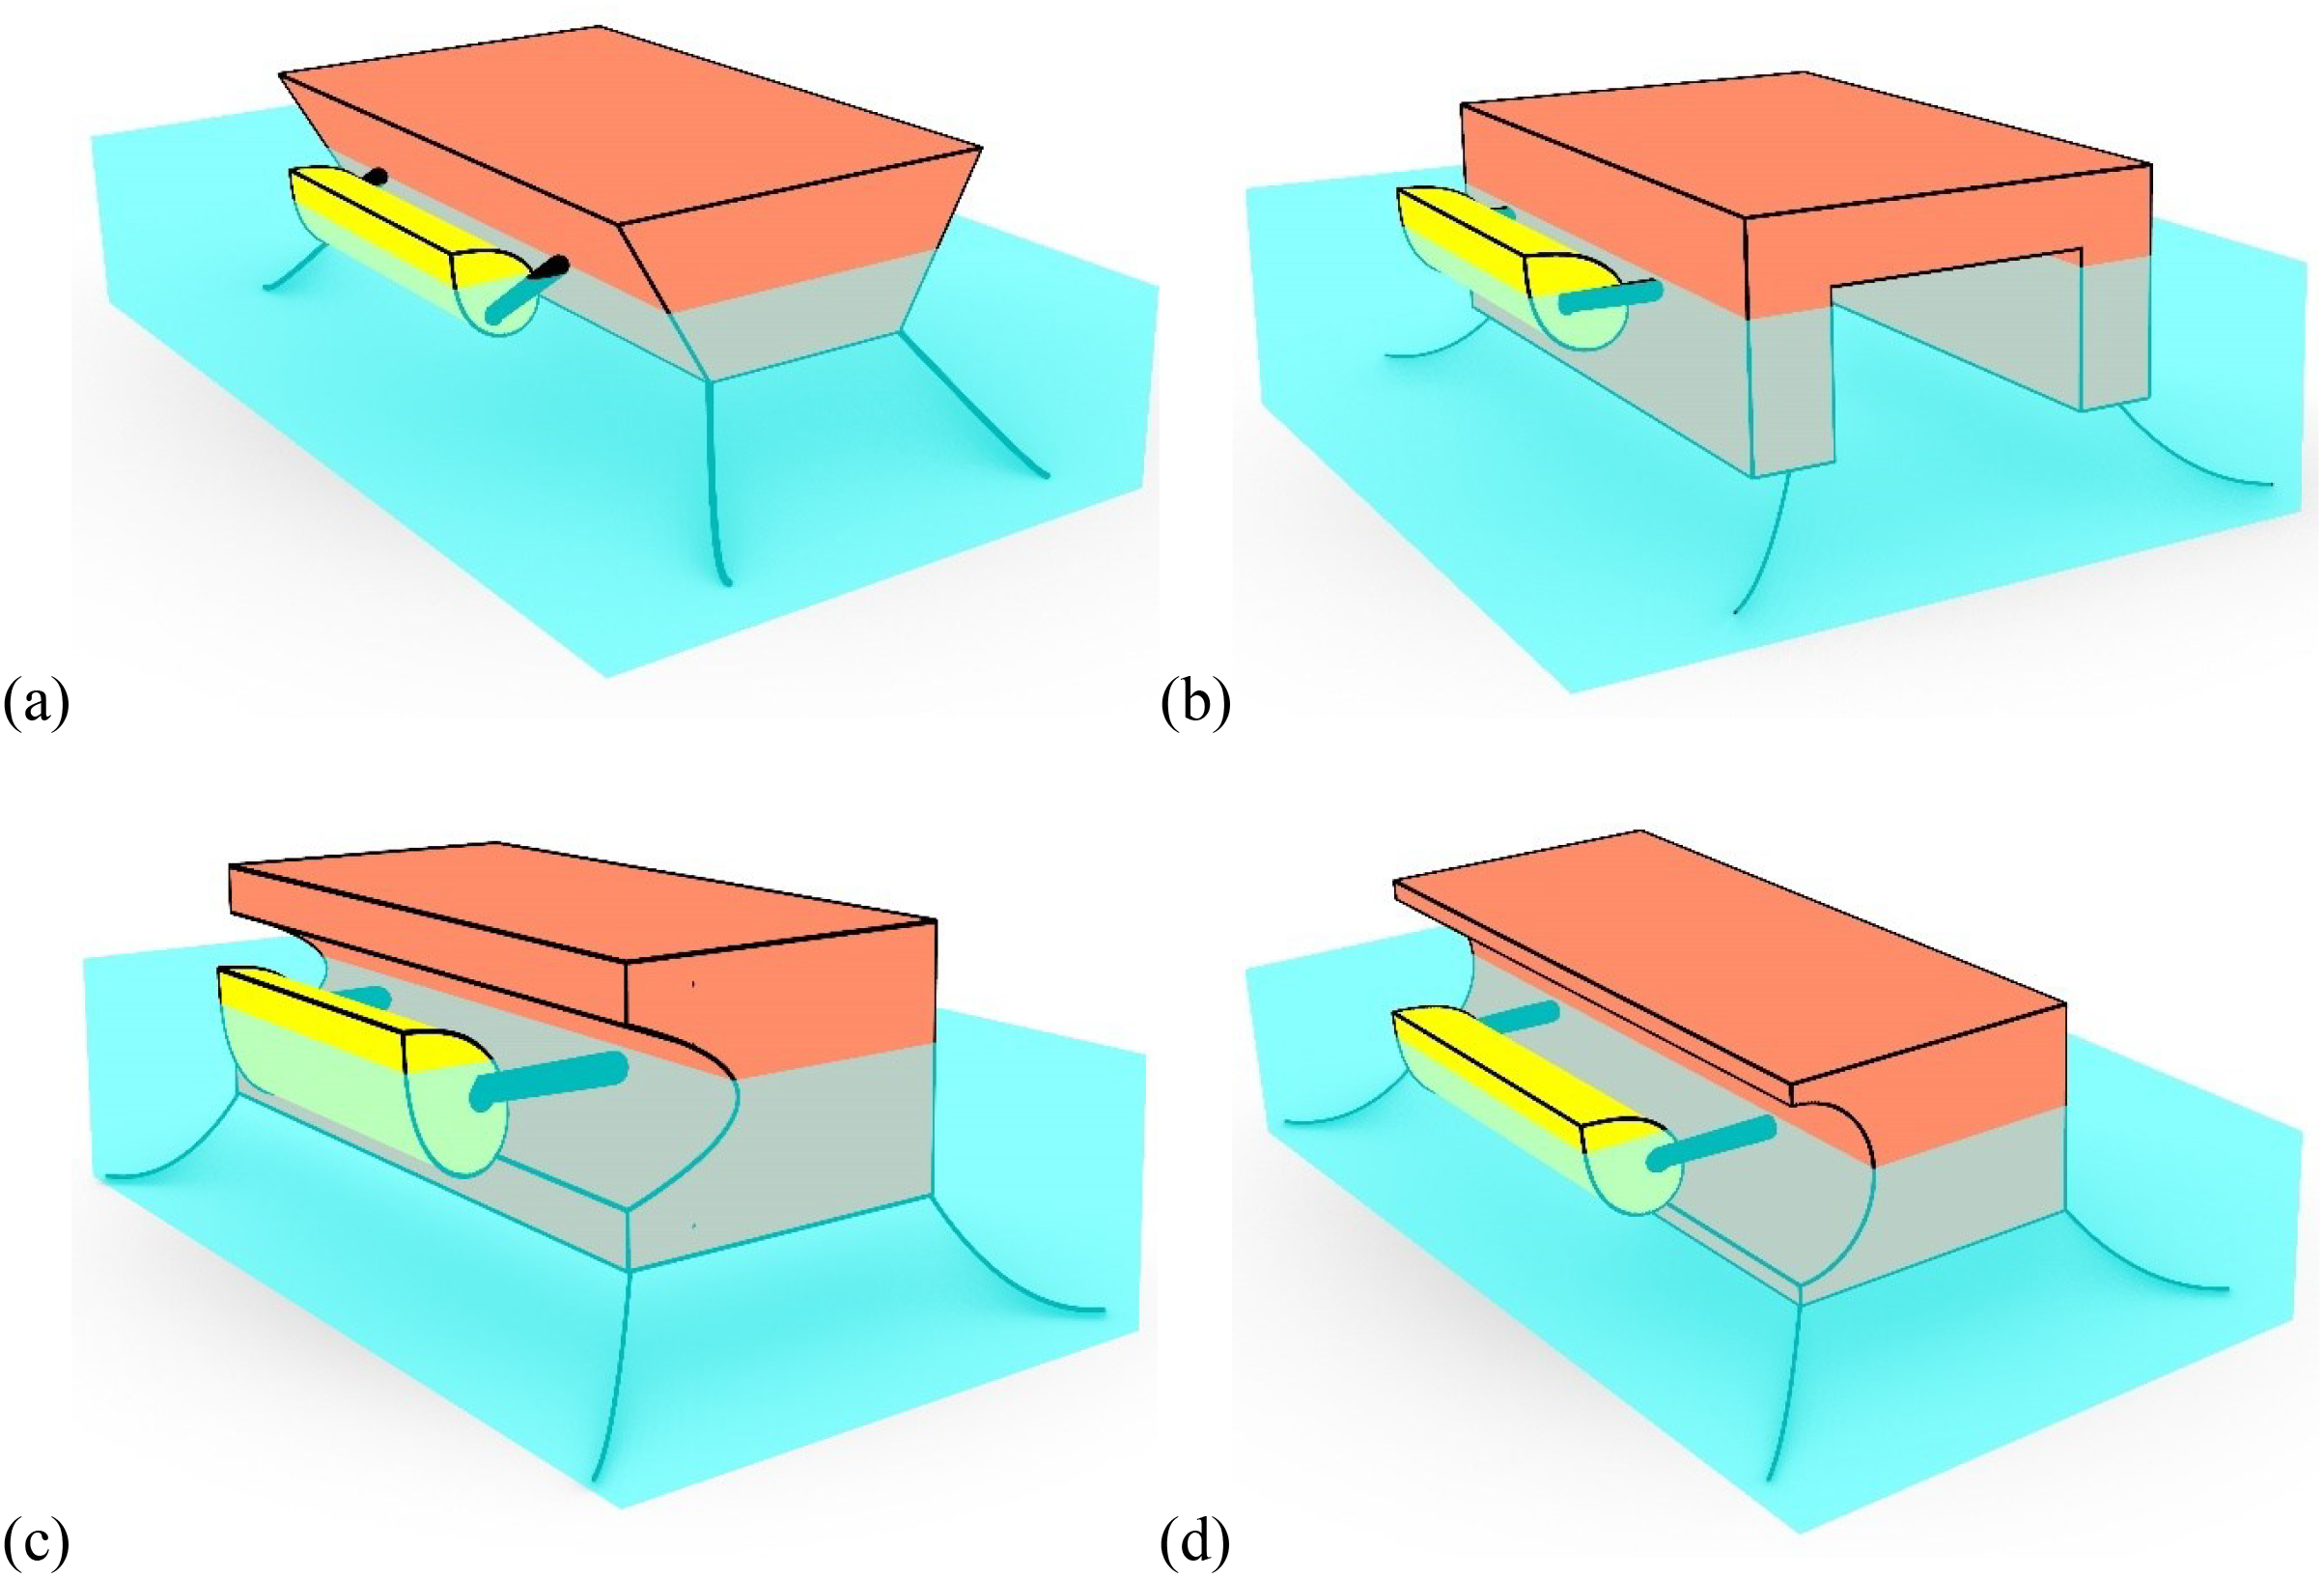
Integration of ED WEC with different shapes of breakwater (a) trapezoidal type FBW (b)FBW (c) parabolic type FBW and (d) semi-circular type FBW.
The hybrid system is analyzed for different varied parameters mentioned in Table 2 and the results are discussed in terms of dimensionless parameters and mesh convergence size of .
Table 2
| Parameters varied | Dimensionless values |
|---|---|
|
|
|
|
|
|
|
|
Parametric variations.
5 Numerical results and discussion
The numerical results for wave interaction with the hybrid ED-WEC system incorporating different FBW shapes are obtained, and the hydrodynamic performance of the device is investigated. The wave power extraction, capture width ratio, motion amplitude, and mean interaction factor are analyzed for varied structural and geometrical parameters, including the ED width, ED draft, distance between the ED-WEC and FBW, and incident wave angle. Numerical validation is performed using the results of Bellew (2011); Ning et al. (2018), and Hu et al. (2020). The numerical results obtained from the study are discussed for both the isolated ED-WEC and the ED-WEC–FBW hybrid system.
5.1 Validation of numerical model
The validation of the theoretical formulation is performed with available results from literature. The validation for array of Hemispherical WEC of radius with center to center spacing of subjected to beam sea θ = 90° and head sea θ = 0° waves and water depth of is performed and analyzed. The radius of WEC in array of hemispherical WEC is taken as with center to center spacing of subjected to beam sea θ = 90° waves and the water depth . In Figures 4a, b, the comparative study for the heave RAO and mean interaction factor for the array of hemispherical WEC is performed. The heave RAO (Figure 4a) and mean interaction factor (Figure 4b) shows a good agreement with the results obtained from literature.
Figure 4
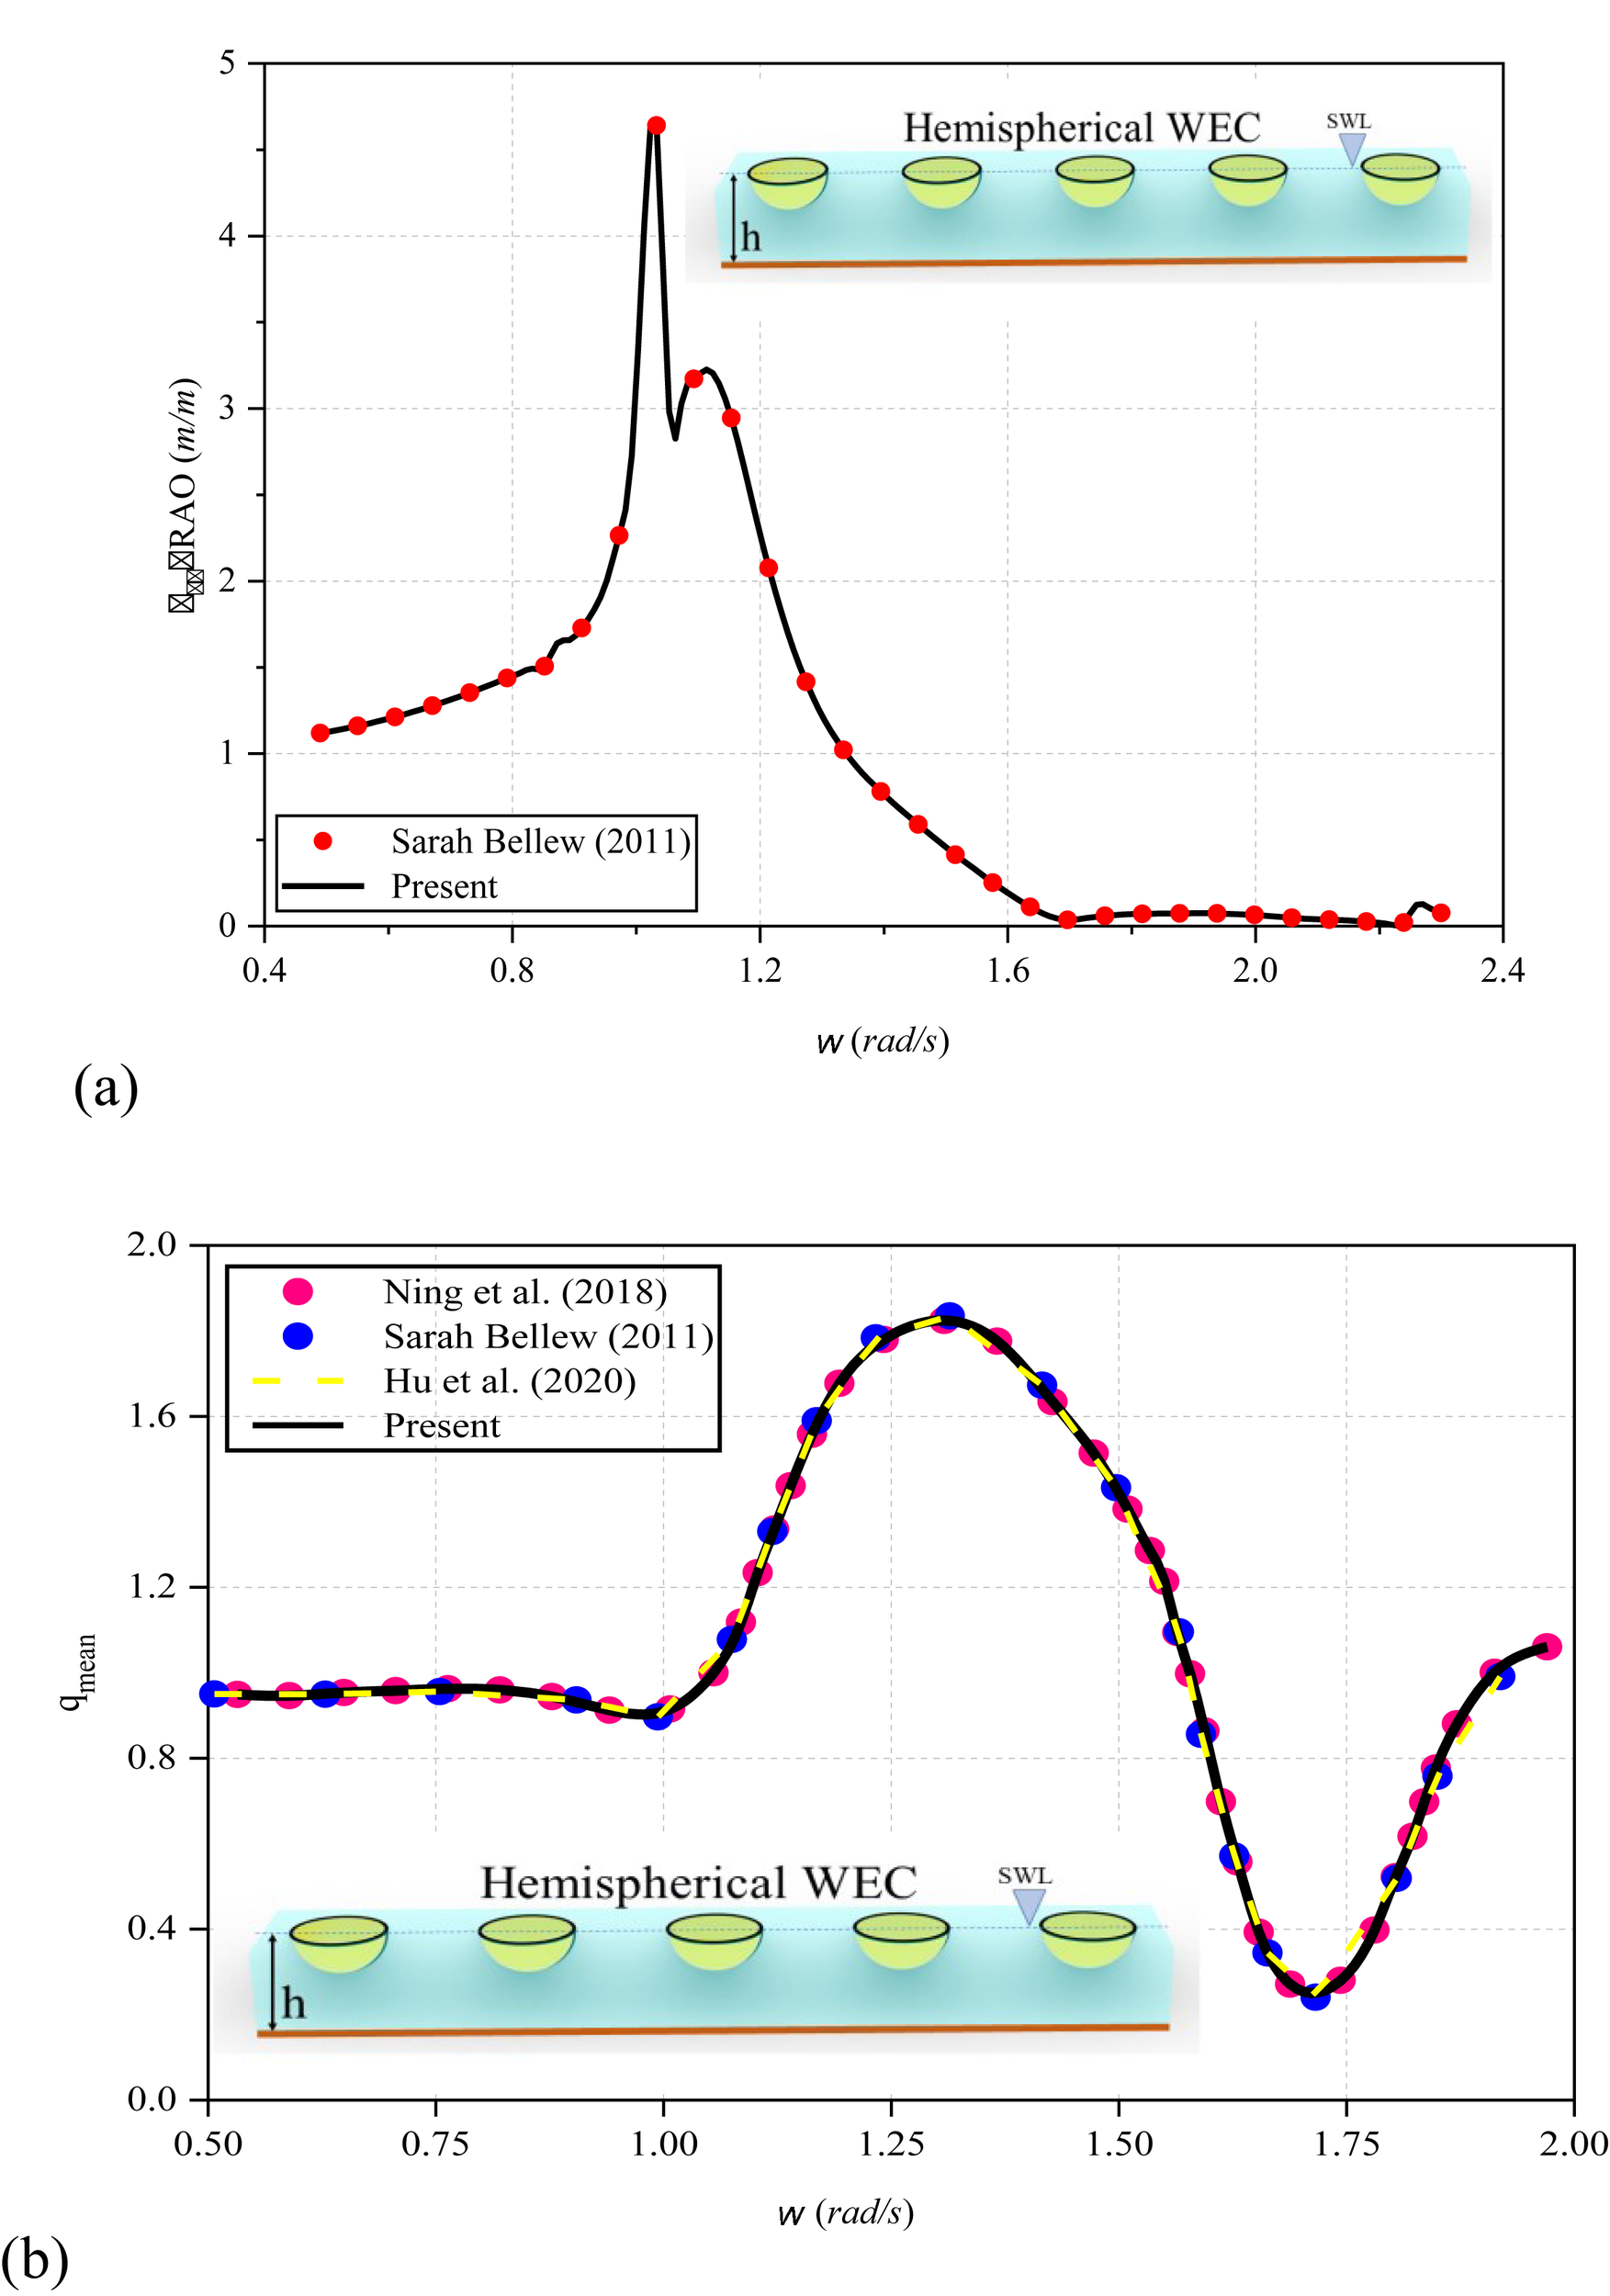
Comparative study of (a) Heave RAO with Bellew (2011) and (b) Mean Interaction factor for array of Hemispherical WEC with Ning et al. (2018); Bellew (2011) and Hu et al. (2020).
5.2 Hydrodynamic performance of the isolated ED-WEC system
The investigation of the isolated ED-WEC is performed to analyze the behavior and performance of the device in for the variation in , and wave incident angle . The variation of the capture width ratio (CWR) and wave power absorbed for variation in , and in the case of isolated system are discussed. Furthermore, the comparison between the isolated ED-WEC and the hybrid ED-WEC integrated with the trapezoidal-type FBW is analyzed. In Figures 5a, b, the CWR and the power absorbed by the isolated ED-WEC are examined for heave, roll, and pitch motions for varying In Figure 5a, it is observed that CWR for is increasing with the increase in . In the case of heave motion , large variation is observed for while linear variation is noted for . In , CWR for is 12.5% less and CWR for is 10.41% more with respect to . A minimum value is observed for at , and for and the minima is noted at , showing decrease in wave structure interaction in . The resonance condition is observed for around due to the large surface area exposed for wave structure interaction resulting in large wave excitation forces but in intermediate water depth is much less as compared to The decrease in in intermediate water depth is due to low frequency for ED-WEC resulting in low amplitude response and wave excitation force as compared with and except for . On the other hand, for s, the CWR for is less as compared to . However, the trend remains similar for with minimum magnitude, as waves interact at an angle resulting low amplitude and force. The magnitude of for and are almost similar but for different wave periods the magnitude of is 29.63% more as compared to The increment in pitch is due to the availability of large surface area for the waves to hit and generate large amplitude motion and wave excitation force for a particular wave periods.
Figure 5
Variation in (a) CWR (b) versus wave period for and for different .
In Figure 5b, it is observed that power absorption increases with the increase in width and with the resonance occurring at a particular wave period for all variations in . This may be due to the fact that, with an increase in the width of the ED, the surface area available for wave interaction increases, which results in larger wave-excitation forces, restoring torque, and motion amplitude. Since power generation depends on the motion amplitude and wave-excitation forces, along with the hydrodynamic coefficients and the waterplane area of the ED-WEC, these increases contribute to the observed enhancement in performance. The variation in power absorption in for s is nearly 48.5% less and is 22.70% more while in the power absorption is 48.95% less. The power absorption for variation in the width had a narrow time period range with increase in . This behavior restricts the selection ED having larger values of ED width. The trends in shows extreme resonance conditions at a particular time period within s for particular . Hence is best suited for the motions in .
The variation in draft, results in variation of submergence volume and hence the variations the draft results in change in hydrodynamic coefficients. In addition, the circular portion at stern of the ED-WEC also plays an important role. The circular stern part of the ED produces very small amplitude motion in the leeward which results in high capture width ratio and vice-versa (Wu et al., 2017a).
In Figures 6a, b, the variation of the capture width ratio and the power absorbed by the ED-WEC for varying is analyzed. The added mass and radiation damping are having huge variations for in their magnitude and hence a variation in CWR is observed in Figure 6a. The variation of within s is around 4.16% less as compared with . On the other hand, is 52.54% more and is almost twice the magnitude for with multi-peaks (Zhou et al., 2022) at . The CWR, in is 22.92% more as compared to within s. In intermediate water depth, at , the variation is in range of 18.75% more in . In Figure 6b, it is observed that with increase in draft of ED the wave power absorption is increasing. Further, with continuous width increment, the wave power absorption differences between increments tends to converge. In intermediate water depth, the power absorption in very less and tends to converge for higher time periods.
Figure 6
Variation in (a) CWR (b)for , for different .
The variation in the incident angle plays an important role in motion of structure. In Figure 7a, it is observed that for s, with increase in , the capture width ratio for decreases as the motion amplitude decreases. Similarly, the CWR in increases with increase in . The study noted that, for on increasing , the component of incident wave magnitude is increased while, in intermediate water depths all values tend to converge with . It is noticed that for the magnitude of CWR in is approximately negligible. Hence for the structure oriented to transverse direction of wave progression, the ED-WEC system is dependent only on heave motion leading to the total efficiency reduction of the system.
Figure 7
Variation in (a) CWR (b)for , for different .
In Figure 7b, with increase in the power absorption in decreases whereas the power absorption increases in with increase in . In , the variation is 19.11% more and 44.78% less compared to but in , it is 77.34% more. In intermediate water depth, the variation observed in power absorption is negligible in and leading the system to be dependent on heave resulting in the reduction of net efficiency of the system. Thus, to increase total net efficiency of the system, the orientation of system at should be avoided. Further, for higher , the power absorbed tends to converge. Hence, suitable wave incident angle will be within the range which confines the efficiency in pitch (Zhou et al., 2021).
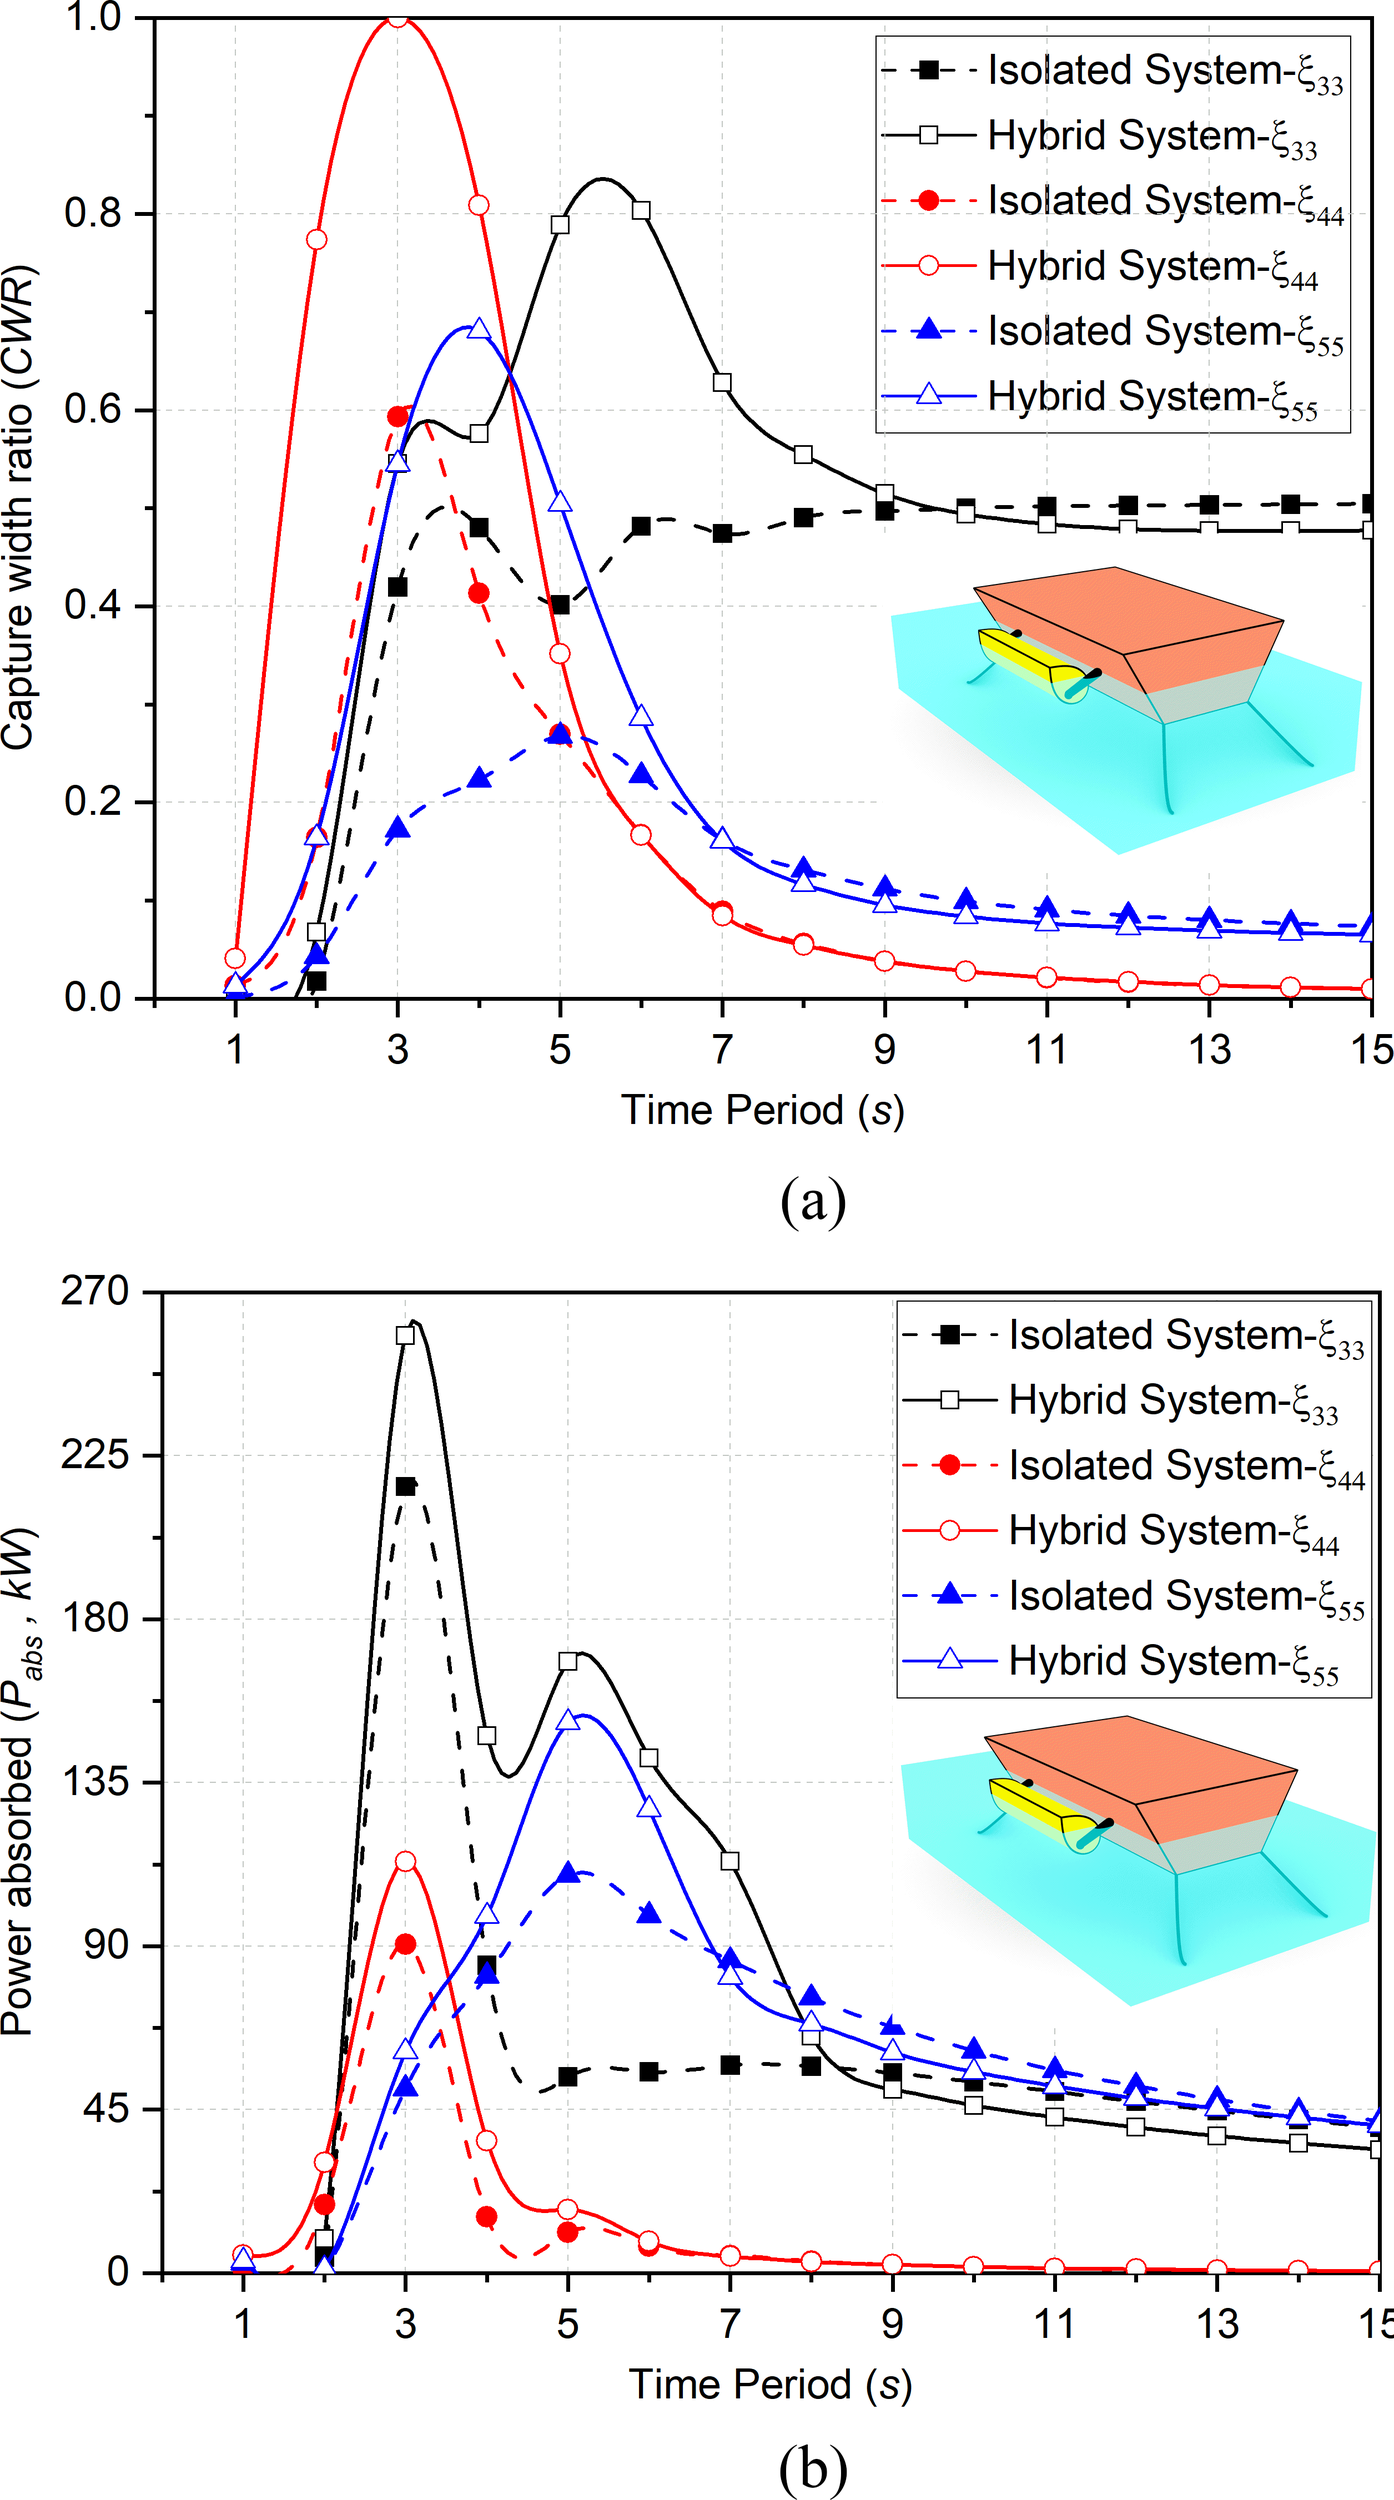
The comparative study of the trapezoidal floating breakwater in hybrid systems and the isolated system is performed considering in Figures 8a, b. In Figure 8a, it is observed that the integration of ED with FBW results in the increase in CWR. The increment in CWR for the hybrid system as compared to isolated system is of 62.50%, 67.80% and 52% for respectively within s with phase differences. However, for intermediate water depths a destructive interference is observed for hybrid systems as integration of BW results in the decrement of CWR in the range of 3% to 9% for in and for s in . For in intermediate water depths, the behavior of isolated and hybrid system is identical which shows that it can perform better in . In Figure 8b it is observed that power absorption is increased by integration of ED with FBW. The trends of power absorption are similar to that of CWR and the increment for hybrid system compared to isolated system is around 19.49%, 25.11% and 38.29% in respectively for s while in intermediate water depth the power absorption is reduced by 9% in for s and 10.45% in for s. The increase in hybrid system in is due to the reflected waves which adds restoring torque for the ED.
Figure 8
Comparison between isolated and hybrid system for (a) CWR and (b) considering , and .
5.3 Hydrodynamics performance of the hybrid system
The hybrid system consisting of two or more integrated structure is used to enhance the performance of WEC by utilizing scattered and reflected waves to absorb more power. In addition, the integrated structure helps to reduce additional mooring cost and increases the reliability of WEC by increasing its efficiency. The present section deals with the investigation of hybrid system of ED-WEC integrated with FBW. The hydrodynamic characteristics and performance of hybrid system in for variation of the structural parameters of ED-WEC are discussed. The variation of is the one of the important parameters affecting wave attenuation, hydrodynamic characteristics and behavior of the hybrid system. also plays an important role in the analysis of the behavior of system, as increase in draft results in increase in buoyancy force and restoring torque as the submerged volume of the system is increased (Zhou et al., 2021). is also the most important parameter in deciding the installation position of WEC from the oceanic structures in order to make the system perform effectively (Zhou et al., 2022). The variation in effects the behavior and response of the structure and results in the hybrid system to get inclined towards a specific DOF. In this section, power absorption, motion amplitude and capture width ratio are discussed.
5.3.1 Power absorption
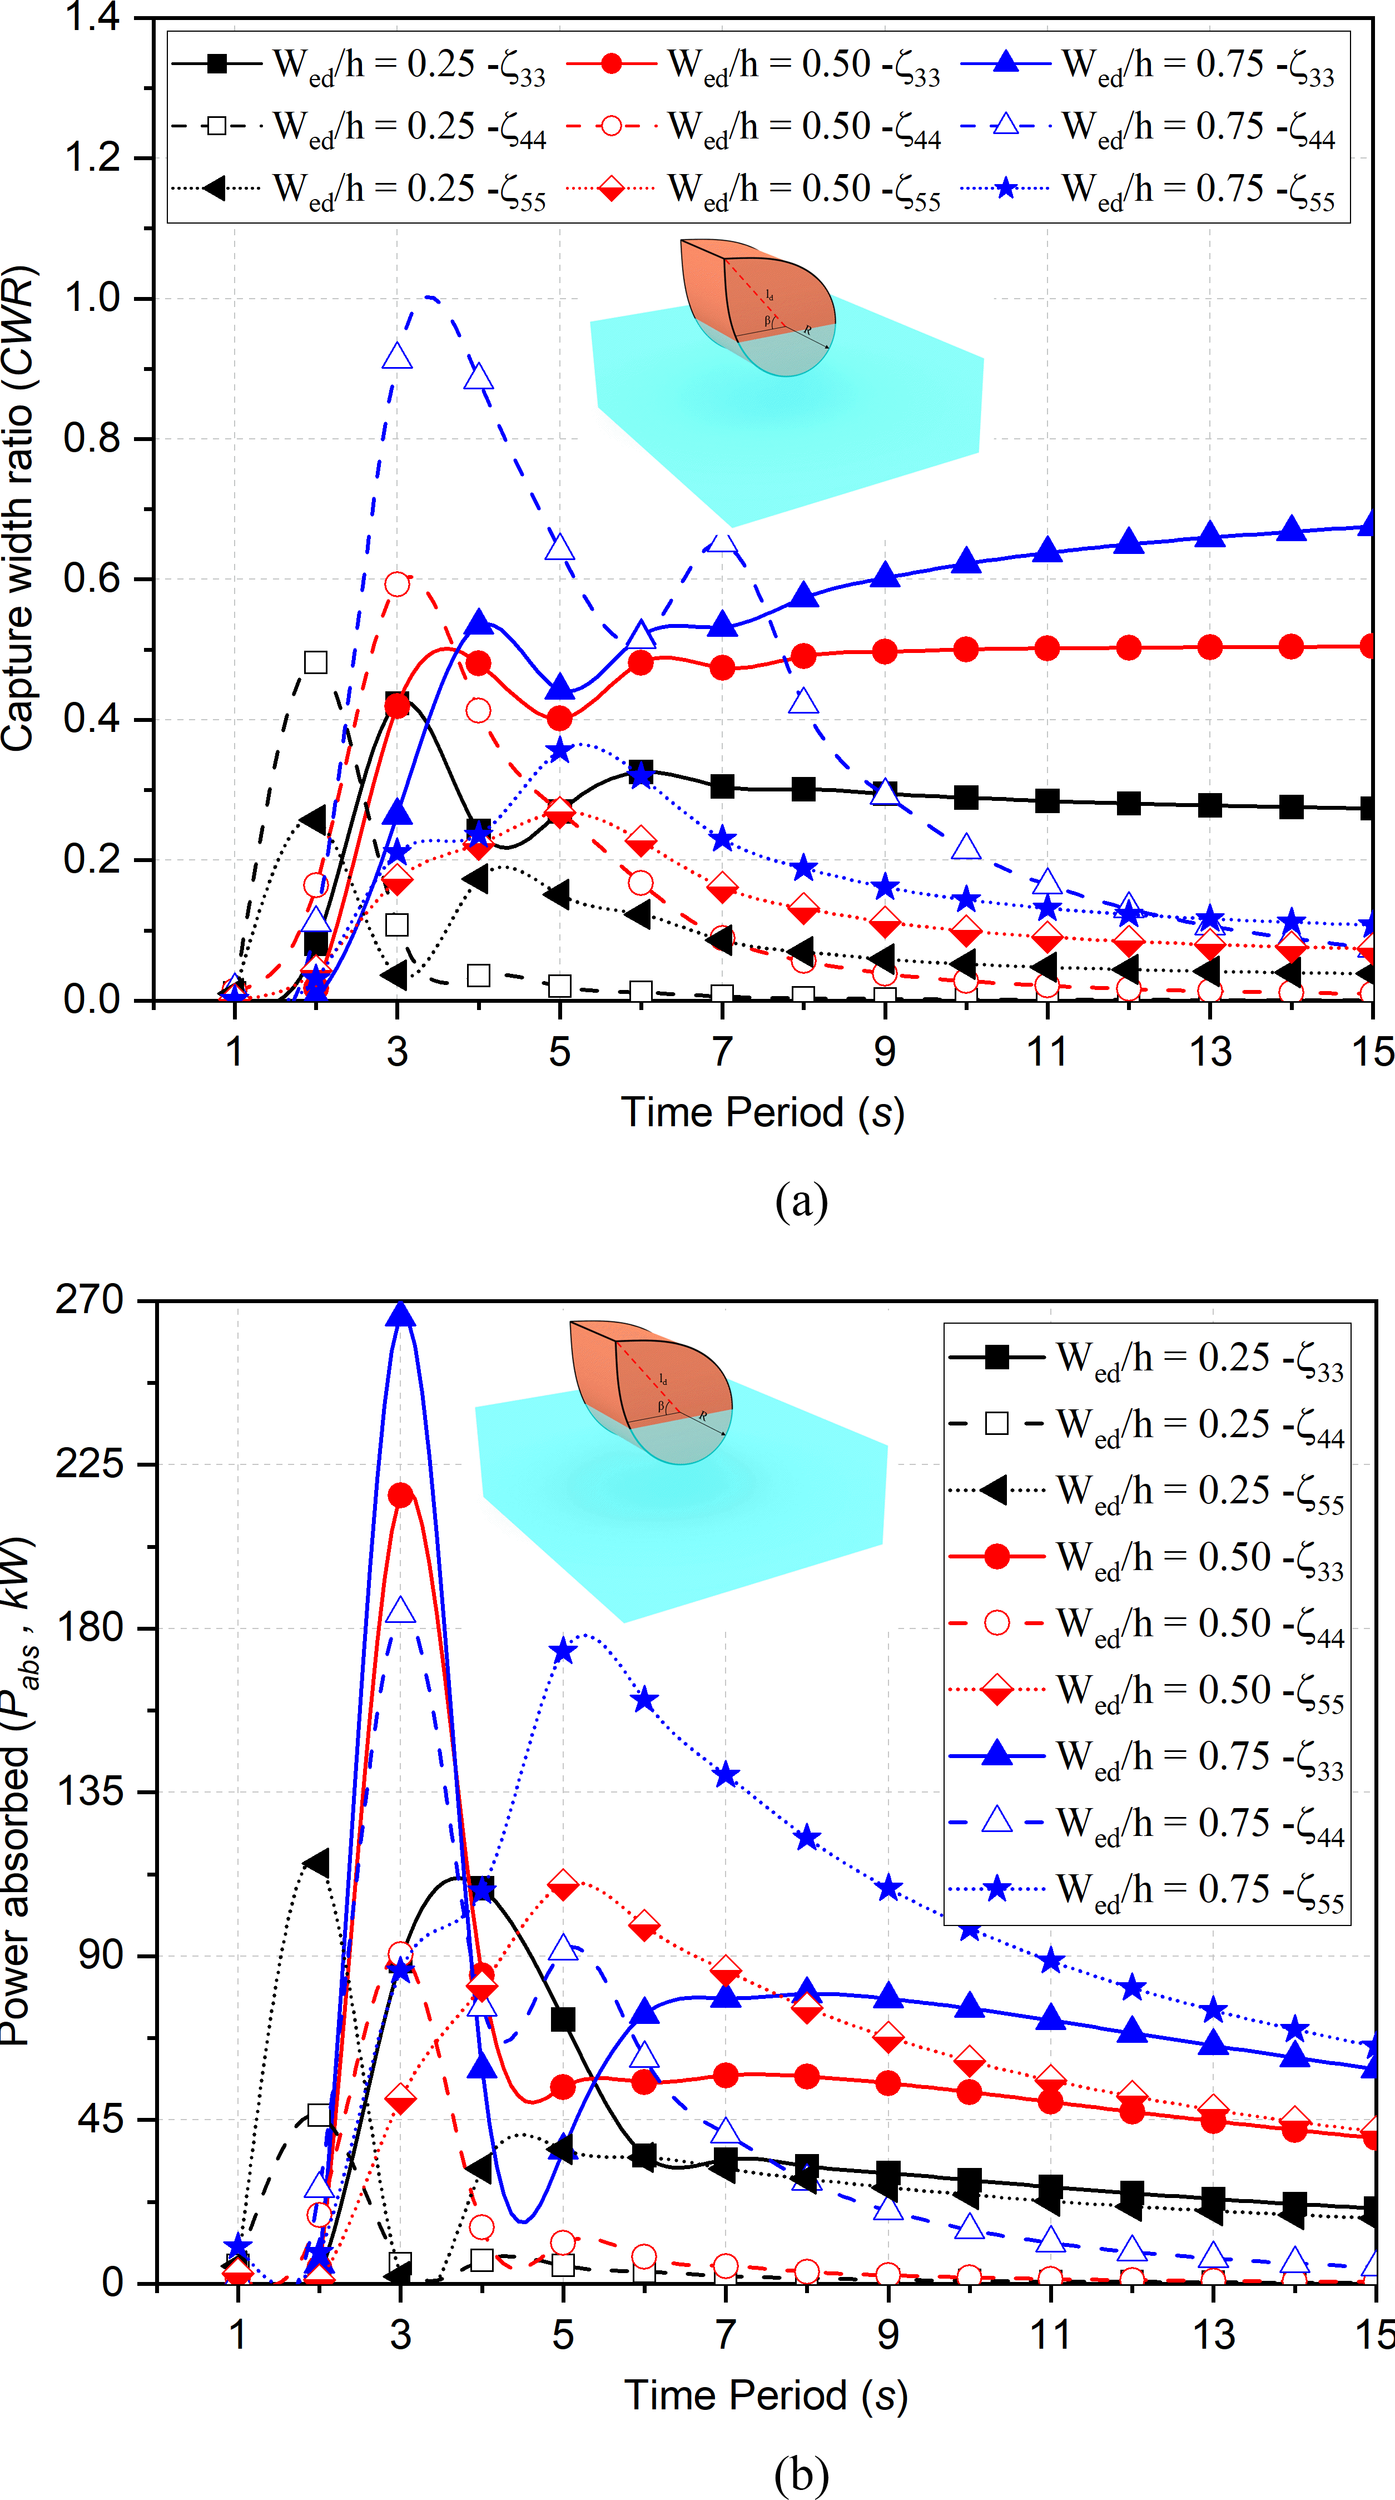
In this subsection, the power absorption in is discussed for the variation in dimensionless , , and . In Figure 9a, it is observed that for s with the increase in different behavior is observed for . At with increase in , the is observed to decrease and at s, the is noted to increase. The maximum for is 24.60% more and is 10.59% more compared to . On the other hand, for increases and thereafter starts decreasing which may be due to the optimal width of ED. In the case of optimal width of ED, the energy absorbed is effective and efficient. As compared to , the power absorption in is 73.50% more while in it is 8.76% more. In intermediate water depth (s) it is observed that for all widths converge for higher time periods. In Figure 9b, the for different is analyzed and it is observed that for s, the large variation is observed as the change in draft results in change in submergence volume of the system and hydrodynamic coefficients varies at great extent. The increment in may be due to the increase in buoyancy force in addition to large surface area of the system to absorb energy while in , the increase in submergence volume from to , increases power absorption but further increment, results in the decrement of power absorption. This is because with increase in draft, the requirement of torque increases which results in decrement of and hence power absorption decreases. Further, the power absorption for is 20.62% less as compared to . As compared to , the power absorption in is 73.50% more while in it is 8.76% more. In intermediate water depth, the for all drafts converges.
Figure 9
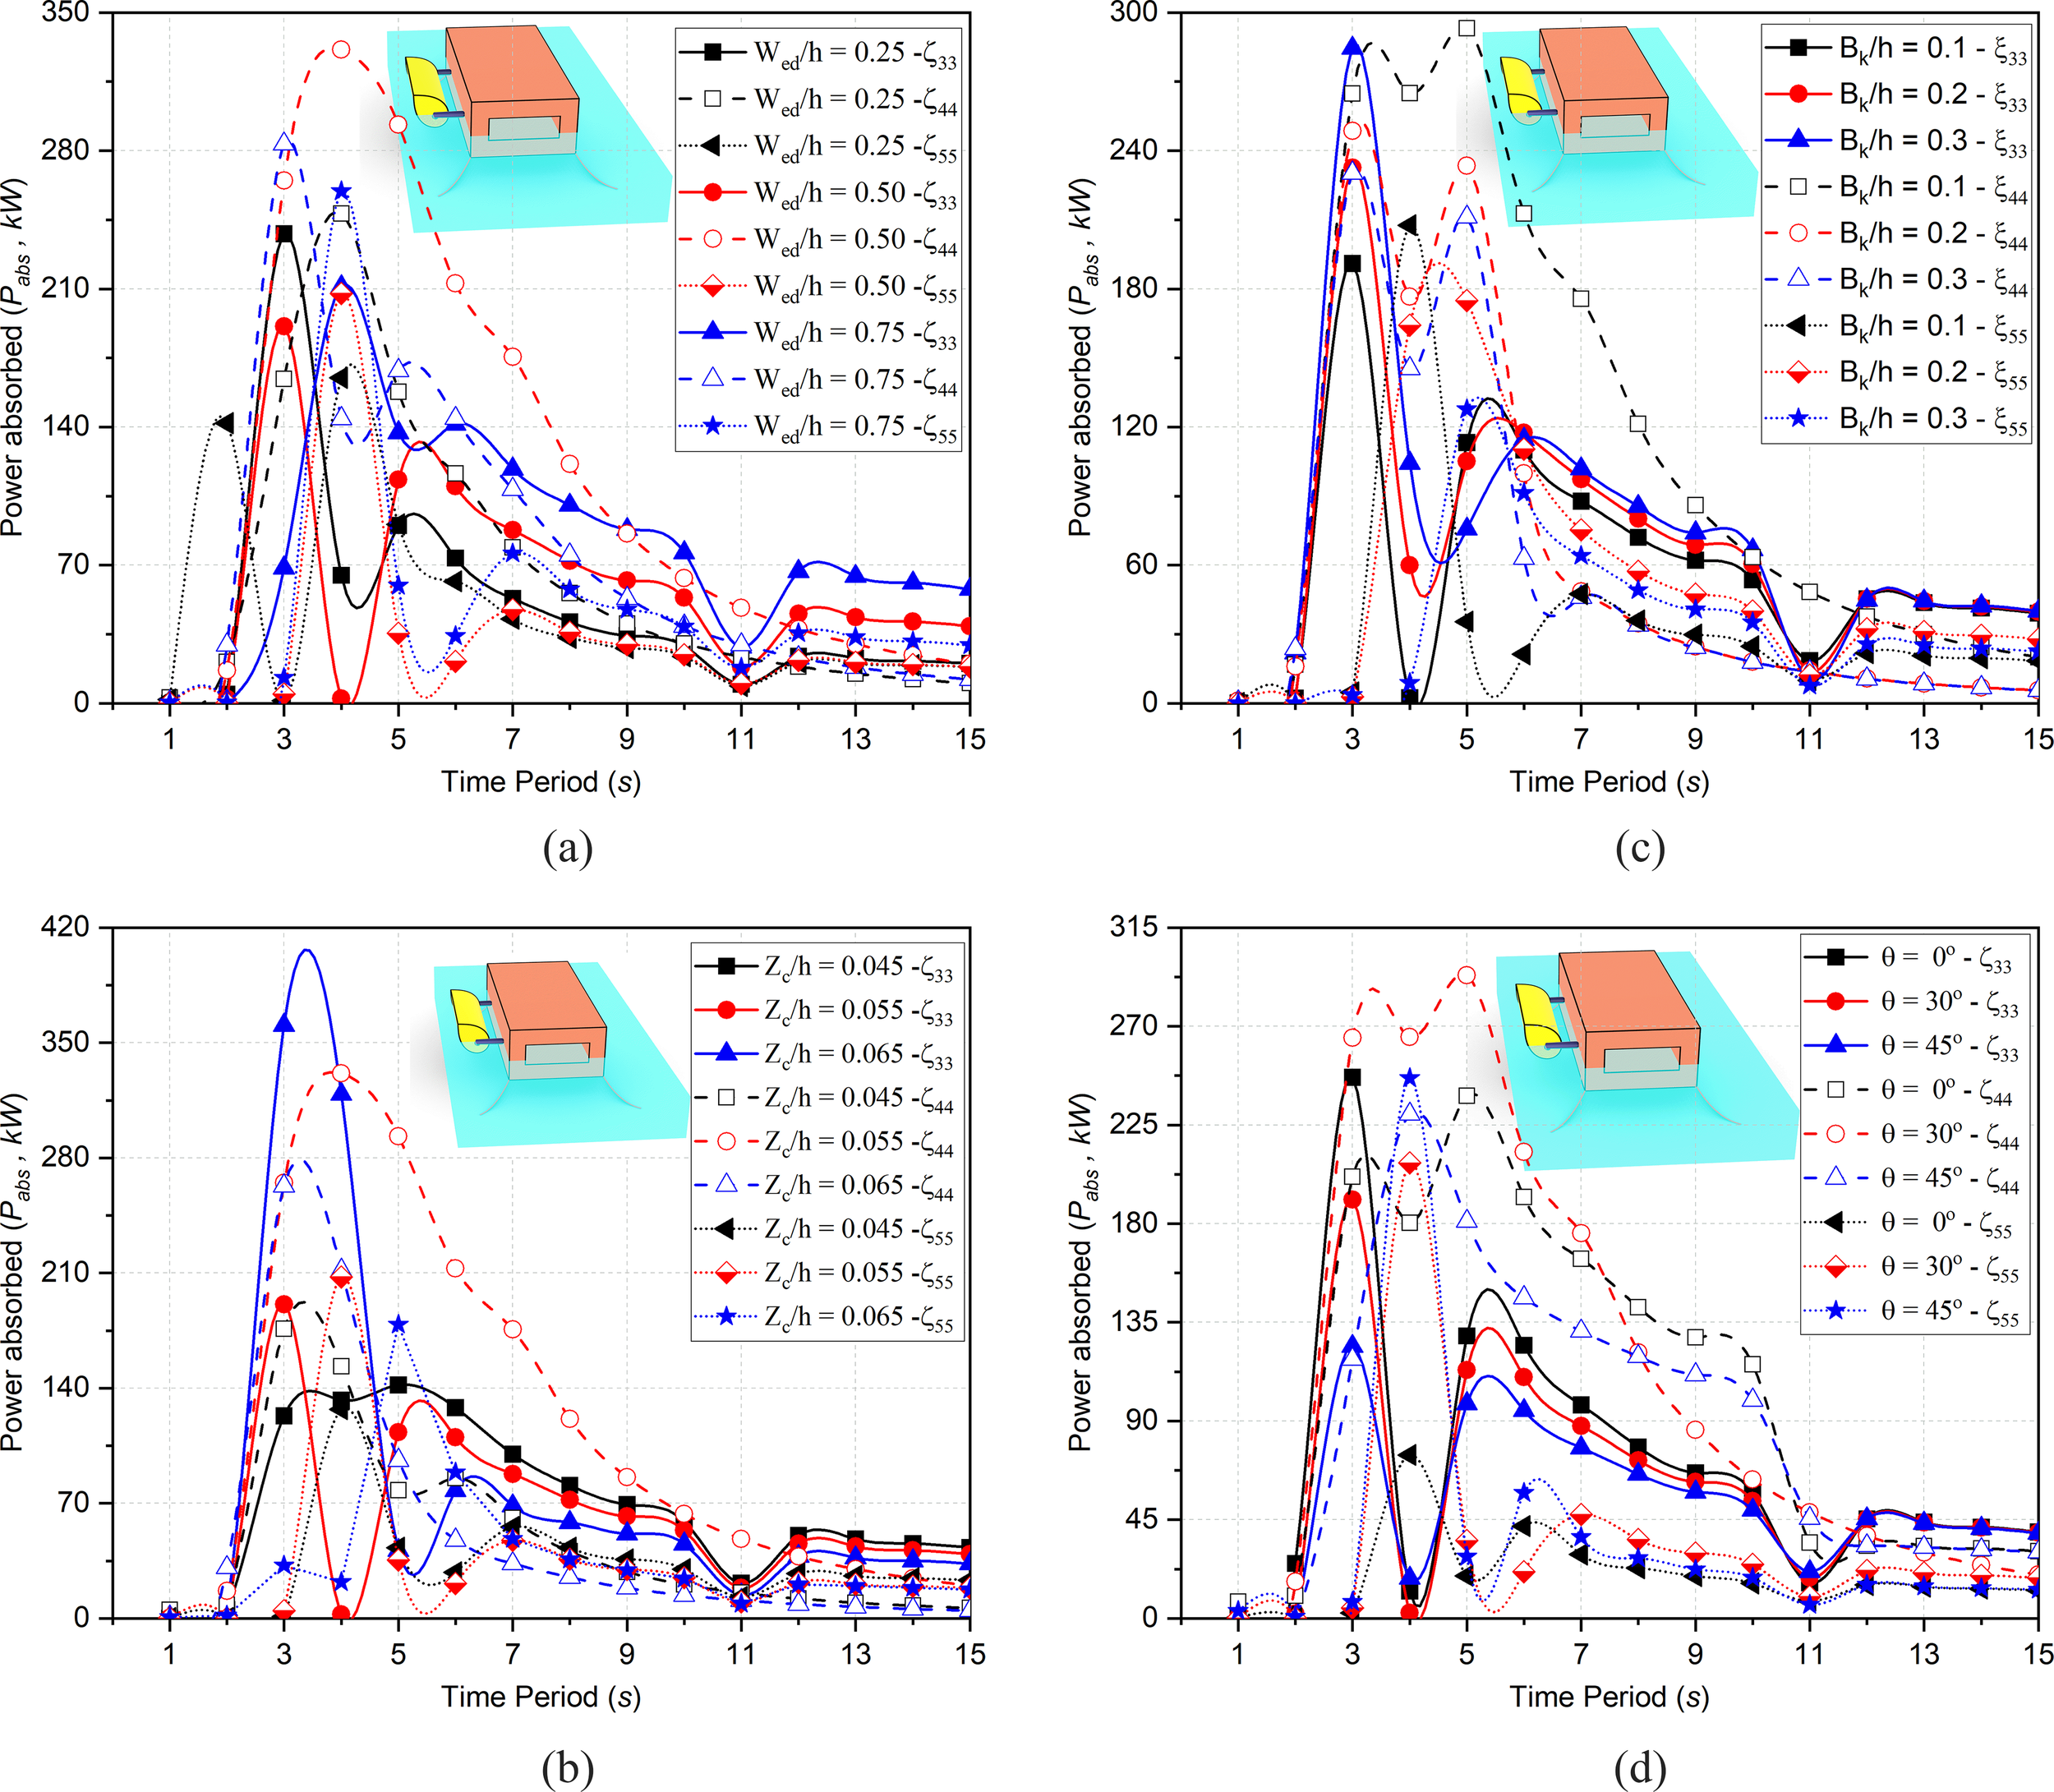
Variation in for different (a)(b)(c) and (d).
In Figure 9c, power absorption for dimensionless are discussed for . It is observed that with increase in , the increases for . This is because for greater distance, the reflected waves add on to the incident waves effectively in by gaining fetch distance and helps in increasing the energy capturing capacity. As compared to , the for is 21.80% more whereas for is 30.16% more. On the other hand, in , the decreases with increase in distance as the energy of the waves after reflection start dissipating and hence contributes to the restoring torque which decreases. Here it is to be noted that for , the interaction of the wave profile is significant along with the energy but in and the wave incident energy is more significant rather than wave profile. Hence, as distance increases between ED and structure, the contribution of scattered and reflected waves decreases. Thus, the by the ED with FBW is 15.24% less and is 21.47% less in magnitude compared with .
In Figure 9d, the power absorption for different incident angle is discussed in . It is noted that the power absorption in decreases with increase in as change in angle will result in decrease in heave and increase in other DOF. However, the overall power absorption of the ED with FBW system will be approximately same as the effects of only distributes the power with some negligible loss. As compared to in , the power absorption is 22.6% less and is 49.7% less for and respectively. Similarly, in , the power absorption is increased for to and then again decreased. Hence the variation in results only in change in efficiency of the system in different DOF without much variation in overall performance of the system within a specific range.
5.3.2 Motion amplitude of ED with FBW
The motion amplitude of ED with FBW in is discussed for variation in , and in Figures 10a-d. The motion amplitude for (Figure 10a) in is observed to decrease with increase in for the same wave incident energy, due to distribution of energy over a large surface area resulting in decrease in heave amplitude. Similarly, in the variation for and is minimum. In heave motion, is decreased due to the energy reduction in the vertical direction (displacement) whereas in roll and pitch motion, the variation in amplitude is due to the variation in generated restoring torque. In s, the variation in for is 45.64% more and is 18.46% less. In , the is 16.67% more and is 2.22% less and in , the is 46.37% less and is 13.75% less. In intermediate water depth, all DOF behaves similar without any major significant change except for heave motion. In heave at the failure is observed as a decrement in amplitude motion due to reduction in wave-structure interaction.
Figure 10
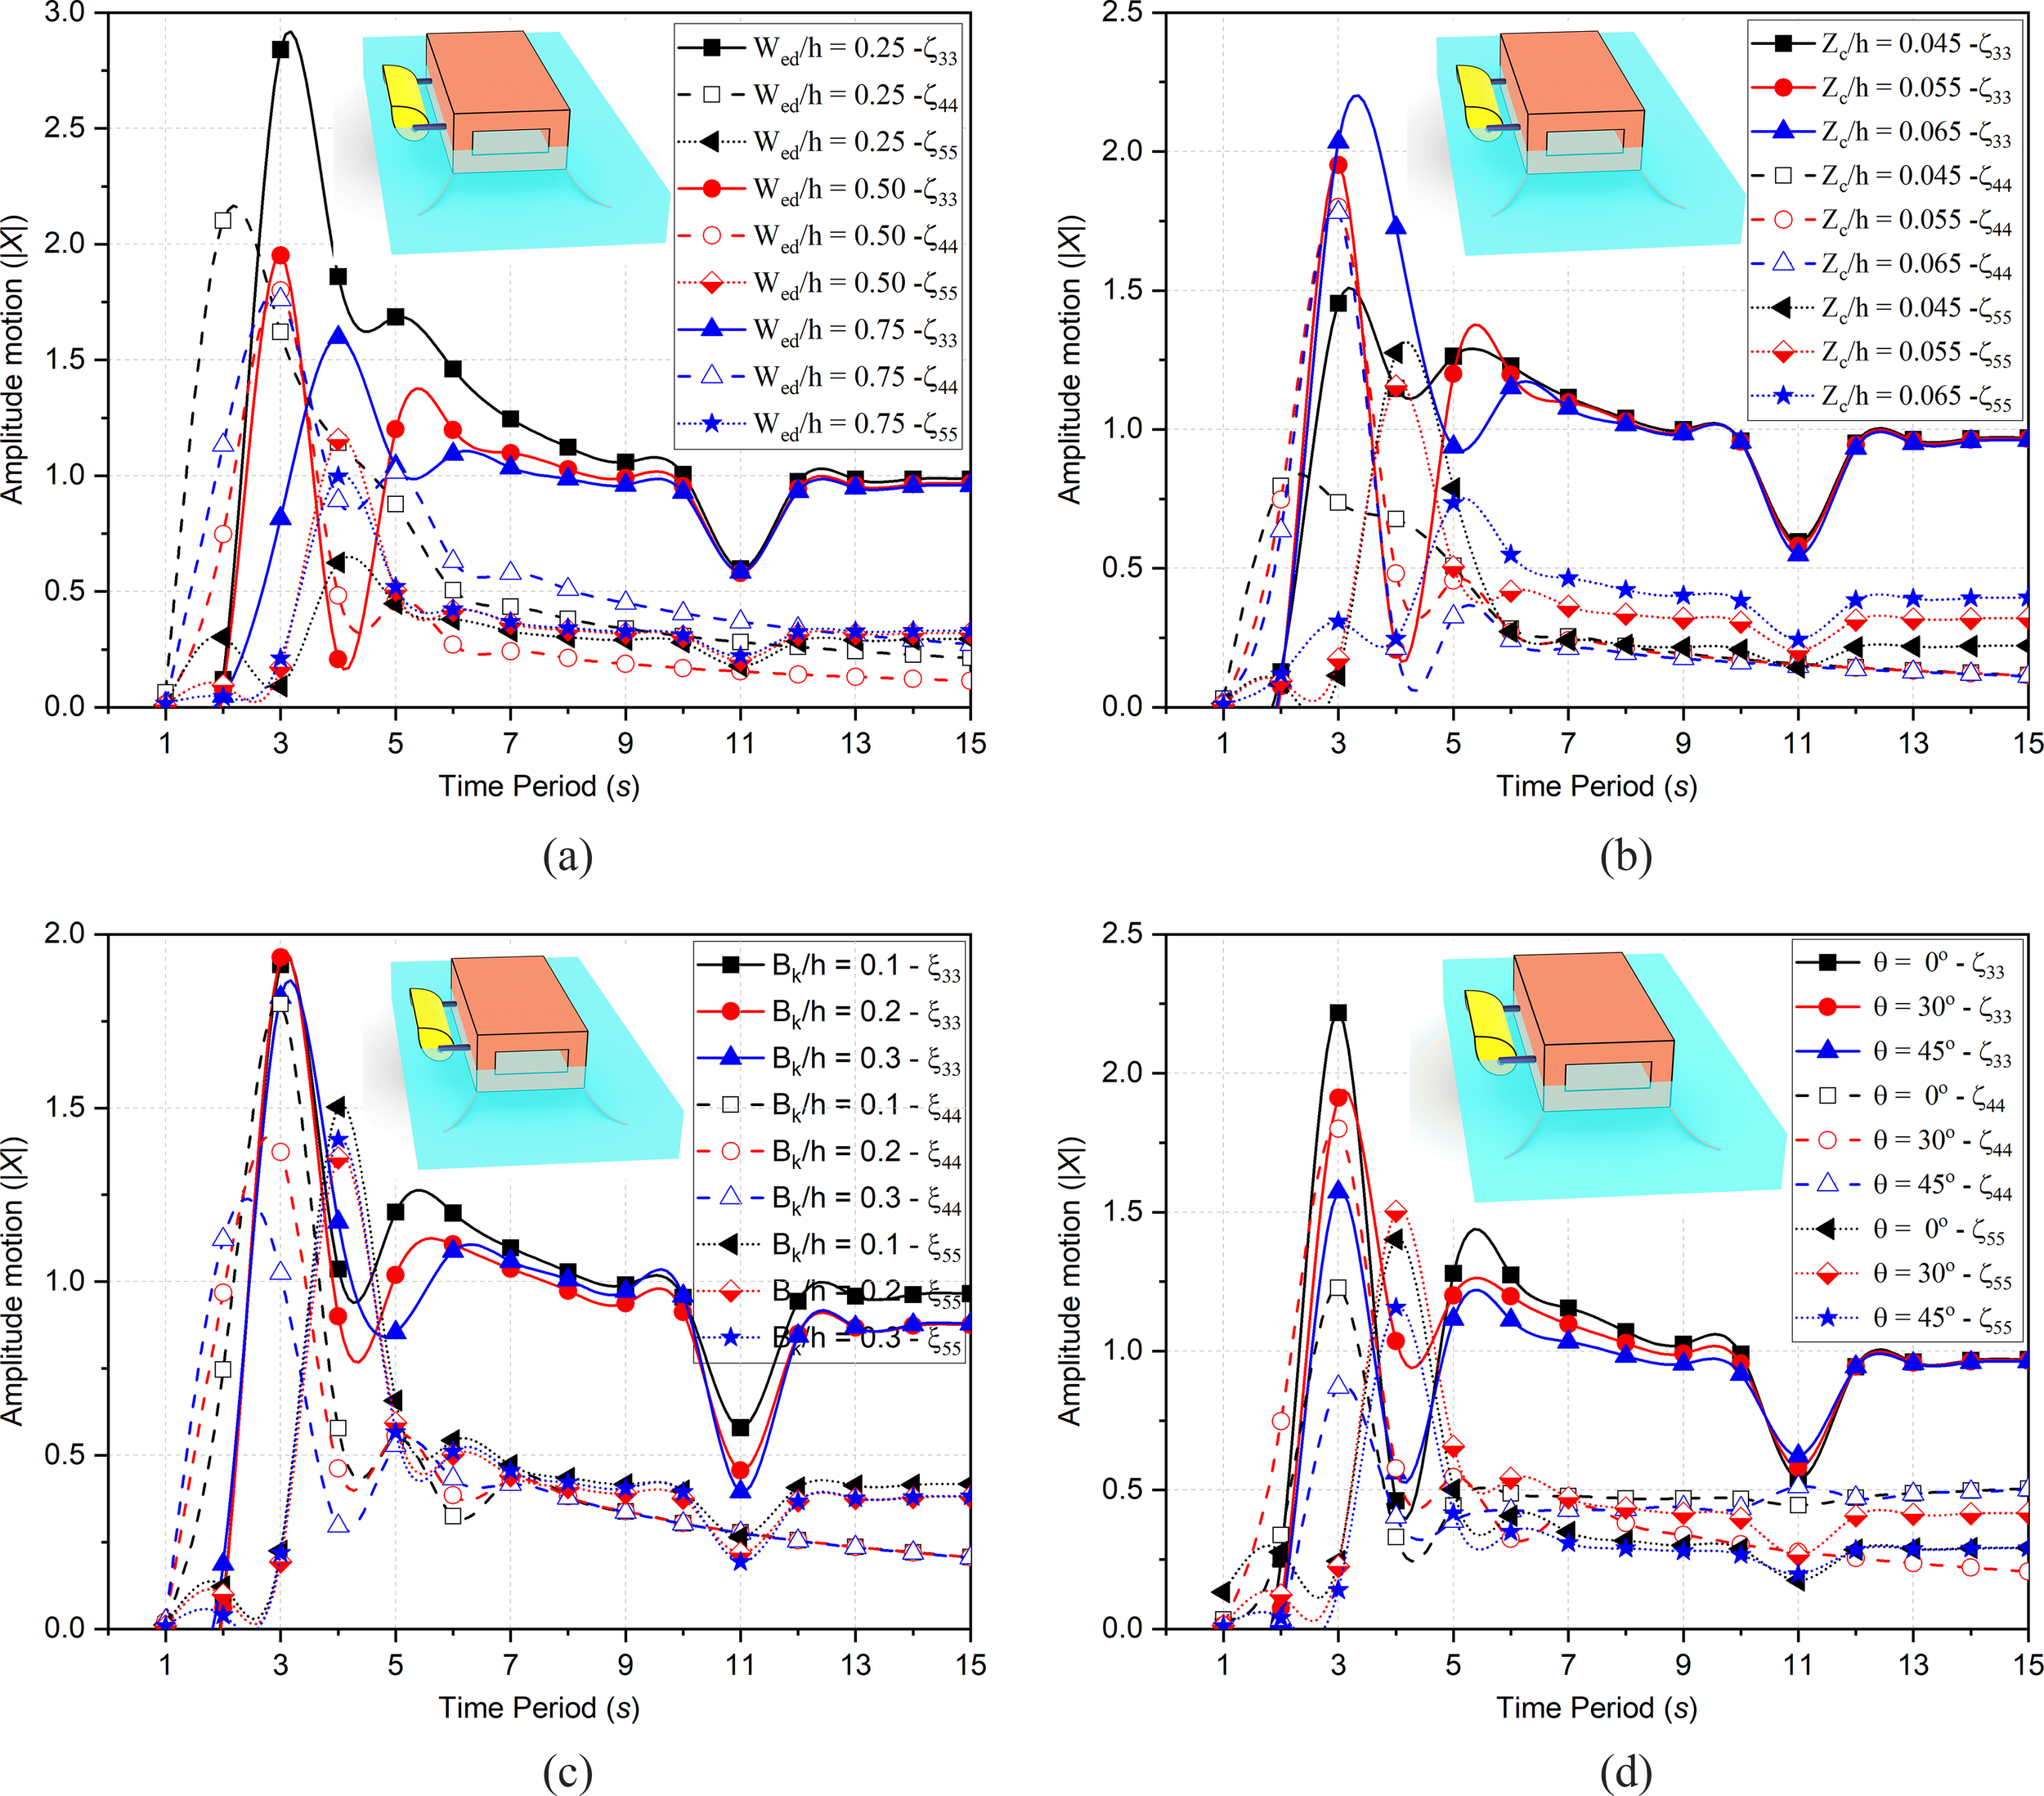
Variation in motion amplitude for different (a)(b)(c) and (d).
In Figure 10b, the motion amplitude for are discussed for . It is observed that for s with the increase in draft of ED, the motion amplitude for increases, while in the motion amplitude increases and in with increase in draft of ED the motion amplitude decreases (Zhou et al., 2021) for a range of time period. The reason for the increase in is the increase of submerged volume which result in increase of buoyancy force while in the increase in draft results in developing stiffness against restoring force due to more submergence and for the decrement is due to large submergence volume of ED-WEC. In , the maximum motion amplitude is 25.64% less and is 4.10% more, but in it is 56.12% less and 1.1% more whereas in , it is 5.40% more and is 36.52% less. In intermediate water depths, all DOF tends to converge and behaves identical except for the roll motion amplitude. In Figure 10c the motion amplitude for is discussed for . It is observed that for the variation is not observed in their peak values as well as up to in . Minor variation is observed between s, as the motion amplitude is decreasing with increase in distance. Whereas in , with the increases in distance, the motion amplitude gets decreased. As compared to , the motion amplitude for is 23.70% less while for is 37.66% less. In , minimal variation is observed (Zhou et al., 2022). In intermediate water depths, the translational DOF behaves similar manner whereas rotational DOF behaves nearly identical.
In Figure 10d, the motion amplitude for varied is discussed in . It is observed that in with increase in , the motion amplitude is decreasing due to increase in the incident wave angle from to . As compared to in , the motion amplitude in is 13.78% less and for is 29.07% less. Similarly, in the notion amplitude increases from to but for it is again decreasing as the increase in angle of incidence, the reflected and scattered waves will interact with the structure at an angle. In the motion amplitude is 46.52% more and 29.07% less for and . In the behavior for wave incident angle is similar to that of and the motion amplitude is 7.2% more and is 17.52% less for and .
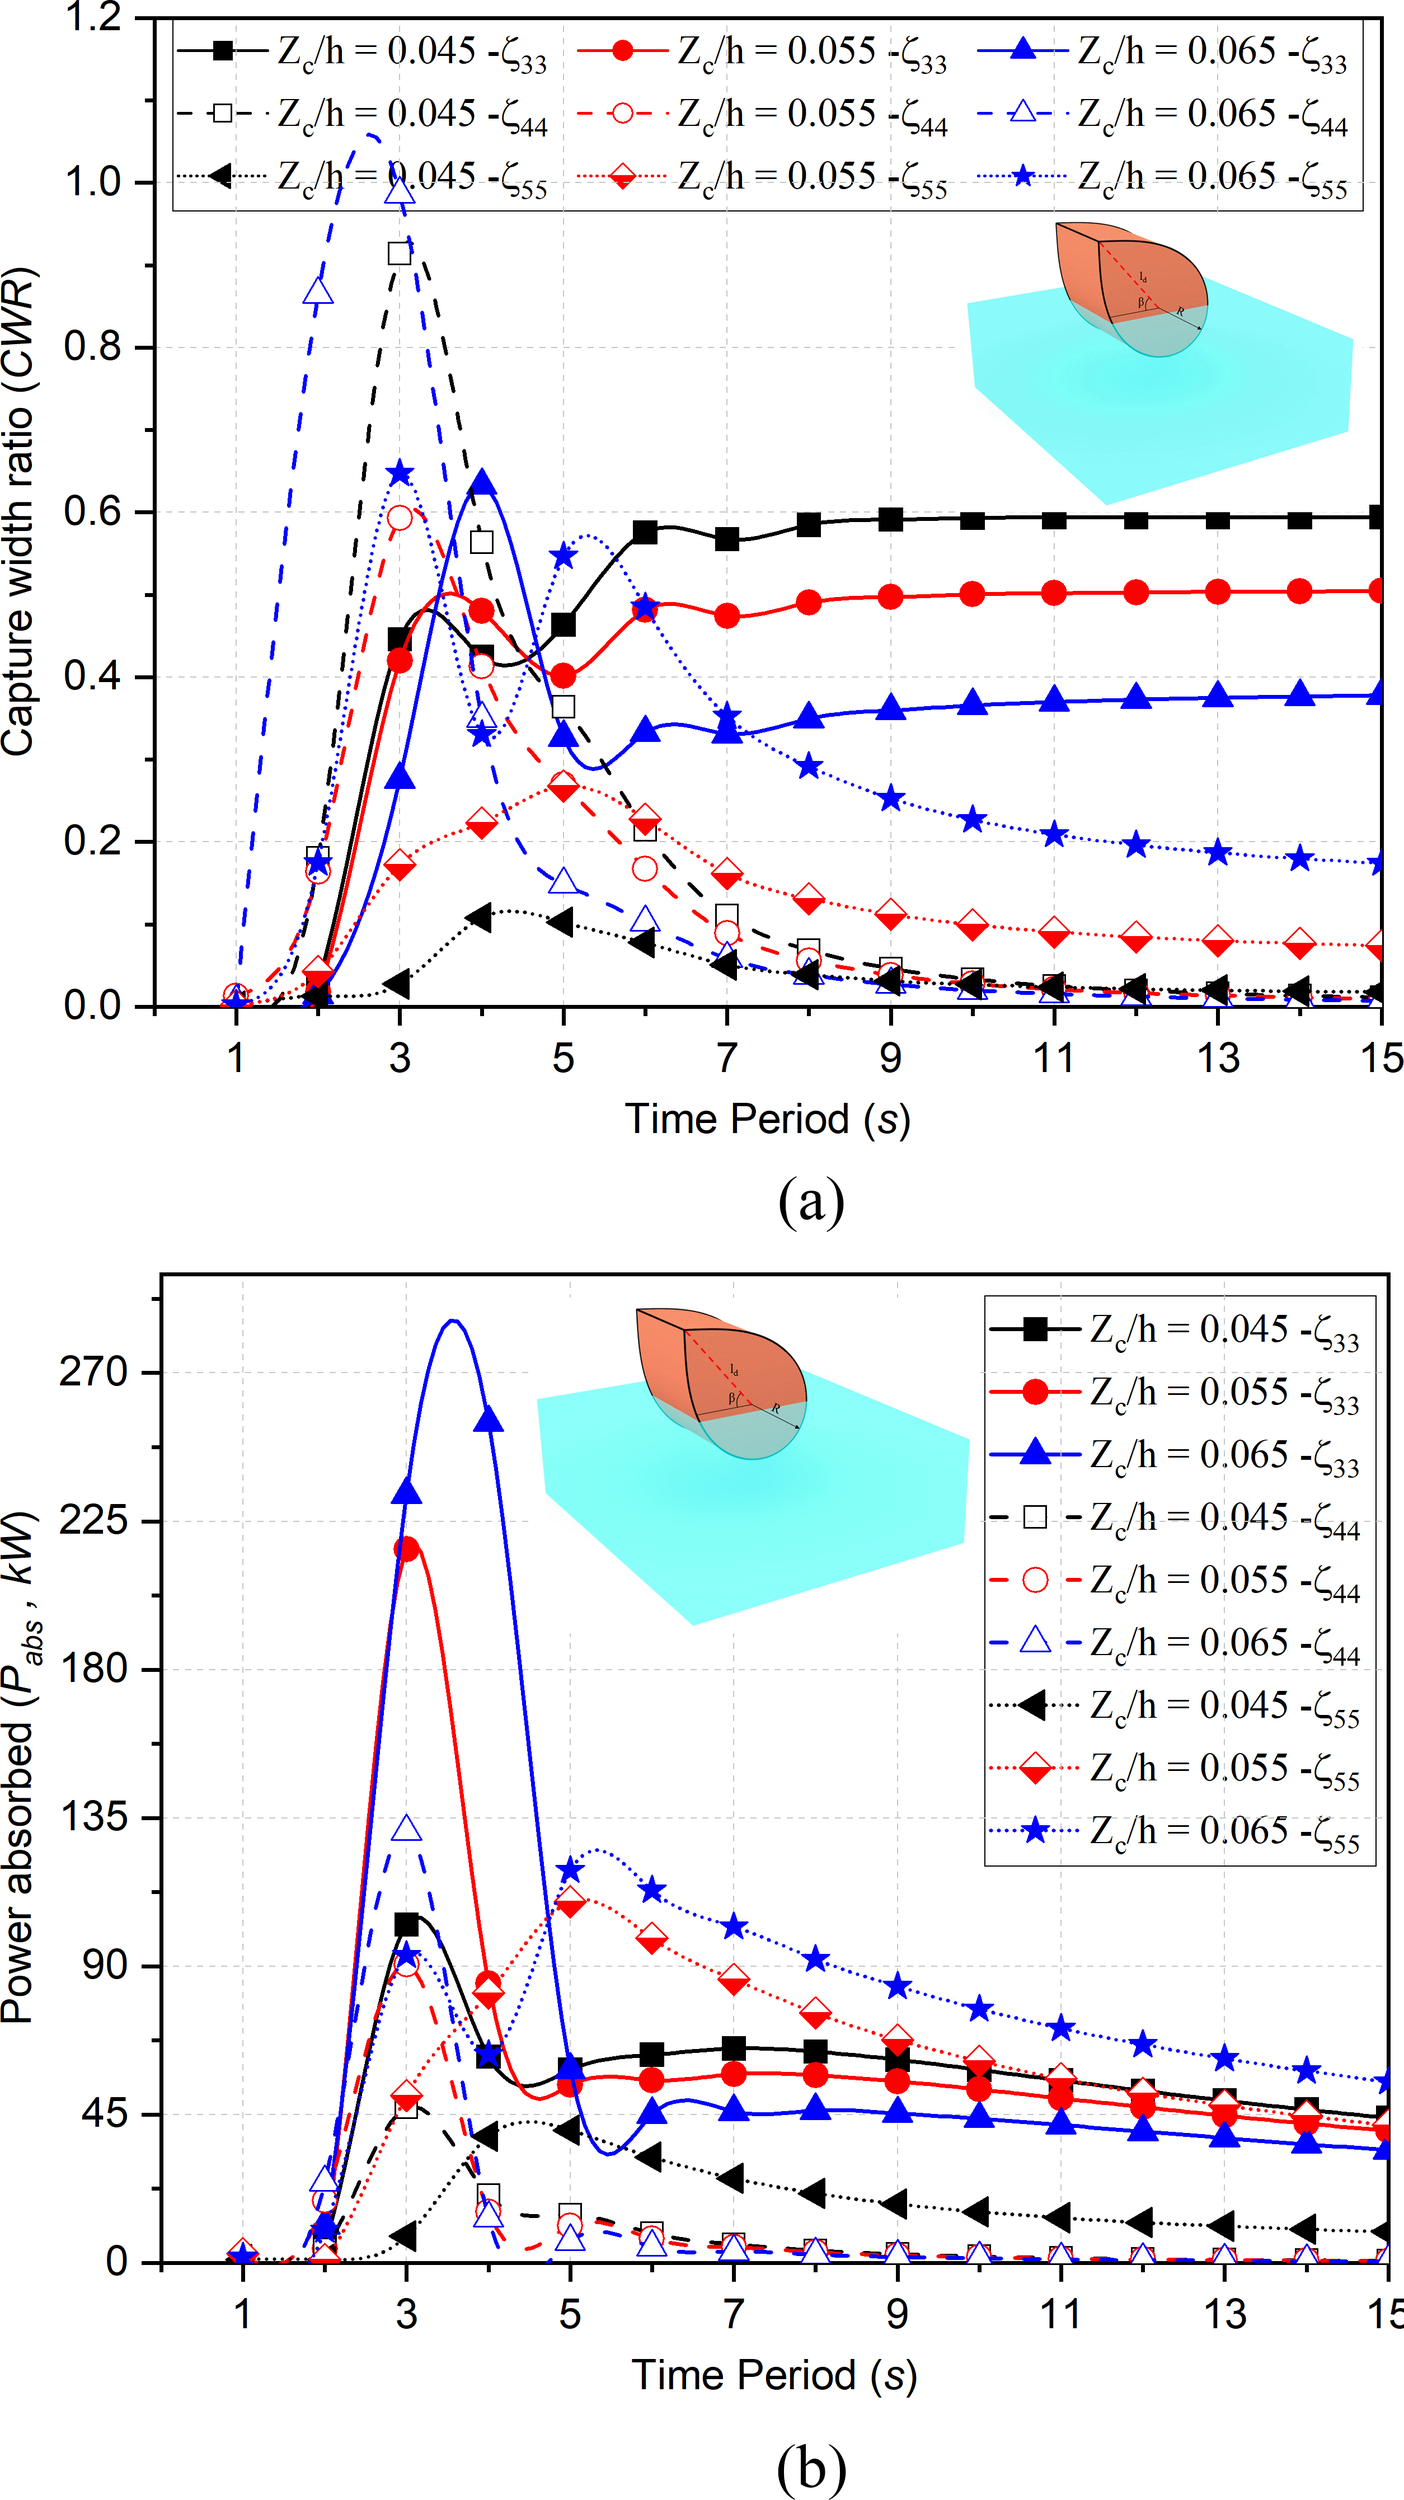
5.3.3 Capture width ratio
The capture width ratio in for variation in , , and is analyzed in Figures 11a–d. The CWR for (Figure 11a) suggest that for s with the increase in the width, the CWR decreases till but thereafter , the CWR increases. As compared to , the maximum magnitude in CWR for is 42.71% more and is 53.07% more in . As the wave period increases, the RAOs gets regular in heave and results in the increase in CWR. In intermediate water depth with the increase in the CWR is increases. In for initial wave period () no large variation is observed for s but from s the CWR decreases for whereas for and the CWR is approximately equal. In the case of , the CWR is 17.38% lesser than whereas in intermediate water depths, the CWR in converges. In the case of , the CWR is 18.57% less as compared to and converges in intermediate water depths for higher wave periods.
Figure 11
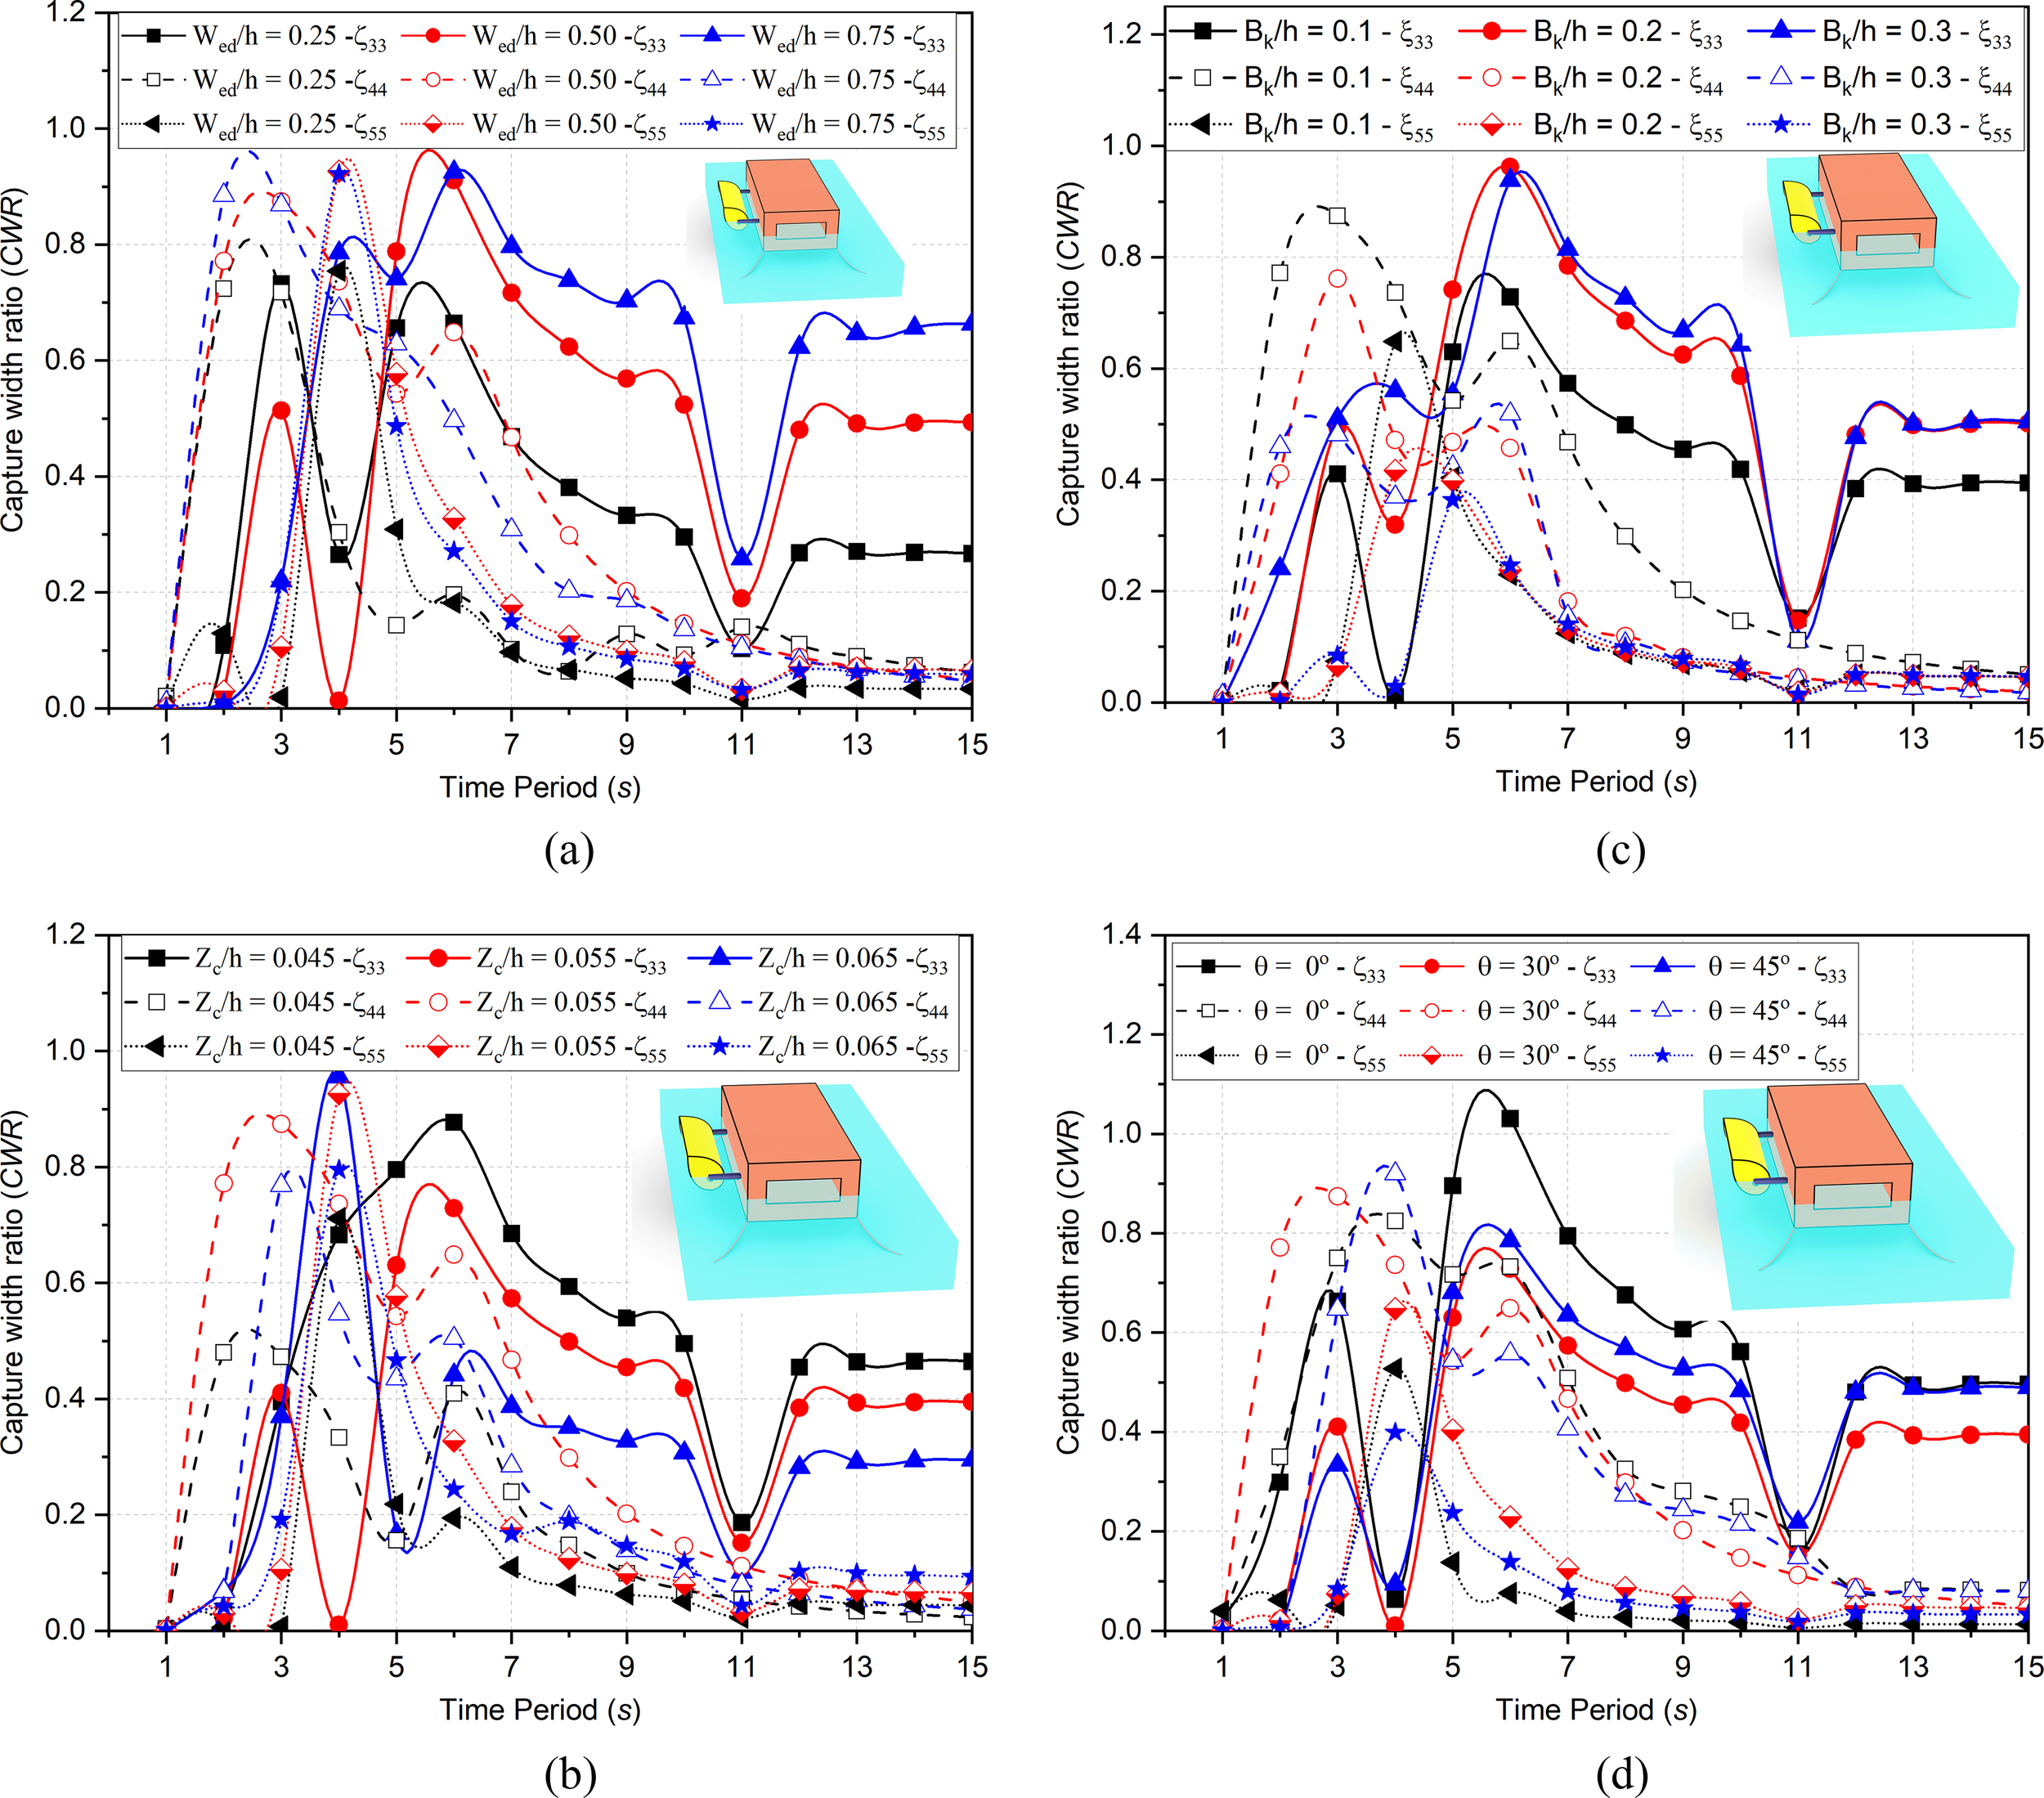
Variation in capture width ratio (CWR) for different (a)(b)(c) and (d).
In Figure 11b, the CWR for the variation in is discussed for . The variation for is observed to be random and not following any specific pattern. In deep water depth, the variation for increases continuously showing good performance in capturing energy whereas shows failure at and then increases the performance for other wave periods and for , the resonance condition is observed for . The increase in draft results in a larger submergence volume, which leads to significant variations in the hydrodynamic coefficients as well as an increase in the vertical upthrust acting on the structure. The maximum CWR in deep-water conditions is 26.24% higher for and 51.64% more for . It is observed that with the increase in draft to the CWR of the structure increases and then decreases again as the increase in draft results in more restoring torque. In , the maximum CWR in deep water depths is 45.92% less and in is 23.21% less. Also, for higher wave periods, the CWR tends to converge for and while in the constant variation is observed.
In Figure 11c, the CWR for are discussed for . In deep water depths it is observed that with the increase in , the CWR increases in . As compared to , the maximum CWR for is 17.70% more and for is 48.95% more whereas in , the CWR decreases with the increase in . The peak value in is attained at and variation is noted to be 44.90% less as compared to . In , the behavior is similar to that of with variation of about 35.72% less. In intermediate water depths, the constant variation is observed for with failure at while in the variation in is more as they converge and behaves identical. In the case of all variation in behaves identical having minimum magnitudes.
In Figure 11d, the CWR for change in is discussed in . The CWR in decreases with increase in as change in angle results in decrease in heave and increase in other DOF. As compared to , the CWR in is 38.07% less and for the CWR is 49.70% less in . In , the CWR increases for and then again decreased up to . For , the trend is reversed by minor variation. The CWR in at , is 16.45% more and for with the increase in the CWR increases within but thereafter decreases.
5.3.4 Mean interaction factor
The mean interaction factor is an important measure to study the performance of hybrids systems and is useful for designers to understand the limiting cases to real systems. The mean interaction factor of indicates that the hybrid system is generating same power as of the device generating power in isolation. In the case of , it indicates constructive interaction whereas indicate destructive interaction of the system.
The mean interaction factor for change in is discussed for in Figure 12a. In , highly constructive interaction is observed for s which shows that the integration of BWs with ED helps the system to perform well as compared to isolated systems. It is noted that decreases with the increase in width. In deep water depths as compared to , the for is 16.85% more and is 7.36% less. The constructive interaction is observed for in deep water depths and variation of 20.07% more is observed while for variation is not large but it follows similar patterns as and . For intermediate water depth, in no much variation is observed for . For higher wave period in the whereas in , the and is constant which means the constructive behavior is observed. In the destructive nature is observed as . In this region s with the increase in the width, the is observed decreasing initially but thereafter increases for and shows constructive interference.
Figure 12
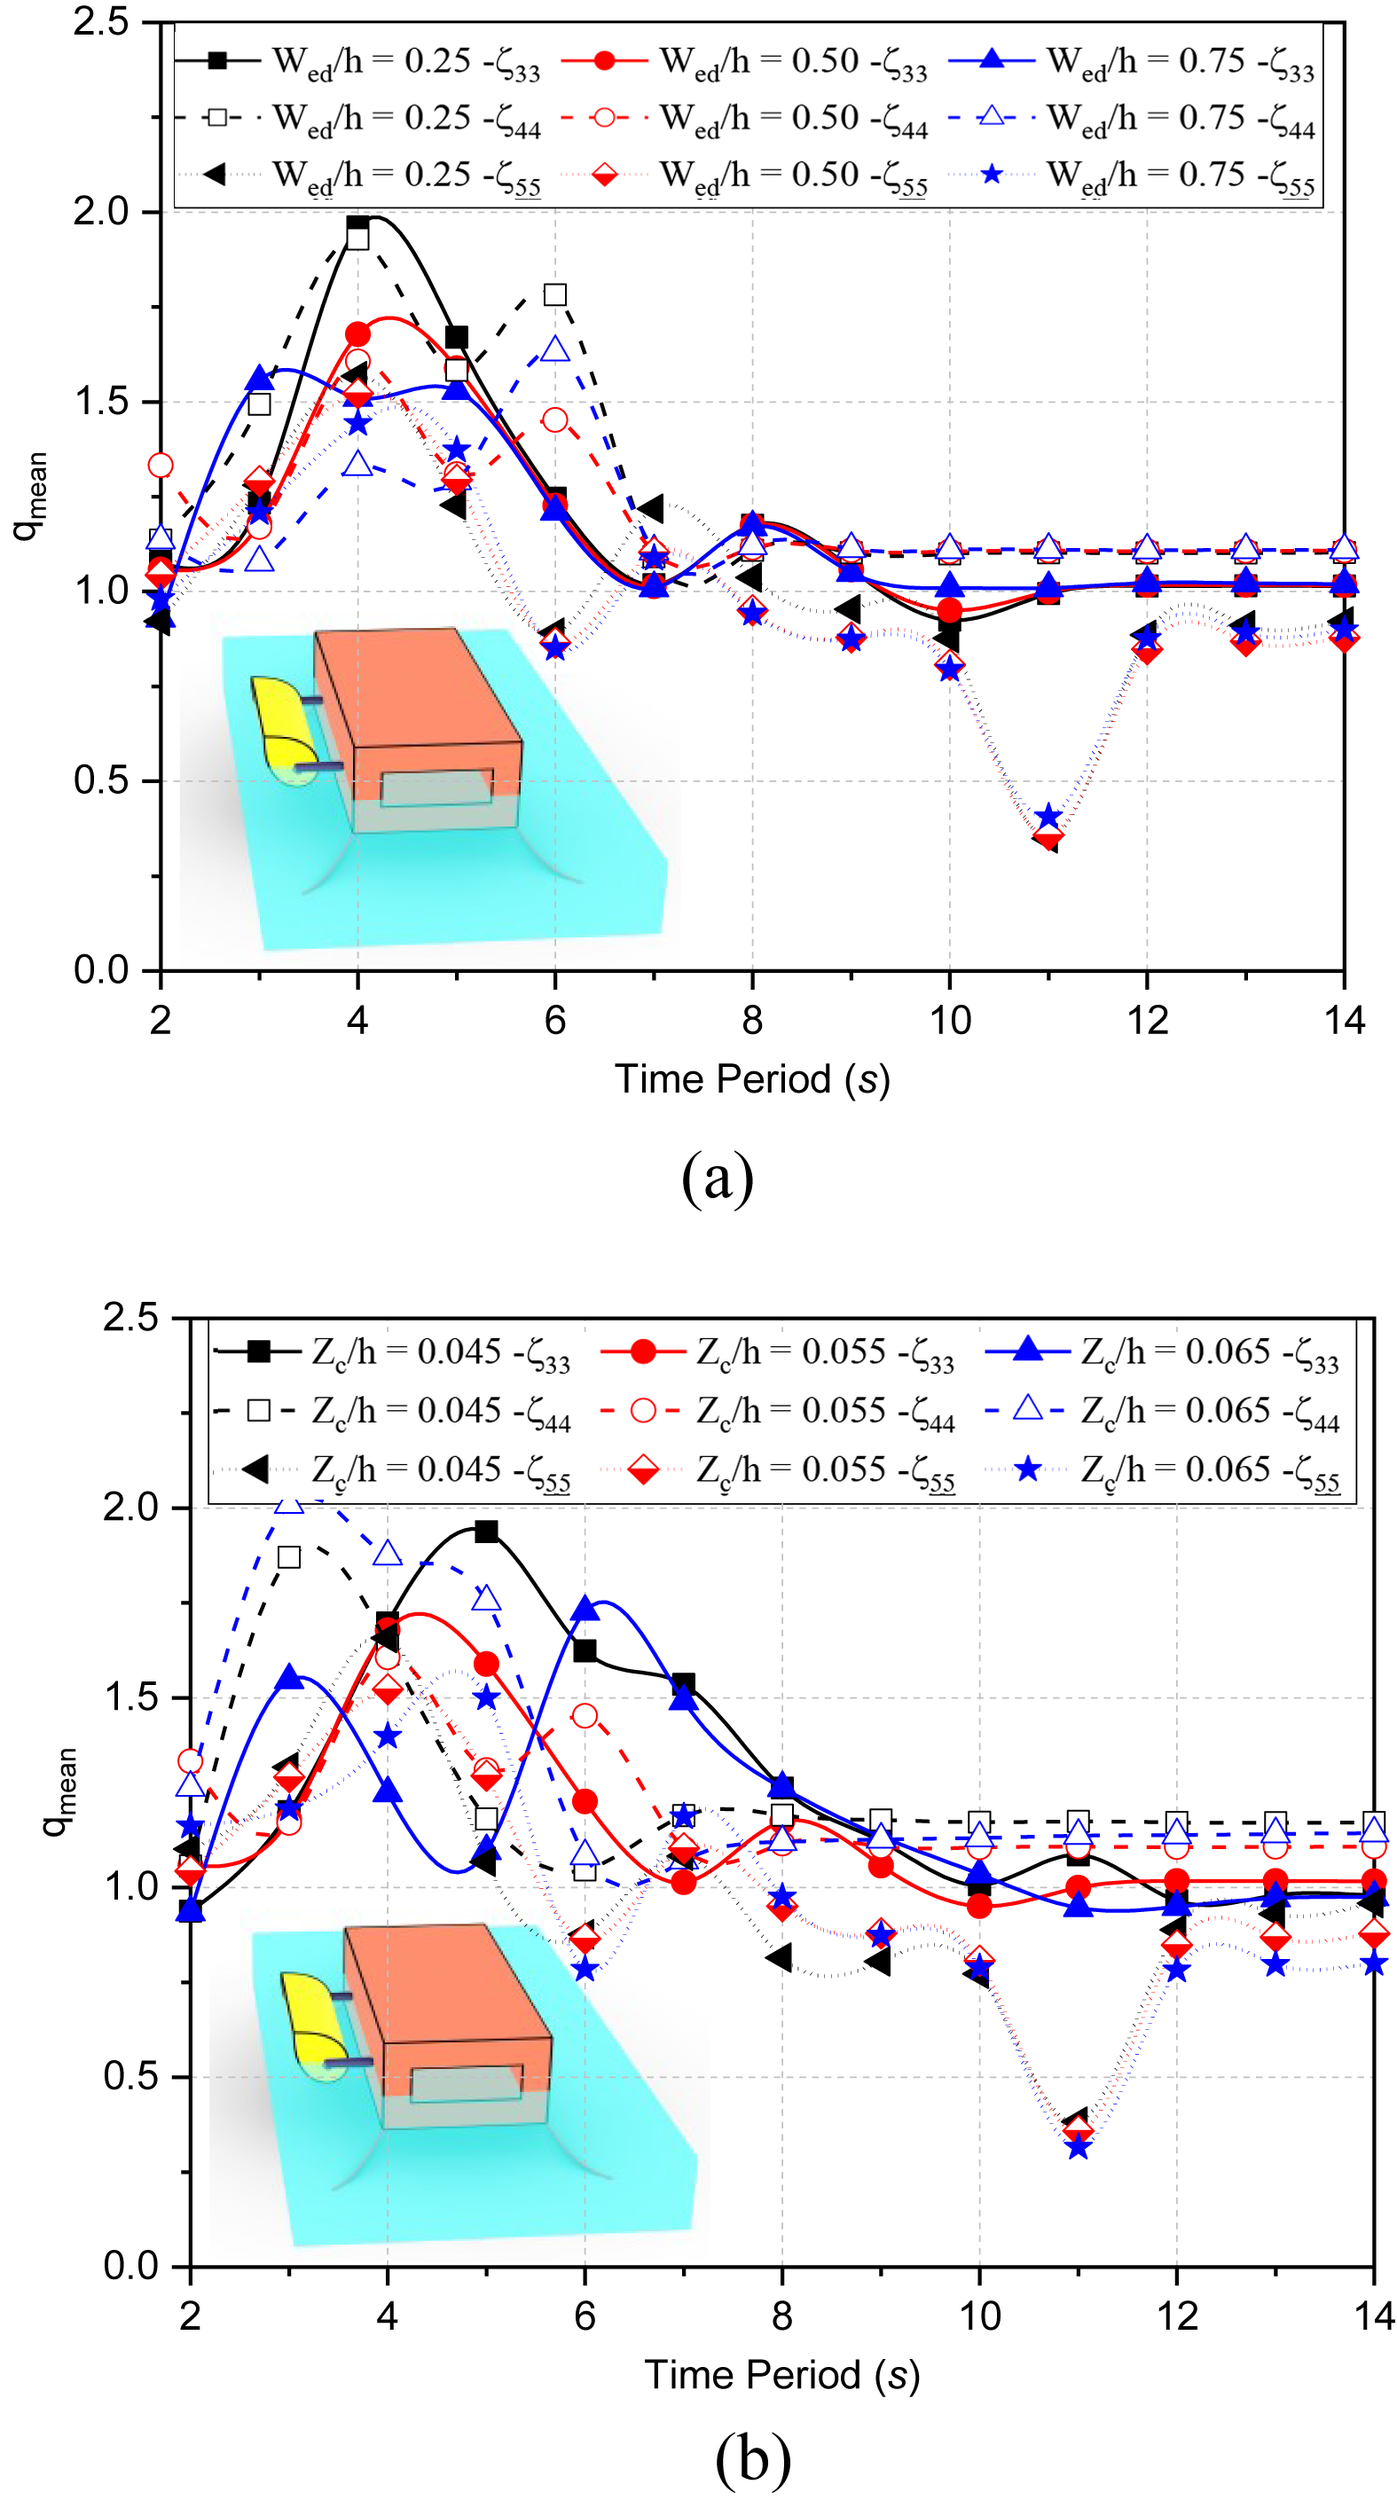
Variation in mean interaction factor for different (a) and (b)for .
In Figure 12b, the mean interaction factor for the variation in is discussed for . For deep water depths constructive interference of the system is observed in but the mean interaction factor decreases with the increase in draft whereas in , the decrease in is observed for and . In , with the increase in draft, the constructive interference decreases. In deep water depths highly constructive interference is observed in which is 15.44% more while in for , the is 16.43% more and for , the is 25.12% more. In , the variation in is of 8.91% more. In intermediate water depths for s, the is observed in and whereas in for s the is noted to be constant.
5.4 Hydrodynamic performance of ED-WEC for different shapes of FBW
The comparative study of different shapes of FBW such as trapezoidal type, , parabolic type and semi-circular type FBW for hydrodynamic behavior and performance of ED-WEC is studied and compared with box type FBW. The study is carried out for power absorption, amplitude motion and capture width ratio in . In Figure 13a, the variation of in for different shapes of FBW is observed to converge for all shapes except for box type FBW. All shapes of FBW show multi-peaks except trapezoidal type. In addition, the resonance condition is observed at for all FBW and sudden decrease at for box type FBW and FBW, at for parabolic type and semi-circular type FBW. This shows an instability as wave-structure interaction is reduced at that wave period which results in the waves to pass below the structure. As waves passes below the structure it causes disturbance on leeward side of FBW but the FBW creating the calm condition on leeward side fails. Due to this of the system reduces and hence harnessing wave power fails. Among the different FBW configurations, the trapezoidal type is observed to provide higher power over a wider range of wave periods without inducing resonance conditions. Compared with the box-type FBW, the increase in power output is 35.14%, is 45.54% for the π-type, 66.82% for the parabolic type, and 79.97% for the semi-circular type. Although the trapezoidal FBW yields lower power enhancement relative to the curved geometries, it offers superior stability. This is because the trapezoidal profile facilitates smooth wave attenuation by splitting the incident wave energy along its sloped surfaces and effectively regulating both scattered and reflected wave components. In intermediate water depth, the failure is observed at in box type FBW.
Figure 13
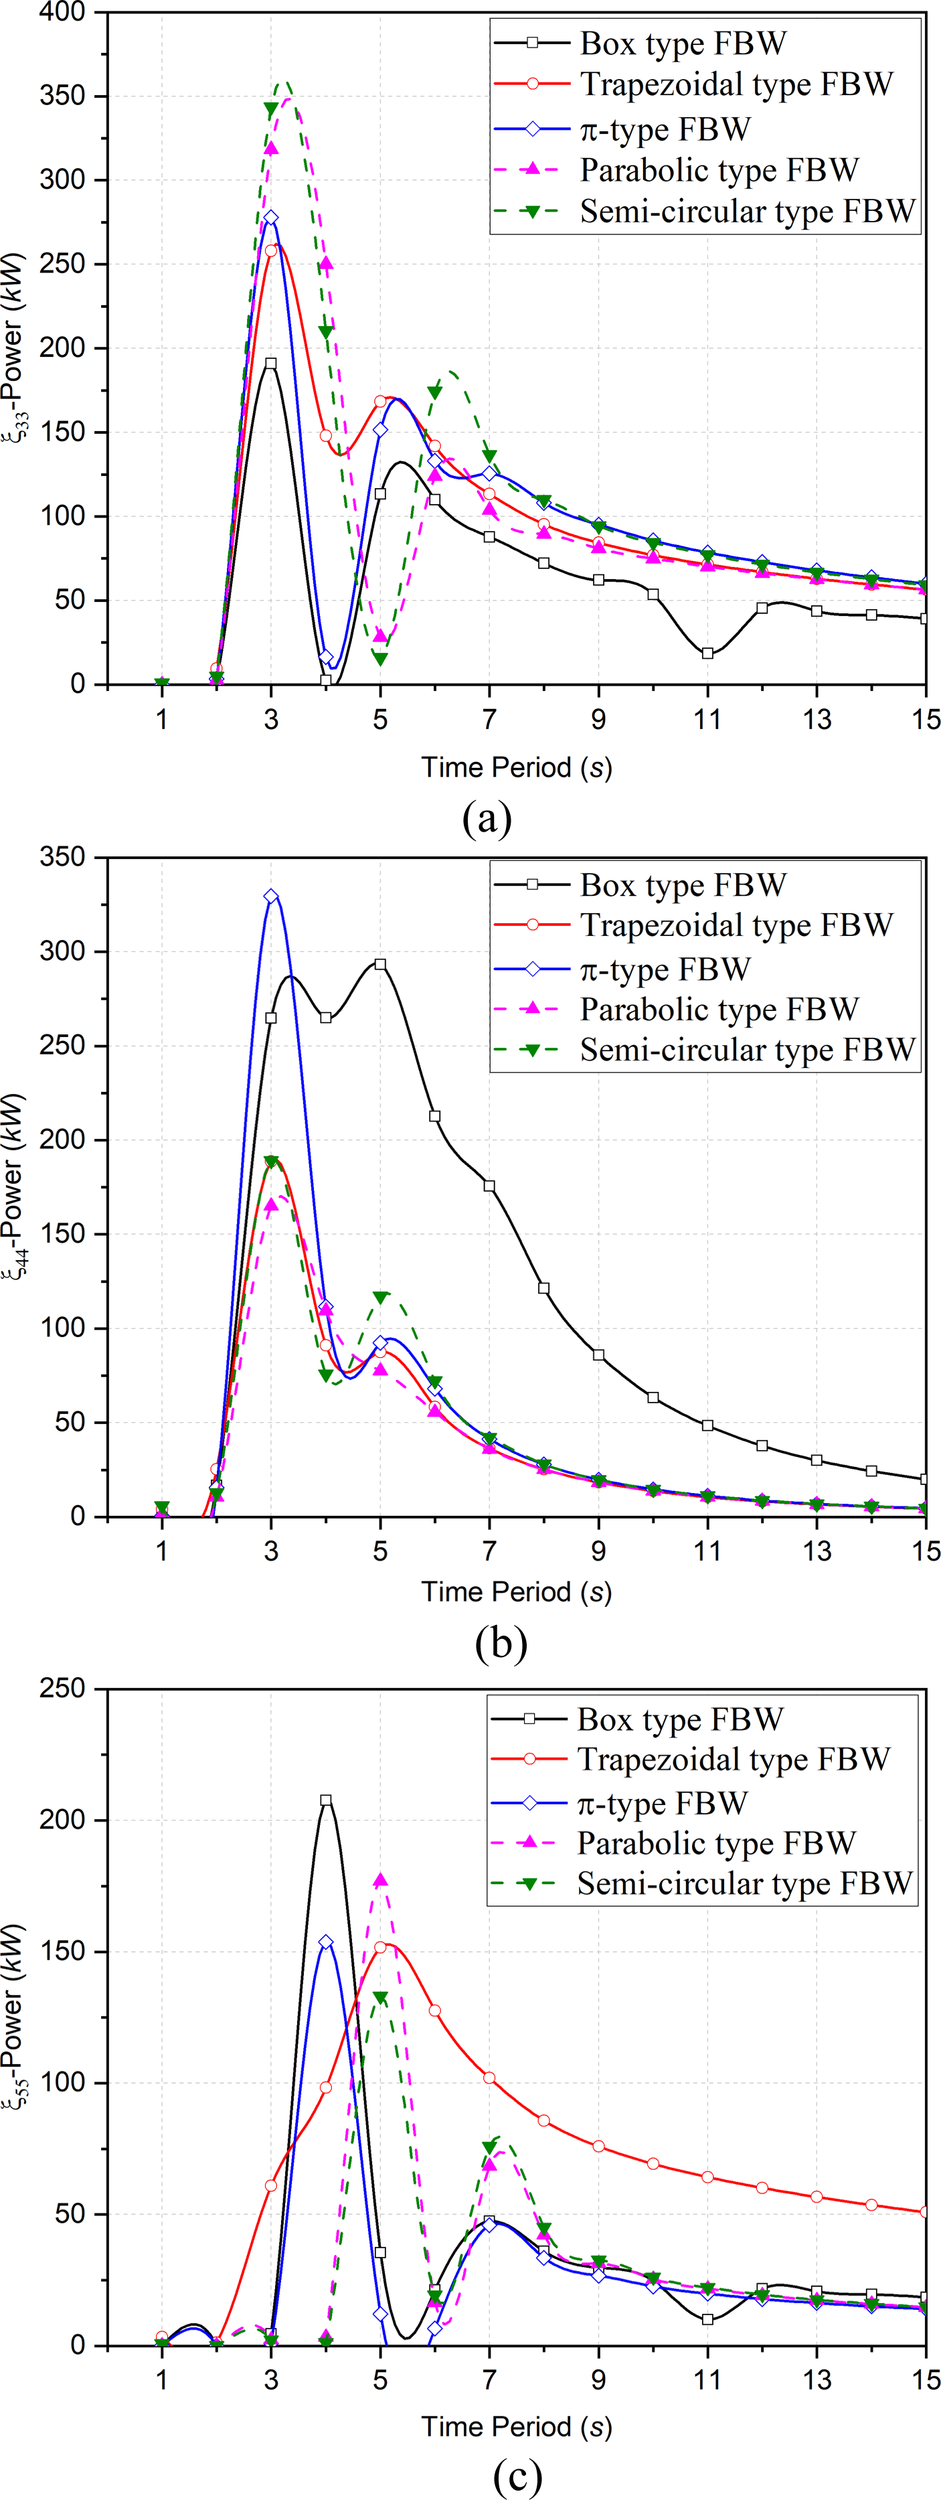
Variation in wave power absorbed in (a), (b) and (c) for different shapes of FBWs.
In Figure 13b, in , the box type FBW helps in generating higher power output for a wider region of wave period while other FBW are having a narrow region without any significant resonance condition except FBW. Similar to , the variation in for different FBW is observed in deep water depths for while in intermediate water depth, all shapes tend to converge except box type FBW. As compared to box type FBW, the power output of trapezoidal type is 35.62%, parabolic type is 43.70% and semi-circular type is 35.50% less while is 12.40% more. Though the power output in is more than that of box type FBW, but stability and reliability is more for box type FBW as power generation is in wider range of wave period.
In Figure 13c, the for box type, FBW, parabolic type and semi-circular type FBW are similar with a phase difference of . In , the trapezoidal type FBW is observed to be giving better in wider wave period without generating resonance condition in deep water depths as well as in intermediate water depths as trapezoidal type FBW generates smooth wave attenuation. As compared to box type FBW, the power output of trapezoidal type FBW is 27.01%, parabolic type is 14.79% and semi-circular type is 35.94%, is 25.95% less. The maximum power output for and trapezoidal type FBW is approximately the same. The performance of for the ED integrated to trapezoidal type FBW is effective for a wider region of wave period.
In Figures 14a–c, the variation in motion amplitude in for different shapes of FBWs in hybrid system are discussed and compared with the behavior and performance of box-type FBW. In Figure 14a, the variation in motion amplitude of ED for in the case of different FBW shapes is observed in deep water depths while in intermediate water depth all shape tends to converge expect box type at . In deep water depth, similar behavior is observed for all FBWs except trapezoidal type FBW. The resonance condition is noted at for all FBW and sudden decrease at for box and FBW, at for parabolic and semi-circular type FBW. The trapezoidal type FBW is observed to be giving continuous motion amplitude in wider wave periods without generating any resonance. As compared to box type FBW, the motion amplitude in for trapezoidal type FBW is 14.04% less, FBW is nearly the same, parabolic type FBW is only 5.225% more and semi-circular type FBW is 18.34% more. Though trapezoidal type FBW has low amplitude in heave but the stability is higher. The heave motion amplitude is nearly the same in magnitude and pattern except at resonance () and failure ( and ) and the smooth wave attenuation is generated by trapezoidal type FBW. In intermediate water depth, the failure is observed at in box type FBW while other FBW tends to converge and behaves identical.
Figure 14
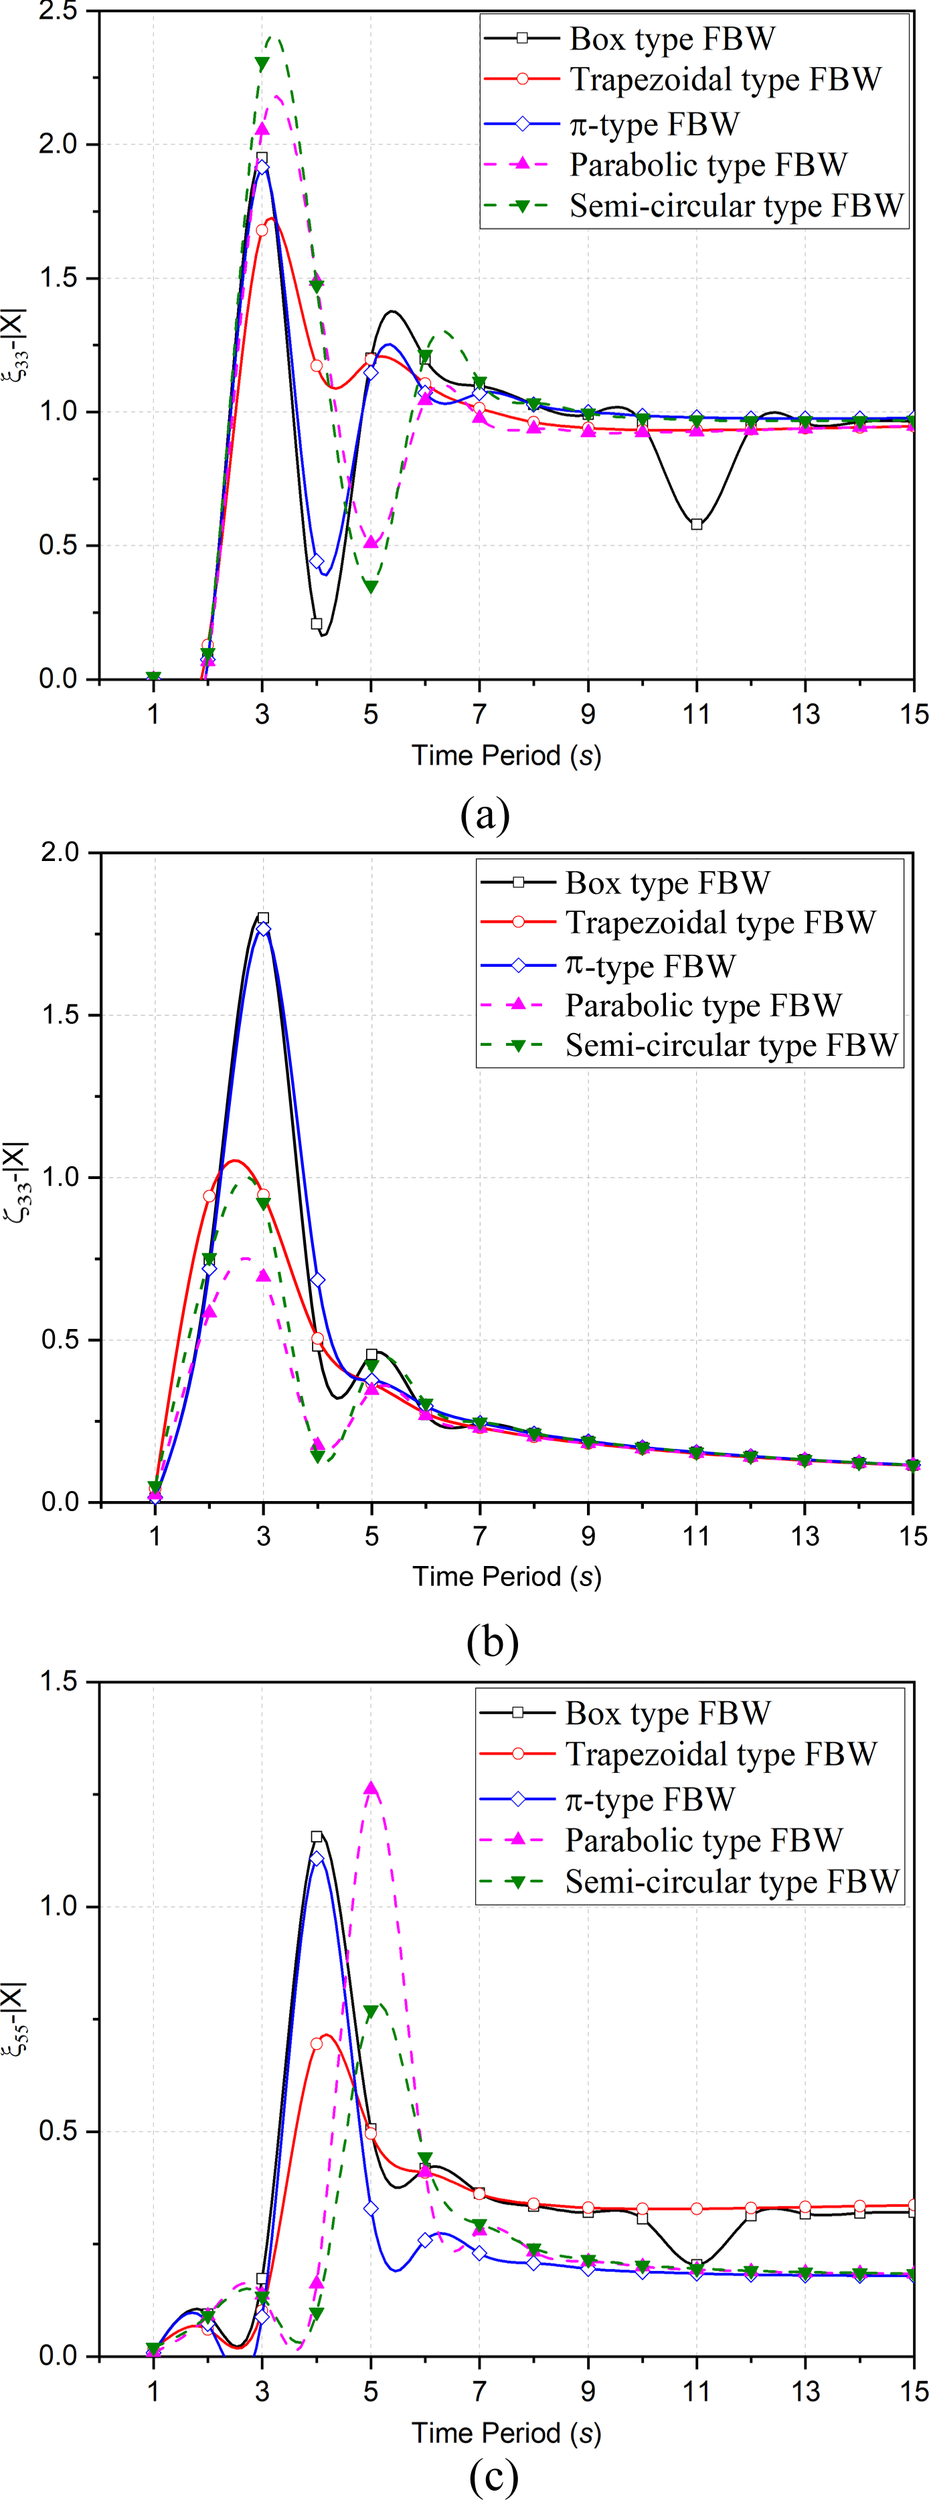
Variation in motion amplitude in (a), (b) and (c) for different shapes of FBWs.
In Figure 14b, the performance of trapezoidal, parabolic, and semi-circular type FBW for is better than box and FBW. Though the magnitude for box and FBW is nearly double than the trapezoidal, parabolic, and semi-circular type FBW but the optimal distribution of amplitude of roll motion is observed in trapezoidal, parabolic, and semi-circular type at whereas resonance is observed for box and FBW at that time period. Similar to in , the variation in motion amplitude for different FBW is observed in deep water depths while in intermediate water depths all shapes tend to converge and behaves nearly identical. As compared to box type FBW, the roll motion amplitude of trapezoidal type FBW is 11%, parabolic type FBW is 14.1% and semi-circular type FBW is 11.3% less while FBW is approximately equal.
In Figure 14c, the pitch motion amplitude for box and , parabolic and semi-circular type FBW are similar with a phase difference of . In , the trapezoidal and semi-circular type FBW is observed to show better response in motion amplitude in wider wave periods without generating resonance condition in deep water depth but trapezoidal type FBW performs better as compared to semi-circular FBW as trapezoidal type FBW shows wave attenuation. As compared to box type FBW, the motion amplitude of trapezoidal type FBW is 39.88% less, parabolic type FBW is 9.08% more and semi-circular type FBW is 33.4% less and FBW is 4.24% less. The magnitude of motion amplitude for box and FBW is nearly the same. The performance of trapezoidal and semi-circular type FBW in motion response amplitude is very smooth and effective and is in the wider range of wave period in , and except semi-circular type FBW in .
In Figure 15a, the CWR variation in for different FBW is observed in deep water depths with multi-peak while in intermediate water depth all shapes behave similar expect box type at . In deep water depths, similar pattern is observed for all shapes of FBW except trapezoidal type FBW. At , the resonance is observed for box and FBW, for parabolic and semi-circular type FBW at . As compared to box type FBW, the CWR in for trapezoidal type FBW is 5.8% more, FBW is 8.38% less, parabolic type FBW is 71.54% and semi-circular type FBW is 46.2% more. Though trapezoidal type FBW has low CWR in heave than parabolic and semi-circular FBW but slightly more than box type FBW whereas stability at resonance is highest. The CWR is nearly the same at resonance and failure regions. In intermediate water depths, the failure is observed at in box type FBW while other FBW shows similar trends in for long waves as the structure follows the wave profile and shows constant variation.
Figure 15
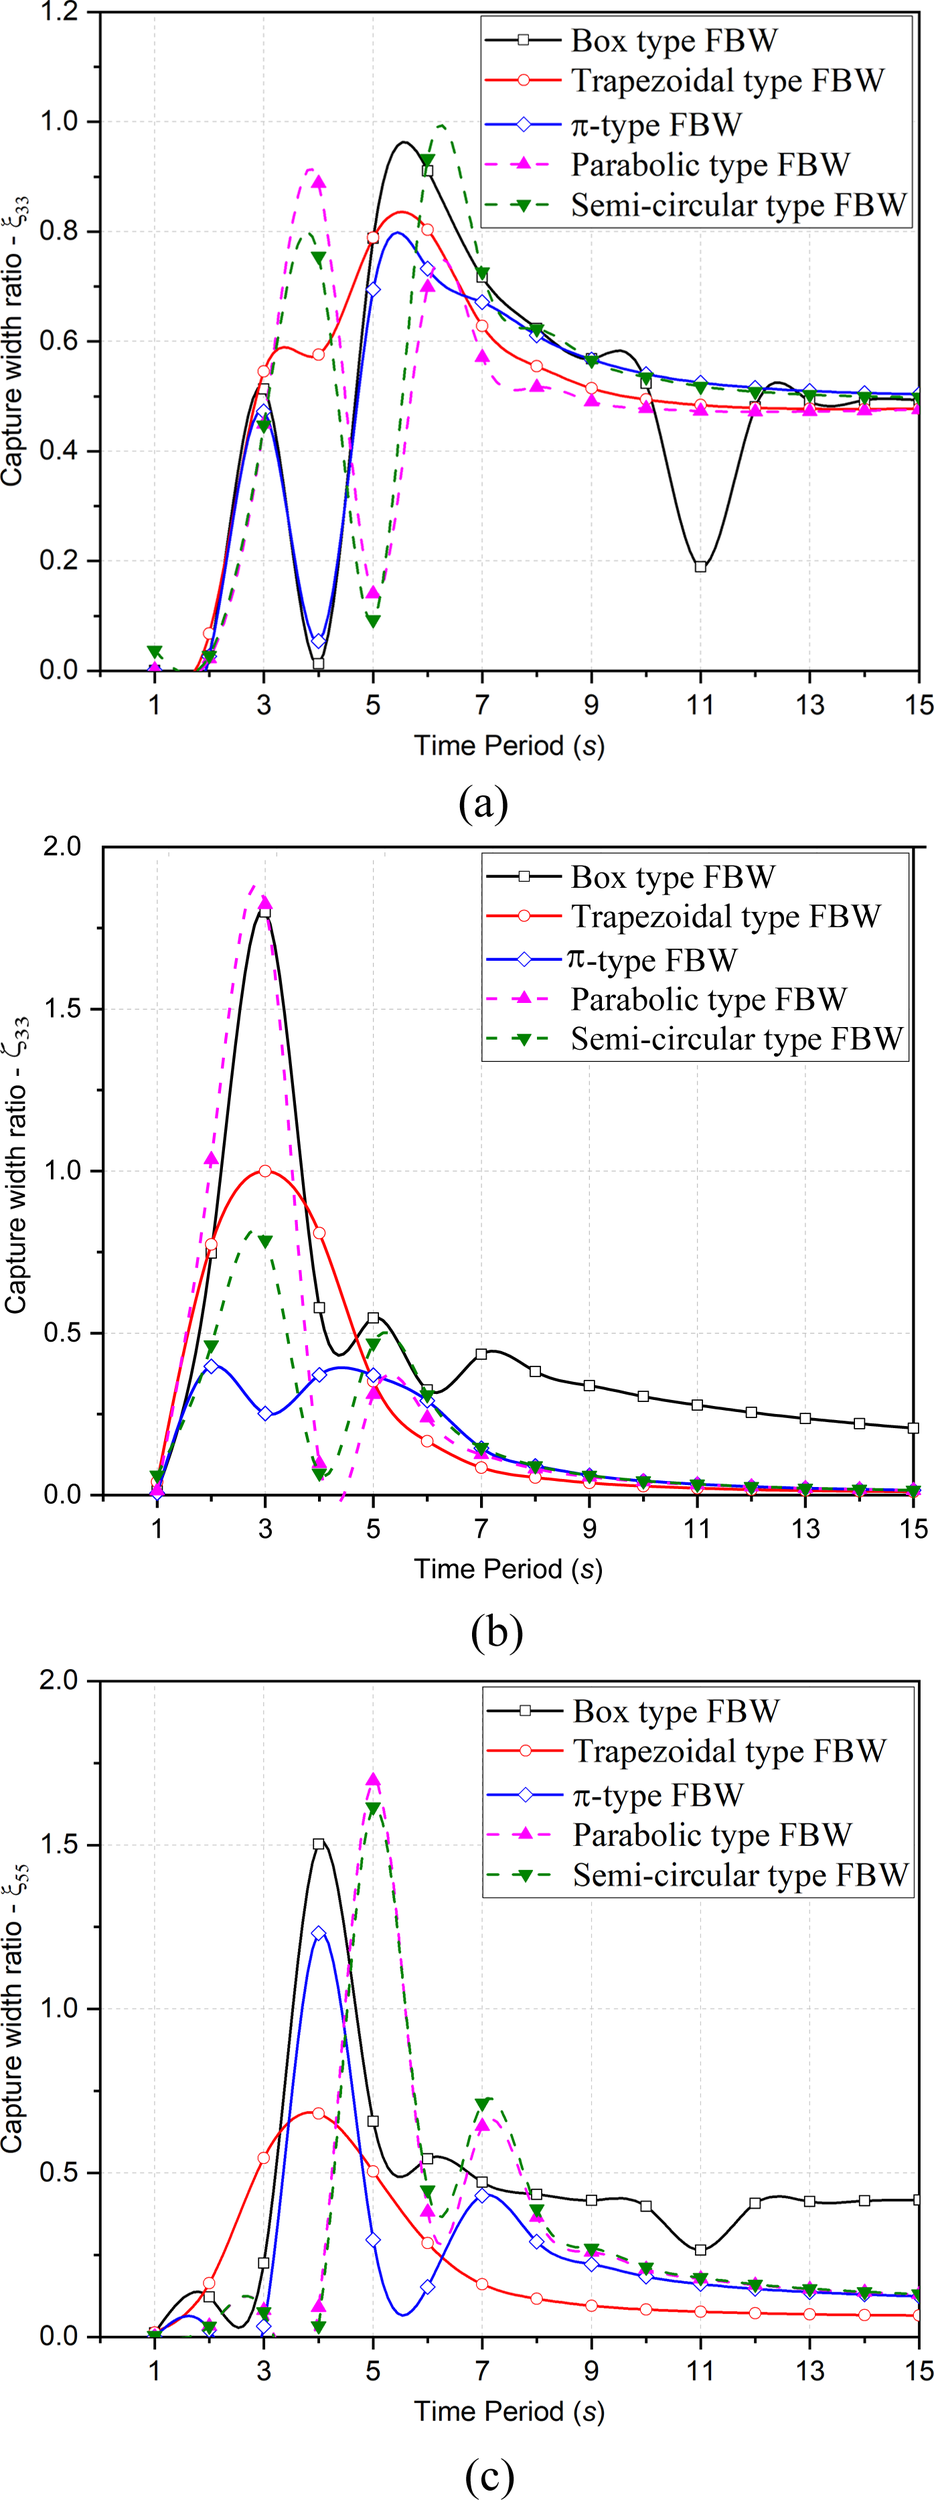
Variation of CWR in (a), (b) and (c) for different shapes of FBWs.
In Figure 15b, the performance of trapezoidal, and semi-circular type FBW in is better than box and parabolic type FBW. Though the magnitude for box and parabolic type FBW is nearly double than that of trapezoidal, , and semi-circular FBW but the optimal distribution of CWR is observed in trapezoidal, and semi-circular type because at resonance is observed for box and parabolic type FBW. The variation in CWR for different FBW is observed in deep water depth while in intermediate water depth all shapes converge and behaves identical. The variation in is observed to be smooth and constructive for trapezoidal type FBW. As compared to box type FBW, the CWR of trapezoidal type FBW is 46.7% less, FBW is 86.03% less and semi-circular type FBW is 56.42% less while parabolic type FBW is approximately same.
In Figure 15c, the CWR for box and , and parabolic and semi-circular type FBW are similar with a phase difference of . In , the trapezoidal type FBW is observed to be giving better response in CWR in wider wave period without showing resonance in deep water depths. As compared to box type FBW, the CWR of trapezoidal type FBW is 54.67% less, parabolic type FBW is 12.67% more and semi-circular type FBW is 8% less and FBW is 18% less. In intermediate water depths, the failure is observed for box type FBW at and the performance of ED with trapezoidal type FBW is operational for a wider region of wave period in .
6 Conclusions
The study investigates the wave energy absorption, motion amplitude, and mean interaction factor of a hybrid system consisting of the ED-WEC integrated with box, trapezoidal, π, parabolic, and semi-circular types of FBW based on small-amplitude wave theory. A theoretical study is performed to analyze the effect of the presence of FBWs on the ED-WEC’s energy-extraction behavior and characteristics. The hybrid system is examined for variations in different ED parameters, including width, draft, distance between the ED and FBW, and incident wave angle. The conclusions drawn from the study are as follows:
-
CWR increases on increasing , for isolated systems in deep water depths. In addition, the large variation in deep water depths while linear variations in intermediate water depths is observed in for long waves and the motion amplitude shows constant variation resulting in higher wave transmission rather than wave reflecting or wave scattering.
-
In deep water depths the variation of CWR is 18.65% less in and is 19.6% more in whereas in intermediate water depths the CWR is 93.10% less in . The reason for the decrease in intermediate water depths is due to the low frequency which results in low wave amplitude and wave excitation force.
-
The power absorbed increases in narrow region of wave period and it is due to the increase of contact surface area for waves to interact which leads to capture more power for same incident wave energy. The in for deep water depths is within and in the is around 48.95% compared to .
-
The motion amplitude decreases for same incident wave energy, and it is distributed over a large surface area in and . In motion amplitude decreases due to the energy reduction in the vertical direction while in roll and pitch motion, the variation in motion amplitude is due to variation in generated restoring torque.
-
The increase in draft of the ED results in the increase of submergence volume and variation in the hydrodynamic coefficients. In the case of an isolated system in deep water depths, the variation of CWR in is within while in , it is (Zhou et al., 2022). Further, with the increase in draft, the increases and thereafter decreases as the draft increases.
-
The variation in results in the change in efficiency of the system for different DOFs without variation in overall performance within . In , the amplitude motion decreases due to increase in the incident wave angle.
-
The distance between ED-WEC and FBW is one of the important parameters in deciding installation position of WEC from oceanic structures in order to make system perform effectively. In deep water depths with the increase in , the increases in because the greater distance the reflected waves travel will add on to the incident waves at structure position effectively by gaining fetch distance.
-
The mean interaction factor for the width in and is highly constructive for deep water depths which shows the integration of BW with ED is helping the system to perform compared to isolated ED. The is noted decreasing with the increase in whereas for variation is not large.
-
The power absorption in for all FBWs shows multi-peaks at and failure is noted for box and FBW at along with parabolic, semi-circular FBW at except trapezoidal type FBW.
-
The trapezoidal-type FBW has a low heave-motion amplitude, but its stability is the highest because it generates smooth wave attenuation by splitting incident wave energy into components on its slope and regulates scattered and reflected waves effectively than other FBWs.
-
In , the performance of trapezoidal, parabolic and semi-circular types of FBW is better, but trapezoidal type FBW shows much distributed variation over a wide range of wave periods.
The investigation of the hydrodynamic behavior and power extraction capability of the Edinburgh Duck WEC integrated with a floating breakwater provides valuable insights; however, future studies may focus on advanced numerical modeling using fully nonlinear potential-flow solvers or CFD-based approaches to capture viscous, turbulent, and nonlinear wave–structure interactions that are not fully represented under small-amplitude assumptions. Further research may examine the optimization of geometric and operational parameters, such as Duck dimensions, spacing, hinge stiffness, breakwater draft, and PTO damping characteristics, to maximize both energy extraction and wave attenuation. The integration of adaptive or smart control strategies for the PTO system may also significantly enhance power capture in irregular and extreme sea states. Additionally, future studies may assess the economic feasibility, lifecycle performance, and potential benefits of deploying WEC-integrated floating breakwaters in ports, offshore aquaculture facilities, and island communities.
Statements
Data availability statement
The raw data supporting the conclusions of this article will be made available by the authors, without undue reservation.
Author contributions
RV: Visualization, Investigation, Validation, Conceptualization, Software, Methodology, Writing – original draft, Writing – review & editing, Formal Analysis. DK: Formal Analysis, Supervision, Conceptualization, Methodology, Writing – review & editing, Software, Investigation, Funding acquisition.
Funding
The author(s) declared that financial support was not received for this work and/or its publication.
Acknowledgments
The authors express their gratitude to the Ministry of Education (MoE), Government of India, and the National Institute of Technology, Karnataka, Surathkal, for providing necessary facilities.
Conflict of interest
The authors declared that this work was conducted in the absence of any commercial or financial relationships that could be construed as a potential conflict of interest.
The authors DK declared that they were an editorial board member of Frontiers, at the time of submission. This had no impact on the peer review process and the final decision.
Generative AI statement
The author(s) declared that generative AI was not used in the creation of this manuscript.
Any alternative text (alt text) provided alongside figures in this article has been generated by Frontiers with the support of artificial intelligence and reasonable efforts have been made to ensure accuracy, including review by the authors wherever possible. If you identify any issues, please contact us.
Publisher’s note
All claims expressed in this article are solely those of the authors and do not necessarily represent those of their affiliated organizations, or those of the publisher, the editors and the reviewers. Any product that may be evaluated in this article, or claim that may be made by its manufacturer, is not guaranteed or endorsed by the publisher.
Glossary
- DOF
Degree of Freedom
- ED-WEC
Edinburgh Duck Wave Energy Converter
- FBW
Floating Breakwaters
- PTO
Power Take-off
- RAO
Response Amplitude Operators
- Ajk
Added mass
- Bjk
Radiation damping
- Bk
Distance between Zc and sea side face of floating breakwater
- B
Width of floating breakwaters
- db
Draft of floating breakwater
- Hb
Height of floating breakwater
- h
Water depth
- K
Wave number
- Lb
Length of floating breakwater
- ld
Line of symmetry of ED
- R
Radius of ED at stern portion
- T
Wave period
- tb
Thickness of box edge of floating breakwater
- Wed
Width of Edinburgh Duck
- x0
Wetted surface of the body
- z
Depth below mean water still level
- Zc
Center of rotation of ED
- β
Angle of inclination of ED with line of symmetry
- θ
Angle of incidence
- η
Incident wave amplitude
- ω
Wave frequency
- ξ11
ξ22, and ξ33, Translational motion (Surge, Sway, and Heave)
- ξ44
ξ55, and ξ66, Rotational motion (Roll, Pitch, and Yaw)
References
1
(2021). Ansys-AQWA Theory Guide (Southpointe 2600 Ansys Drive, Canonsburg, Pennsylvania 15317, USA: ANSYS Inc.).
2
Bellew S. (2011) in Investigation of the response of groups of wave energy devices, UK ( Thesis, University of Manchester).
3
Contestabile P. Crispino G. Di Lauro E. Ferrante V. Gisonni C. Vicinanza D. (2020). Overtopping breakwater for wave energy conversion: Review of state of art, recent advancements and what lies ahead. Renewable Energy147, 705–718. doi: 10.1016/j.renene.2019.08.115
4
Cruz J. (2008). Ocean Wave Energy: Current Status and Future Perspectives (Berlin, Germany: Springer).
5
Hayward J. Behrens S. McGarry S. Osman P. (2012). Economic modelling of the potential of wave energy. Renewable Energy48, 238–250. doi: 10.1016/j.renene.2012.05.007
6
Hu J.J. Zhou B.Z. Vogel C. Liu P. Willden R. Sun K. et al . (2020). Optimal design and performance analysis of a hybrid system combing a floating wind platform and wave energy converters. Applied Energy269, 114998
7
Isaacs J. D. Seymour R. J. (1973). The ocean as a power resource. Int. J. Environ. Stud.4, 201–205. doi: 10.1080/00207237308709563
8
Jeffrey D. C. Richmond D. J. E. Salter S. H. Leung R. (1976). Interim Report on Edinburgh Wave Power Project: Study of Mechanisms for Extracting Power from Sea Waves (Edinburgh, UK: University of Edinburgh).
9
Jin P. Zhou B. Z. Goteman M. Chen Z. F. Zhang L. (2019). Performance optimization of a coaxial-cylinder wave energy converter. Energy174, 450–459. doi: 10.1016/j.energy.2019.02.189
10
Kim S. J. Koo W. Shin M. J. (2018). Numerical and experimental study on a hemispheric point-absorber-type wave energy converter with a hydraulic power take-off system. Renewable Energy135, 1260–1269. doi: 10.1016/j.renene.2018.09.097
11
Li S. Teng B. (2021). Numerical examination of wave power absorption by the Edinburgh Duck wave energy converter device. J. Hydrodynamics33, 323–333. doi: 10.1007/s42241-021-0026-8
12
Madhi F. Sinclair M. E. Yeung R. W. (2014). The “Berkeley Wedge”: An asymmetrical energy capturing floating breakwater of high performance. Mar. Syst. Ocean Technol.9, 5–16. doi: 10.1007/BF03449282
13
McCartney B. L. (1985). Floating breakwater design. J. Waterway Port Coastal Ocean Eng.111, 304–318. doi: 10.1061/(ASCE)0733-950X(1985)111:2(304)
14
Mustapa M. A. Yaakob O. B. Ahmed Y. M. Rheem C. K. Koh K. K. Adnan F. A. (2017). Wave energy device and breakwater integration: A review. Renewable Sustain. Energy Rev.77, 43–58. doi: 10.1016/j.rser.2017.03.110
15
Mynett A. E. Serman D. D. Mei C. C. (1979). Characteristics of Salter’s cam for extracting energy from ocean waves. Appl. Ocean Res.1, 13–20. doi: 10.1016/0141-1187(79)90004-X
16
Ning D. Z. Zhao X. L. Chen L. F. Zhao M. (2018). Hydrodynamic performance of an array of wave energy converters integrated with a pontoon-type breakwater. Energies11, 685. doi: 10.3390/en11030685
17
Praisilin S. S. Chandru M. (2025c). Gravity wave interaction of fibrillar adhesive floating breakwater proximity to rigid and porous structures positioned at a finite distance from a monotonically decreasing seabed. Phys. Fluids37, 103615. doi: 10.1063/5.0293625
18
Praisilin S. S. Chandru M. Ramos H. (2025d). Dynamic response of fibrillar adhesive floating breakwater near a porous structure and Gaussian oscillatory seabed with added mass and damping effects. AIMS Mathematics10, 23715–23737. doi: 10.3934/math.20251054
19
Praisilin S. S. Gayathri R. Chandru M. (2025b). Effect of trench configuration on the scattering and radiation of surface gravity waves by different floating breakwaters. Phys. Fluids.37, 0827225. doi: 10.1063/5.0278889
20
Praisilin S. S. Gayathri R. Koley S. Chandru M. (2025a). Motion responses of offshore structures with hydrodynamic factors in designing a floating breakwater and wave energy convertor - A Review. J. Ocean Eng. Sci.11, 233–263.
21
Salter S. H. Jeffrey D. C. Taylor J. R. M. (1975). Study of mechanisms for extracting power from sea waves, Interim report on Edinburgh wave power project, (Edinburgh, UK: University of Edinburgh).
22
Taveira-Pinto F. Iglesias G. Rosa-Santos P. Deng Z. D. (2015). Preface to special topic: Marine renewable energy. J. Renewable Sustain. Energy7, 061601. doi: 10.1063/1.4939086
23
Vicinanza D. Contestabile P. Nørgaard J. Q. H. Andersen L. T. (2014). Innovative rubble mound breakwaters for overtopping wave energy conversion. Coast. Eng.88, 154–170. doi: 10.1016/j.coastaleng.2014.02.004
24
Wang R. Q. Ning D. Z. Zou Q. P. (2020). Wave loads on a land based dual-chamber oscillating water column wave energy device. Coast. Eng.160, 103744. doi: 10.1016/j.coastaleng.2020.103744
25
Wu J. M. Yao Y. X. Li W. Zhou L. Goteman M. (2017a). Optimizing the performance of solo duck wave energy converter in tide. Energies10, 289. doi: 10.3390/en10030289
26
Wu J. M. Yao Y. X. Zhou L. Chen N. Yu H. F. Li W. et al . (2017b). Performance analysis of solo duck wave energy converter arrays under motion constraints. Energy139, 155–169. doi: 10.1016/j.energy.2017.07.152
27
Zhang C. Huang S. You Y. G. Sheng S. W. (2019). Numerical research and open sea tests of a 100-kW modified Edinburgh duck wave energy converter. Front. Energy Res.7, 120. doi: 10.3389/fenrg.2019.00120
28
Zhang Y. X. Zhao Y. J. Sun W. Li J. X. (2021). Ocean wave energy converters: Technical principle, device realization, and performance evaluation. Renewable Sustain. Energy Rev.141, 110764. doi: 10.1016/j.rser.2021.110764
29
Zhang H. M. Zhou B. Z. Vogel C. Willden R. Zang J. Zhang L. (2020). Hydrodynamic performance of a floating breakwater as an oscillating-buoy type wave energy converter. Appl. Energy257, 113996. doi: 10.1016/j.apenergy.2019.113996
30
Zhao X. L. Ning D. Z. (2018). Experimental investigation of breakwater-type WEC composed of both stationary and floating pontoons. Energy155, 226–233. doi: 10.1016/j.energy.2018.04.189
31
Zhao X. L. Ning D. Z. Zou Q. P. Qiao D. S. Cai S. Q. (2019a). Hybrid floating breakwater–WEC system: A review. Ocean Eng.186, 106126. doi: 10.1016/j.oceaneng.2019.106126
32
Zhou B. Z. Li J. H. Zhang H. M. Chen L. F. Wang L. Jin P. (2021). “ Wave extraction and attenuation performance of an Edinburgh duck wave energy converter,” in China Ocean Engineering, vol. 35. , 905–913.
33
Zhou B. Z. Wang Y. Zhang H. M. Jin P. Wang L. Zhou Z. M. (2022). “ Wave extraction and attenuation performance of hybrid system of an Edinburgh duck WEC and a floating breakwater,” in China Ocean Engineering, vol. 36. , 167–178.
Summary
Keywords
conversion efficiency, Edinburgh Duck WEC, floating breakwater, hydrodynamic performance, mean interaction factor, wave power absorption
Citation
Vidyabhushan RR and Karmakar D (2026) Wave power extraction performance from Edinburgh Duck WEC integrated with floating breakwater. Front. Mar. Sci. 12:1723929. doi: 10.3389/fmars.2025.1723929
Received
13 October 2025
Revised
28 November 2025
Accepted
28 November 2025
Published
16 January 2026
Volume
12 - 2025
Edited by
Francisco Taveira-Pinto, University of Porto, Portugal
Reviewed by
Muhamad Aiman Bin Jalani, National Defence University of Malaysia, Malaysia
Chandru M, Vellore Institute of Technology (VIT), India
Updates
Copyright
© 2026 Vidyabhushan and Karmakar.
This is an open-access article distributed under the terms of the Creative Commons Attribution License (CC BY). The use, distribution or reproduction in other forums is permitted, provided the original author(s) and the copyright owner(s) are credited and that the original publication in this journal is cited, in accordance with accepted academic practice. No use, distribution or reproduction is permitted which does not comply with these terms.
*Correspondence: Debabrata Karmakar, dkarmakar@nitk.edu.in
Disclaimer
All claims expressed in this article are solely those of the authors and do not necessarily represent those of their affiliated organizations, or those of the publisher, the editors and the reviewers. Any product that may be evaluated in this article or claim that may be made by its manufacturer is not guaranteed or endorsed by the publisher.