 Fudi Chen
 Yan Duan1
 Yuwei Zhang
- 1Liaoning Ocean and Fisheries Science Research Institute, Key Laboratory of Protection and Utilization of Aquatic Germplasm Resource, Ministry of Agriculture and Rural Affairs, Liaoning Province Key Laboratory of Marine Biological Resources and Ecology, Dalian Key Laboratory of Conservation of Fishery Resources, Dalian, China
- 2School of Marine Science and Environment Engineering, Dalian Ocean University, Dalian, China
Accurate monitoring of polyp attachment density is critical for the efficient culture of the edible jellyfish Rhopilema esculentum, yet quantitative density–growth guidelines remain limited. This study coupled image-based deep learning with conventional morphometry to characterise density-dependent growth of polyps. Polyp calyx diameter was measured manually to establish a density–size relationship. In parallel, standardised photography combined with a U-Net segmentation model was used to obtain individual polyp counts and projected areas. Regression analyses were conducted to derive functional relationships between attachment density and polyp size metrics, and processing times were compared between manual and automated approaches. Manual measurements showed that calyx diameter followed a power-law decay with density (Calyx diameter = 1.5752Density-0.281, R2 = 0.9614). Automated image analysis yielded an exponential density–polyp area model (Polyp area = 4.3888e -0.202Density, R2 = 0.9909). Both models revealed a strong inverse relationship: as attachment density increased, average polyp size and relative growth efficiency declined, whereas size variability increased. The U-Net-based segmentation approach achieved processing times of under one second per image, dramatically faster than manual measurements. These results demonstrate that AI-driven image segmentation provides accurate, high-throughput estimation of polyp size and robust quantitative density–growth relationships. The approach offers a practical and efficient tool for precision monitoring and optimisation of nursery conditions in R. esculentum aquaculture.
1 Introduction
The edible jellyfish (Rhopilema esculentum) is one of a traditional marine fishery resource and a key economic aquaculture species in China (You et al., 2007; Dong et al., 2013). Rising demand coupled with declines in wild stocks has prompted R. esculentum aquaculture and stock enhancement, yielding over CNY 10 billion per year (Dong et al., 2009; Jiao et al., 2021; Li et al., 2020; You et al., 2012). R. esculentum has been an indispensable component of Chinese cuisine due to its high nutritional value, characterized by rich protein content and low fat accumulation (You et al., 2007; Khong et al., 2016). Recent advances in biotechnology have facilitated the application of R. esculentum deep-processing technologies in beauty, healthcare, and pharmaceutical industries, highlighting its vast potential for high-value utilization (Cheng et al., 2017; Serebrennikova et al., 2024; Zhang et al., 2025; Wang et al., 2024). In summary, the R. esculentum industry provides notable social, economic, and ecological benefits. As the foundation of the supply chain, high-quality seed breeding plays a pivotal role in ensuring consistent production and long-term sustainability (Sun et al., 2022; Duan et al., 2023).
The life cycle of R. esculentum is complex, consisting of alternating generations with distinct ontogenetically stages, transitioning between sexual reproductive medusae and asexually reproductive polyps (Ding and Chen, 1981). The polyp stage plays a pivotal role in the life cycle of R. esculentum, acting as a critical determinant for subsequent stages, including strobilation and ephyra production. During this stage, the polyp size and health can significantly influence its ability to undergo strobilation, which is essential for medusa yield. Optimizing polyp growth through appropriate attachment densities not only ensures healthier polyps but also maximizes ephyra production, directly impacting nursery efficiency. In years of breeding and production practice, we have observed that excessive polyp density leads to growth inhibition, morbidity, and even mortality, whereas insufficient attachment density limits productivity. Although the approximate range of polyp density has been empirically estimated through microscopic observation, this traditional approach is time-consuming and prone to substantial errors. Moreover, no quantitative studies have yet clarified the the relationship between attachment density and individual growth. Therefore, scientifically defining the relationship is essential for advancing the sustainable development of the R. esculentum seedling industry and promoting high-quality aquaculture.
To efficiently explore the relationship between density and growth, intelligent technologies are increasingly being introduced. The rapid development of computer vision and artificial intelligence has revolutionized biomass and density monitoring in aquaculture (Al-Abri et al., 2025). Deep-learning-based image recognition enables non-invasive, high-throughput, and real-time estimation of key biological parameters such as organism count, size, and spatial distribution (Vijayalakshmi and Sasithradevi, 2025). These techniques have been widely adopted in industrial aquaculture for species like Atlantic salmon (Salmo salar), Nile tilapia (Oreochromis niloticus), and Pacific white shrimp (Litopenaeus vannamei), supporting smart feeding, enhanced growth monitoring, and optimized stocking management (Garcia-d’Urso et al., 2022; Banno et al., 2024; Hossam et al., 2024; Ramírez-Coronel et al., 2024; Correia et al., 2025). Compared with traditional manual measurements, automated image analysis reduces labor demand, improves consistency, and enables continuous monitoring, making it particularly suited for large-scale precision aquaculture. However, in jellyfish polyps, the millimeter-scale size, translucency, and strong aggregattion behavior pose unique challenges for conventional sampling and detection. Modern imaging systems equipped with high-resolution cameras, advanced segmentation algorithms, and object tracking capabilities offer promising solutions (Li et al., 2024). For instance, Jaffe et al. (2022) employed optical coherence tomography to reconstruct 3D matrices capable of detecting individual coral polyps even in highly congested environments. Such technological advances provide valuable tools for overcoming the challenges of accurate polyp density monitoring.
To address the challenge of quantifying growth variability across different attachment density gradients, this study integrated modern image recognition techniques with traditional manual measurements as a control. Individual polyp growth data were extracted under various attachment density conditions to analyze the effects of density on polyp size, establish an image-based monitoring method, and develop an automated density–growth model. The models were compared to identify the optimal one, evaluated its performance, and validate the predictive capability. The main objective was to improve the accuracy of polyp density and growth measurements while enhancing monitoring efficiency. This integrated, data-driven workflow provides a quantitative basis for managing attachment density in jellyfish aquaculture, replacing empirical trial-and-error approaches with predictive optimization of rearing efficiency and yield, and offering a technological pathway toward intelligent, high-efficiency industrial jellyfish farming.
2 Materials and methods
2.1 Polyp source
Rhopilema esculentum polyps were obtained from the Yingkou jellyfish seedling farm. These polyps originated from sexual reproduction by medusae collected from Yingkou Jellyfish (R. esculentum) aquaculture ponds from 22 to 29 September 2024. Polyps were attached on the polyethylene (PE) corrugated plate strings. Each string contained 25 PE corrugated plate sheets spaced about 5 cm apart and suspended horizontally from a bamboo support. Ten strings were attached to each bamboo, with ten bamboos arranged in a 4 m × 6 m × 1.5 m tank filled with filtered seawater. All polyp groups were fed daily with Brachionus plicatilis (average body length ≈ 200 µm) and Artemia salina nauplii (average body length ≈ 300 µm). Feeding was administered manually three times per day (morning, midday, and evening), with aeration to ensure uniform distribution of feed throughout the water column. Water was exchanged daily at 50% of the system volume, and a complete (100%) water exchange was performed once per week. All young polyp groups were reared under identical environmental conditions, including temperature range (20-22°C), salinity (20–24 ppt). No additional manipulation of environmental conditions was applied across groups. Before podocyst reproduction of most polyps, images of the polyps were acquired and measurement of their morphological parameters began on 16 November 2024.
2.2 Image-based analysis approach
To quantify polyp density and morphology through image-based analysis, high-resolution images of R. esculentum polyps were collected between November 16 and December 16, 2024, at a jellyfish aquaculture facility in Yingkou, Liaoning Province, China. Figure 1 showed the schematic diagram of measuring devices and methods. PE corrugated plates bearing attached polyps were imaged using a high-definition camera system. Each image captured a 1 × 1 cm² region of the plate, forming a dataset of approximately 2,400 images across predefined attachment-density treatments. Images without visible polyps were excluded. Heavy biofouling and low contrast in the images may reduce segmentation accuracy. To mitigate these issues, mild pre-cleaning and quality checks were performed on the images before processing to ensure optimal results. Thirteen attachment-density gradients (1–13 ind/cm²) were selected to span the actual nursery production density range, thereby capturing the full density-size response. The resulting dataset enabled both manual annotation and automated analysis of polyp count, size, and morphology using deep-learning based image recognition techniques.

Figure 1. Schematic diagram of measuring devices and methods.
2.2.1 Manual measurement of calyx diameter of polyps
Manual measurements were performed on high-resolution images obtained from the standardized imaging protocol. Each image contained a metric ruler for scale calibration, and measurements were conducted using Digimizer software (MedCalc, Belgium). The ruler provided a reference for converting pixel distance to actual length. The plate surface in each image was divided into 1 × 1 cm grids using the software’s measurement tools to standardize local analyses. Within each grid cell, the calyx diameter of every clearly visible polyp, defined as the maximum transverse width, was manually measured. The resulting data were exported for subsequent statistical analysis of local polyp density and average calyx diameter.
2.2.2 Automated measurement of polyp area based on image segmentation
Images were preprocessed to enhance quality and ensure uniformity. Preprocessing steps included denoising using a Gaussian filter, background illumination normalization, and contrast enhancement to ensure clearer boundary detection. These preprocessing steps were crucial for improving the segmentation accuracy of the U-Net model. To improve automation and processing efficiency, a deep learning model was developed for automatic image-based segmentation and morphometric analysis of R. esculentum polyps. Figure 2 showed the process of automatic measuring method based on U-Net. The model adopted the U-Net architecture, a convolutional neural network widely used for biomedical image segmentation. Each PE plate contained approximately 2,000–4,000 polyps. Given their microscopic size and dense distribution, the U-Net model was employed to segment individual polyps, extract object boundaries, and calculate the pixel area of each polyp for quantitative analysis.
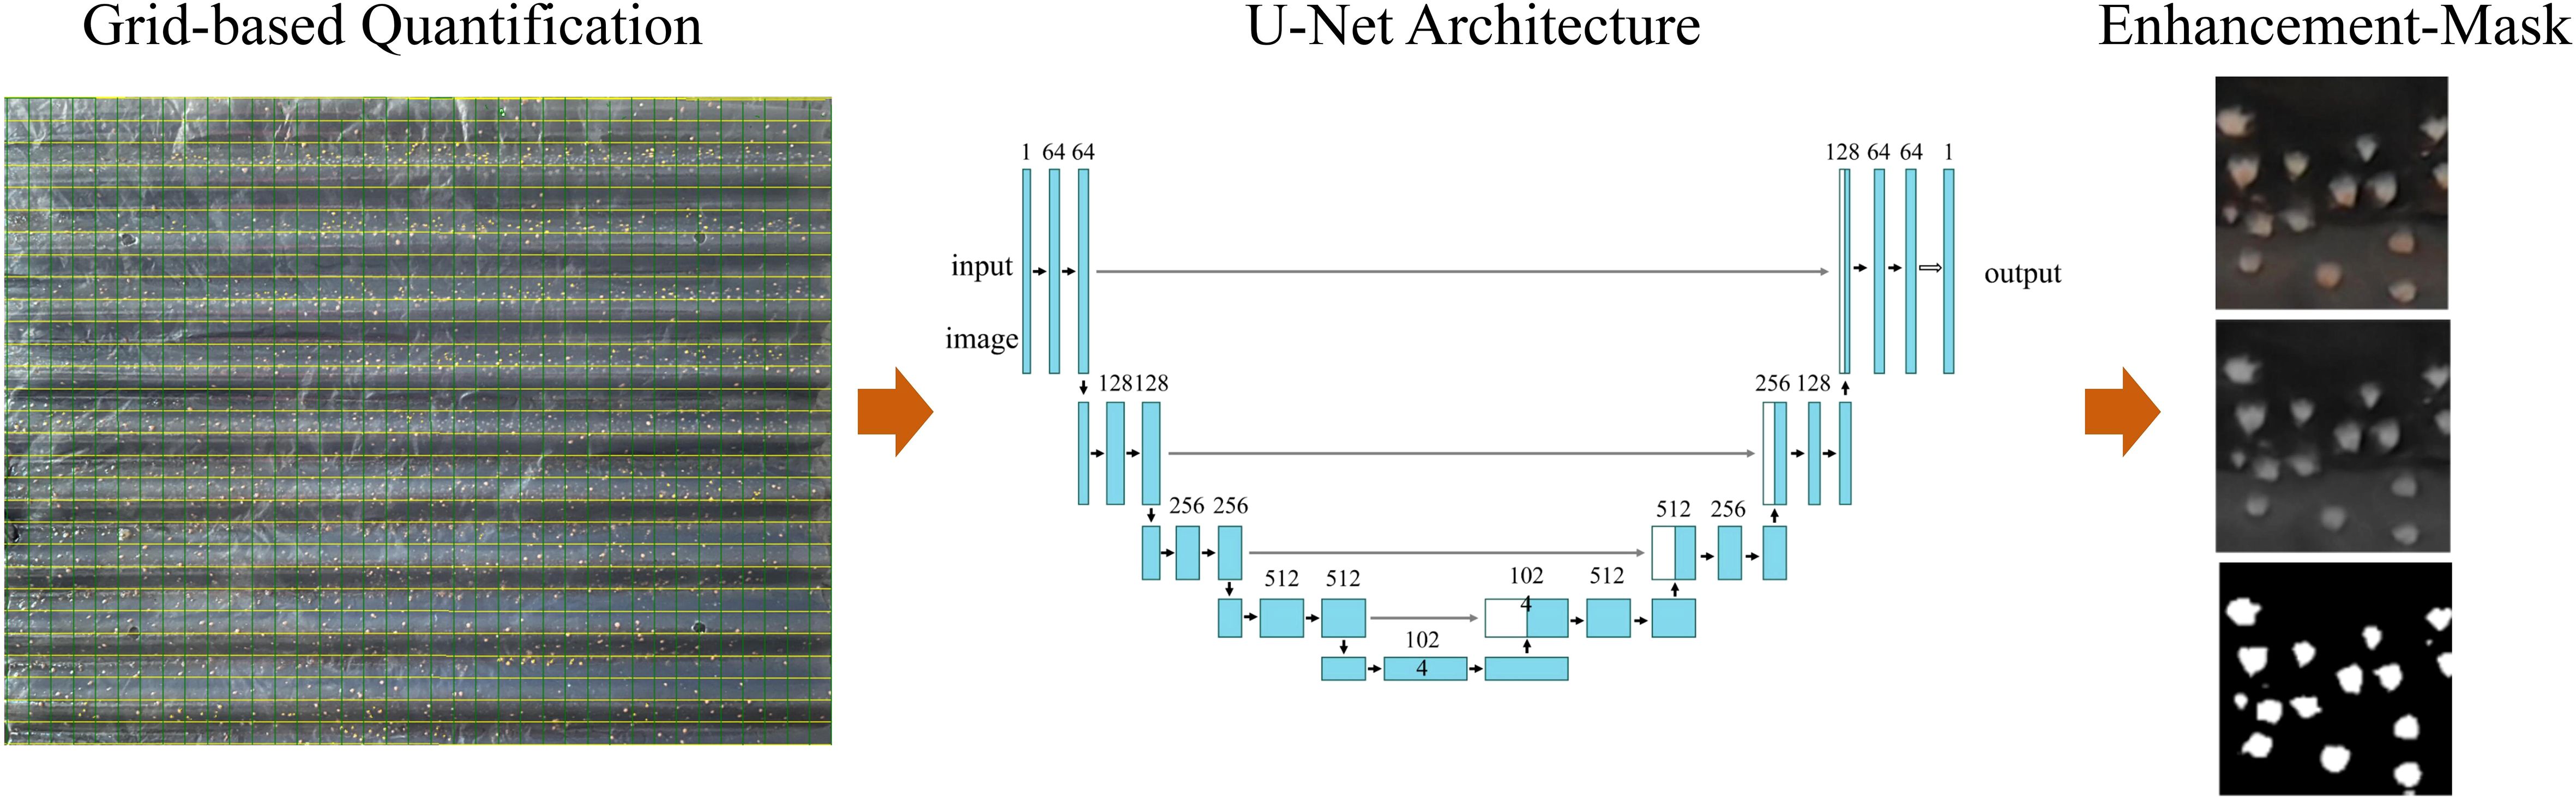
Figure 2. The process of automatic measuring method based on U-Net.
Original images were preprocessed to enhance contrast and normalize background illumination. A U-Net convolutional neural network was trained for semantic segmentation, enabling accurate identification of individual polyps based on color and shape features. The training dataset consisted of 1,600 manually annotated images, with an additional 800 images reserved for testing. Polyp regions were labeled as foreground (value = 255) and background as zero. After segmentation, binary masks were generated, and connected-component analysis was used to isolate individual polyps and calculate their pixel-based areas.
Pixel counts were converted to real-world units (mm²) using a scale factor derived from a ruler included in each image, allowing quantitative comparison across samples. Input images were resized to 512 × 512 pixels and augmented to improve model generalization. Model performance was evaluated using pixel-level accuracy, root mean square error (RMSE), and coefficient of determination (R²) between predicted and manually measured areas. Training and inference were conducted in PyTorch 2.5.1 on a workstation equipped with an NVIDIA RTX 4080 GPU.
The extracted morphological parameters included individual polyp area (mm²), surface coverage (%), and polyp count per 1 × 1 cm² region. Pixel-based area was defined as the total number of pixels within each segmented region and served as a proxy for individual size. By converting pixel areas into physical dimensions, the relationship between attachment density, polyp area, and relative growth efficiency was quantitatively established.
2.3 Bio-attachment density and growth metrics
Polyp bio-attachment density (ind/cm²) was calculated as:
Where N is number of polyps within a defined sampling area, S is surface area of the sampling region (cm²).
Coefficient of Variation (CV) is used to quantify intra-group morphological variability.
Where n is the sample size, μ is the mean, σ is the standard deviation. CV represents the coefficient of variation, indicating the degree of data dispersion.
2.4 Data analysis
Statistical analyses were performed in Python using the SciPy and StatsModels libraries. Three regression models, including linear regression, power-law, and exponential models were fitted to the data to examine the relationship between bio-attachment density and morphological traits. Model performance was evaluated using the coefficient of determination (R²), root mean square error (RMSE), mean absolute error (MAE), and mean absolute percentage error (MAPE). Differences among density groups were assessed using one-way ANOVA, with statistical significance set at p < 0.05.
Response surface methodology (RSM) was then applied using three key variables to compare the manual and automated approaches. These metrics collectively reflect individual growth performance and population-level uniformity. Experimental data from multiple density groups were used to fit a second-order polynomial regression model of the form:
where x denotes the bio-attachment density (ind/cm²), y denotes the coefficient of variation (CV), and z denotes the polyp size.
3 Results
3.1 Effects of polyp bio-attachment density on growth
Polyp bio-attachment density exhibited a pronounced effect on individual growth performance, as reflected in both calyx diameter and polyp area (Figure 3). Across the tested density range (1–13 ind./cm²), a consistent declining trend in individual size was observed with increasing density. This suggests a strong negative density-dependent growth pattern.
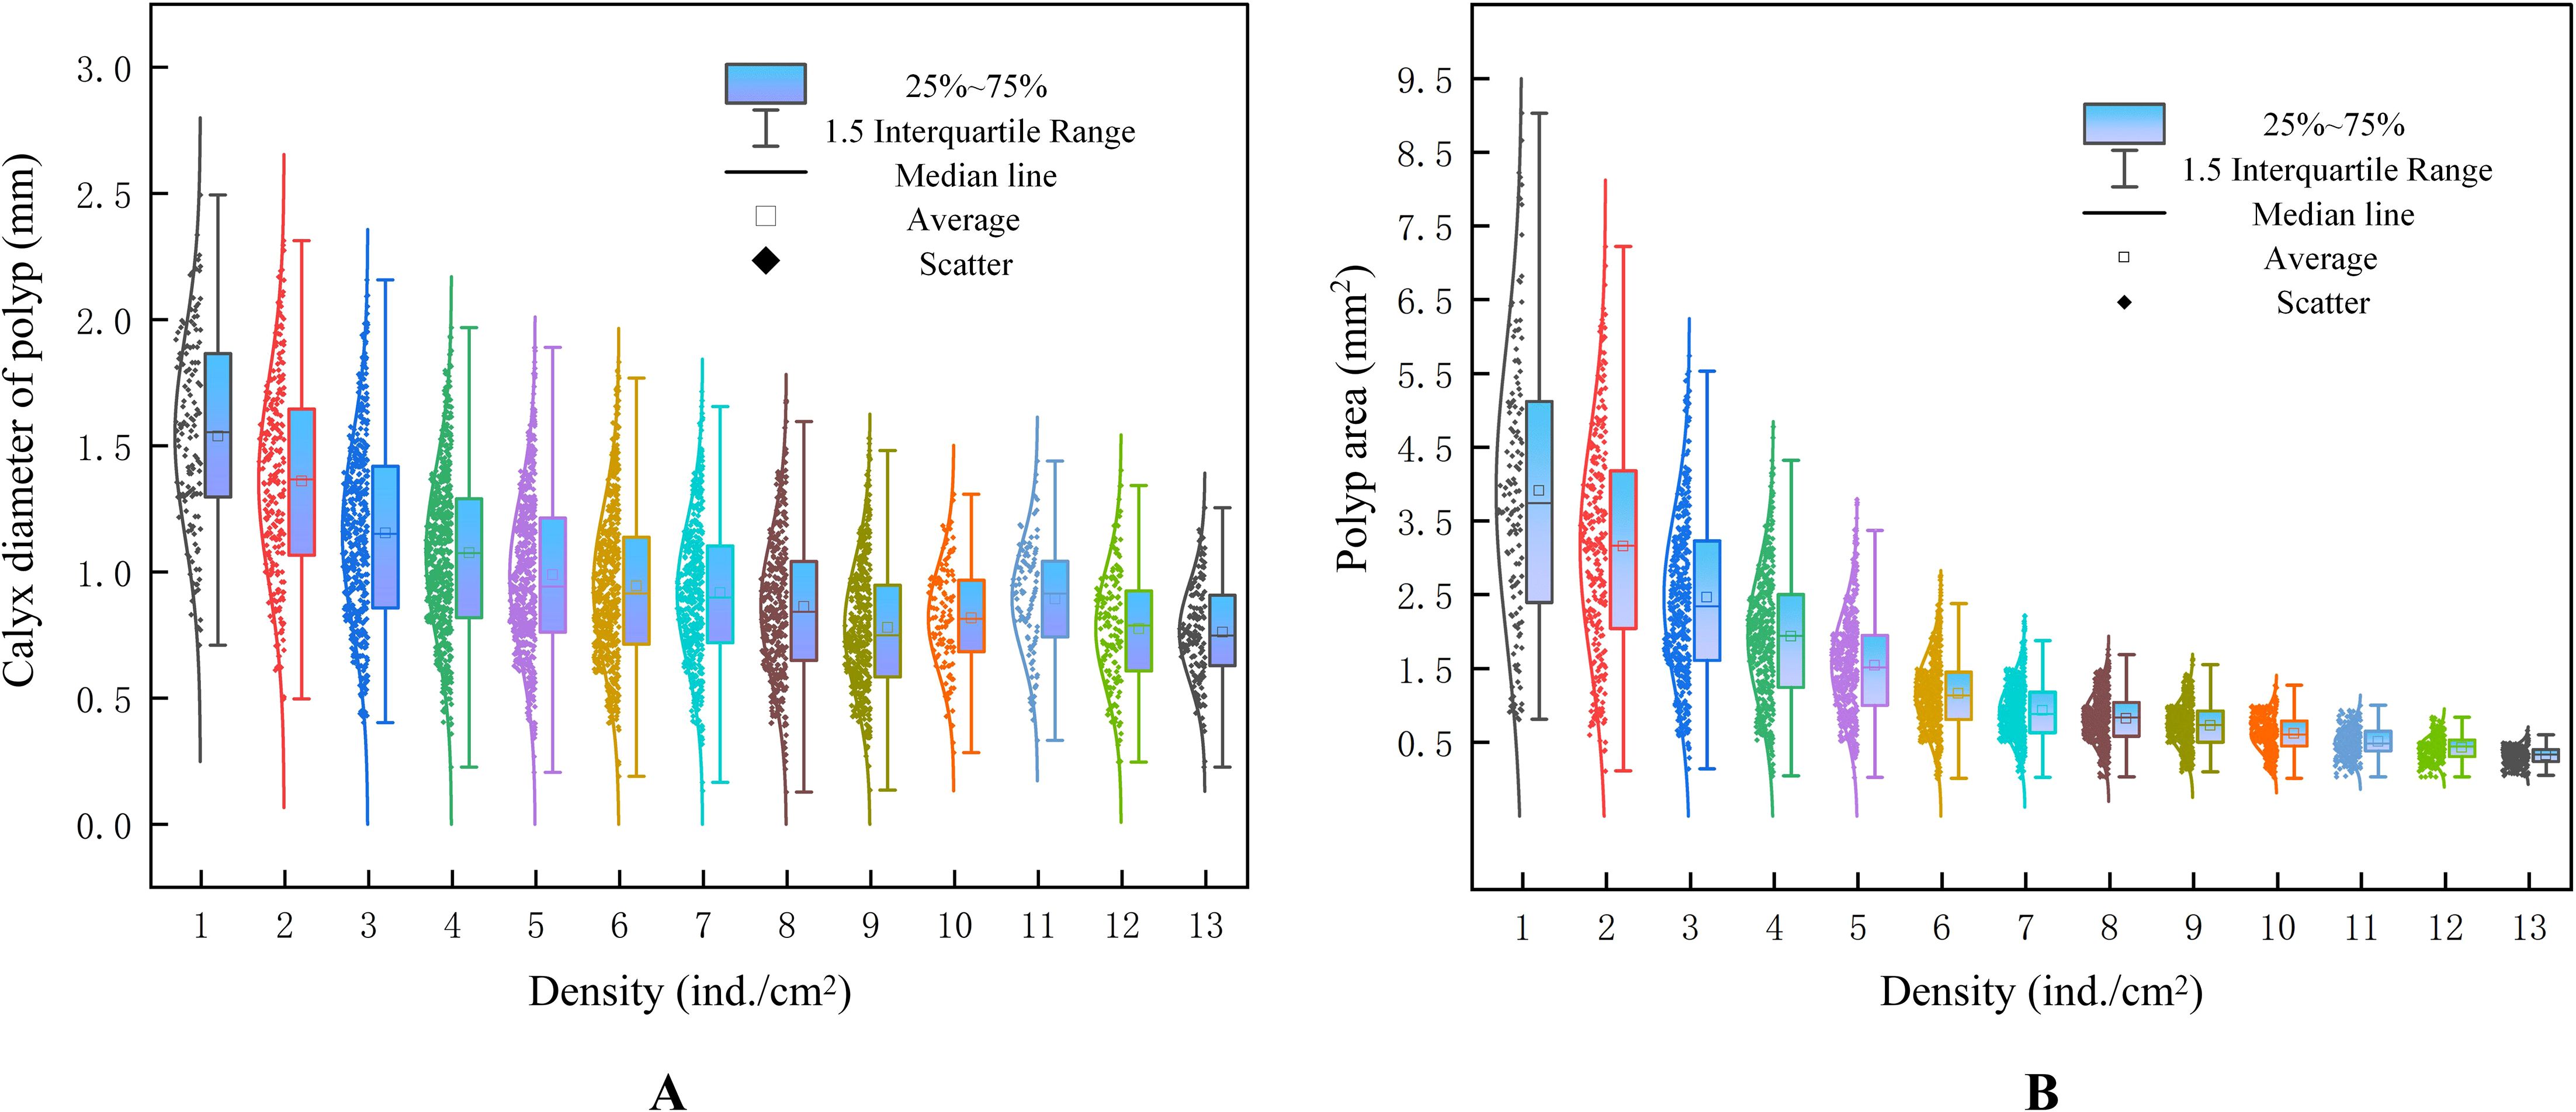
Figure 3. Numerical distribution diagram of calyx diameter and area under different polyp density ranges; (A) calyx diameter of polyp measured by manual; (B) area distribution measured by computer vision.
Figure 3A showed that the calyx diameter of polyps decreased significantly as density increased. At low densities (1–3 ind./cm²), mean diameters were relatively large, with wider interquartile ranges and lower variance. As density exceeded 4 ind./cm², median diameters declined sharply, and data dispersion increased, indicating greater size heterogeneity among individuals. Notably, beyond 6 ind./cm², most groups exhibited reduced growth with higher variability.
Similarly, Figure 3B demonstrated that polyp area decreased markedly with increasing bio-attachment density. At densities of 1–2 ind./cm², polyps exhibited the largest mean areas (above 4.0 mm²). However, a sharp decline in area was observed between densities 3 and 6 ind./cm². From 7 ind./cm² onwards, polyp area stabilized at low levels (<1.0 mm²), with minimal variation between groups.
As shown in Figure 4, both manual (Figure 4A) and automated (Figure 4B) measurements demonstrated a general trend of decreasing polyp size with increasing bio-attachment density. However, the Dunnett-T multiple comparison results revealed notable differences in group-level significance patterns between the two methods. In the manual measurements, polyps at lower density levels exhibited significantly larger calyx diameters than those at higher densities, with clear distinctions among the low-density groups. For instance, density levels 1 to 5 ind./cm² were labeled with different letters, indicating statistically significant differences. However, from medium densities onward, the differences in calyx diameter became less pronounced, as evidenced by overlapping significance groups among density levels 5 to 8 ind./cm². This suggests a plateauing effect, where size reduction stabilizes despite increasing density. In the highest density groups (≥9 ind./cm²), the measured diameters converged to a minimal level, with all groups marked by the same letter “i,” indicating no significant differences and further supporting a saturation trend in size suppression under crowded conditions.

Figure 4. Statistical significance determined by the Dunnett-T test: (A) polyp calyx diameter measured manually; (B) polyp area quantified by automated image analysis.
In contrast, automated measurements revealed a more consistent and sensitive response to density variation. In Figure 4B, all density levels from 1 to 13 ind./cm² were assigned unique letters (a to m), implying that each incremental increase in density yielded a statistically significant decrease in projected polyp area. Notably, this monotonic differentiation persisted even at higher density ranges, without overlapping significance groups.
3.2 Construction of a polyp density–size relationship model
The effect of bio-attachment density on individual size was quantified using two parallel density–size models: Figure 5A showed the manual density–calyx diameter dataset and Figure 5B showed the automated density–polyp area dataset.

Figure 5. Regression analysis of two measurement methods; (A) manual measurement; (B) automatic measurement.
Calyx diameter decreased as a negative power function of density (Figure 5A). The best-fit model was.
where y is calyx diameter (mm) and x is bio-attachment density (ind/cm²). The high coefficient of determination indicates that ≈96% of the variance in diameter is explained by density alone. The model predicts a rapid decline in diameter between 1 and 4 ind/cm², followed by a more gradual taper beyond 6 ind/cm², consistent with the threshold behaviour observed in Figure 5A.
Using U-Net segmentation, mean polyp area followed an exponential decay with density (Figure 4B):
where y is polyp area (mm²). This model explains >98% of the observed variance, underscoring the robustness of the automated approach. Area declined sharply from ≈4 mm² at 1 ind/cm² to <1 mm² at densities ≥8 ind/cm², mirroring the suppression pattern revealed by manual measurements.
Figure 6 illustrated three-dimensional response surfaces describing the relationship between polyp size and bio-attachment density, derived from manual and automated measurement. Both models revealed a consistent negative correlation, indicating that polyp size decreases with increasing attachment density. The automated surface appeared smoother and more continuous, whereas the manually derived surface displayed noticeable fluctuations and irregularities across the density range. This suggests that manual measurements are more susceptible to variability, particularly at high densities where overlapping individuals and orientation bias reduce the accuracy of diameter estimation. In contrast, the automated approach maintained sufficient resolution to detect subtle size differences among closely spaced density gradients.

Figure 6. Three-dimensional response surfaces of polyp size versus attachment density derived from manual and automated models.
The two methods also differed markedly in measurement variability. Manual measurements exhibited pronounced fluctuations, especially at medium densities (6–11 ind./cm²), leading to greater dispersion and non-significant differences between adjacent groups. This instability likely contributed to the merging of statistical groupings. Conversely, the automated method produced lower and more consistent errors, with standard error declining as density increased. At high densities, automated estimates showed minimal variance and short error bars, yielding clearer statistical separation between groups.
Overall, the automated model demonstrated superior consistency and robustness, with data points aligning more closely to the fitted surface. Its uniform measurement criteria and use of projected area as a morphometric proxy reduced subjectivity and noise, resulting in improved reproducibility.
3.3 Estimation of polyp density–size models
Using the manual measurements, a power-law relationship between polyp calyx diameter and local attachment density was observed, yielding an R² of 0.9614. In comparison, the automated analysis based on U-Net segmentation demonstrated an exponential decay relationship between polyp area and density, with a higher R² of 0.9909. The stronger fit of the automated model indicates improved precision in quantifying the density–size relationship.
Table 1 showed the evaluation indices for the manual and automatic methods. Since the manually selected indicators had a smaller order of magnitude, the RMSE, MAE, and MAPE were all lower than those of the automated method. However, the automated model exhibited higher regression coefficients, thus achieving more accurate predictions for the indicators. These results indicate that the automated model provided slightly higher predictive accuracy, particularly in high-density zones where manual counting and diameter measurement become increasingly difficult due to overlapping individuals.

Table 1. Evaluation for the measurement methods.
Although the manual method yielded lower absolute errors due to the smaller measurement scale, the automated model achieved superior goodness of fit and processed each image in under one second. The automated approach was highly repeatable and readily scalable for large datasets. Its main limitation lies in sensitivity to imaging artifacts such as uneven illumination, reflections, and substrate curvature, which can affect segmentation accuracy. Overall, both methods captured a strong inverse relationship between density and polyp size, but the automated pipeline outperformed manual analysis in consistency, speed, and throughput, making it more suitable for large-scale polyp monitoring and growth assessment in jellyfish aquaculture.
3.4 Model validation of automatic polyp size estimation
A total of 3,083 polyps were measured via automated image processing, and the average polyp area for each density group was computed to construct a validation dataset. Figure 7A presents a scatter plot comparing the calculated values against the actual measured values, with the diagonal reference line indicating perfect agreement. The data points closely align with this reference line, highlighting the strong predictive accuracy of the automated estimation model.

Figure 7. Validation analysis of automatic method. (A) scatter plot comparing the calculated values against the actual measured values; (B) residual scatter analysis.
Additionally, residual analysis (Figure 7B) illustrated that prediction errors consistently fluctuate within ±0.2 mm² across the tested polyp density range, further demonstrating the precision and stability of the automatic measurement method. Collectively, these findings confirm the reliability and effectiveness of the automated image-based approach, suggesting its suitability for rapid, high-throughput, and non-invasive polyp size monitoring in practical aquaculture settings.
4 Discussion
4.1 Effects of attachment density on polyp growth
The polyp stage is foundational for subsequent strobilation and ephyra production. In the manual workflow, morphologically abnormal polyps were not measured, such cases were rare and did not affect the overall trend. By contrast, the automated analysis included all detected polyps on each plate using area-based segmentation. Both manual and automated measurements consistently revealed a negative correlation between attachment density and individual polyp growth. In the manual measurements, as attachment density increased from 1 to 5, the average calyx diameter decreased markedly from 1.539 mm to 0.989 mm (p < 0.05), with similar but less pronounced trends at intermediate densities. In the automated segmentation analysis, density ranged from 1 to 13, during which the mean projected area declined significantly from 3.908 mm² to 0.319 mm². These results confirm a density-dependent growth inhibition pattern across datasets, indicating that polyp growth becomes progressively limited as attachment density increases. The observed convergence in size at higher densities suggests the presence of a threshold beyond which further increases in density may no longer result in proportional growth. The exact value of this threshold will require further research to determine, but it highlights the importance of optimizing density levels for efficient growth.
Polyps reared at low densities attained larger and more uniform sizes, whereas those under crowded conditions were smaller and more variable. This inverse relationship aligns with ecological principles for sessile invertebrates, where overcrowding limits access to food, light, and space, and promotes localized accumulation of waste, all of which suppress growth and increase disease susceptibility (Melica et al., 2014; Glass and Barott, 2025). Previous studies have shown that environmental factors such as food quality, temperature, and salinity strongly influence polyp growth and reproduction in Aurelia species (Chi et al., 2019; Xing et al., 2019). The biological consequences of reduced growth extend to reproduction: successful strobilation requires polyps of sufficient size, and density-induced size reduction can impair ephyra quality (Ge et al., 2022; Schäfer et al., 2021). Thus, high attachment density not only suppresses growth but also compromises reproductive output and medusa quality (Liu et al., 2016). Therefore, although the present models effectively captured density-driven growth suppression, future predictive frameworks should integrate both density and environmental variables to enhance aquaculture applicability.
Overall, these findings demonstrate that excessive attachment density exerts negative impacts on polyp growth. Maintaining attachment density within an appropriate range is therefore essential for ensuring healthy and stable seedling performance in jellyfish aquaculture.
4.2 Model performance and applicability
The discrepancy between the power-law fitting of manual measurements and the exponential decay fitting of automatic measurements is likely due to differences in measurement approach and data range. In the manual measurements, due to the morphological variability of polyps on the undulating attachment plates, the stem diameter needed to be manually selected at specific points based on the experimenter’s judgment, resulting in a smaller data range. In contrast, the automatic segmentation method estimated the polyp size using pixel area, which is less dependent on polyp posture and requires fewer subjective decisions, resulting in a larger data range. Manual measurement of calyx diameter followed a negative power-law model (Diameter=1.5752·Density^–0.281, R²=0.9614), whereas automated image segmentation of polyp area produced an exponential decay function (Area=4.3888·e^–0.202·Density, R²=0.9909). The automated model achieved a higher goodness-of-fit, reflecting its greater sensitivity to subtle morphological variations across density gradients. Quantitative comparisons between the two approaches were summarized in Table 1. Although manual measurements showed slightly lower numerical errors (RMSE = 0.0384, MAE = 0.0257, MAPE = 2.63%) than automated segmentation (RMSE = 0.2087, MAE = 0.1462, MAPE = 9.77%), the automated approach offered far superior efficiency, consistency, and objectivity. In the Dunnett multiple-comparison analysis, the automated system successfully distinguished all 13 density levels with minimal variance, whereas manual measurements plateaued beyond ~5–6 ind./cm² due to overlapping individuals and orientation bias. Figure 6 further illustrated this contrast: the automated response surface appears smooth and continuous, while the manual surface displayed irregular fluctuations caused by subjective error.
Despite differences in functional form (power-law versus exponential), both models captured a pronounced negative relationship between attachment density and polyp size, confirming the robustness of the density effect. The automated model achieved a slightly higher R² and finer resolution for small size differences, particularly at high densities where manual readings became less reliable. Processing efficiency also differed substantially. The automated pipeline analyzed each 1 cm² image block in less than one second, compared with more than 60 seconds for manual measurement (Table 1). This improvement allowed rapid quantification of thousands of polyps within minutes, which is essential for large-scale aquaculture monitoring. Manual measurement, although straightforward, is labor-intensive and restricts both sample size and measurement frequency. Once trained with consistent imaging conditions and annotated data, the automated method operates autonomously with minimal human input.
The two methods also differ in their morphometric proxies. Manual analysis relies on calyx diameter, a one-dimensional metric that is sensitive to orientation and shape irregularities, whereas automated segmentation quantifies projected area, which incorporates two-dimensional variation and better approximates volumetric growth. Both indices declined consistently with increasing density, but area-based estimation captured deformation and overlapping effects more effectively, contributing to higher precision. Overall, the manual power-law approach remains robust and historically standard but is constrained by limited throughput and reduced accuracy at high densities. In contrast, the automated exponential model demonstrated superior fit (R² = 0.9909), consistency, and processing speed. The model was constructed using monitoring data collected from September to November 2024, which corresponded to the rapid growth phase during which polyps developed from four to sixteen tentacles. For research applications, its finer resolution enables detection of subtle effects. For aquaculture operations, its high processing efficiency supports real-time, data-driven management. Although automation depends on image quality, particularly lighting and focus, the results confirm that AI-based segmentation provides a precise, repeatable, and scalable alternative to manual morphometric assessment. It is important to note that the current model was specifically trained on R. esculentum polyps under the described imaging conditions. To apply this model to other species or different substrates, re-imaging or fine-tuning of the model would be necessary to adapt it to new conditions.
4.3 Application prospects
The polyp stage is a critical phase in the life cycle of R. esculentum and is considered a limiting factor for subsequent ephyra and medusa production. This stage determines not only the health and size of the individual polyp but also its strobilation potential. Larger, more robust polyps tend to produce more synchronized and abundant ephyra, which are vital for the success of the next stages of the life cycle. As a result, managing attachment density during the polyp stage is key to optimizing nursery production outcomes.
The integration of automated image-based monitoring with density–growth modeling offers both methodological innovation and practical value for jellyfish aquaculture. Regulating polyp attachment density is essential for achieving stable yields and high-quality medusae. The 13 attachment-density gradients used in this study were intentionally chosen to span a wide range, including densities beyond typical nursery practice. This wider range was selected to fully capture the attachment-density response curve. In routine nursery operations, densities typically fall within the lower to middle range of those tested, ensuring optimal growth without reaching the plateau region. As jellyfish aquaculture expands toward industrial scales, density management will become increasingly critical for ensuring sustainability, biosecurity, and economic efficiency. Beyond nursery operations, density regulation has broader ecological implications. Jellyfish interactions with aquaculture and fisheries can generate far-reaching ecological and economic effects, underscoring the need for predictive tools to support cultivation and management (Bosch-Belmar et al., 2020). Refining density–growth models may optimize rearing performance. For example, if a nursery manager is aiming for a specific polyp size, the response surface model can be used to identify the attachment density range that will support this target size. Alternatively, if the manager is aiming for a specific coefficient of variation in polyp size, the model can guide the selection of the density that minimizes the CV, ensuring more uniform growth. This approach allows for a more data-driven, optimized management of attachment density, leading to better control over polyp growth and overall nursery efficiency. Advances in computer vision and artificial intelligence will further accelerate this process, providing robust and scalable monitoring solutions for modern aquaculture (Al-Abri et al., 2025; Garcia-d’Urso et al., 2022).
The significance of the polyp stage extends beyond aquaculture, as polyps form the ecological foundation sustaining scyphozoan populations and act as the benthic reservoir from which medusae are recruited under favorable conditions (Lucas et al., 2012). At high attachment densities, smaller polyp sizes likely arise from a complex interaction between space limitation and reduced food resource. The relative contributions of these mechanisms require further study. Modeling density-dependent polyp dynamics therefore provides insights into both artificial cultivation and natural population ecology. Environmental factors such as salinity, temperature, and food availability are known to influence polyp performance and life-cycle transitions (Dong et al., 2015), emphasizing the need for integrative models. Future research should advance toward multifactorial frameworks that couple density effects with key environmental drivers—temperature, salinity, food quality, and availability. Previous studies indicate that these factors profoundly shape polyp growth and reproductive strategies, suggesting that density alone cannot fully explain developmental variation (Chi et al., 2019; Xing et al., 2019). Incorporating ecological, environmental, and genetic variability will enhance the predictive capacity of these models and provide practical decision-support tools adaptable to dynamic culture conditions (Baltazar-Soares et al., 2023). Ultimately, embedding density–growth modeling within intelligent aquaculture systems represents a promising pathway toward sustainable, efficient, and ecologically aligned jellyfish farming.
5 Conclusion
In the present study, R. esculentum polyps were used to explore the relationship between bio-attachment density and growth performance under industrial aquaculture conditions. By applying digital image analysis techniques, polyp morphology indicators were assessed quantitatively and data distribution, achieving close agreement between manual and automated measurements (manual method R² = 0.9614; automated method R² = 0.9909). The experimental results clearly demonstrate that attachment density is a critical factor influencing the growth of jellyfish polyps. As attachment density increased, average polyp area decreased, relative growth efficiency declined, and intraspecific size variation intensified, indicating inhibited development and uneven growth under crowded conditions. These findings highlight the automated image-based quantification enables accurate assessment of polyp size across density gradients, supporting improved management in jellyfish aquaculture.
Data availability statement
The original contributions presented in the study are included in the article/supplementary material. Further inquiries can be directed to the corresponding author.
Ethics statement
The manuscript presents research on animals that do not require ethical approval for their study.
Author contributions
FC: Formal Analysis, Methodology, Writing – original draft, Data curation, Software, Writing – review & editing. YD: Methodology, Writing – review & editing, Supervision. YZ: Investigation, Resources, Writing – review & editing. YX: Methodology, Resources, Writing – original draft, Supervision, Writing – review & editing. QM: Methodology, Validation, Writing – review & editing. MS: Funding acquisition, Supervision, Writing – original draft, Writing – review & editing.
Funding
The author(s) declared that financial support was received for work and/or its publication. This work was supported by the Dalian Outstanding Young Science and Technology Talent Project (Grant NO. 2022RJ12), the Applied Basic Research Plan of Liaoning Province, China (Grant NO. 2025JH2/101300089), the National Key R&D Program of China (Grant NO. 2023YFC3108202), the Dalian Science and Technology Innovation Fund Project (Grant NO. 2022JJ12SN053), the Excellent Youth Fund Project of Liaoning Academy of Agricultural Sciences(Grant NO. 2024YQ0404).
Conflict of interest
The authors declared that this work was conducted in the absence of any commercial or financial relationships that could be construed as a potential conflict of interest.
Generative AI statement
The author(s) declared that generative AI was not used in the creation of this manuscript.
Any alternative text (alt text) provided alongside figures in this article has been generated by Frontiers with the support of artificial intelligence and reasonable efforts have been made to ensure accuracy, including review by the authors wherever possible. If you identify any issues, please contact us.
Publisher’s note
All claims expressed in this article are solely those of the authors and do not necessarily represent those of their affiliated organizations, or those of the publisher, the editors and the reviewers. Any product that may be evaluated in this article, or claim that may be made by its manufacturer, is not guaranteed or endorsed by the publisher.
References
Al-Abri S., Keshvari S., Al-Rashdi K., Al-Hmouz R., and Bourdoucen H. (2025). Computer vision based approaches for fish monitoring systems: a comprehensive study. Artif. Intell. Rev. 58, 185. doi: 10.1007/s10462-025-11180-3
Baltazar-Soares M., Lima A. R., Silva G., and Gaget E. (2023). Towards a unified eco-evolutionary framework for fisheries management: Coupling advances in next-generation sequencing with species distribution modelling. Front. Mar. Sci. 9. doi: 10.3389/fmars.2022.1014361
Banno K., Gonçalves F. M. F., Sauphar C., Anichini M., Hazelaar A., and Sperre L. H. (2024). Identifying losers: automatic identification of growth-stunted salmon in aquaculture using computer vision. Mach. Learn. Appl. 16, 100562. doi: 10.1016/j.mlwa.2024.100562
Bosch-Belmar M., Milisenda G., Basso L., Doyle T. K., Leone A., and Piraino S. (2020). Jellyfish impacts on marine aquaculture and fisheries. Rev. Fish. Sci. Aquac. 29, 242–259. doi: 10.1080/23308249.2020.1806201
Cheng X. C., Shao Z. Y., Li C. B., Yu L. J., Raja M. A., Liu C. G., et al. (2017). Isolation, characterization and evaluation of collagen from jellyfish Rhopilema esculentum Kishinouye for use in hemostatic applications. PloS One 12, e0169731. doi: 10.1371/journal.pone.0169731
Chi X., Mueller-Navarra D. C., Hylander S., Sommer U., and Javidpour J. (2019). Food quality matters: Interplay among food quality, food quantity and temperature affecting life history traits of Aurelia aurita (Cnidaria: Scyphozoa) polyps. Sci. Total Environ. 656, 1280–1288. doi: 10.1016/j.scitotenv.2018.11.469
Correia B., Pacheco O., Rocha R. J. M., and Correia P. L. (2025). Image-Based Shrimp Aquaculture Monitoring. Sensors. 25, 248. doi: 10.3390/s25010248
Ding G. W. and Chen J. K. (1981). The life history of Rhopilema esculentum kishinouye. J. Fish. China 5, 93–104.
Dong J., Jiang L., Sun M., Wang B., Li Y., Tan K., et al. (2013). Biology of giant jellyfish in the Bohai Sea and northern Yellow Sea (Beijing: Ocean Press).
Dong J., Jiang L. X., Tan K. F., Liu H. Y., Purcell J. E., Li P. J., et al. (2009). Stock enhancement of the edible jellyfish (Rhopilema esculentum Kishinouye) in Liaodong Bay, China: a review. Hydrobiologia 616, 113–118. doi: 10.1007/s10750-008-9592-9
Dong J., Sun M., Purcell J. E., Chai Y., Zhao Y., and Wang A. (2015). Effect of salinity and light intensity on somatic growth and podocyst production in polyps of the giant jellyfish Nemopilema nomurai (Scyphozoa: Rhizostomeae). Hydrobiologia 754, 75–83. doi: 10.1007/s10750-014-2087-y
Duan Y., Sun M., Chen F. D., and Wang Y. T. (2023). Effect of different warming regimes in spring on strobilation and ephyrae number of jellyfish Rhopilema esculentum. Fish. Sci. 42, 113–118. doi: 10.16378/j.cnki.1003-1111.21099
Garcia-d’Urso N., Galan-Cuenca A., Pérez-Sánchez P., Climent-Pérez P., Fuster-Guillo A., Azorin-Lopez J., et al. (2022). The DeepFish computer vision dataset for fish instance segmentation, classification, and size estimation. Sci. Data 9, 287. doi: 10.1038/s41597-022-01416-0
Ge J., Chen X., Liu C., Tan J., Bian L., Chen L., et al. (2022). Metabolomics provide insights into the endogenous mechanism of strobilation in the scyphozoan jellyfish Rhopilema esculentum. J. Ocean. Limnol. 40, 226–234. doi: 10.1007/s00343-021-0252-5
Glass B. H. and Barott K. L. (2025). Hypoxia disrupts metabolism in coral and sea anemone larvae. J. Exp. Biol. 228, jeb250372. doi: 10.1242/jeb.250372
Hossam R., Heakl A., and Gomaa W. (2024). “Precision aquaculture: an integrated computer vision and IoT approach for optimized tilapia feeding,” in Proceedings of the 21st international conference on informatics in control, automation and robotics (ICINCO 2024), Porto, Portugal: International Federation of Automatic Control. 1, 668–675. doi: 10.5220/0012995100003822
Jaffe J. S., Schull S., Kühl M., and Wangpraseurt D. (2022). Non-invasive estimation of coral polyp volume and surface area using optical coherence tomography. Front. Mar. Sci. 9. doi: 10.3389/fmars.2022.1049440
Jiao J. J., Zhang Y. Q., Zhang J. H., Li L. Z., and Qiu S. Y. (2021). Jellyfish Rhopilema esculentum stock enhancement in coastal Shandong Province: review and thinking. Fish. Sci. 40, 141–150. doi: 10.16378/j.cnki.1003-1111.19261
Khong N. M. H., Yusoff F. M., Jamilah B., Basri M., Maznah I., Chan K. W., et al. (2016). Nutritional composition and total collagen content of three commercially important edible jellyfish. Food Chem. 196, 953–960. doi: 10.1016/j.foodchem.2015.09.094
Li Y., Gao L., Pan Y., Tian M., Li Y., He C., et al. (2020). Chromosome-level reference genome of the jellyfish Rhopilema esculentum. GigaScience 9, giaa036. doi: 10.1093/gigascience/giaa036
Li D., Yu J., Du Z., Xu W., Wang G., Zhao S., et al. (2024). Advances in the application of stereo vision in aquaculture with emphasis on fish: A review. Rev. Aquac. 16, 1718–1740. doi: 10.1111/raq.12919
Liu B., Jia R., Han C., Huang B., and Lei J. L. (2016). Effects of stocking density on antioxidant status, metabolism and immune response in juvenile turbot (Scophthalmus maximus). Comp. Biochem. Physiol. C Toxicol. Pharmacol. 190, 1–8. doi: 10.1016/j.cbpc.2016.07.007
Lucas C. H., Graham W. M., and Widmer C. (2012). Jellyfish life histories: role of polyps in forming and maintaining scyphomedusa populations. Adv. Mar. Biol. 63, 133–196. doi: 10.1016/B978-0-12-394282-1.00003-X
Melica V., Invernizzi S., and Caristi G. (2014). Logistic density-dependent growth of an Aurelia aurita polyps population. Ecol. Model. 291, 1–5. doi: 10.1016/j.ecolmodel.2014.07.009
Ramírez-Coronel F. J., Rodríguez-Elías O. M., Esquer-Miranda E., Pérez-Patricio M., Pérez-Báez A. J., and Hinojosa-Palafox E. A. (2024). Non-invasive fish biometrics for enhancing precision and understanding of aquaculture farming through statistical morphology analysis and machine learning. Animals 14, 1850. doi: 10.3390/ani14131850
Schäfer S., Gueroun S. K. M., Andrade C., and Canning-Clode J. (2021). Combined effects of temperature and salinity on polyps and ephyrae of aurelia solida (Cnidaria: scyphozoa). Diversity 13, 573. doi: 10.3390/d13110573
Serebrennikova M., Grafskaia E., Maltsev D., Ivanova K., Bashkirov P., Kornilov F., et al. (2024). TripIEP-CPP: Algorithm for predicting the properties of peptide sequences. Int. J. Mol. Sci. 25, 6869. doi: 10.3390/ijms25136869
Sun M., Chen F., Duan Y., and Sun J. (2022). Effects of temperature and salinity on podocyst recycling of the edible jellyfish rhopilema esculentum (Kishinouye 1891). Sustainability 14, 5202. doi: 10.3390/su14095202
Vijayalakshmi M. and Sasithradevi A. (2025). AquaYOLO: Advanced YOLO-based fish detection for optimized aquaculture pond monitoring. Sci. Rep. 15, 6151. doi: 10.1038/s41598-025-89611-y
Wang Z. Y., Shi Q. Y., Feng Y., Han J. J., Lu C. Y., Zhou J., et al. (2024). Targeted screening of an anti-inflammatory polypeptide from Rhopilema esculentum Kishinouye cnidoblasts and elucidation of its mechanism in alleviating ulcerative colitis based on an analysis of the gut microbiota and metabolites. Food Sci. Hum. Wellness 13, 1336–1347. doi: 10.26599/FSHW.2022.9250112
Xing Y., Liu Q., Zhang M., Zhen Y., Mi T., and Yu Z. (2019). Effects of temperature and salinity on the asexual reproduction of Aurelia coerulea polyps. J. Oceanol. Limnol. 38, 133–142. doi: 10.1007/s00343-019-8337-0
You K., Chi X. P., Ma C. H., Liu X. T., Mu Y. C., Han Z. Q., et al. (2012). Analysis on the development of Rhopilema esculentum industry in China. Chin. Fisheries Econ 30, 108–112. doi: 10.3969/j.issn.1009-590X.2012.05.017
You K., Ma C., Gao H., Li F., Zhang M., Qiu Y., et al. (2007). Research on the jellyfish (Rhopilema esculentum Kishinouye) and associated aquaculture techniques in China: current status. Aquac. Int. 15, 479–488. doi: 10.1007/s10499-007-9114-1
Keywords: Rhopilema esculentum, polyp density, image analysis, deep learning, precision aquaculture
Citation: Chen F, Duan Y, Zhang Y, Xian Y, Min Q and Sun M (2025) Image-based modelling of attachment density and morphometric size in Rhopilema esculentum polyps. Front. Mar. Sci. 12:1727109. doi: 10.3389/fmars.2025.1727109
Received: 17 October 2025; Accepted: 26 November 2025; Revised: 19 November 2025;
Published: 12 December 2025.
Edited by:
Kumbukani Mzengereza, Mzuzu University, MalawiReviewed by:
Xiangdong Bi, Tianjin Agricultural University, ChinaZhilu Fu, Guangxi Minzu University, China
Copyright © 2025 Chen, Duan, Zhang, Xian, Min and Sun. This is an open-access article distributed under the terms of the Creative Commons Attribution License (CC BY). The use, distribution or reproduction in other forums is permitted, provided the original author(s) and the copyright owner(s) are credited and that the original publication in this journal is cited, in accordance with accepted academic practice. No use, distribution or reproduction is permitted which does not comply with these terms.
*Correspondence: Ming Sun, c3VubWluZzA0MDhAMTYzLmNvbQ==