 Deane F. Mosher
 Emily M. Wilkerson3
- 1Department of Biomolecular Chemistry, University of Wisconsin, Madison, WI, United States
- 2Department of Medicine, University of Wisconsin, Madison, WI, United States
- 3Department of Chemistry, University of Wisconsin, Madison, WI, United States
We recently identified and quantified >7,000 proteins in non-activated human peripheral blood eosinophils using liquid chromatography coupled to tandem mass spectrometry (LC–MS/MS) and described phosphoproteomic changes that accompany acute activation of eosinophils by interleukin-5 (IL5) (1). These data comprise a treasure trove of information about eosinophils. We illustrate the power of label-free LC–MS/MS quantification by considering four examples: complexity of eosinophil STATs, contribution of immunoproteasome subunits to eosinophil proteasomes, complement of integrin subunits, and contribution of platelet proteins originating from platelet–eosinophil complexes to the overall proteome. We describe how isobaric labeling enables robust sample-to-sample comparisons and relate the 220 phosphosites that changed significantly upon treatment with IL5 to previous studies of eosinophil activation. Finally, we review previous attempts to leverage the power of mass spectrometry to discern differences between eosinophils of healthy subjects and those with eosinophil-associated conditions and point out features of label-free quantification and isobaric labeling that are important in planning future mass spectrometric studies.
Introduction
Eosinophils derive from precursors set aside early in hematopoietic differentiation (2) and are easily identified in a Giemsa-stained blood smear by their abundant plump red granules and bilobed nucleus. Eosinophils have nuanced roles in normal physiology and responses to injury or pathogenic agents (3, 4), contributing to tissue homeostasis in the gut and adipose tissue and featuring prominently in inflammation associated with allergic diseases, malignancies, viral and helminthic infections, and orderly tissue repair (4–8). Eosinophils have the potential to participate in the pathogenesis of disease by diverse mechanisms, including release of a unique set of granule components, secretion of cytokines, and elaboration of mediators (3, 4). The need for better understanding of eosinophils in the context of eosinophil-associated diseases was highlighted in the report of a taskforce assembled by the National Institutes of Health (9).
Eosinophils were not among the >200 tissues, cell lines, and purified cell populations analyzed to assemble draft human proteomes published in 2014 (10, 11). We recently reported two high-resolution mass spectrometric investigations of human peripheral blood eosinophils: (1) identification and quantification of the proteins of non-activated eosinophils and (2) description of phosphoproteomic changes that accompany acute activation by interleukin-5 (IL5) (1). These data represent important information about eosinophils. An explicit goal of this review is to facilitate access to and increase the usefulness of the data presented in supplementary spreadsheets of our paper.
Quantitative Analysis of the Eosinophil Proteome
The workhorse of modern global proteomics is reversed-phase liquid chromatographic (LC) separation of proteolytically generated peptides coupled to online nano-electrospray ionization of the effluent and identification of peptide mass/charge (m/z) and sequence by tandem mass spectrometry (MS/MS) (12). Peptide cations detected in the MS1 scan are subjected to dissociation and subsequent MS2 scan, yielding an ion series that can indicate amino acid sequence and the presence of posttranslational modification. The resulting spectra are compared with peptides generated in silico to determine which of the ~2 × 10⁴ encoded human proteins and many more proteoforms (13) arising from differential mRNA splicing are present in the sample based on peptide spectral matches. To increase the probability of identification of any given peptide, peptides can be fractionated by a preliminary LC separation after which each fraction is analyzed in a separate liquid chromatography coupled to tandem mass spectrometry (LC–MS/MS) run. This paradigm routinely identifies thousands of proteins and proteoforms from biological samples (10–12). Estimates of relative abundance of identified proteins, called label-free quantification (LFQ), can be made by intensity-based absolute quantification (iBAQ), which sums signal intensities of all identified peptides for a given protein and divides by the number of theoretically observable peptides based on the in silico digest (14). The technology has been improving continuously to increase proteome coverage, speed of analysis, and quality of data with the goal of increasing applicability to biological experimentation and clinical samples. For instance, our group is able to quantify nearly 90% of the estimated 4,500 proteins in the yeast proteome in ~1 h of analysis (12, 15).
We assembled a map of the proteome of 75 × 106 non-activated peripheral blood eosinophils pooled from three different human volunteer donors with allergic rhinitis or asthma (1). Heparinized blood, 200 mL, was obtained from each, granulocytes were isolated by centrifugation in a Percoll gradient, and eosinophils were isolated from the granulocyte fraction by negative selection with magnetic beads bearing antibodies to CD3, CD14, CD16, and glycophorin-A (16, 17). Cells were lysed via probe sonication in a urea buffer, and proteins were digested with trypsin. Phosphopeptides were enriched by immobilized metal affinity chromatography (IMAC). Non-enriched and enriched samples were separated by high pH reversed-phase chromatography into 30 and 20 fractions, respectively, and fractions were analyzed by LC–MS/MS on an Orbitrap Fusion. The UniProt human proteins-plus-proteoforms database as of April 4, 2014, was queried using MaxQuant with the Andromeda search engine that included the iBAQ algorithm (14, 18, 19), yielding iBAQ intensities that can be translated into absolute molar abundances by assuming direct proportionality.
We identified 7,086 proteins based on 100,892 different tryptic peptides (1). Estimates of cellular abundance correlated well with the intensities of the protein spots seen in the two-dimensional gels of an earlier published proteomic study (20), with actin being the most abundant protein in both. The 15 most abundant proteins accounted for 25% of protein molecules. These include the granule proteins RNASE2 (eosinophil-derived neurotoxin), RNASE3 (eosinophil cationic protein), C-terminal remnant of PRG2 (major basic protein 1), C-terminal remnant of PRG3 (major basic protein 2), and CLC (Charcot-Leyden crystal protein, galectin 10); proteins associated with actin cytoskeleton (ACTB, PFN1, and CFL1); and histones. The abundances (molecules per eosinophil) of RNASE2 (1.8 × 10⁸), RNASE3 (2.5 × 10⁸), PRG2 (6.4 × 10⁸), and eosinophil peroxidase (1.7 × 10⁸) previously had been quantified by radioimmunoassay (21), thus allowing calculations of the absolute abundances of other proteins. The iBAQ intensities in Sheet 1 of the paper’s supporting XLSL file entitled “Summary of proteins identified in global analysis… ordered from most to least abundant” ranged from 1.3 × 10¹¹ for ACTB (cytoplasmic actin) to 3.1 × 10³ for KIAA1211 (1). The ratios of the iBAQ intensities to cellular abundances of the four granule proteins average 360, and division by this number can be used to convert iBAQ score to molecules per cell. We also localized 4,802 sites of phosphorylation as described in the paper’s supporting XLSL file entitled “Summary of phosphosites identified in global analysis…” (1).
Selected entries from the “global analysis” file have been pasted into Sheet 1 of the XLSX in the supplement of this review. A single entry may describe a single protein or a group that may consist of proteins of the same or nearly identical sequence encoded by separate genes, as for several of the histones; different proteoforms encoded by a single gene; or a single proteoform. In addition, frequently peptides will be matched to several entries in a protein database rather than to a single group (22). Each entry, therefore, contains information about rank in abundance; UniProt ID(s) of all proteins and majority proteins in the group; protein names(s); gene name(s); number of proteins in the group; number of peptides matching the group; number of peptides defined as “razor,” i.e., specific for the protein group, and “unique,” i.e., specific for a given proteoform within the group; % sequence covered by the identified peptides; molecular weight and sequence length of the longest proteoform within the group; posterior error probability of misidentification of the protein group; sum of peptide ion intensities; and iBAQ intensity score.
To drill down and exploit this information, one needs to consult UniProt1 and, because UniProt is uneven in its annotation of possible proteoforms, one may need also to consult the literature and transcriptomic and genomic databases and perhaps to perform directed experiments. We illustrate such issues with the entries on eosinophil STATs in Sheet 1. STAT2, STAT5A, STAT5B, and STAT6 are encoded by separate genes, and each has a single entry. The entries for STAT2, STAT5A, and STAT6 describe groups of two or three proteoforms differentially spliced at or near the N-terminus that cannot be distinguished by the available proteomic data. STAT5A and STAT5B share sequence similarity such that of the identified peptides, 23 are assigned to both, 13 are unique to STAT5B, and 11 are unique to STAT5A. STAT1 and STAT3 each have two entries that describe differentially spliced proteoforms originating from single genes. For STAT1, the dominant proteoform was canonical 750-residue STAT1α, and the minor proteoform was 712-residue STAT1β with a truncated C-terminus due to a frameshift introduced by splicing. The analysis identified four peptides unique for STAT1α and one unique for STAT1β. The dominant proteoform of STAT3 was 770 residues in length, and the minor proteoform was 769 residues; these each have a single unique peptide in which Ser701 is present (S) or absent (ΔS). STAT3, such as STAT1, is subjected to splicing that generates α and β proteoforms, as was first observed at the transcript level in eosinophils (23). However, our analysis did not identify a peptide spectral match unique for STAT3β. The splicing events responsible for inclusion (S) or exclusion (ΔS) of the codon for Ser701 and the α or β variants are close to one another, such that we were able to use quantitative PCR to demonstrate the presence and proportions of the four possible STAT3 transcripts, S-α, ΔS-α, S-β, and ΔS-β, in eosinophils (24). In accord with the iBAQ data, ΔS-encoding transcripts were in the minority. We note that even if a tryptic peptide defining the β variants had been detected, we would not have known whether the peptide was derived from the S or ΔS variant or a mixture. Examination of the amino acid sequences of the four splice variants, however, indicates that such information likely could be obtained by substituting AspN protease for trypsin. AspN should generate four different peptides that span the sequences determined by the two splicing events.
The iBAQ intensities in Sheet 1 inform thinking about the complexity inherent in signaling by different eosinophil STATs. The intensities and hence abundances of STAT1, STAT3, and STAT5B are similar, with approximately 600,000 copies of each protein per eosinophil based on comparisons to the iBAQ intensities of the four granular proteins. STAT6 and STAT2 were present at approximately 70 and 12% the abundances of the three major STATs but at greater abundance than STAT5A. The complete “global analysis” file (1) allows comparisons of the abundances of numerous other classes of eosinophil proteins that have similar and perhaps overlapping functions, such as the tyrosine kinases that activate STATs.
The other entries in Sheet 1 concern proteasome subunit beta-type (PSMB) subunits of the 20S proteasome and illustrate the power of quantitative proteomics in dealing with complexes with known structure and stoichiometry. Such complexes account for a considerable fraction of the proteome (25) and are described on the CORUM website.2 The PSMB5, PSMB6, and PSMB7 subunits of the constitutive 20S proteasome are replaced by the PSMB8, PSMB9, and PSMB10 subunits of immunoproteasomes in T-cells and monocytes (11). The switch involves the three catalytic proteasome subunits and results in preferential generation of peptides with a hydrophobic C-terminus that can be processed to fit in the groove of MHC class I molecules (26). The ratios of iBAQ intensities of PSMB8/PSMB5, PSMB9/PSMB6, and PSMB10/PSMB7 for eosinophils are 18, 3.7, and 2.1, respectively, comparable to the values of 31, 2.9, and 2.1 reported for monocytes in ProteomicsDB3 [an easily navigated repository of human proteomics data (10)]. The comparable enrichment in immunoproteasome subunits in monocytes and eosinophils bears on the issue of whether eosinophils are important antigen-presenting cells (27).
Figure 1 illustrates a second example of insights to be gained from quantitative proteomics. Shown are our data and recently published transcriptomic RNA-Seq data (28) for the eight α-integrin (ITGA) and four β-integrin (ITGB) subunits detected in eosinophils. Lines connect the nine αβ dimers (29) that are possible between these subunits, and iBAQ intensities and mRNA abundance as RPKM (reads per kilobase per million mapped reads) are given (Figure 1). Several features are noteworthy. First, the iBAQ intensities are compatible with the proposed pairing of dimers. Second, the iBAQ intensities in general correlate with mRNA abundance. Third, protein and mRNA are missing for ITGAD, which is inconsistent with the prevailing view that there is a pool of αDβ2 that can be mobilized acutely to the eosinophil surface (29, 30). Fourth, the ITGA2B and ITGB3 subunits of αIIbβ3, the major integrin of platelets, are abundant as proteins but not as mRNA.
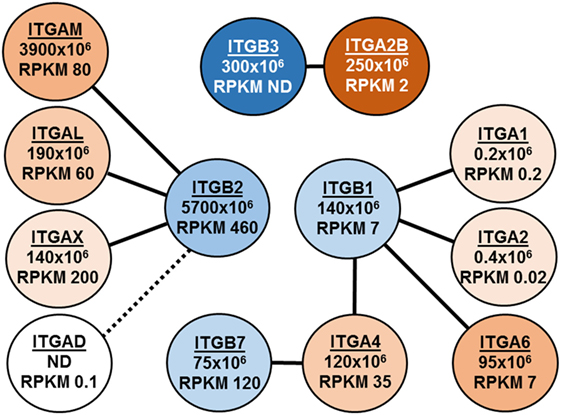
Figure 1. Depiction of integrin expression in eosinophils as assessed by intensity-based absolute quantification (iBAQ) intensities and RNA-Seq. Lines connect the nine αβ dimers that are possible between these subunits, and iBAQ intensities and mRNA abundance as RPKM (reads per kilobase per million mapped reads) are given.
Issue of Contaminating Platelets
Platelets, which adhere to a fraction of circulating eosinophils (31, 32), carry an idiosyncratic mix of RNAs (33). To investigate whether the higher-than-expected abundance of ITGA2B and ITGB3 as proteins but not as transcripts was due to contamination by platelets, we purified eosinophils by negative selection with antibody to ITGB3 in addition to the standard antibody “cocktail” described above. We then compared the proteomes of purified platelets, eosinophils purified by the standard method, and eosinophils purified with the extra depletion with anti-ITGB3 (1). ITGA2B and ITGB3, along with several platelet granule specific proteins, were outliers in a plot of ratios of standard eosinophils versus depleted eosinophils on one axis and platelets versus depleted eosinophils on the other. These data, which are compiled in our paper’s supporting XLSL file entitled “Summary of LFQ of eosinophil, platelets, and platelet-depleted eosinophils…” (1) can serve as a guide to assess platelet contamination in future proteomic studies of eosinophils.
Phosphoproteome of Unstimulated and IL5-Stimulated Eosinophils
We used 10-plexed isobaric labeling to identify phosphorylation sites that change in eosinophils acutely activated with IL5. The advantage of isobaric labeling over LFQ is that if a phosphopeptide is identified, its relative abundance in relation to the same peptide in other samples can be estimated (34). Half of 20 × 106 cells collected from each of five donors remained non-stimulated, and half were incubated for 5 min with IL5, 20 ng/mL. Incubations were stopped by plunging the tubes into liquid nitrogen. The 5-min stimulation induces maximal polarization and activation of MAPK1/3, STAT1, and STAT5 (17). When all 10 samples had been collected, cell pellets were thawed, cells were lysed, trypsin was added, and peptides from each sample were labeled separately with one of a 10-chemical set of tandem mass tags. Each of the 10 tags had the same mass, allowing the same peptides from multiple samples to be observed during the MS1 scan as a single m/z peak and isolated together for fragmentation. Each tag, however, had a unique distribution of heavy isotopes such that each tag yields a unique reporter ion upon fragmentation, and thus the relative amounts of the peptide in different samples can be determined based on relative intensities of the reporter ions in the MS2 scan. Peptides were enriched for phosphorylated peptides using IMAC before LC–MS/MS, and both unenriched and enriched peptides were analyzed. The Open Mass Spectrometry Search Algorithm (OMSSA) search algorithm was used along with our in-house software suite Coon OMSSA Proteomic Analysis Software Suite (COMPASS) (35, 36). Phosphorylation localization was performed with the Phospho RS 3.0 algorithm implemented into COMPASS. Statistical significance was determined using a two-tailed and equal variance t-test, n = 5.
Results from the isobaric labeling study were tabulated in Data Sheet in Supplementary Material entitled “Summary of proteins and phosphosites quantified in comparative analysis of unstimulated and acutely activated eosinophils” (1). The numbers of identified proteins (4,446) and phosphosites (1,819) were less than in the label-free analysis described above. The comparison of five individuals afforded the opportunity to assess individual-to-individual variation in protein abundances. The major differences were in HLA proteins. As would be expected given the short time of stimulation, only 16 proteins (0.3%) changed significantly (p < 0.001) between the resting and activated states. In contrast, 220 phosphorylation sites (12.1%) in 171 proteins changed significantly (p < 0.001) upon activation, 173 increasing and 47 decreasing (Table 1). Motif-X (37, 38) identified recurrent increased phosphorylation of Ser or Thr in motifs that are targets for MAPK or CAMIIK kinases.
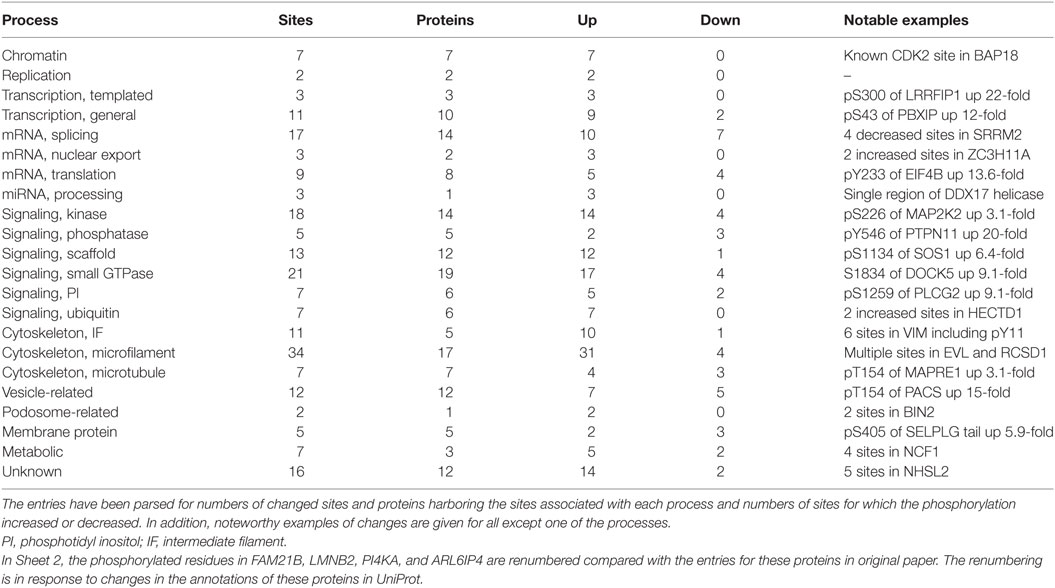
Table 1. Summary of phosphorylation changes described in Sheet 2 of the Supplementary XLSX.
The top 18 most upregulated sites (8- to 25-fold increase) included phosphorylation of Tyr546 of tyrosine-protein phosphatase non-receptor type 11 (PTPN11, also known as SHP2) and Ser5 of plastin-2 (LCP1) both known to be critical early activation events in eosinophils (39, 40); Ser1259 of phospholipase C-γ2 (PLCG2); and Ser320 of p47PHOX (NCF1), which controls activation of the respiratory burst oxidase (41). Sheet 2 lists all 220 sites with information about gene name, residue modified, fold change, p-value for the change, iBAQ intensity of the protein in the “global analysis” XLSX of our paper (1), name of protein, assignment of the protein to a single pathway or function, and implications of the phosphorylation. The last two determinations were made after inspection of information on the protein organized in UniProt and PhosphoSite.4 Significant changes were found in proteins that varied in abundance by as much as 22,000-fold. Only 13 of the significantly changed sites are unknown, i.e., not presently described in PhosphoSite. The proteins were assigned to 22 different processes (Table 1), and a notable example of a changed site is given for all except one category. The significance of the changed phosphorylation site varies from obvious to obscure. For instance, the increased phosphorylation of S226 of MAP2K2, the dual specificity kinase that activates MAPK1/3 (ERK2/1), involves one of the serines in the activation loop targeted for O-acetylation by Yersinia YopJ, a modification that inactivates MAP2K2 (42). In contrast, the four sites of decreased phosphorylation in SRRM2, a highly repetitive nuclear matrix protein involved in mRNA splicing, constitute a miniscule subset of the >280 sites listed in PhosphoSite as being phosphorylated in SRRM2. Changes in proteins associated with cytoskeleton were the most common but accounted for <25% of changed sites. Overall, the data are perhaps best interpreted as a snapshot at 5 min of a cell that is activated by IL5 to undergo simultaneous shape change, oxidative burst, new gene transcription, new mRNA processing and translation, and extensive shuttling of components among membrane compartments.
Prospects for the Future
We have identified and quantified 7,086 proteins associated with non-activated peripheral blood eosinophils and demonstrated significant changes in 220 phosphosites in response to IL5 (1). For comparison, 10,225 proteins have been identified in HeLa cells (43), 7,952 in human embryonic stem cells (36), and ~4,200 in human platelets (44). Can the analyses of eosinophils be improved, what are the relative advantages of LFQ versus multiplexed isobaric labeling, and can such analyses lead to a better understanding of eosinophils in the context of eosinophil-associated diseases?
Our global data constitute a “version 1.0” of the eosinophil proteome that surely merits a “version 2.0.” More comprehensive coverage is important for finding peptides that define presently poorly characterized proteins and proteoforms such as ΔS and β variants of STAT3 described above and enabling one to exploit ongoing refinement of the human proteins-plus-proteoforms databases against which peptide sequence matches are made. Analyses of peptides generated by proteases other than trypsin such as chymotrypsin, LysN, LysC, AspN, and GluC can greatly increase % coverage of the sequences of identified proteins as well as increasing the number of identified proteins (12, 45). Such deep coverage requires preliminary fractionation of peptides and multiple LC–MS/MS analyses of the fractions. About 108 purified eosinophils are needed, necessitating pooling of eosinophils from multiple donors inasmuch as only 2.5 × 10⁷ eosinophils will be purified from 200 mL of blood from a donor with a high normal eosinophil count of 250/μL if the yield is 50%. Our experience indicates that the analysis should be done on eosinophils purified by negative selection with antibody to ITGB3 in addition to antibodies to CD3, CD14, CD16, and glycophorin-A. We emphasize that no analysis will be ideal. The negative selections cannot remove other cell types completely, and the deeper one goes into the proteome the greater the chance of finding proteins from contaminating components of blood. In addition, workflows that avoid membrane-disrupting detergents, as ours does, may miss multipass membrane proteins with short loops and tails.
Prior proteomic studies have described alterations in amounts of eosinophil proteins in subjects with atopic dermatitis and eosinophilia (46), mildly elevated eosinophil counts associated with seasonal birch pollen allergy (47), and eosinophilia associated with Fasciola hepatica infection (48). In these studies, eosinophil proteins from affected individuals or healthy controls were separated by two-dimensional electrophoresis to produce high-resolution maps of protein-stained spots. The maps were compared by image analysis programs plus manual input, spots that stained differentially were identified, proteins in these spots were subjected to in-gel trypsinization, and tryptic peptides were identified by matrix-assisted laser desorption/ionization time-of-flight (MALDI-TOF) mass spectrometry. The numbers of proteins identified were considerably less than the number of spots subjected to trypsinization and MALDI-TOF because the same protein often was identified in multiple spots, presumably because of multiple proteoforms as described above or posttranslational modifications. One only has to examine the 2-dimensional maps upon which the quantification is based to realize the enormous amount of careful work that went into the studies. Nevertheless, the protein changes reported were not consistent, and the papers fail to identify a set of eosinophil proteins associated with increased eosinophil counts. The most complete study employing 2-D electrophoresis and MALDI-TOF identified 426 unique eosinophil proteins (20) as compared with the >7,000 and >4,400 that we identified in our LFQ and multiplexed isobaric labeling studies, respectively (1). With its vastly deeper coverage, ability to distinguish proteoforms and pinpoint post-translational modifications, standardized workflows, and intensity-based readouts that are amenable to facile statistical analyses, LC–MS/MS combined with LFQ or multiplexed isobaric labeling offers powerful and complementary approaches to the question of whether certain proteins in blood eosinophils are altered or predict therapeutic outcomes in patients with eosinophil-associated diseases.
The MaxLFQ algorithm, which is part of MaxQuant software suite, allows comparisons of protein abundance in different samples even though peptides from each sample are analyzed separately and the mix of quantifiable peptides from a given protein may vary from sample to sample (49). A recent study of individual variations in the 1,000 most abundant blood plasma proteins is an excellent example of the utility of LFQ (50). With 20 × 106 eosinophils that can be purified routinely from individual subjects, it should be possible to perform LFQ of the ~5,000 eosinophil proteins that account for >99% of cellular molar abundance (1). One advantage of LFQ is the ability to analyze samples upon collection and, should data have clinical significance, communicate results within a clinically useful turnaround time. Multiplexed isobaric labeling would work well for comparisons of well-defined sets of subjects, such as those with mild versus severe asthma, for which samples could be archived over time and analyzed in batch. As above, the outstanding advantage of isobaric labeling is that the same peptide from all individuals will be detected and allow determination of the relative abundances of the peptide in the different individuals based on ion intensities in the reporter region (34). Being able to compare abundance of a given peptide in all individuals would be especially important in analyses of changes in specific phosphosites. The method suffers from contamination of the reporter region by reporter ions derived from co-isolated contaminating ions with resultant compression of ratios of reporter ion intensities (34). This problem, however, would lead to underestimation rather than overestimation of differences (51, 52). Once biomarkers are identified by either LFQ or isobaric labeling, it should be possible to devise a focused proteomic screen that employs multiple reactions monitoring for selected peptides with a set of these peptides labeled with heavy atoms serving as internal standards in an absolute quantification strategy (53, 54).
Planners of disease-oriented studies face the decision of whether to analyze eosinophils purified by the standard method, purified eosinophils also depleted of eosinophils to which platelets are adherent, or both types of purified eosinophils. Because platelets may modify eosinophil activity (31, 32), we favor not depleting eosinophils of eosinophil–platelet complexes, thereby not removing what may be the most interesting population of blood eosinophils. Abundances of proteins known to be specific for platelets can be used to estimate the contribution of platelets to observed proteomic differences.
A recent time course study using two-dimensional electrophoresis combined with MALDI-TOF to identify spots that stained differentially with a phosphoprotein-specific dye, ProQ Diamond, demonstrated that IL5-family cytokines increased phosphorylation of >20 eosinophil proteins in a pattern that was different from the effects of eotaxin or other agonists (55). Sites of phosphorylation were not determined. Multiplexed isobaric labeling should be a powerful method for pinpointing residues attacked by kinases or phosphatases upon eosinophil activation with different agonists and learning the effects of inhibitors and therapeutic agents on these phosphorylation events. We studied IL5 effects at only a single time point (1). Recently, 4,797 phosphosites were profiled temporally in an isobaric labeling study of platelets responding to ADP (56). The 1,819 phosphosites detected and quantified in our IL5 study are several-fold lower than in the platelet study. We believe that the latter number is achievable with eosinophils such that isobaric labeling studies can lead to a full “systems biology” understanding of the molecular events that underlie eosinophil activation in response to multiple agonists and how these events can be perturbed therapeutically.
Author Contributions
All authors listed have made a substantial, direct, and intellectual contribution to the work and approved it for publication.
Conflict of Interest Statement
The authors declare that the research was conducted in the absence of any commercial or financial relationships that could be construed as a potential conflict of interest.
Funding
The authors have been supported by National Institutes of Health grants P01 HL088594 (Nizar Jarjour, PI) and R01 AI125390 (DM and JC, co-PIs). EW received training support from T32 HL007899.
Supplementary Material
The Supplementary Material for this article can be found online at http://journal.frontiersin.org/article/10.3389/fmed.2017.00159/full#supplementary-material.
Footnotes
References
1. Wilkerson EM, Johansson MW, Hebert AS, Westphall MS, Mathur SK, Jarjour NN, et al. The peripheral blood eosinophil proteome. J Proteome Res (2016) 15(5):1524–33. doi:10.1021/acs.jproteome.6b00006
2. Bouffi C, Kartashov AV, Schollaert KL, Chen X, Bacon WC, Weirauch MT, et al. Transcription factor repertoire of homeostatic eosinophilopoiesis. J Immunol (2015) 195(6):2683–95. doi:10.4049/jimmunol.1500510
3. Rothenberg ME, Hogan SP. The eosinophil. Annu Rev Immunol (2006) 24:147–74. doi:10.1146/annurev.immunol.24.021605.090720
4. Rosenberg HF, Dyer KD, Foster PS. Eosinophils: changing perspectives in health and disease. Nat Rev Immunol (2013) 13(1):9–22. doi:10.1038/nri3341
5. Goh YP, Henderson NC, Heredia JE, Red Eagle A, Odegaard JI, Lehwald N, et al. Eosinophils secrete IL-4 to facilitate liver regeneration. Proc Natl Acad Sci U S A (2013) 110(24):9914–9. doi:10.1073/pnas.1304046110
6. Heredia JE, Mukundan L, Chen FM, Mueller AA, Deo RC, Locksley RM, et al. Type 2 innate signals stimulate fibro/adipogenic progenitors to facilitate muscle regeneration. Cell (2013) 153(2):376–88. doi:10.1016/j.cell.2013.02.053
7. Davis D, Rothenberg M. Eosinophils and cancer. Cancer Immunol Res (2014) 2(1):1–8. doi:10.1158/2326-6066.CIR-13-0196
8. Wu D, Molofsky AB, Liang HE, Ricardo-Gonzalez RR, Jouihan HA, Bando JK, et al. Eosinophils sustain adipose alternatively activated macrophages associated with glucose homeostasis. Science (2011) 332(6026):243–7. doi:10.1126/science.1201475
9. Bochner BS, Book W, Busse WW, Butterfield J, Furuta GT, Gleich GJ, et al. Workshop report from the national institutes of health taskforce on the research needs of eosinophil-associated diseases (TREAD). J Allergy Clin Immunol (2012) 130(3):587–96. doi:10.1016/j.jaci.2012.07.024
10. Wilhelm M, Schlegl J, Hahne H, Gholami AM, Lieberenz M, Savitski MM, et al. Mass-spectrometry-based draft of the human proteome. Nature (2014) 509(7502):582–7. doi:10.1038/nature13319
11. Kim MS, Pinto SM, Getnet D, Nirujogi RS, Manda SS, Chaerkady R, et al. A draft map of the human proteome. Nature (2014) 509(7502):575–81. doi:10.1038/nature13302
12. Richards AL, Merrill AE, Coon JJ. Proteome sequencing goes deep. Curr Opin Chem Biol (2015) 24:11–7. doi:10.1016/j.cbpa.2014.10.017
13. Smith LM, Kelleher NL. Proteoform: a single term describing protein complexity. Nat Methods (2013) 10(3):186–7. doi:10.1038/nmeth.2369
14. Schwanhausser B, Busse D, Li N, Dittmar G, Schuchhardt J, Wolf J, et al. Global quantification of mammalian gene expression control. Nature (2011) 473(7347):337–42. doi:10.1038/nature10098
15. Hebert AS, Richards AL, Bailey DJ, Ulbrich A, Coughlin EE, Westphall MS, et al. The one hour yeast proteome. Mol Cell Proteomics (2013) 13(1):339–47. doi:10.1074/mcp.M113.034769
16. Johansson MW, Annis DS, Mosher DF. Alpha(M)beta(2) integrin-mediated adhesion and motility of IL-5-stimulated eosinophils on periostin. Am J Respir Cell Mol Biol (2013) 48(4):503–10. doi:10.1165/rcmb.2012-0150OC
17. Han ST, Mosher DF. IL-5 induces suspended eosinophils to undergo unique global reorganization associated with priming. Am J Respir Cell Mol Biol (2014) 50(3):654–64. doi:10.1165/rcmb.2013-0181OC
18. Cox J, Mann M. MaxQuant enables high peptide identification rates, individualized p.p.b.-range mass accuracies and proteome-wide protein quantification. Nat Biotechnol (2008) 26(12):1367–72. doi:10.1038/nbt.1511
19. Cox J, Neuhauser N, Michalski A, Scheltema RA, Olsen JV, Mann M. Andromeda: a peptide search engine integrated into the MaxQuant environment. J Proteome Res (2011) 10(4):1794–805. doi:10.1021/pr101065j
20. Straub C, Pazdrak K, Young TW, Stafford SJ, Wu Z, Wiktorowicz JE, et al. Toward the proteome of the human peripheral blood eosinophil. Proteomics Clin Appl (2009) 3(10):1151–73. doi:10.1002/prca.200900043
21. Abu-Ghazaleh RI, Dunnette SL, Loegering DA, Checkel JL, Kita H, Thomas LL, et al. Eosinophil granule proteins in peripheral blood granulocytes. J Leukoc Biol (1992) 52(6):611–8.
22. Cappadona S, Baker PR, Cutillas PR, Heck AJ, van Breukelen B. Current challenges in software solutions for mass spectrometry-based quantitative proteomics. Amino Acids (2012) 43(3):1087–108. doi:10.1007/s00726-012-1289-8
23. Caldenhoven E, van Dijk TB, Solari R, Armstrong J, Raaijmakers JA, Lammers JW, et al. STAT3beta, a splice variant of transcription factor STAT3, is a dominant negative regulator of transcription. J Biol Chem (1996) 271(22):13221–7. doi:10.1074/jbc.271.22.13221
24. Turton KB, Annis DS, Rui L, Esnault S, Mosher DF. Ratios of four STAT3 splice variants in human eosinophils and diffuse large B cell lymphoma cells. PLoS One (2015) 10(5):e0127243. doi:10.1371/journal.pone.0127243
25. Ruepp A, Waegele B, Lechner M, Brauner B, Dunger-Kaltenbach I, Fobo G, et al. CORUM: the comprehensive resource of mammalian protein complexes – 2009. Nucleic Acids Res (2010) 38(Database issue):D497–501. doi:10.1093/nar/gkp914
26. Ferrington DA, Gregerson DS. Immunoproteasomes: structure, function, and antigen presentation. Prog Mol Biol Transl Sci (2012) 109:75–112. doi:10.1016/B978-0-12-397863-9.00003-1
27. Farhan RK, Vickers MA, Ghaemmaghami AM, Hall AM, Barker RN, Walsh GM. Effective antigen presentation to helper T cells by human eosinophils. Immunology (2016) 149(4):413–22. doi:10.1111/imm.12658
28. Shen ZJ, Hu J, Esnault S, Dozmorov I, Malter JS. RNA Seq profiling reveals a novel expression pattern of TGF-beta target genes in human blood eosinophils. Immunol Lett (2015) 167(1):1–10. doi:10.1016/j.imlet.2015.06.012
29. Barthel SR, Johansson MW, McNamee DM, Mosher DF. Roles of integrin activation in eosinophil function and the eosinophilic inflammation of asthma. J Leukoc Biol (2008) 83(1):1–12. doi:10.1189/jlb.0607344
30. Grayson MH, Van der Vieren M, Sterbinsky SA, Gallatin WM, Hoffman PA, Staunton DE, et al. αdβ2 Integrin is expressed on human eosinophils and functions as an alternative ligand for vascular cell adhesion molecule 1 (VCAM-1). J Exp Med (1998) 188(11):2187–91. doi:10.1084/jem.188.11.2187
31. Johansson MW, Mosher DF. Activation of beta(1) integrins on blood eosinophils by P-selectin. Am J Respir Cell Mol Biol (2011) 45(4):889–97. doi:10.1165/rcmb.2010-0402OC
32. Page C, Pitchford S. Platelets and allergic inflammation. Clin Exp Allergy (2014) 44(7):901–13. doi:10.1111/cea.12322
33. Schubert S, Weyrich AS, Rowley JW. A tour through the transcriptional landscape of platelets. Blood (2014) 124(4):493–502. doi:10.1182/blood-2014-04-512756
34. Riley NM, Coon JJ. Phosphoproteomics in the age of rapid and deep proteome profiling. Anal Chem (2016) 88(1):74–94. doi:10.1021/acs.analchem.5b04123
35. Wenger CD, Phanstiel DH, Lee MV, Bailey DJ, Coon JJ. COMPASS: a suite of pre- and post-search proteomics software tools for OMSSA. Proteomics (2011) 11(6):1064–74. doi:10.1002/pmic.201000616
36. Phanstiel DH, Brumbaugh J, Wenger CD, Tian S, Probasco MD, Bailey DJ, et al. Proteomic and phosphoproteomic comparison of human ES and iPS cells. Nat Methods (2011) 8(10):821–7. doi:10.1038/nmeth.1699
37. Schwartz D, Gygi SP. An iterative statistical approach to the identification of protein phosphorylation motifs from large-scale data sets. Nat Biotechnol (2005) 23(11):1391–8. doi:10.1038/nbt1146
38. Chou MF, Schwartz D. Biological sequence motif discovery using motif-x. Curr Protoc Bioinformatics (2011) 13:13.15–24. doi:10.1002/0471250953.bi1315s35
39. Pazdrak K, Adachi T, Alam R. Src homology 2 protein tyrosine phosphatase (SHPTP2)/Src homology 2 phosphatase 2 (SHP2) tyrosine phosphatase is a positive regulator of the interleukin 5 receptor signal transduction pathways leading to the prolongation of eosinophil survival. J Exp Med (1997) 186(4):561–8. doi:10.1084/jem.186.4.561
40. Pazdrak K, Young TW, Straub C, Stafford S, Kurosky A. Priming of eosinophils by GM-CSF is mediated by protein kinase CbetaII-phosphorylated L-plastin. J Immunol (2011) 186(11):6485–96. doi:10.4049/jimmunol.1001868
41. Quinn MT, Gauss KA. Structure and regulation of the neutrophil respiratory burst oxidase: comparison with nonphagocyte oxidases. J Leukoc Biol (2004) 76(4):760–81. doi:10.1189/jlb.0404216
42. Mittal R, Peak-Chew SY, McMahon HT. Acetylation of MEK2 and I kappa B kinase (IKK) activation loop residues by YopJ inhibits signaling. Proc Natl Acad Sci U S A (2006) 103(49):18574–9. doi:10.1073/pnas.0608995103
43. Nagaraj N, Wisniewski JR, Geiger T, Cox J, Kircher M, Kelso J, et al. Deep proteome and transcriptome mapping of a human cancer cell line. Mol Syst Biol (2011) 7:548. doi:10.1038/msb.2011.81
44. Burkhart JM, Vaudel M, Gambaryan S, Radau S, Walter U, Martens L, et al. The first comprehensive and quantitative analysis of human platelet protein composition allows the comparative analysis of structural and functional pathways. Blood (2012) 120(15):e73–82. doi:10.1182/blood-2012-04-416594
45. Swaney DL, Wenger CD, Coon JJ. Value of using multiple proteases for large-scale mass spectrometry-based proteomics. J Proteome Res (2010) 9(3):1323–9. doi:10.1021/pr900863u
46. Yoon SW, Kim TY, Sung MH, Kim CJ, Poo H. Comparative proteomic analysis of peripheral blood eosinophils from healthy donors and atopic dermatitis patients with eosinophilia. Proteomics (2005) 5(7):1987–95. doi:10.1002/pmic.200401086
47. Woschnagg C, Forsberg J, Engstrom A, Odreman F, Venge P, Garcia RC. The human eosinophil proteome. Changes induced by birch pollen allergy. J Proteome Res (2009) 8(6):2720–32. doi:10.1021/pr800984e
48. Straub C, Burnham JP, White AC Jr, Pazdrak K, Sanchez C, Watanabe LC, et al. Altered eosinophil proteome in a patient with hypereosinophilia from acute fascioliasis. Clin Vaccine Immunol (2011) 18(11):1999–2002. doi:10.1128/CVI.05373-11
49. Cox J, Hein MY, Luber CA, Paron I, Nagaraj N, Mann M. Accurate proteome-wide label-free quantification by delayed normalization and maximal peptide ratio extraction, termed MaxLFQ. Mol Cell Proteomics (2014) 13(9):2513–26. doi:10.1074/mcp.M113.031591
50. Geyer PE, Kulak NA, Pichler G, Holdt LM, Teupser D, Mann M. Plasma proteome profiling to assess human health and disease. Cell Syst (2016) 2(3):185–95. doi:10.1016/j.cels.2016.02.015
51. Ting L, Rad R, Gygi SP, Haas W. MS3 eliminates ratio distortion in isobaric multiplexed quantitative proteomics. Nat Methods (2011) 8(11):937–40. doi:10.1038/nmeth.1714
52. McAlister GC, Nusinow DP, Jedrychowski MP, Wuhr M, Huttlin EL, Erickson BK, et al. MultiNotch MS3 enables accurate, sensitive, and multiplexed detection of differential expression across cancer cell line proteomes. Anal Chem (2014) 86(14):7150–8. doi:10.1021/ac502040v
53. Kirkpatrick DS, Gerber SA, Gygi SP. The absolute quantification strategy: a general procedure for the quantification of proteins and post-translational modifications. Methods (2005) 35(3):265–73. doi:10.1016/j.ymeth.2004.08.018
54. Foster M, Morrison L, Todd J, Snyder L, Thompson J, Soderblom E, et al. Quantitative proteomics of bronchoalveolar lavage fluid in idiopathic pulmonary fibrosis. J Proteome Res (2015) 14:1238–49. doi:10.1021/pr501149m
55. Soman KV, Stafford SJ, Pazdrak K, Wu Z, Luo X, White WI, et al. Activation of human peripheral blood eosinophils by cytokines in a comparative time-course proteomic/phosphoproteomic study. J Proteome Res (2017) 16(8):2663–79. doi:10.1021/acs.jproteome.6b00367
Keywords: eosinophils, mass spectrometry-based proteomics, phosphorylation sites, interleukin-5, STAT3, integrins, immunoproteasome
Citation: Mosher DF, Wilkerson EM, Turton KB, Hebert AS and Coon JJ (2017) Proteomics of Eosinophil Activation. Front. Med. 4:159. doi: 10.3389/fmed.2017.00159
Received: 10 July 2017; Accepted: 13 September 2017;
Published: 29 September 2017
Edited by:
Florence Emmanuelle Roufosse, Free University of Brussels, BelgiumReviewed by:
Owen McCarty, Oregon Health & Science University, United StatesSteven J. Ackerman, University of Illinois at Chicago, United States
Copyright: © 2017 Mosher, Wilkerson, Turton, Hebert and Coon. This is an open-access article distributed under the terms of the Creative Commons Attribution License (CC BY). The use, distribution or reproduction in other forums is permitted, provided the original author(s) or licensor are credited and that the original publication in this journal is cited, in accordance with accepted academic practice. No use, distribution or reproduction is permitted which does not comply with these terms.
*Correspondence: Deane F. Mosher, ZGZtb3NoZXJAd2lzYy5lZHU=