 Nan Zhang
 Jiaxing Wang
 Biyue Chen
 Ying Li
 Bing Jiang
- 1Department of Ophthalmology of Second Xiangya Hospital, Central South University, Changsha, China
- 2Department of Ophthalmology, School of Medicine, Emory University, Atlanta, GA, United States
- 3Hunan Clinical Research Center of Ophthalmic Disease, Changsha, China
Purpose: This meta-analysis aims to investigate the worldwide prevalence of primary angle-closure glaucoma (PACG) and its risk factors in the last 20 years.
Methods: We conducted a systematic review and meta-analysis of 37 population-based studies and 144,354 subjects. PubMed, Embase, and Web of Science databases were searched for cross-sectional or cohort studies published in the last 20 years (2000–2020) that reported the prevalence of PACG. The prevalence of PACG was analyzed according to various risk factors. A random-effects model was used for the meta-analysis.
Results: The global pooled prevalence of PACG was 0.6% [95% confidence interval (CI) = 0.5–0.8%] for the last 20 years. The prevalence of PACG increases with age. Men are found less likely to have PACG than women (risk ratio = 0.71, 95% CI = 0.53–0.93, p < 0.01). Asia is found to have the highest prevalence of PACG (0.7%, 95% CI = 0.6–1.0%). The current estimated population with PACG is 17.14 million (95% CI = 14.28–22.85) for people older than 40 years old worldwide, with 12.30 million (95% CI = 10.54–17.57) in Asia. It is estimated that by 2050, the global population with PACG will be 26.26 million, with 18.47 million in Asia.
Conclusion: PACG affects more than 17 million people worldwide, especially leading a huge burden to Asia. The prevalence of PACG varies widely across different ages, sex, and population geographic variation. Asian, female sex, and age are risk factors of PACG.
Introduction
Glaucoma is one of the leading causes of irreversible blindness worldwide (1). It is defined as a group of optic neuropathies associated with characteristic structural changes at the optic nerve head that cause the death of retinal ganglion cells and their axons, leading to visual field loss and blindness (2, 3). In contrast to primary open-angle glaucoma, the most common type of glaucoma, primary angle-closure glaucoma (PACG), is associated with the closure of the anterior chamber angle of the eye and is known to have a greater propensity of bilateral blindness, which lead to a huge burden to families and the society (4, 5).
In 2013, the worldwide prevalence of PACG was reported to be 0.5% [95% confidence interval (CI) = 0.11–1.36%] (6). It was also estimated that the global population with PACG would be 23.36 million in 2020 and 32.04 million in 2040, in which Asia accounts for more than three-quarters of PACG population (6). PACG has been associated with many risk factors, including ethnicity, age, and sex (6–8), and they all contribute to the prevalence. Updates in study designs and diagnostic methods of PACG alter the estimations of prevalence and population, whereas the International Society for Geographical and Epidemiological Ophthalmology (ISGEO) provides a standard PACG definition for survey (9). Prevalence of PACG varies across different ethnicities and geographical regions (10). With the rapid increase in global population and aging trends, it is critical to pool PACG prevalence and estimate up-to-date and accurate PACG prevalence, providing evidence for a future health-care plan. Besides, there have been increasing surveys of PACG with a large number of participants in recent years across the world, especially in Asia and Africa. In this study, we aimed to estimate the detailed prevalence of PACG globally in a risk factor-specific manner for the last two decades.
Methods
The study was conducted following the Preferred Reporting Items for guidelines of Systemic Reviews and Meta-Analysis guidelines (11, 12).
Eligibility Criteria
Studies published between January 2000 to September 2020 were included in this meta-analysis when they met the following inclusion criteria: (1) Population-based cross-sectional or cohort studies in which the prevalence of PACG from a defined geographic region was provided; (2) Studies with a clear definition of random or clustered sampling procedure; (3) PACG defined by using ISGEO (9) criteria or similar to ISGEO that based on structure and/or functional evidence of glaucomatous optic neuropathy with occludable anterior chamber angle; (4) Studies that prevalence data for PACG can be extracted or calculated. Exclusion criteria included: (1) Self-reported diagnosis of glaucoma included; (2) Non-English articles; (3) Articles using repeated data from the author's previous publications.
Search Strategy
We conducted a systematic and comprehensive search in three electronic databases (PubMed, Embase, and Web of Science) from August to September 2020. A combination of keywords related to PACG (glaucoma, PACG, and primary angle-closure glaucoma) and epidemiology (prevalence, population, and survey) was used to identify all published papers, abstracts, and letters between January 2000 and September 2020. Besides, a hand search was used to identify target articles from the other reference list. The detailed search strategy of different databases was provided in Supplementary Table 1.
Data Extraction
Two reviewers (NZ and BC) conducted data extraction independently based on inclusion and exclusion criteria; disagreements received final consensus after several full discussions between reviewers. Full data extraction in the data extraction sheet was completed after reviewers independently identified cases from every targeted article and reached final agreement. The following data were extracted and reported for each study: first author, year of publication, sex, age, continent, country, habitation area (urban or rural), numbers of cases, sample size, prevalence with 95% CI, and response rate (Supplementary Table 2).
Statistical Analysis
Data are presented as prevalence (95%CIs). Forest plots were performed using the software R version 3.6.3 (R Foundation for Statistical Computing, Vienna, Austria) and the R package “meta” 13. We selected the prevalence of PACG as the main outcome. The relative risk ratios and 95% CIs of the results were compared. Heterogeneity between studies was assessed using the I2 statistic (13–16). Due to the high likelihood of heterogeneity among the selected studies, we used a random-effects model to evaluate pooled effects. Publication bias was calculated using the Funnel plots (17, 18), P-curve analysis (19), and Egger test (17) (p < 0.05 was considered as significant publication bias). Detailed bias for each study was described in Supplementary Tables 3, 4.
The p-value for prevalence difference among groups for age, sex, continent, habitation area, and decades was calculated using “metaprop” from R package “meta,” random-effects model. The p-value for prevalence difference among groups for sex was calculated using “metabin” from R package “meta,” random-effects model. A meta-regression test was performed for subgroup analysis, with the first category of each subgroup used as intercept. The statistical output includes a test of whether the intercept differs significantly from zero and whether other groups differ from the intercept. A value of p < 0.05 was considered statistically significant.
The number of people older than 40 years old with PACG was estimated by different continents. The population projection data were from the latest data of the World Population Prospects of the United Nations (20), which consisted of the latest results of national population consensus and demographic surveys from countries worldwide and also consider mortality rate and fertility rate in its projection of world population number. The estimated numbers of PACG population were calculated by multiplying the age- and region-specific prevalence from our random-effects model and the corresponding population number. Age- and region-specific prevalence were assumed to be consistent in the next 30 years' projection, as no significant difference has been found between the prevalence of last two decades by the random-effects model (Q = 0.22, df = 1, p = 0.64).
Risk of Bias Assessment
Articles included in the study were assessed for risk of bias using two domains of the Quality in Prognosis Studies tool (21) that are relevant to observational studies (study participation and outcome measurement) (22). Appraisal of each domain provides a subjective assessment of the risk of bias (ranked as low, moderate, or high). A summary of the areas considered in the assessment of each domain is included in Supplementary Tables 3, 4.
Results
Search Results
In this study, we reviewed the full text of 68 studies about PACG prevalence published in the last 20 years, and 31 were excluded based on inclusion and exclusion criteria. The screening process is detailed in Figure 1. A total of 37 publications (23–59) that include 144,354 subjects were recruited. The sample size of the study ranged from 790 (Bourne, 2003, Thailand) (27) to 15,122 (Chassis, 2018, Israel) (56). Detailed information is provided in forest plots given different risk factors and summarized in Supplementary Table 2, including author, year of publication, country, continent, age range, detailed number of cases and sample size, and response rate.
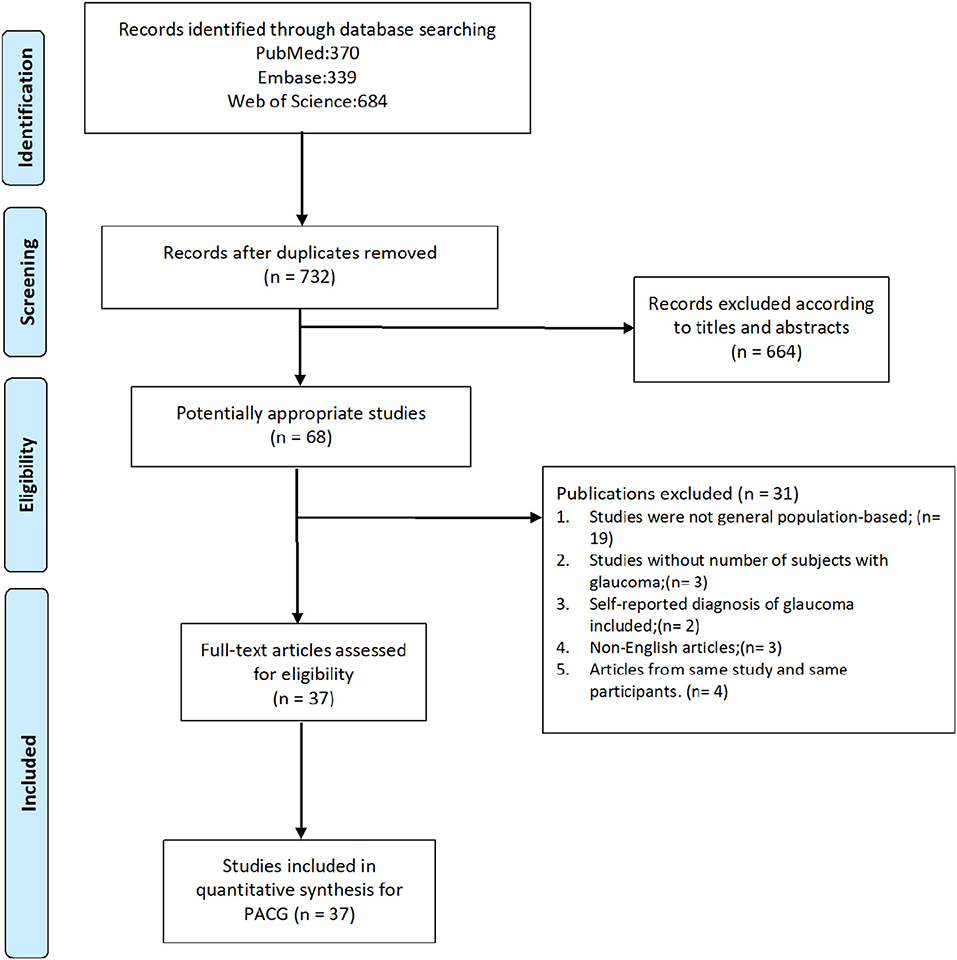
Figure 1. Flow charts of search process. PACG, primary angle-closure glaucoma.
Risk of Bias
A summary of the risk of bias of the included articles is provided in Supplementary Figures 1, 2; a justification of each rating is provided in Supplementary Tables 3, 4.
Egger test result revealed a significant publication bias (p < 0.01) in this meta-analysis. Funnel plots and P-curve analysis results are shown in Supplementary Figures 3, 4.
Meta-Analysis
The prevalence of PACG is provided in Table 1. The overall PACG pooled prevalence worldwide is 0.6% (95% CI = 0.5–0.8%) for the last 20 years (Figure 2).
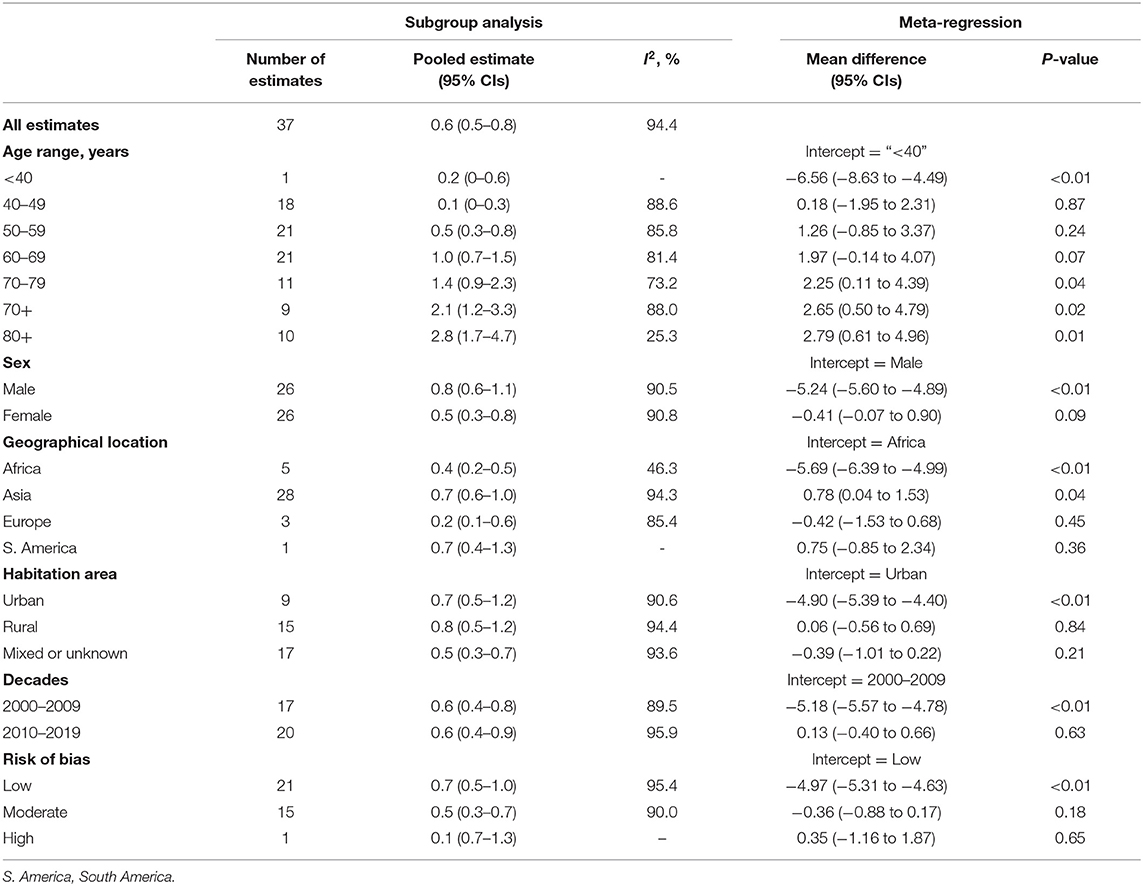
Table 1. Results of subgroup analyses and meta-regression analyses based on age, sex, geographical location, habitation area, decades, and risk of bias.
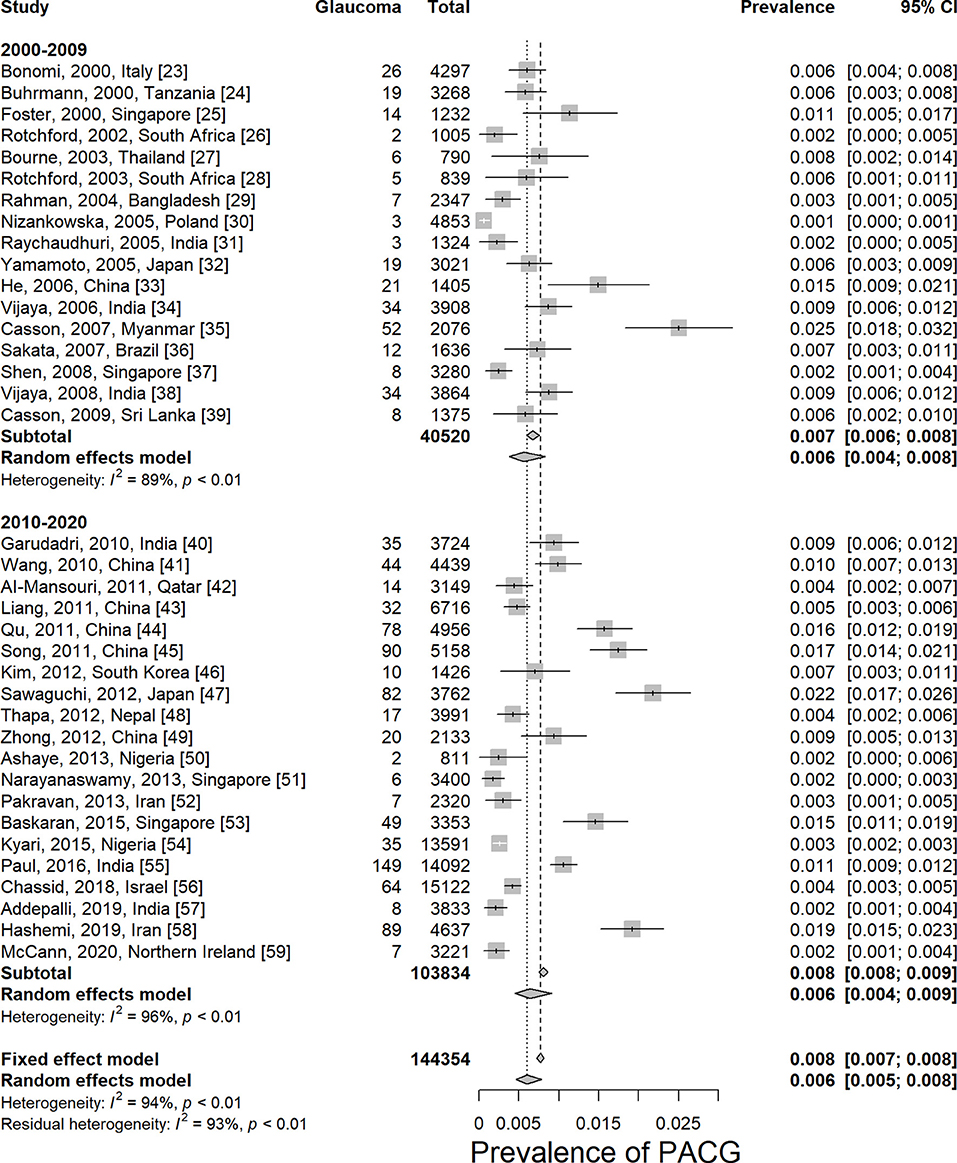
Figure 2. Prevalence of primary angle-closure glaucoma worldwide by decades. PACG, primary angle-closure glaucoma.
Twenty-six articles presented prevalence data by sex. Prevalence was higher for women in 69.2% of the studies (18 of 26). The male-to-female portions were ranged from 0.50 (Rotchford, 2003, South Africa) (28) to 1.09 (Paul, 2015, India) (55). Sex-specific prevalence of PACG is provided in Table 1; Supplementary Figure 5. This meta-analysis showed men are less likely to suffer from PACG than women with a relative risk of 0.71 (95% CI = 0.53–0.93, p < 0.01) in Figure 3. As summarized in Figure 4, the prevalence of PACG in the female sex is higher than the male sex in every age group. Subgroup differences test by random-effects model resulted in a significant difference between the prevalence of male and female groups (Q = 70.59, df = 25, p < 0.001).
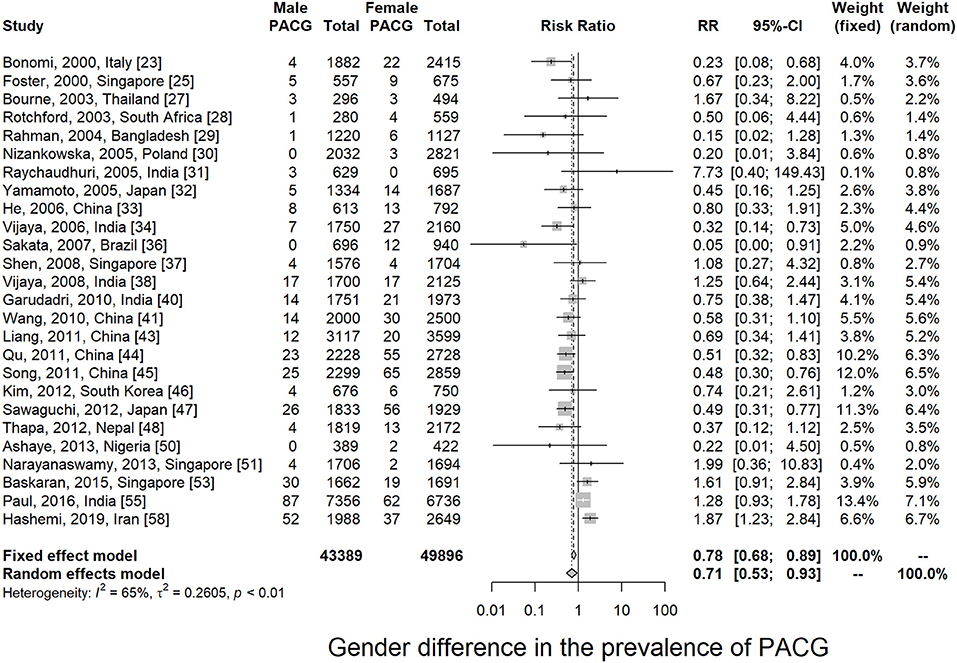
Figure 3. Sex comparison of primary angle-closure glaucoma. PACG, primary angle-closure glaucoma.
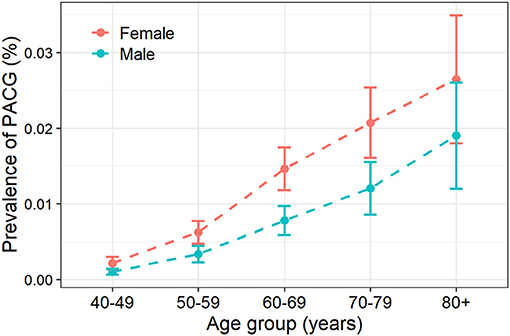
Figure 4. Prevalence of primary angle-closure glaucoma increased with aging. PACG, primary angle-closure glaucoma.
Twenty-one studies reported age-specific prevalence of PACG; the detailed prevalence for each age group is listed in Table 1. Prevalence of PACG increased with aging steadily (Figure 4; Supplementary Figure 6). People older than 80 years old have highest prevalence (2.8%, 95% CI = 1.7–4.7%, p < 0.01). People aged 40–49 years have the lowest prevalence compared with other age groups (0.1%, 95% CI = 0.1–0.3%, p < 0.01). Subgroup differences tested using the random-effects model revealed a statistically significant difference among different age groups (Q = 64.71, df = 6, p < 0.001).
Most of the surveys we included in this study were conducted in Asia (28 of 37). A survey from Oceania and North America was lacking. Among all continents, Asia is found to have the highest prevalence of PACG (0.7%, 95% CI = 0.6–1.0%). South America has the same prevalence as Asia (0.7%, 95% CI = 0.4–1.3%). Europe has the lowest PACG prevalence compared with others (0.2%, 95% CI = 0.1–0.6%). Detailed prevalence of each continent is provided in Table 1; Supplementary Figure 7. Subgroup differences tested using the random-effects model revealed a statistically significant difference among different continents (Q = 12.84, df = 3, p = 0.005).
In this meta-analysis, 9 studies were conducted in urban, 15 in rural, and 17 were unknown or mixed. The prevalence of urban or rural population is listed in Table 1; Supplementary Figure 8. No statistical difference has been found between rural and urban populations using the random-effects model (p = 0.2387, Q = 2.87, df = 2).
Risk Factors of Primary Angle-Closure Glaucoma
In this meta-analysis, we analyzed the prevalence of PACG according to various risk factors. Female sex (Q = 70.59, p < 0.001), Asian (Q = 12.84, p = 0.005), and aging (Q = 64.71, p < 0.001) are main risk factors of PACG.
Number of People With Primary Angle-Closure Glaucoma Worldwide in 2020
The estimated number of aged populations (older than 40 years old) with PACG worldwide in 2020 and the next few decades are provided in Table 2. The populations with PACG are estimated based on our results and estimated world population number from the United Nations (20). The global population of PACG is 17.14 million (95% CI = 14.28–22.85) for population older than 40 years old in 2020, 20.73 million (95% CI = 17.27–27.63) in 2030, 23.73 million (95% CI = 19.78–31.64) in 2040, and 26.26 million (95% CI = 21.88–35.01) in 2050. Asia has the highest population of PACG among all continents in 2020 (12.30 million, 95% CI = 10.54–17.57) and also in the next few decades, accounts for more than 70% of the PACG population worldwide.
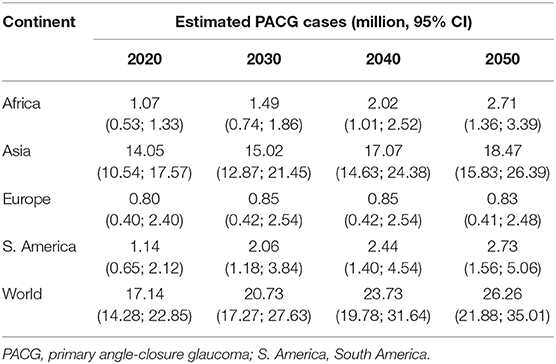
Table 2. Estimated global population of PACG.
Discussion
This study provided the most updated worldwide prevalence of PACG for the last 20 years. Based on our results, the overall pooled PACG prevalence worldwide is 0.6% (95% CI = 0.5–0.8%). Asia has the highest PACG prevalence among all continents (0.7%, 95% CI = 0.6–1.0%). We estimated that the population of PACG is 17.14 million (95% CI = 14.28–22.85) for people older than 40 years old in 2020 globally, of which Asia accounts for over 70%. Our estimated PACG prevalence is similar to Tham et al.'s study, which reported the pooled PACG prevalence is 0.50% (95% CI = 0.11–1.36%) (6). PACG is still a worldwide public health burden that requires improvement in diagnostic and therapeutic approaches, particularly in Asia. The risk factors for PACG, including age, sex, and ethnicity, were discussed in detail as follows.
Age
Age is known to be the major risk factor for all types of glaucoma, as the prevalence increase with age (7, 60, 61). This is confirmed in this meta-analysis. Aging per decade is consistently associated with higher intraocular pressure, thinner central corneal thickness, and higher mean ocular perfusion pressure (62). For PACG pathogenesis, multiple mechanisms contributed to angle closure, including pupillary block and plateau iris, resulting in increased intraocular pressure and neurodegeneration (63). Anatomical changes could explain the increase of morbidity, and narrow anterior chamber depth (ACD) increases the risk of PACG. ACD and anterior chamber area both significantly decreased with age (−0.0119 mm/year, −0.0845 mm2/year, p < 0.0001), which was caused by increment of iris cross-sectional area, iris curvature, and lens vault (64). Besides the lens becomes more compact and thicker with increasing age, proportionately large lens contributed to pupillary block and angle-crowding (65). Moreover, morphological studies have indicated that the outflow ability decreased with age and resulted in increased intraocular pressure, which was caused by the accumulation of extracellular materials in trabecular meshwork (66).
Sex
In this study, sex is found to be a significant risk factor for PACG; females are more likely to have PACG than males at all age groups (Figures 3, 4). Various studies had associated shallow anterior chamber and narrow chamber angle with female sex (67–69). Moreover, females were shown to have greater ACD shallowing with aging than males (70). The mean ACD values were significantly different from men [2.59 mm (2.56; 2.62)] to women [2.42 mm (2.39; 2.44)] in elderly Chinese (older than 50 years old) (71). Such anatomical differences could contribute to the sex difference in PACG. Other factors such as endocrinologic difference and menopausal status might also be involved in sex differences for the prevalence of PACG (72).
Ethnicity and Continent
In this meta-analysis, most of the included studies (28 of 37) were conducted in Asian countries. Although the majority of the ethnicity from Asian countries are from Asia, people from other countries such as the Europeans were of mixed ethnicity. Because most of the studies lack detailed prevalence data for each ethnicity, it is not possible to perform a meta-analysis for ethnicity based on such limited information. Hence, continent differences were analyzed instead.
As we mentioned earlier, the majority of the population from Asian countries are Asians. The results from the continent of Asia may represent the prevalence of PACG for Asians (0.7%, 95% CI = 0.6–1.0%, p < 0.01). It is previously reported that Asians have a higher prevalence of PACG (73, 74), consistent with findings from this meta-analysis (Table 1; Supplementary Figure 7). Chan et al. reported that the PACG prevalence in Asia was 0.73% (95% CI = 0.18–1.96%) in 2013, which is similar to our results (75). They also estimated that the population with PACG would be 13.43 million (95% CI = 4.01–31.79) in 2020 and 17.51 million (95% CI = 5.21–41.37) in 2040. Our estimated PACG prevalence of Asia is slightly lower than Tham et al. (1.09%, 95% CI = 0.43–2.32%) (6), which might be due to the newly included seven studies (51–53, 55–58) conducted after the year 2012, which accounted for more than half of the Asian participants (64,380 of 110,833) in this meta-analysis. Our study provides a more up-to-date PACG prevalence. Anatomical differences might be contributed to the high prevalence of PACG in Asians. A prospective study from the United States found that Chinese–American people had a significantly thick iris at 750 and 2,000 μm from the scleral spurs (76). Another reported that Chinese and Hispanic subjects had the highest mean value of iris thickness at 750 μm from the scleral spurs, lowest anterior chamber area, anterior chamber volume, and anterior chamber width compared with Whites and Africans (77). The prevalence of PACG also varies in different Asian regions. South-central Asia was considered to have the highest overall glaucoma and primary open-angle glaucoma burden than other regions, whereas East Asia has a higher PACG prevalence (75).
Habitation Area
Besides sex, age, and continents, habitation area (urban or rural) was also analyzed in this study (Supplementary Figure 8). No statistical difference was found in the prevalence of PACG between rural and urban populations. However, this part of the analysis represents substantial bias for the following reasons: (1) The information habitation area is usually vaguely described in the majority of the studies; (2) There are only a few studies that have included both urban and rural populations in the study, and therefore, the comparison between urban and rural across studies represent ethnicity and country bias. The only study that has reported the prevalence of PACG for both habitation areas is Paul et al.'s study of the Indian population in 2016 (55). They showed that the prevalence of PACG is slightly higher in the rural (1.15%) than urban area (0.97%). However, because our meta-analysis represents bias for the reasons mentioned earlier, more evidence is needed to reveal the role of the habitation area in the risk of PACG in future studies.
Bias and Heterogeneity
The risk of bias in this meta-analysis was from the following three major aspects: the selection of participants, response rate, and diagnostic criteria for the outcome measurement (Supplementary Table 3). The overall risk of bias for this study is low because low-quality studies were excluded, as mentioned in the method. In this meta-analysis, the overall heterogeneity is high (I2 = 94.4%). Commonly, a meta-analysis for prevalence studies yields very high heterogeneities, usually more than 90% of the I2 value (22, 78–81). The impact of study quality on pooled prevalence was assessed by excluding low-quality studies and by conducting a meta-regression, comparing studies at low risk of bias with those at moderate-to-high risk. Meta-regression demonstrated little evidence of risk of bias, giving a consistent level of prevalence. It is noted that in this meta-analysis, the heterogeneity dropped dramatically in people with the age of 80+ years (I2 = 25.3%) and among studies from Africa (I2 = 46.3%, Table 1), indicating that the risk factors of age and geographical location are possibly the main sources of the heterogeneity.
Limitations
The major limitation of this study is that the number of studies conducted in the last 20 years varies a lot across continents, and therefore, the overall prevalence for some continents represents selection bias. There is only one study for South America (36) and three studies for Europe (23, 30, 59). The data from North America and Oceania lack in this meta-analysis.
Conclusion
In this meta-analysis, we reviewed 37 studies of 144,354 subjects for the prevalence of PACG in the last 20 years. Up to date, PACG is still a worldwide vision-threatening disease with high prevalence (0.6%, 95% CI = 0.5–0.8%), which is affecting about 17.14 million aged people in the world, especially in Asia (12.30 million). Asian, female sex, and aging are considered to be risk factors of PACG. Early screening in people with high risks is needed in early intervention of PACG, particularly in Asian countries.
Data Availability Statement
The original contributions presented in the study are included in the article/Supplementary Material, further inquiries can be directed to the corresponding author/s.
Author Contributions
NZ, JW, and BJ: research design. NZ, JW, and BC: data acquisition, research execution, and data analysis. NZ, JW, BC, YL, and BJ: manuscript preparation. All authors: contributed to the article and approved the submitted version.
Funding
Supported by grants from the National Science Foundation of China (82070967 and 81770930 to BJ), Natural Science Foundation of Hunan Province Grant (2020jj4788 to BJ). The sponsor or funding organization had no role in the design or conduct of this research.
Conflict of Interest
The authors declare that the research was conducted in the absence of any commercial or financial relationships that could be construed as a potential conflict of interest.
Supplementary Material
The Supplementary Material for this article can be found online at: https://www.frontiersin.org/articles/10.3389/fmed.2020.624179/full#supplementary-material
References
1. Jonas JB, Aung T, Bourne RR, Bron AM, Ritch R, Panda-Jonas S. Glaucoma. Lancet. (2017) 390:2183–93. doi: 10.1016/S0140-6736(17)31469-1
3. Almasieh M, Levin LA. Neuroprotection in glaucoma: animal models and clinical trials. Annu Rev Vis Sci. (2017) 3:91–120. doi: 10.1146/annurev-vision-102016-061422
4. Foster PJ. The epidemiology of primary angle closure and associated glaucomatous optic neuropathy. Semin Ophthalmol. (2002) 17:50–8. doi: 10.1076/soph.17.2.50.14718
5. Ang LP, Ang LP. Current understanding of the treatment and outcome of acute primary angle-closure glaucoma: an Asian perspective. Ann Acad Med Singap. (2008) 37:210–5.
6. Tham YC, Li X, Wong TY, Quigley HA, Aung T, Cheng CY. Global prevalence of glaucoma and projections of glaucoma burden through 2040: a systematic review and meta-analysis. Ophthalmology. (2014) 121:2081–90. doi: 10.1016/j.ophtha.2014.05.013
7. Unterlauft JD, Bohm MRR. Role of the aging visual system in glaucoma. Ophthalmologe. (2017) 114:108–13. doi: 10.1007/s00347-016-0430-6
8. Zetterberg M. Age-related eye disease and gender. Maturitas. (2016) 83:19–26. doi: 10.1016/j.maturitas.2015.10.005
9. Foster PJ, Buhrmann R, Quigley HA, Johnson GJ. The definition and classification of glaucoma in prevalence surveys. Br J Ophthalmol. (2002) 86:238–42. doi: 10.1136/bjo.86.2.238
10. Cedrone C, Mancino R, Cerulli A, Cesareo M, Nucci C. Epidemiology of primary glaucoma: prevalence, incidence, and blinding effects. Prog Brain Res. (2008) 173:3–14. doi: 10.1016/S0079-6123(08)01101-1
11. Moher D, Shamseer L, Clarke M, Ghersi D, Liberati A, Petticrew M, et al. Preferred reporting items for systematic review and meta-analysis protocols (PRISMA-P) 2015 statement. Syst Rev. (2015) 4:1. doi: 10.1186/2046-4053-4-1
12. Shamseer L, Moher D, Clarke M, Ghersi D, Liberati A, Petticrew M, et al. Preferred reporting items for systematic review and meta-analysis protocols (PRISMA-P) 2015: elaboration and explanation. BMJ. (2015) 350:g7647. doi: 10.1136/bmj.g7647
13. Ma Q, Su J, Li Y, Wang J, Long W, Luo M, et al. The chance of permanent cure for micro- and macroprolactinomas, medication or surgery? A systematic review and meta-analysis. Front Endocrinol. (2018) 9:636. doi: 10.3389/fendo.2018.00636
14. Zhang S, Wang J, Li Y, Liu Y, He L, Xia X. The role of primary intraocular lens implantation in the risk of secondary glaucoma following congenital cataract surgery: a systematic review and meta-analysis. PLoS ONE. (2019) 14:e0214684. doi: 10.1371/journal.pone.0214684
15. Zhang X, Wang J, Li Y, Jiang B. Diagnostic test accuracy of spot and plusoptix photoscreeners in detecting amblyogenic risk factors in children: a systemic review and meta-analysis. Ophthalmic Physiol Opt. (2019) 39:260–71. doi: 10.1111/opo.12628
16. Li Y, Wang J, Chen Z, Tang X. Effect of hydrophobic acrylic versus hydrophilic acrylic intraocular lens on posterior capsule opacification: meta-analysis. PLoS ONE. (2013) 8:e77864. doi: 10.1371/journal.pone.0077864
17. Egger M, Davey Smith G, Schneider M, Minder C. Bias in meta-analysis detected by a simple, graphical test. BMJ. (1997) 315:629–34. doi: 10.1136/bmj.315.7109.629
18. Sterne JA, Sutton AJ, Ioannidis JP, Terrin N, Jones DR, Lau J, et al. Recommendations for examining and interpreting funnel plot asymmetry in meta-analyses of randomised controlled trials. BMJ. (2011) 343:d4002. doi: 10.1136/bmj.d4002
19. Head ML, Holman L, Lanfear R, Kahn AT, Jennions MD. The extent and consequences of p-hacking in science. PLoS Biol. (2015) 13:e1002106. doi: 10.1371/journal.pbio.1002106
20. United Nations Population Division Population Estimates Projections Section World Population Prospects: The 2019 Revision [database online]. (2019) Available online at: http://esaunorg/wpp/
21. Hayden JA, van der Windt DA, Cartwright JL, Cote P, Bombardier C. Assessing bias in studies of prognostic factors. Ann Intern Med. (2013) 158:280–6. doi: 10.7326/0003-4819-158-4-201302190-00009
22. Mansfield KE, Sim J, Jordan JL, Jordan KP. A systematic review and meta-analysis of the prevalence of chronic widespread pain in the general population. Pain. (2016) 157:55–64. doi: 10.1097/j.pain.0000000000000314
23. Bonomi L, Marchini G, Marraffa M, Bernardi P, De Franco I, Perfetti S, et al. Epidemiology of angle-closure glaucoma: prevalence, clinical types, and association with peripheral anterior chamber depth in the Egna-Neumarket Glaucoma Study. Ophthalmology. (2000) 107:998–1003. doi: 10.1016/S0161-6420(00)00022-1
24. Buhrmann RR, Quigley HA, Barron Y, West SK, Oliva MS, Mmbaga BB. Prevalence of glaucoma in a rural East African population. Invest Ophthalmol Vis Sci. (2000) 41:40–8.
25. Foster PJ, Oen FT, Machin D, Ng TP, Devereux JG, Johnson GJ, et al. The prevalence of glaucoma in Chinese residents of Singapore: a cross-sectional population survey of the Tanjong Pagar district. Arch Ophthalmol. (2000) 118:1105–11. doi: 10.1001/archopht.118.8.1105
26. Rotchford AP, Johnson GJ. Glaucoma in Zulus: a population-based cross-sectional survey in a rural district in South Africa. Arch Ophthalmol. (2002) 120:471–8. doi: 10.1001/archopht.120.4.471
27. Bourne RR, Sukudom P, Foster PJ, Tantisevi V, Jitapunkul S, Lee PS, et al. Prevalence of glaucoma in Thailand: a population based survey in Rom Klao District, Bangkok. Br J Ophthalmol. (2003) 87:1069–74. doi: 10.1136/bjo.87.9.1069
28. Rotchford AP, Kirwan JF, Muller MA, Johnson GJ, Roux P. Temba glaucoma study: a population-based cross-sectional survey in urban South Africa. Ophthalmology. (2003) 110:376–82. doi: 10.1016/S0161-6420(02)01568-3
29. Rahman MM, Rahman N, Foster PJ, Haque Z, Zaman AU, Dineen B, et al. The prevalence of glaucoma in Bangladesh: a population based survey in Dhaka division. Br J Ophthalmol. (2004) 88:1493–7. doi: 10.1136/bjo.2004.043612
30. Nizankowska MH, Kaczmarek R. Prevalence of glaucoma in the wroclaw population. The wroclaw epidemiological study. Ophthalmic Epidemiol. (2005) 12:363–71. doi: 10.1080/09286580500212904
31. Raychaudhuri A, Lahiri SK, Bandyopadhyay M, Foster PJ, Reeves BC, Johnson GJ. A population based survey of the prevalence and types of glaucoma in rural West Bengal: the West Bengal Glaucoma Study. Br J Ophthalmol. (2005) 89:1559–64. doi: 10.1136/bjo.2005.074948
32. Yamamoto T, Iwase A, Araie M, Suzuki Y, Abe H, Shirato S, et al. The Tajimi Study report 2: prevalence of primary angle closure and secondary glaucoma in a Japanese population. Ophthalmology. (2005) 112:1661–9. doi: 10.1016/j.ophtha.2005.05.012
33. He M, Foster PJ, Ge J, Huang W, Zheng Y, Friedman DS, et al. Prevalence and clinical characteristics of glaucoma in adult Chinese: a population-based study in Liwan District, Guangzhou. Invest Ophthalmol Vis Sci. (2006) 47:2782–8. doi: 10.1167/iovs.06-0051
34. Vijaya L, George R, Arvind H, Baskaran M, Paul PG, Ramesh SV, et al. Prevalence of angle-closure disease in a rural southern Indian population. Arch Ophthalmol. (2006) 124:403–9. doi: 10.1001/archopht.124.3.403
35. Casson RJ, Newland HS, Muecke J, McGovern S, Abraham L, Shein WK, et al. Prevalence of glaucoma in rural Myanmar: the Meiktila Eye Study. Br J Ophthalmol. (2007) 91:710–4. doi: 10.1136/bjo.2006.107573
36. Sakata K, Sakata LM, Sakata VM, Santini C, Hopker LM, Bernardes R, et al. Prevalence of glaucoma in a South brazilian population: projeto glaucoma. Invest Ophthalmol Vis Sci. (2007) 48:4974–9. doi: 10.1167/iovs.07-0342
37. Shen SY, Wong TY, Foster PJ, Loo JL, Rosman M, Loon SC, et al. The prevalence and types of glaucoma in malay people: the Singapore Malay eye study. Invest Ophthalmol Vis Sci. (2008) 49:3846–51. doi: 10.1167/iovs.08-1759
38. Vijaya L, George R, Arvind H, Baskaran M, Ve Ramesh S, Raju P, et al. Prevalence of primary angle-closure disease in an urban south Indian population and comparison with a rural population. The Chennai Glaucoma Study. Ophthalmology. (2008) 115:655–60 e651. doi: 10.1016/j.ophtha.2007.05.034
39. Casson RJ, Baker M, Edussuriya K, Senaratne T, Selva D, Sennanayake S. Prevalence and determinants of angle closure in central Sri Lanka: the Kandy eye study. Ophthalmology. (2009) 116:1444–9. doi: 10.1016/j.ophtha.2009.03.005
40. Garudadri C, Senthil S, Khanna RC, Sannapaneni K, Rao HB. Prevalence and risk factors for primary glaucomas in adult urban and rural populations in the Andhra Pradesh eye disease study. Ophthalmology. (2010) 117:1352–9. doi: 10.1016/j.ophtha.2009.11.006
41. Wang YX, Xu L, Yang H, Jonas JB. Prevalence of glaucoma in North China: the Beijing Eye Study. Am J Ophthalmol. (2010) 150:917–24. doi: 10.1016/j.ajo.2010.06.037
42. Al-Mansouri FA, Kanaan A, Gamra H, Khandekar R, Hashim SP, Al Qahtani O, et al. Prevalence and determinants of glaucoma in citizens of qatar aged 40 years or older: a community-based survey. Middle East Afr J Ophthalmol. (2011) 18:141–9. doi: 10.4103/0974-9233.80703
43. Liang Y, Friedman DS, Zhou Q, Yang XH, Sun LP, Guo L, et al. Prevalence and characteristics of primary angle-closure diseases in a rural adult Chinese population: the Handan Eye Study. Invest Ophthalmol Vis Sci. (2011) 52:8672–9. doi: 10.1167/iovs.11-7480
44. Qu W, Li Y, Song W, Zhou X, Kang Y, Yan L, et al. Prevalence and risk factors for angle-closure disease in a rural Northeast China population: a population-based survey in Bin County, Harbin. Acta Ophthalmol. (2011) 89:e515–20. doi: 10.1111/j.1755-3768.2011.02146.x
45. Song W, Shan L, Cheng F, Fan P, Zhang L, Qu W, et al. Prevalence of glaucoma in a rural northern china adult population: a population-based survey in kailu county, inner mongolia. Ophthalmology. (2011) 118:1982–8. doi: 10.1016/j.ophtha.2011.02.050
46. Kim YY, Lee JH, Ahn MD, Kim CY, Namil Study Group KGS. Angle closure in the Namil study in central South Korea. Arch Ophthalmol. (2012) 130:1177–83. doi: 10.1001/archophthalmol.2012.1470
47. Sawaguchi S, Sakai H, Iwase A, Yamamoto T, Abe H, Tomita G, et al. Prevalence of primary angle closure and primary angle-closure glaucoma in a southwestern rural population of Japan: the Kumejima Study. Ophthalmology. (2012) 119:1134–42. doi: 10.1016/j.ophtha.2011.12.038
48. Thapa SS, Paudyal I, Khanal S, Twyana SN, Paudyal G, Gurung R, et al. A population-based survey of the prevalence and types of glaucoma in Nepal: the Bhaktapur glaucoma study. Ophthalmology. (2012) 119:759–64. doi: 10.1016/j.ophtha.2011.10.021
49. Zhong H, Li J, Li C, Wei T, Cha X, Cai N, et al. The prevalence of glaucoma in adult rural Chinese populations of the Bai nationality in Dali: the Yunnan minority eye study. Invest Ophthalmol Vis Sci. (2012) 53:3221–5. doi: 10.1167/iovs.11-9306
50. Ashaye A, Ashaolu O, Komolafe O, Ajayi BG, Olawoye O, Olusanya B, et al. Prevalence and types of glaucoma among an indigenous African population in southwestern Nigeria. Invest Ophthalmol Vis Sci. (2013) 54:7410–6. doi: 10.1167/iovs.13-12698
51. Narayanaswamy A, Baskaran M, Zheng Y, Lavanya R, Wu R, Wong WL, et al. The prevalence and types of glaucoma in an urban Indian population: the Singapore Indian eye study. Invest Ophthalmol Vis Sci. (2013) 54:4621–7. doi: 10.1167/iovs.13-11950
52. Pakravan M, Yazdani S, Javadi MA, Amini H, Behroozi Z, Ziaei H, et al. A population-based survey of the prevalence and types of glaucoma in central Iran: the Yazd eye study. Ophthalmology. (2013) 120:1977–84. doi: 10.1016/j.ophtha.2013.02.029
53. Baskaran M, Foo RC, Cheng CY, Narayanaswamy AK, Zheng YF, Wu R, et al. The prevalence and types of glaucoma in an Urban Chinese population: the Singapore Chinese eye study. JAMA Ophthalmol. (2015) 133:874–80. doi: 10.1001/jamaophthalmol.2015.1110
54. Kyari F, Entekume G, Rabiu M, Spry P, Wormald R, Nolan W, et al. A population-based survey of the prevalence and types of glaucoma in Nigeria: results from the Nigeria National Blindness and Visual Impairment Survey. BMC Ophthalmol. (2015) 15:176. doi: 10.1186/s12886-015-0160-6
55. Paul C, Sengupta S, Choudhury S, Banerjee S, Sleath BL. Prevalence of glaucoma in Eastern India: the Hooghly River Glaucoma Study. Indian J Ophthalmol. (2016) 64:578–83. doi: 10.4103/0301-4738.191497
56. Chassid O, Epstein I, Sharabi-Nov A, Pikkel J. Prevalence of glaucoma in the Israeli Arab population. Int J Ophthalmol. (2018) 11:163–5. doi: 10.18240/ijo.2018.01.25
57. Addepalli UK, Jonnadula GB, Garudadri CS, Khanna RC, Papas EB. Prevalence of primary glaucoma as diagnosed by study optometrists of l. v. prasad eye institute - glaucoma epidemiology and molecular genetics study. Ophthalmic Epidemiol. (2019) 26:150–4. doi: 10.1080/09286586.2018.1551961
58. Hashemi H, Mohammadi M, Zandvakil N, Khabazkhoob M, Emamian MH, Shariati M, et al. Prevalence and risk factors of glaucoma in an adult population from Shahroud, Iran. J Curr Ophthalmol. (2019) 31:366–72. doi: 10.1016/j.joco.2018.05.003
59. McCann P, Hogg R, Wright DM, Pose-Bazarra S, Chakravarthy U, Peto T, et al. Glaucoma in the Northern Ireland Cohort for the Longitudinal Study of Ageing (NICOLA): cohort profile, prevalence, awareness and associations. Br J Ophthalmol. (2020) 104:1492–9. doi: 10.1136/bjophthalmol-2019-315330
60. Casson RJ, Marshall D, Newland HS, McGovern S, Muecke J, Tan EW, et al. Risk factors for early angle-closure disease in a Burmese population: the Meiktila Eye Study. Eye. (2009) 23:933–9. doi: 10.1038/eye.2008.102
61. Leske MC, Wu SY, Hennis A, Honkanen R, Nemesure B, Group BES. Risk factors for incident open-angle glaucoma: the Barbados Eye Studies. Ophthalmology. (2008) 115:85–93. doi: 10.1016/j.ophtha.2007.03.017
62. Coleman AL, Miglior S. Risk factors for glaucoma onset and progression. Surv Ophthalmol. (2008) 53(Suppl. 1):S3–10. doi: 10.1016/j.survophthal.2008.08.006
63. Sun X, Dai Y, Chen Y, Yu DY, Cringle SJ, Chen J, et al. Primary angle closure glaucoma: what we know and what we don't know. Prog Retin Eye Res. (2017) 57:26–45. doi: 10.1016/j.preteyeres.2016.12.003
64. Sun JH, Sung KR, Yun SC, Cheon MH, Tchah HW, Kim MJ, et al. Factors associated with anterior chamber narrowing with age: an optical coherence tomography study. Invest Ophthalmol Vis Sci. (2012) 53:2607–10. doi: 10.1167/iovs.11-9359
65. Tarongoy P, Ho CL, Walton DS. Angle-closure glaucoma: the role of the lens in the pathogenesis, prevention, and treatment. Surv Ophthalmol. (2009) 54:211–25. doi: 10.1016/j.survophthal.2008.12.002
66. Gabelt BT, Kaufman PL. Changes in aqueous humor dynamics with age and glaucoma. Prog Retin Eye Res. (2005) 24:612–37. doi: 10.1016/j.preteyeres.2004.10.003
67. Xu L, Cao WF, Wang YX, Chen CX, Jonas JB. Anterior chamber depth and chamber angle and their associations with ocular and general parameters: the Beijing Eye Study. Am J Ophthalmol. (2008) 145:929–36. doi: 10.1016/j.ajo.2008.01.004
68. Nongpiur ME, Sakata LM, Friedman DS, He M, Chan YH, Lavanya R, et al. Novel association of smaller anterior chamber width with angle closure in Singaporeans. Ophthalmology. (2010) 117:1967–73. doi: 10.1016/j.ophtha.2010.02.007
69. Congdon NG, Foster PJ, Wamsley S, Gutmark J, Nolan W, Seah SK, et al. Biometric gonioscopy and the effects of age, race, and sex on the anterior chamber angle. Br J Ophthalmol. (2002) 86:18–22. doi: 10.1136/bjo.86.1.18
70. Phu J, Tong J, Zangerl B, Le JL, Kalloniatis M. Cluster analysis reveals patterns of age-related change in anterior chamber depth for gender and ethnicity: clinical implications. Ophthalmic Physiol Opt. (2020) 40:632–49. doi: 10.1111/opo.12714
71. He M, Huang W, Zheng Y, Alsbirk PH, Foster PJ. Anterior chamber depth in elderly Chinese: the Liwan eye study. Ophthalmology. (2008) 115:1286–90:1290 e1281–1282. doi: 10.1016/j.ophtha.2007.12.003
72. Vajaranant TS, Grossardt BR, Maki PM, Pasquale LR, Sit AJ, Shuster LT, et al. Risk of glaucoma after early bilateral oophorectomy. Menopause. (2014) 21:391–8. doi: 10.1097/GME.0b013e31829fd081
73. Wright C, Tawfik MA, Waisbourd M, Katz LJ. Primary angle-closure glaucoma: an update. Acta Ophthalmol. (2016) 94:217–25. doi: 10.1111/aos.12784
74. Cheng JW, Zong Y, Zeng YY, Wei RL. The prevalence of primary angle closure glaucoma in adult Asians: a systematic review and meta-analysis. PLoS ONE. (2014) 9:e103222. doi: 10.1371/journal.pone.0103222
75. Chan EW, Li X, Tham YC, Liao J, Wong TY, Aung T, et al. Glaucoma in Asia: regional prevalence variations and future projections. Br J Ophthalmol. (2016) 100:78–85. doi: 10.1136/bjophthalmol-2014-306102
76. Lee RY, Huang G, Porco TC, Chen YC, He M, Lin SC. Differences in iris thickness among African Americans, Caucasian Americans, Hispanic Americans, Chinese Americans, and Filipino-Americans. J Glaucoma. (2013) 22:673–8. doi: 10.1097/IJG.0b013e318264ba68
77. Lee RY, Chon BH, Lin SC, He M, Lin SC. Association of ocular conditions with narrow angles in different ethnicities. Am J Ophthalmol. (2015) 160:506–15 e501. doi: 10.1016/j.ajo.2015.06.002
78. Assefa A, Bihon A. A systematic review and meta-analysis of prevalence of Escherichia coli in foods of animal origin in Ethiopia. Heliyon. (2018) 4:e00716. doi: 10.1016/j.heliyon.2018.e00716
79. Li R, Li W, Lun Z, Zhang H, Sun Z, Kanu JS, et al. Prevalence of metabolic syndrome in Mainland China: a meta-analysis of published studies. BMC Public Health. (2016) 16:296. doi: 10.1186/s12889-016-2870-y
80. Bacigalupo I, Mayer F, Lacorte E, Di Pucchio A, Marzolini F, Canevelli M, et al. A systematic review and meta-analysis on the prevalence of dementia in Europe: estimates from the highest-quality studies adopting the DSM IV Diagnostic Criteria. J Alzheimers Dis. (2018) 66:1471–81. doi: 10.3233/JAD-180416
81. Navarro P, Arias A, Arias-Gonzalez L, Laserna-Mendieta EJ, Ruiz-Ponce M, Lucendo AJ. Systematic review with meta-analysis: the growing incidence and prevalence of eosinophilic oesophagitis in children and adults in population-based studies. Aliment Pharmacol Ther. (2019) 49:1116–25. doi: 10.1111/apt.15231
Keywords: glaucoma, prevalence, PACG, risk factor, age, gender, Asia
Citation: Zhang N, Wang J, Chen B, Li Y and Jiang B (2021) Prevalence of Primary Angle Closure Glaucoma in the Last 20 Years: A Meta-Analysis and Systematic Review. Front. Med. 7:624179. doi: 10.3389/fmed.2020.624179
Received: 30 October 2020; Accepted: 30 November 2020;
Published: 18 January 2021.
Edited by:
Michele Lanza, University of Campania Luigi Vanvitelli, ItalyReviewed by:
Shengjie Li, Fudan University, ChinaDaniela Montorio, University of Naples Federico II, Italy
Ahmed Mousa, King Saud University, Saudi Arabia
Eray Atalay, Eskişehir Osmangazi University, Turkey
Copyright © 2021 Zhang, Wang, Chen, Li and Jiang. This is an open-access article distributed under the terms of the Creative Commons Attribution License (CC BY). The use, distribution or reproduction in other forums is permitted, provided the original author(s) and the copyright owner(s) are credited and that the original publication in this journal is cited, in accordance with accepted academic practice. No use, distribution or reproduction is permitted which does not comply with these terms.
*Correspondence: Bing Jiang, ZHJqaWFuZ2JAY3N1LmVkdS5jbg==
†These authors have contributed equally to this work