 Hanyi Lyu1,2,3,4,5
 Qiuying Chen1,2,3,4
 Guangyi Hu1,2,3,4
 Ya Shi1,2,3,4
 Luyao Ye1,2,3,4
 Yao Yin1,2,3,4Ying Fan1,2,3,4Haidong Zou1,2,3,4
 Jiangnan He1,2,3,4*Jianfeng Zhu1,2,3,4*
 Xun Xu1,2,3,4*
- 1Shanghai Eye Disease Prevention and Treatment Center, Shanghai Eye Hospital, Shanghai, China
- 2Shanghai General Hospital, Shanghai Jiaotong University School of Medicine, Shanghai, China
- 3Shanghai Jiaotong University School of Medicine, Shanghai, China
- 4Shanghai Engineering Center for Visual Science and Photo medicine, Shanghai Jiaotong University School of Medicine, Shanghai, China
- 5Ophthalmology Department of Peking University People's Hospital, Beijing, China
Purpose: To explore the characteristics and associated factors of fundus tessellation, especially the alternation of choroidal thickness among different degrees of tessellated fundus in young adults.
Design: Cross-sectional, population-based study.
Methods: A total of 796 students were included in the study and underwent comprehensive ophthalmic examinations, including anterior segment examinations and swept-source optical coherence tomography (OCT) measurements. The degree of tessellated fundus was assessed by fundus photographs applying an early treatment of diabetic retinopathy study grid to evaluate the location of fundus tessellation and then divided into five groups. The topographic variation and factors, tilted disc ratio, parapapillary atrophy (PPA), retinal thickness (ReT), choroidal thickness (ChT), and subfoveal scleral thickness (SST) related to tessellated fundus were analyzed.
Results: Compared to normal fundus, tessellated fundus had a lower spherical equivalent (SE) (p < 0.0001), worse best-corrected visual acuity (BCVA)(p = 0.043), longer axial length (AL) (p < 0.0001), thinner retina (p < 0.0001), thinner (p < 0.0001) choroid, and thinner sclera in center fovea (p = 0.0035). Among all subfields of macular and peripapillary regions, center fovea and macula-papillary region showed the most significant decrease in choroidal thickness. The proportion of fundus tessellation significantly increased with lower body weight index (BMI) (p = 0.0067), longer AL (p < 0.0001), larger PPA(p = 0.0058), thinner choroid (p < 0.0001), and thinner sclera (p < 0.0001).
Conclusions: Eyes showed more severe myopic morphological alternation with the increasement of proportion of fundus tessellation to the center fovea, including a significant decrease in both choroid and scleral thickness. Choroidal thinning may progress most rapidly in the macula-papillary region as fundus tessellation approaches to the center fovea.
Introduction
The high prevalence of myopia and high myopia in young adults worldwide, especially in East and Southeast Asia, has led to a significant public health burden of visual impairment and blindness (1–8). Recently, a revised classification system for myopic maculopathy has been proposed to standardize the definition among epidemiological studies (6, 9). According to this International Photographic Classification and Grading System for myopic maculopathy (META-PM) classification, as well as previous studies, tessellated fundus has been defined as the visualization of large choroidal vessels at the posterior fundus pole, which is the first stage of pathological myopia (PM) retinopathy (category 1) (6, 9, 10). Some tessellated fundus can progress to diffuse atrophy and macular atrophy, which cause severe and irreversible impairment of visual acuity, while others could be stable at this stage for long-term (9, 11). The underlying reasons for this discrepancy remain unknown.
Fundus photographs are common in clinical practice, and can be easily accessed for clinical observation. Factors associated with fundus tessellation in elderly population have been studied using fundus photographs (12, 13), however, age-based choroidal thinning and age-related retinopathy can be interference factors for examining fundus tessellation in pathological myopia (14–17).
To investigate the characteristics associated with fundus tessellation during early stage of pathological myopia, we recruited 828 university students of all grades in Shanghai University, of which 796 students were included as participants in this study. In this cross-sectional study, we measured optical parameters, including parameters of anterior segment, axial length (AL), peripapillary atrophy (PPA), retinal thickness (ReT), choroidal thickness (ChT) and subfoveal scleral thickness (SST), and analyzed their relationships with tessellated fundus diagnosis and severity.
Methods
Setting and Participants
This cross-sectional population-based study was approved by the ethics committee of Shanghai General Hospital, Shanghai Jiao Tong University, Shanghai, China, and followed the tenets of the Declaration of Helsinki. All participants understood the study protocol and provided signed informed consents. The study was registered at www.clinicaltrials.gov (No.NCT03446300).
The subjects were randomly selected from the students attending the Shanghai University in October 2016 (18). Age and gender were recorded and height, weight, heart rate, systolic (SBP) and diastolic (DBP) blood pressures were measured for each participant. A detailed medical history was recorded for each participant. All participants underwent comprehensive ophthalmic examinations, including refractive error assessment using an autorefractor machine (model KR-8900; Topcon, Tokyo, Japan), measurement of best-corrected visual acuity (BCVA) and intraocular pressure (IOP, Full Auto Tonometer TX-F; Topcon, Japan), slit-lamp biomicroscopy, and color fundus photograph. Central corneal thickness, lens thickness, anterior chamber depth (ACD) and AL were measured using optical low-coherence reflectometry (Aladdin; Topcon, Japan). Subjective refraction was performed by two trained optometrists for all participants. BMI is defined as the body mass divided by the square of the body height. Spherical equivalent (SE) was acquired in non-cycloplegic manner and was calculated as the sphere plus half a cylinder. BCVA was converted into the logarithm of minimal angle resolution (logMAR).
The inclusion criteria were as follows: IOP ≤ 21 mmHg; normal anterior chamber angles; normal optic nerve head (ONH) without glaucomatous changes, such as narrowing of neuroretina, increased cup-disc ratio and peripapillary hemorrhage. Participants with a history of ocular or systemic diseases including congenital cataract and glaucoma, hypertension and diabetes; previous intraocular or refractive surgery; and other evidence of retinopathy were excluded. Images acquired with signal strength index ≤60 were excluded for statistical analysis. In general, except for the fundus tessellation associated with myopia, the participants had no other ocular abnormalities. The analysis of correlation between two eyes of 30 randomly selected participants has showed that for parameters including SE, AL, PPA, SST, ChT, GCT, ReT, and the grading of fundus tessellation, correlation is significant at the 0.01 level. Only the right eye of each participant was selected for statistical analyses, for a significant correlation at 0.01 level of major parameters concerned in the study between the two eyes was detected in 30 randomly selected participants using spearman's analysis, including SE, AL, PPA, ReT, ChT, and SST.
Assessment of Fundus Tessellation, Tilted Disc (TD), and Parapapillary Atrophy Area (PPA)
The diagnostic and degree of fundus tessellation was assessed on the 45° fundus photographs centered on the macula. Retinal photographs centered on the macular and optic disc were acquired from the same SS-OCT, which was fitted with a digital, non-mydriatic retinal camera. The optic disc tilt and the PPA area were calculated from these photographs using Image J version 1.60 software (National Institutes of Health, MD, USA; http://rsb.info.nih.gov/ij/index.html) by two independent, blinded, well-trained observers (Z.H and Z.Z). Average data were used for the final analysis.
The macular area and the peripapillary area were separately analyzed using the macula photographs and the optic disc-centered photographs.
Fundus tessellations is defined by the ophthalmoscopic visualization of the large choroidal vessels. The degree of tessellated fundus was assessed by fundus photographs applying an early treatment of diabetic retinopathy study (ETDRS) grid to evaluate the relative location between fundus tessellation and the fovea, where Grade 0 is defined as no large choroidal vessels visible, Grade 1 is defined as fundus tessellations visible in the posterior pole without involving ETDRS grid, Grade 2 is defined as fundus tessellations visible in the outer circle of ETDRS grid without involving the inner circle, Grade 3 is defined as fundus tessellations visible in the inner circle of ETDRS grid without involving the fovea, and Grade 4 is defined as fundus tessellations visible in the center fovea of ETDRS grid (Figure 1). The fundus tessellation was assessed by a trained examiner (L.H.Y), who was regularly supervised by two experienced ophthalmologists (C.Q.Y, F.Y). To assess the reproducibility of the technique, the images of 100 eyes of 100 participants were randomly selected and graded twice by a trained grader (H.G.Y) in a masked manner at an interval of 2 weeks.
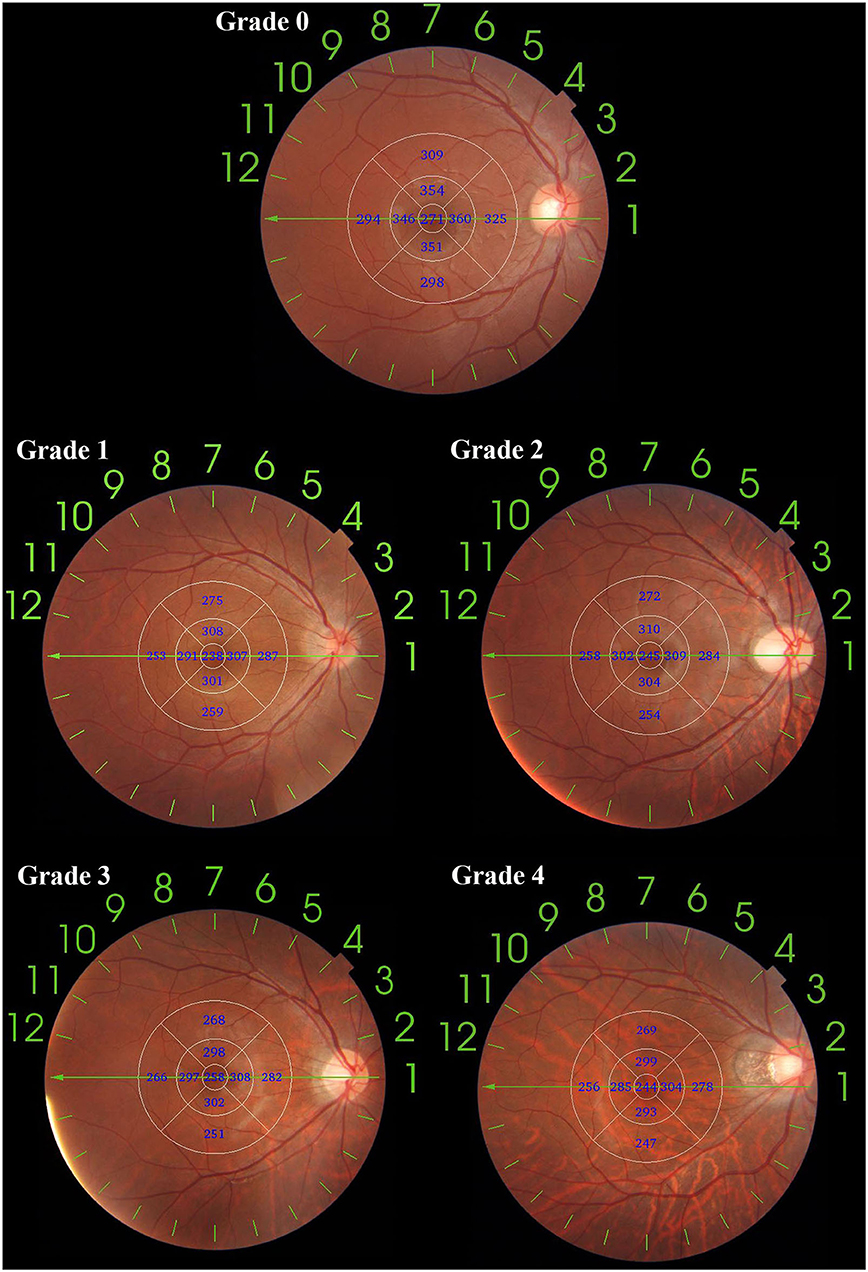
Figure 1. An application of ETDRS grid on fundus tessellation grading. The diameter of center, inner and outer circle are 1, 3, and 6 mm. Eyes with no fundus tessellation were graded as Grade 0; eyes with fundus tessellation without involving the outer circle were graded as Grade 1; eyes with fundus tessellation involving the outer circle of were graded as Grade 2; eyes with fundus tessellation involving the inner circle were graded as Grade 3; eyes with fundus tessellation involving the center circle were graded as Grade 4.
The definition of TD ratio has been previously described as the tilt ratio of minimum-to-maximum disc diameter and a tilted optic disc had a tilt ratio 0.80 or less (19). The optic disc margins, defined as the inner border of the peripapillary sclera rings were lined for measurements (20). The gamma zone peripapillary atrophy was defined as the region between optic disc border and end of Bruch's membrane in previous studies (20–22). Briefly, the area of PPA area was determined as the total number of pixels in a circumferential pattern using the Image J software. Magnification by fundus camera was × 1.4, the total magnification was calculated combined with the magnification factor of Image J system. The area of PPA was converted from pixels into square millimeters. The magnification was corrected for each AL using the Littmann's formula (23).
Swept-Source Optical Coherence Tomography (SS-OCT) Imaging
The tomography thickness map of the entire macular and disc area (6 × 6 mm) was acquired from an average of four overlapped consecutive scans using SS-OCT (model DRI OCT-1 Atlantis; Topcon), which had a lateral resolution of 10 μm and a depth resolution of 8 μm. The machine had a scanning speed of 100,000 A-scans per second with a 1,050-nm-wave length light source. The scan protocol utilized the 12-line radial scan pattern with a resolution of 1,024 × 12 centered on the fovea and optic disc.
The segmentation of each layer was automatically obtained with the built-in software. ChT was defined as the distance between the Bruch membrane and the choroid-sclera interface. Manual segmentation was performed since the automatic segmentation was inaccurate or led to measurement artifacts. The tomography maps were overlapped to an early treatment diabetic retinopathy study grid (6 × 6 mm) that was focused on the macular and optic disc. The global average thickness of the choroid, retina, ganglion cell layer (GCL), and retinal nerve fiber layer (RNFL) was calculated. The circle placement was manually adjusted, if necessary. All measurements were conducted by a single technician who was experienced in taking OCT images. Images with signal strength index ≤60 were excluded for statistical analysis. The SS-OCT was performed twice for the first 30 participants to assess measurement reproducibility.
Scleral thickness was defined as the vertical distance between the choroidal–scleral interface and the outer scleral border*. The posterior scleral border was carefully identified by an experienced technician and reconfirmed by another experienced technician before measuring the lamellar structure, continuity and high reflectivity value of the retrobulbar tissue. To ensure the reproducibility of posterior scleral border, 20 OCT images were randomly selected from the database in advance and the two experienced technicians were asked to outline the posterior scleral border and measure the SST. The intraclass correlation efficient was 0.943 (P < 0.001), which indicates a satisfying repeatability of the method. After testing the reproducibility, measurements were performed by two skilled observers blinded to the study. The average of these measurements was calculated and included in the analysis. If the absolute difference between the two measurements were >20 μm for the sclera, 10 μm for the choroid or 20 μm for the whole fundus, the measurements were repeated until the absolute difference was within the set limits.
Statistical Analysis
The data analyses were performed by SAS 9.3 (Statistical Analysis System, version 9.3; the SAS Institute, Cary, NC, USA). Demographic and ocular characteristics were shown as counts or proportions for categorical data, and as mean ± standard deviation for continuous data. The distribution of all variables was examined for normality using the Kolmogorov-Smirnov test. The ANOVA test was performed to detect differences in demographic and ocular parameters as well as each average layer's thickness between the four groups, as appropriate. Participants' characteristics with and without accessible scleral thickness were compared using the chi-square statistic for proportions and a t-test or Mann–Whitney U test for means or medians as appropriate, using person-specific data. AL, PPA, ReT, ChT, SST were also categorically assessed (in quartiles). Logistic regression models were then performed to investigate the relationship between the proportion of fundus tessellation with ocular and systemic parameters. Parameters with p < 0.05 in the partial correlation analysis were included in the multivariate models.
Results
Among the 828 students enrolled in the study, 11 were excluded due to diffuse chorioretinal atrophy, nine due to other retinopathy, 12 because of IOP > 21 mmHg. Subsequently, 796 students were included in the final analysis.
The general characteristics of the 796 participants and comparison among participants with or without fundus tessellation are listed in Table 1. There were no significant differences in age, sex, BMI, blood pressure, intraocular pressure, anterior chamber depth and lens thickness between the two groups. Eyes with fundus tessellation diagnosis had a lower SE (p < 0.0001), worse BCVA (p = 0.043), longer AL (p < 0.0001), thinner retina (p < 0.0001), thinner choroid (p < 0.0001), and thinner sclera in center fovea (p = 0.0035). Thinner ganglion cell layer (GCL) thickness (p < 0.0001), and more TD existence (p = 0.0001).
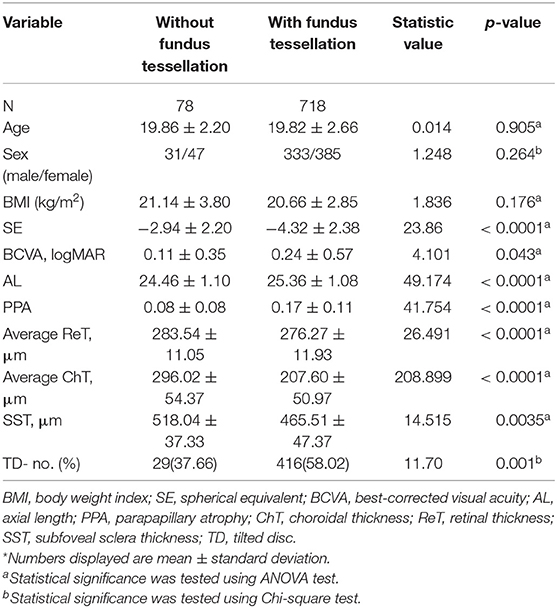
Table 1. Comparison of characteristics between participants with or without fundus tessellation*.
In this study, the definition of non-myopia was AL ≤24 mm, low myopia was AL more than 24 mm but ≤26 mm, and high myopia was AL more than 26 mm. Among the 796 right eyes included in the study, 690 eyes had myopia (86.68%), and 207 eyes had high myopia (26.01%). The percentages of different grades of fundus tessellation in non-myopic, low myopic and high myopic subjects are listed in Table 2. The percentage of eyes with tessellated appearance from grade 1 to grade 4 in non-myopic group, low myopic group and high myopic group were 70.75, 92.55, and 94.69%.The percentage of eyes with grade 3 or grade 4 tessellated appearance in non-myopic group, low myopic group and high myopic group were 24.53, 53.62, and 73.42%.
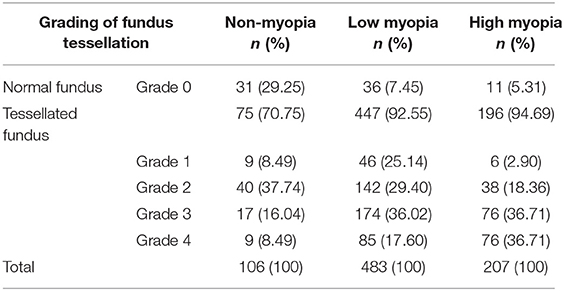
Table 2. Percentages of fundus tessellation in non-myopic, low myopic, and high myopic subjects.
Comparison of systematic and ophthalmologic parameters among each degree of fundus tessellation is displayed in Table 3. As fundus tessellation approaches to the fovea, there is a significant decrease in BMI (p = 0.044), SE (p < 0.0001), ReT (p < 0.0001), ChT (p < 0.0001), SST (p < 0.0001), and a significant increase in AL (p < 0.0001) and PPA (p < 0.0001).
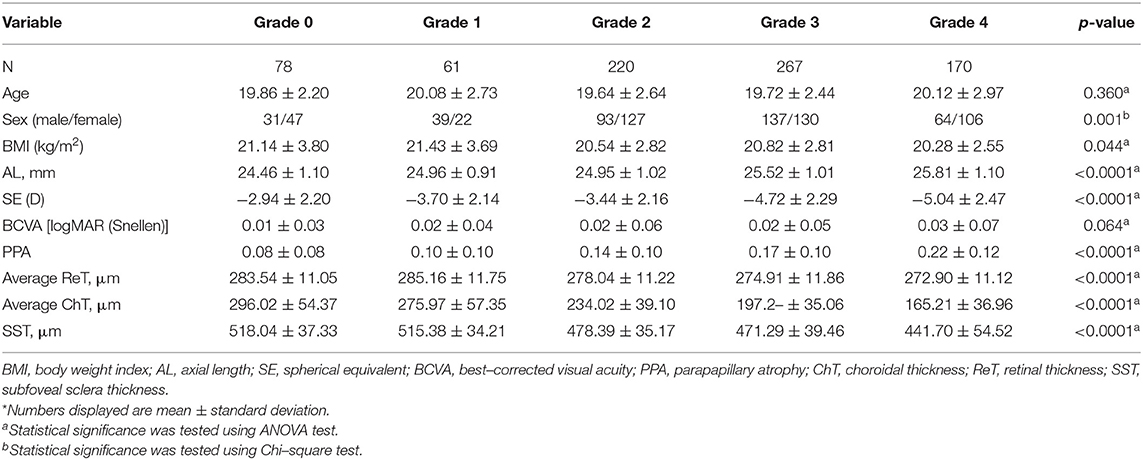
Table 3. Comparisons of characteristics among eyes with different degree of fundus tessellation*.
The topographic characteristics of choroidal layer thickness in macula and peripapillary tessellation ranging from Grade 0 to Grade 4 are shown in Table 4. There was a significant decrease in ChT of all 9 subregion of EDTRS grid (subfoveal, inner nasal, inner superior, inner temporal, inner inferior, outer nasal, outer superior, outer temporal, outer inferior) as the proportion of fundus tessellation enlarged toward center fovea. The trend of decrease of ChT in each subregion were shown in the linear graph (Figure 2). The data of ChT in each subregion of each grade were then converted to a choroidal thickness map (Figures 3, 4), where the value of ChT was shown in different color, with color red being the thickest to color blue the thinnest. As shown in the results of choroidal thickness map, center fovea, macular-papillary region and inferior region showed the most significant decrease in ChT as fundus tessellation enlarged.
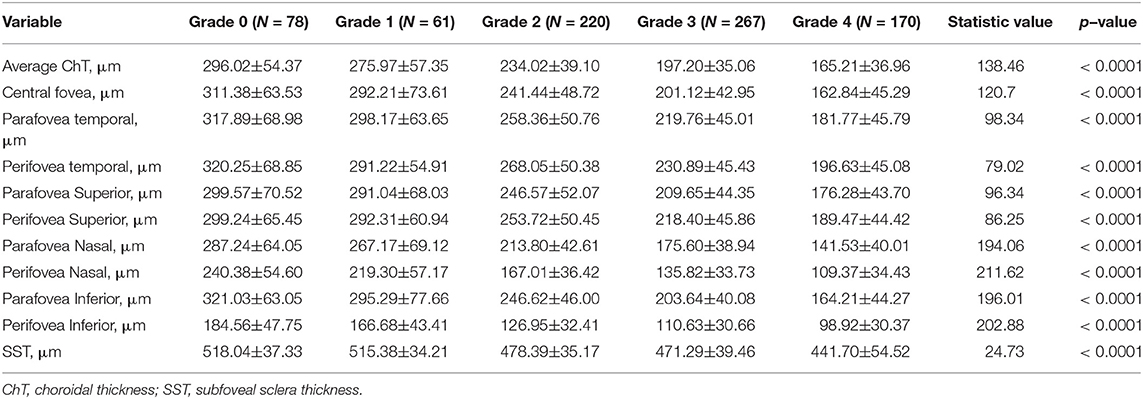
Table 4. Topographical characteristics of choroidal and scleral thickness in tessellated fundus range from Grade 0 to Grade 4.
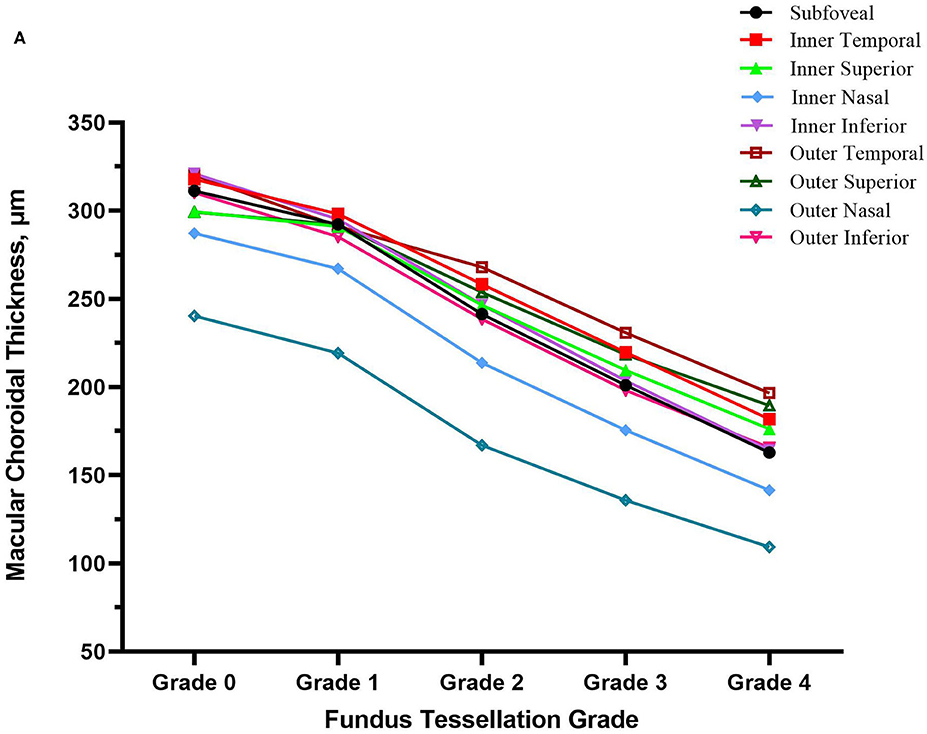
Figure 2. The decrease trend of choroidal thickness in nine subregion of ETDRS grid (subfoveal, inner nasal, inner superior, inner temporal, inner inferior, outer nasal, outer superior, outer temporal, outer inferior) as fundus tessellation approaches to center fovea.
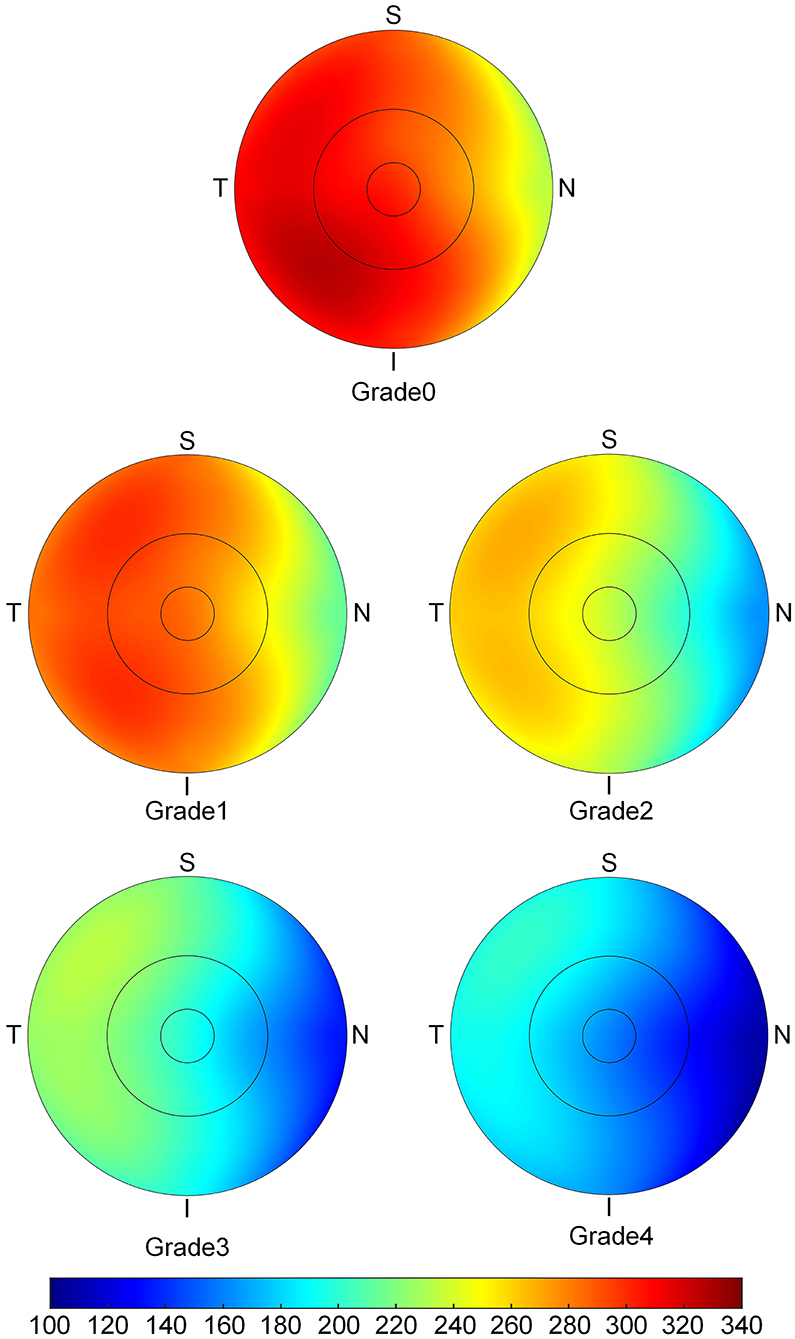
Figure 3. The topographic characteristics of choroidal layer thickness in ETDRS grid centered in fovea, from Grade 0 to Grade 4. The value of choroidal thickness was shown in different color, with color red being the thickest to color blue the thinnest.
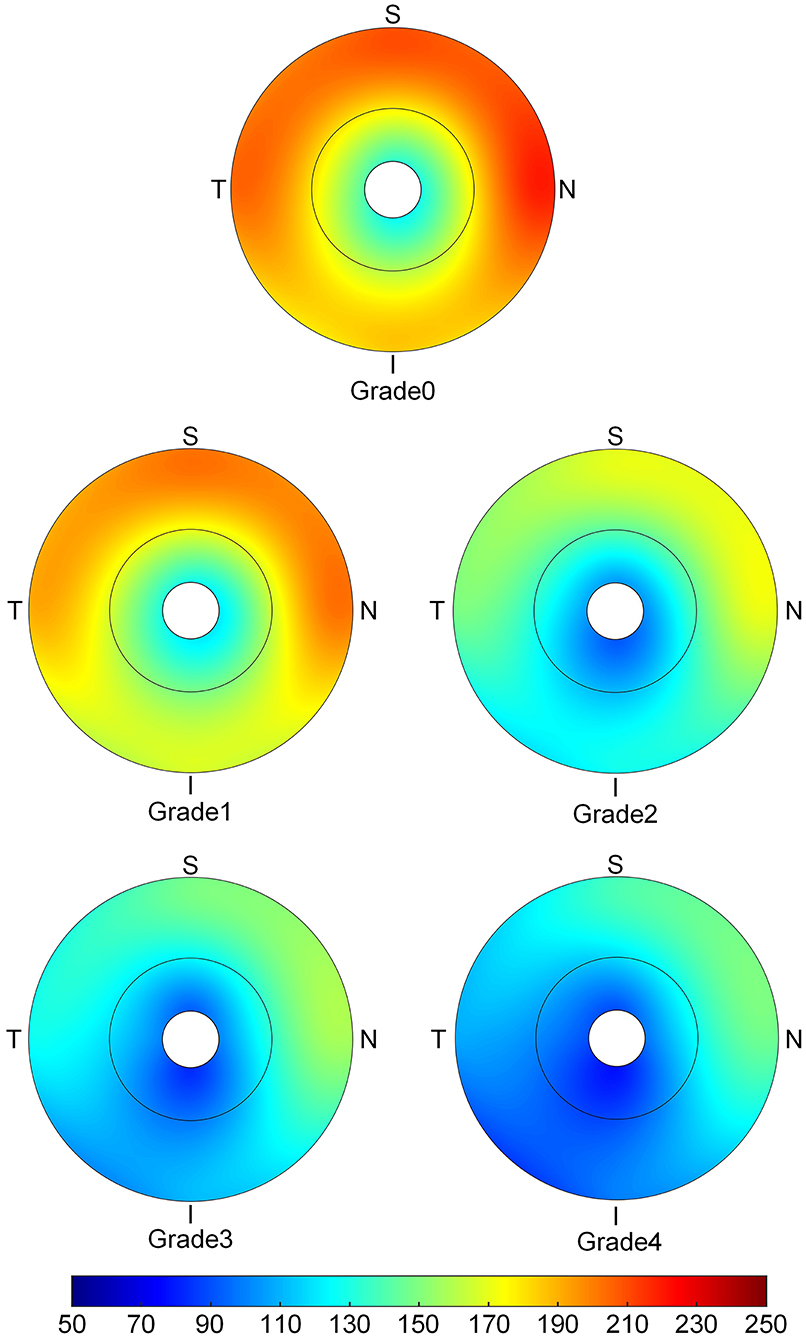
Figure 4. The topographic characteristics of choroidal layer thickness in ETDRS grid centered in optic disc range from Grade 0 to Grade 4. The value of choroidal thickness was shown in different color, with color red as the thickest to color blue the thinnest.
Logistic regression analyses were used to determine the factors that were strongly associated with the increase of proportion of fundus tessellation. First, we included all the participants without considering the data of scleral thickness, the results are showed in Table 5. The proportion of fundus tessellation significantly increased with lower BMI(p = 0.0067), longer AL (p < 0.0001), larger PPA (p = 0.0058), and thinner choroid (p < 0.0001) (Table 4). The data of each parameter were further divided and analyzed using interquartile range. Our results showed that for mChT, quartile 2 (p < 0.001; coefficient,–1.25; 95% Cl, 0.19–0.43), quartile 3 (p < 0.001; coefficient, −2.36; 95% Cl, 0.06–0.15), and quartile 4 (p < 0.001; coefficient, −3.49; 95% Cl, 0.02–0.05) all have lower risk of enlargement of fundus tessellation toward center fovea compared with quartile 1. For AL, quartile 3 (p = 0.0098; Coefficient, 0.51; 95% Cl, 1.13–2.44) and quartile 4 (p = 0.0003; Coefficient, 0.76; 95% Cl, 1.41–3.24) have higher risk of enlargement of fundus tessellation compared with quartile 1. For PPA, quartile 3 (p < 0.001; coefficient, 1.03; 95% Cl, 1.88–4.15) and quartile 4 (p < 0.001; coefficient, 0.84; 95% Cl, 1.52–3.51) have higher risk of enlargement of fundus tessellation compared with quartile 1. While for pChT, only quartile 4 (p < 0.001; coefficient, −1.20; 95% Cl, 0.19–0.48) showed a lower risk of enlargement of fundus tessellation compared with quartile 1.
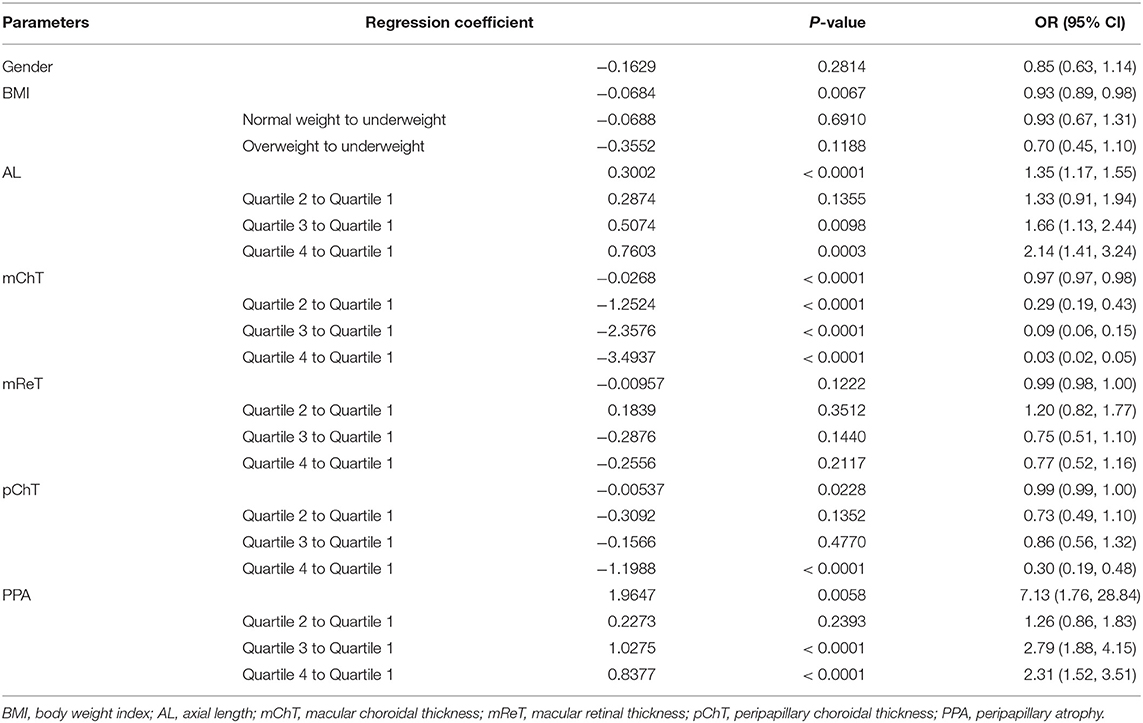
Table 5. Associations of fundus tessellation severity with ocular and systemic parameters.
Second, we analyzed the data of eyes where scleral thickness was measurable. Among the 796 participants, 470 scleral thickness were measurable (59.05%) with the posterior scleral border adequately visible. Table 6 showed that for these participants, the proportion of fundus tessellation significantly increased with longer AL (p = 0.0159), thinner choroid (p < 0.0001) and thinner sclera (p = 0.0003).
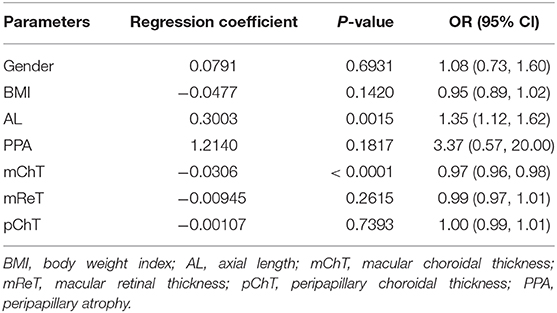
Table 6. Associations of fundus tessellation severity with ocular and systemic parameters with scleral thickness.
Discussion
This is the first study of a university student population-based cohort to explore factors associated with tessellated fundus and its relative location with the fovea. In this study, we used a novel grading method to assess the severity of fundus tessellation, where the relative location between center fovea and the occurrence of fundus tessellation were taken into account. Compared with former studies which graded fundus tessellation severity by the visibility of large choroidal vessels in fundus photographs, this novel grading method has a clear standard by using ETDRS grid to determine the scope of fundus tessellation, thus can be more objective and practical in clinical practice (11, 12). The results of this study showed that the thicknesses of choroidal and scleral layers were significantly decreased, AL and PPA increased during the occurrence and enlargement of fundus tessellation toward center fovea. The thickness of retinal layer was also decreased in tessellated fundus compared to normal fundus, however, in the logistic regression analysis, the thinning of ReT was not a risk factor for the progression of fundus tessellation. In previous studies, the relationship between ReT and myopia remains controversial. Jin et al. studied the ReT in children with different refractive status and their results showed that myopic Chinese children have a thinner retina in the superior and inferior perifoveal regions than do their emmetropic and hyperopic counterparts (24). Jonas et al. studied the relationship of ReT and AL in 1,117 individuals with a mean age of 64.2 ± 9.7 years, their results showed that myopic axial globe elongation was associated with retinal thinning in the equatorial and pre-equatorial region, while foveal ReT was mostly unaffected by AL (25). Zhou et al. found that RNFL thicknesses were significantly thinner in high myopia compared to low myopia, except for the temporal quadrant (26). However, there is other study found no statistical different in the ReT between high myopia and normal population (27). Further investigation in ReT in subdivision of its location and layer are needed to reveal its relationship with fundus tessellation or other myopic retinopathy.
The results also showed a pattern of distribution in the decrease of ChT with higher degree of fundus tessellation, where the central fovea and the area between central fovea and optic disc showed the most significant decrease in ChT. The AL, choroidal and scleral thicknesses were independently related to macular fundus tessellation and its severity, while area of PPA and TD in addition to AL, choroidal and scleral thicknesses were independently associated with peripapillary fundus tessellation and its severity. Our results also showed that BMI could be a protective factor for the enlargement of fundus tessellation. We speculate that it can be associated with the tissular support effect and its function in preventing the deformation of the globe, yet further investigation with MRI is needed.
The results of the present study were in agreement with previous studies that reported a decrease in ChT with the progression of fundus tessellation and pathological myopia. Yan et al. (12) studied 3,468 participants with an average age of 64.4 years, and found that subfoveal ChT and AL had the strongest association with a higher degree of fundus tessellation. As compared to their data, our participants had similar ChT in grade 0 and grade 1 groups. However, the mean central foveal ChT of grade 2 and grade 3 in this study were 165 μm and 152 μm 152 μm as compared to 122 μm in grade 2 and 81 μm in grade 3 in the elderly people. might be due to age-related differences, as ChT is strongly age-related (14–17). Moreover, we noticed a pattern of ChT distribution where ChT in temporal areas was significantly thicker than that of the nasal areas, which is consistent with prior studies (12, 27, 28). The ChT in center fovea and the region between center fovea and optic disc showed the most significant decrease in ChT among all subfields of macular and peripapillary regions, which was consistent with a previous study on distribution pattern of ChT in Chinese children with myopia (29). We observed that the decrease in ChT became more significant with the progression of fundus tessellation.
Due to the limitations of technology and devices, the relationship between scleral thickness and myopia has not been extensively studied. In previous studies, Deng et al. (30) indicated that hyperopic and emmetropic children had thicker sclera than myopic children. In adults, previously reported rates of detection for the posterior scleral border with SS-OCT ranged from 53 to 84.7%, and the posterior scleral border was better seen as the AL increased (31–33). Our results showed a relevance ratio of 59.05% among university students, and indicated that eyes with fundus tessellation have a thinner SST than eyes with normal fundal appearance. Our results also showed that SST decreased significantly when fundus tessellation approaches to center fovea.
Parapapillary gamma zone atrophy is characterized by the absence of Bruch's membrane, retinal pigment epithelium, retinal deep layers and loss of choroicapillars (20–22). PPA is well-established in primary open-angle glaucoma (POAG) and its significance in progression of glaucomatous damage and visual field loss have been confirmed. Its association with myopia is a research hotspot. Several studies found that the area of PPA was strongly associated with longer AL, myopic refraction and tilted optic disc. An increase in AL and decrease in ChT might lead to a decrease in choroidal perfusion and eventually lead to atrophy of choroicapillars (34–36). Our study found that area of parapapillary gamma zone atrophy was strongly associated with fundus tessellation and its enlargement of proportion toward center fovea.
This study investigated optical parameters and changes in thickness of retina, choroid and sclera in the occurrence and increase of fundus tessellation proportion in young adults. The distribution of the decrease in ChT may refer to the deformation of globe and staphyloma formation, which can be further studied by MRI. This study also achieved a relatively high relevance ratio of scleral thickness measurement and observed a strong association between thinner sclera and higher degree of fundus tessellation, which offers certain clues about the mechanism of formation during myopic retinopathy. In this study, we can also found fundus tessellation in non-myopic (A L≤ 24) eyes, of which 75.47% are peripheral fundus tessellation (Grade0-2), while in high myopia (AL > 26), the ratio of fundus tessellation near center fovea (grade3-4) was 73.43%. This information indicate that fundus tessellation that involve center fovea could be more significative in further study of myopic retinopathy.
This study had several limitations. First, since this study exclusively included university students as participants, the results may not represent the general population of all young adults. Second, the novel grading method for tessellated fundus still has subjective element as the relative location of fundus tessellation was determined by the examiner using ETDRS grid instead of a total objective quantitative method. Third, the SST was only measured when the posterior scleral border was clear, which means a greater loss of data in grade 0 and grade 1 tessellated fundus due to thicker choroidal and scleral layers. Due to incomplete data in eyes with unclear scleral borders, we may have underestimated the value of scleral thickness in emmetropia and low myopia participants, however, our results reveal an important tendency that SST decreased significantly with the progression of tessellated fundus.
In summary, this study suggested that BMI, AL, PPA, choroidal, and scleral thicknesses were closely correlated with fundus tessellation in Chinese young adults. Choroidal thinning may progress faster in the region between central fovea and optic disc as the fundus tessellation evolves to more severe complications of pathological myopia. The PPA and TD may play an important role in the evolvement of pathological myopia. The relative location between fundus tessellation and center fovea could be an ideal standard to assess the severity of fundus tessellation and those who has fundus tessellation involving center fovea (Grade 4) should be closely supervised as they showed the most severe myopic morphological alternations and may have more risks to progress into more severe myopic maculopathy. Tessellated fundus is the first stage of fundus changes during myopic maculopathy, whereby some patients will progress from diffuse atrophy to macular atrophy that causes severe and irreversible impairment to visual acuity, while others could remain stable at this stage forever. Thus, we will continue with follow-up visits of our participants, and further investigation of the progression of tessellated fundus and more severe impairment.
Data Availability Statement
The raw data supporting the conclusions of this article will be made available by the authors, without undue reservation.
Ethics Statement
This cross-sectional population-based study was approved by the ethics committee of Shanghai General Hospital, Shanghai Jiao Tong University, Shanghai, China, and followed the tenets of the Declaration of Helsinki. All participants understood the study protocol and provided signed informed consents.
Author Contributions
HL have made substantial contributions to the conception or design of the work and the acquisition, analysis, or interpretation of data for the work. QC have made contributions to the acquisition of data and the supervision of the analysis of the data. GH have made contributions to the acquisition of data and data processing work. YS and LY have made contributions to the revise work of this article. YY have made contributions to the acquisition of data and technical support. YF have made contributions to the supervision of the analysis of the data. HZ have made contributions to the supervision of the analysis of data and the writing. JH, JZ, and XX have made contributions to the supervision of the article writing and approved the final version to be published. All authors contributed to the article and approved the submitted version.
Funding
This study was funded by the by the Chinese National Nature Science Foundation (Grant no.81703287, Beijing, China), the Shanghai Three Year Public Health Action Program (Project no. GWIV-13.1, Shanghai, China), the Shanghai Science and Technology Commission Research Project (Project no.17ZR1426900, Shanghai, China), the Shanghai Municipal Planning Commission of science and Research Fund (Project no. 201640090, Shanghai, China), Shanghai Public Health System Three-Year Plan Personnel Construction Subjects (GWV-10.2-YQ40). The sponsor or funding organization had no role in the design or conduct of this research.
Conflict of Interest
The authors declare that the research was conducted in the absence of any commercial or financial relationships that could be construed as a potential conflict of interest.
Abbreviations
ACD, anterior chamber depth; AL, axial length; BCVA, best-corrected visual acuity; ChT, macular choroidal thickness; CI, confidence interval; TD, tilted disc; mChT, macular choroidal thickness; GCL, ganglion cell layer; mReT, macular retinal thickness; mRNFLT, macular retinal nerve fiber layer thickness; OR, odds ratio; pChT, peripapillary choroidal thickness; pGCLT, peripapillary ganglion cell layer thickness; PPA, parapapillary atrophy; pReT, peripapillary retinal thickness; pRNFLT, peripapillary retinal nerve fiber layer thickness; SE, spherical equivalent; Ref, reference; SBP, systolic blood pressure; SST, subfoveal scleral thickness.
References
1. Holden BA, Fricke TR, Wilson DA, Jong M, Naidoo KS, Sankaridurg P, et al. Global prevalence of myopia and high myopia and temporal trends from 2000 through 2050. Ophthalmology. (2016) 123:1036–42. doi: 10.1016/j.ophtha.2016.01.006
2. Morgan IG, Ohno-Matsui K, Saw SM. Myopia. Lancet. (2012) 379:1739–48. doi: 10.1016/S0140-6736(12)60272-4
3. Sawada A, Tomidokoro A, Araie M, Iwase A, Yamamoto T. Refractive errors in an elderly Japanese population: the Tajimi study. Ophthalmology. (2008) 115:363–70.e3. doi: 10.1016/j.ophtha.2007.03.075
4. Wong TY, Foster PJ, Hee J, Ng TP, Tielsch JM, Chew SJ, et al. Prevalence and risk factors for refractive errors in adult Chinese in Singapore. Invest Ophthalmol Vis Sci. (2000) 41:2486–94.
5. Fricke TR, Jong M, Naidoo KS, Sankaridurg P, Naduvilath TJ, Ho SM, et al. Global prevalence of visual impairment associated with myopic macular degeneration and temporal trends from 2000 through 2050: systematic review, meta-analysis and modelling. Br J Ophthalmol. (2018) 102:855–62. doi: 10.1136/bjophthalmol-2017-311266
6. Ohno-Matsui K, Lai TY, Lai CC, Cheung CM. Updates of pathologic myopia. Prog Retin Eye Res. (2016) 52:156–87. doi: 10.1016/j.preteyeres.2015.12.001
7. Delcourt C, Le Goff M, von Hanno T, Mirshahi A, Khawaja AP, Verhoeven VJM, et al. The decreasing prevalence of nonrefractive visual impairment in older europeans: a meta-analysis of published and unpublished data. Ophthalmology. (2018) 125:1149–59. doi: 10.1016/j.ophtha.2018.02.005
8. Morgan IG, French AN, Ashby RS, Guo X, Ding X, He M, et al. The epidemics of myopia: aetiology and prevention. Prog Retin Eye Res. (2018) 62:134–49. doi: 10.1016/j.preteyeres.2017.09.004
9. Ohno-Matsui K, Kawasaki R, Jonas JB, Cheung CM, Saw SM, Verhoeven VJ, et al. International photographic classification and grading system for myopic maculopathy. Am J Ophthalmol. (2015) 159:877–83.e7. doi: 10.1016/j.ajo.2015.01.022
10. Jonas JB, Gründler A. Optic disc morphology in “age-related atrophic glaucoma”. Graefes Arch Clin Exp Ophthalmol. (1996) 234:744–9. doi: 10.1007/BF00189355
11. Yan YN, Wang YX, Yang Y, Xu L, Xu J, Wang Q, et al. Ten-year progression of myopic maculopathy: the beijing eye study 2001-2011. Ophthalmology. (2018) 125:1253–63. doi: 10.1016/j.ophtha.2018.01.035
12. Yan YN, Wang YX, Xu L, Xu J, Wei WB, Jonas JB. Fundus tessellation: prevalence and associated factors: the beijing eye study 2011. Ophthalmology. (2015) 122:1873–80. doi: 10.1016/j.ophtha.2015.05.031
13. Jin P, Zou H, Xu X, Chang TC, Zhu J, Deng J, et al. Longitudinal changes in choroidal and retinal thicknesses in children with myopic shift. Retina. (2019) 39:1091–9. doi: 10.1097/IAE.0000000000002090
14. Spaide RF. Age-related choroidal atrophy. Am J Ophthalmol. (2009) 147:801–10. doi: 10.1016/j.ajo.2008.12.010
15. Switzer DW Jr, Mendonça LS, Saito M, Zweifel SA, Spaide RF. Segregation of ophthalmoscopic characteristics according to choroidal thickness in patients with early age-related macular degeneration. Retina. (2012) 32:1265–71. doi: 10.1097/IAE.0b013e31824453ac
16. Warrow DJ, Hoang QV, Freund KB. Pachychoroid pigment epitheliopathy. Retina. (2013) 33:1659–72. doi: 10.1097/IAE.0b013e3182953df4
17. Yoshihara N, Yamashita T, Ohno-Matsui K, Sakamoto T. Objective analyses of tessellated fundi and significant correlation between degree of tessellation and choroidal thickness in healthy eyes. PLoS ONE. (2014) 9:e103586. doi: 10.1371/journal.pone.0103586
18. He J, Chen Q, Yin Y, Zhou H, Fan Y, Zhu J, et al. Association between retinal microvasculature and optic disc alterations in high myopia. Eye (Lond). (2019) 33:1494–503. doi: 10.1038/s41433-019-0438-7
19. Jonas JB, Jonas SB, Jonas RA, Holbach L, Dai Y, Sun X, et al. Parapapillary atrophy: histological gamma zone and delta zone. PLoS ONE. (2012) 7:e47237. doi: 10.1371/journal.pone.0047237
20. Dai Y, Jonas JB, Huang H, Wang M, Sun X. Microstructure of parapapillary atrophy: beta zone and gamma zone. Invest Ophthalmol Vis Sci. (2013) 54:2013–8. doi: 10.1167/iovs.12-11255
21. Kim M, Kim TW, Weinreb RN, Lee EJ. Differentiation of parapapillary atrophy using spectral-domain optical coherence tomography. Ophthalmology. (2013) 120:1790–7. doi: 10.1016/j.ophtha.2013.02.011
22. Chen Q, He J, Yin Y, Zhou H, Jiang H, Zhu J, et al. Impact of the morphologic characteristics of optic disc on choroidal thickness in young myopic patients. Invest Ophthalmol Vis Sci. (2019) 60:2958–67. doi: 10.1167/iovs.18-26393
23. Bennett AG, Rudnicka AR, Edgar DF. Improvements on Littmann's method of determining the size of retinal features by fundus photography. Graefes Arch Clin Exp Ophthalmol. (1994) 232:361–7. doi: 10.1007/BF00175988
24. Jin P, Zou H, Zhu J, Xu X, Jin J, Chang TC, et al. Choroidal and retinal thickness in children with different refractive status measured by swept-source optical coherence tomography. Am J Ophthalmol. (2016) 168:164–76. doi: 10.1016/j.ajo.2016.05.008
25. Jonas JB, Xu L, Wei WB, Pan Z, Yang H, Holbach L, et al. Retinal thickness and axial length. Invest Ophthalmol Vis Sci. (2016) 57:1791–7. doi: 10.1167/iovs.15-18529
26. Seo S, Lee CE, Jeong JH, Park KH, Kim DM, Jeoung JW. Ganglion cell-inner plexiform layer and retinal nerve fiber layer thickness according to myopia and optic disc area: a quantitative and three-dimensional analysis. BMC Ophthalmol. (2017) 17:22. doi: 10.1186/s12886-017-0419-1
27. Zhou Y, Song M, Zhou M, Liu Y, Wang F, Sun X. Choroidal and retinal thickness of highly myopic eyes with early stage of myopic chorioretinopathy: tessellation. J Ophthalmol. (2018) 2018:2181602. doi: 10.1155/2018/2181602
28. Ikuno Y, Tano Y. Retinal and choroidal biometry in highly myopic eyes with spectral-domain optical coherence tomography. Invest Ophthalmol Vis Sci. (2009) 50:3876–80. doi: 10.1167/iovs.08-3325
29. Bidaut-Garnier M, Schwartz C, Puyraveau M, Montard M, Delbosc B, Saleh M. Choroidal thickness measurement in children using optical coherence tomography. Retina. (2014) 34:768–74. doi: 10.1097/IAE.0b013e3182a487a4
30. Deng J, Jin J, Lv M, Jiang W, Sun S, Yao C, et al. Distribution of scleral thickness and associated factors in 810 Chinese children and adolescents: a swept-source optical coherence tomography study. Acta Ophthalmol. (2019) 97:e410–8. doi: 10.1111/aos.13788
31. Park HY, Shin HY, Park CK. Imaging the posterior segment of the eye using swept-source optical coherence tomography in myopic glaucoma eyes: comparison with enhanced-depth imaging[J]. Am J Ophthal. (2014) 157:550–7. doi: 10.1016/j.ajo.2013.11.008
32. Lopilly Park HY, Lee NY, Choi JA, Park CK. Measurement of scleral thickness using swept-source optical coherence tomography in patients with open-angle glaucoma and myopia[J]. Am J Ophthal. (2014) 157:876–84. doi: 10.1016/j.ajo.2014.01.007
33. Wong CW, Phua V, Lee SY, Wong TY, Cheung CM. Is choroidal or scleral thickness related to myopic macular degeneration? Invest Ophthalmol Vis Sci. (2017) 58:907–13. doi: 10.1167/iovs.16-20742
34. Hirata M, Tsujikawa A, Matsumoto A, Hangai M, Ooto S, Yamashiro K, et al. Macular choroidal thickness and volume in normal subjects measured by swept-source optical coherence tomography. Invest Ophthalmol Vis Sci. (2011) 52:4971–8. doi: 10.1167/iovs.11-7729
35. Guo Y, Liu LJ, Tang P, Feng Y, Lv YY, Wu M, et al. Parapapillary gamma zone and progression of myopia in school children: the beijing children eye study. Invest Ophthalmol Vis Sci. (2018) 59:1609–16. doi: 10.1167/iovs.17-21665
Keywords: fundus tessellation, myopia, fundal alteration, choroidal thickness, scleral thickness
Citation: Lyu H, Chen Q, Hu G, Shi Y, Ye L, Yin Y, Fan Y, Zou H, He J, Zhu J and Xu X (2021) Characteristics of Fundal Changes in Fundus Tessellation in Young Adults. Front. Med. 8:616249. doi: 10.3389/fmed.2021.616249
Received: 11 October 2020; Accepted: 24 March 2021;
Published: 26 April 2021.
Edited by:
Xiangtian Zhou, Wenzhou Medical University, ChinaReviewed by:
Haotian Lin, Sun Yat-sen University, ChinaPei-Chang Wu, Kaohsiung Chang Gung Memorial Hospital, Taiwan
Copyright © 2021 Lyu, Chen, Hu, Shi, Ye, Yin, Fan, Zou, He, Zhu and Xu. This is an open-access article distributed under the terms of the Creative Commons Attribution License (CC BY). The use, distribution or reproduction in other forums is permitted, provided the original author(s) and the copyright owner(s) are credited and that the original publication in this journal is cited, in accordance with accepted academic practice. No use, distribution or reproduction is permitted which does not comply with these terms.
*Correspondence: Jiangnan He, aGVqaWFuZ25hbjg1QDEyNi5jb20=; Jianfeng Zhu, amZ6aHUxOTc0QGhvdG1haWwuY29t; Xun Xu, ZHJ4dXh1bkBzanR1LmVkdS5jbg==