 Chao Sang1†
 Hongmei Yan2,3†
 Wah Kheong Chan4
 Xiaopeng Zhu2
 Tao Sun1Xinxia Chang2
 Mingfeng Xia2Xiaoyang Sun2Xiqi Hu5
 Xin Gao2,3Wei Jia1,6
 Hua Bian2,3*
 Tianlu Chen1*
 Guoxiang Xie7*
- 1Shanghai Key Laboratory of Diabetes Mellitus and Center for Translational Medicine, Shanghai Jiao Tong University Affiliated Sixth People's Hospital, Shanghai, China
- 2Department of Endocrinology and Metabolism, Zhongshan Hospital, Fudan University, Shanghai, China
- 3Fudan Institute for Metabolic Diseases, Fudan University, Shanghai, China
- 4Gastroenterology and Hepatology Unit, Department of Medicine, Faculty of Medicine, University of Malaya, Kuala Lumpur, Malaysia
- 5Department of Pathology, Medical College, Fudan University, Shanghai, China
- 6Hong Kong Traditional Chinese Medicine Phenome Research Centre, School of Chinese Medicine, Hong Kong Baptist University, Hong Kong, China
- 7Human Metabolomics Institute, Inc., Shenzhen, China
Non-alcoholic fatty liver disease (NAFLD) is one of the main causes of fibrosis. Liver biopsy remains the gold standard for the confirmation of fibrosis in NAFLD patients. Effective and non-invasive diagnosis of advanced fibrosis is essential to disease surveillance and treatment decisions. Herein we used routine medical test markers and logistic regression to differentiate early and advanced fibrosis in NAFLD patients from China, Malaysia, and India (n1 = 540, n2 = 147, and n3 = 97) who were confirmed by liver biopsy. Nine parameters, including age, body mass index, fasting blood glucose, presence of diabetes or impaired fasting glycemia, alanine aminotransferase, γ-glutamyl transferase, triglyceride, and aspartate transaminase/platelet count ratio, were selected by stepwise logistic regression, receiver operating characteristic curve (ROC), and hypothesis testing and were used for model construction. The area under the ROC curve (auROC) of the model was 0.82 for differentiating early and advanced fibrosis (sensitivity = 0.69, when specificity = 0.80) in the discovery set. Its diagnostic ability remained good in the two independent validation sets (auROC = 0.89 and 0.71) and was consistently superior to existing panels such as the FIB-4 and NAFLD fibrosis score. A web-based tool, LiveFbr, was developed for fast access to our model. The new model may serve as an attractive tool for fibrosis classification in NAFLD patients.
Introduction
Non-alcoholic fatty liver disease (NAFLD), the manifestation of metabolic syndrome in the liver that is linked to obesity and insulin resistance, is one of the most frequent chronic liver diseases (CLDs) and affects approximately 6–40% of the general population, depending on the population, ethnicity, and diagnostic criteria (1, 2). Most NAFLD patients have simple steatosis without fibrosis. Diverse stages of fibrosis and/or cirrhosis may develop in the context of non-alcoholic steatohepatitis (NASH). Advanced fibrosis (stage 3–4) is increasingly recognized as the leading cause of hepatocellular carcinoma and liver transplantation (3). Meanwhile, advanced fibrosis is at an increased risk for liver-related and cardiovascular-related mortality (2, 4). As a consequence, patients with NAFLD should be assessed for the extent of fibrosis, especially the presence of advanced fibrosis, because of its prognostic implications.
Liver biopsy is regarded as the gold standard for the diagnosis and monitoring of hepatic fibrosis progression in patients with NAFLD. However, this invasive procedure cannot be performed routinely in a large-scale population due to its inherent shortcomings (5). In the last decade, a number of non-invasive approaches based on blood markers, such as the aspartate transaminase/alanine transaminase ratio (AST/ALT ratio) (6), AST to platelet ratio index (APRI) (7), FIB-4 (based on age, AST, ALT, and platelet (PLT)] (8), NAFLD fibrosis score [NFS; based on age, body mass index (BMI), impaired fasting glycemia or diabetes (DM/IFG), AST/ALT, PLT, and albumin (ALB)] (9), FibroMeter (10), and others (11), have been applied to predict and distinguish the progression of hepatic fibrosis in CLD patients due to their simple operation, few complications, and widespread application (12). Some of them (or their combinations) have been recommended as an auxiliary method for liver fibrosis and cirrhosis diagnosis and monitoring, treatment selection, and risk stratification in some countries and regions (13), although their universality and performances are still waiting for further assessment in larger and special populations (14–16).
Along with the increasing amounts of biomedical data and the popularity of artificial intelligence, machine learning methods have been actively used to develop various tools for disease state assessment (17–19). For example, our group constructed a gradient boosting (GB) machine learning model to stage liver fibrosis and cirrhosis in patients with hepatitis B virus (n = 576) and hepatitis C virus (n = 484) infection (20). Using the same four parameters of the famous scoring system FIB-4, our method showed steady and significant improvements in comparison with FIB-4. In addition, we quantitatively profiled 98 serum metabolites in 1,006 participants (including 504 CLD patients and 502 normal controls) and identified four serum metabolite markers, taurocholate, tyrosine, valine, and linoelaidic acid, which can reliably evaluate the stage of fibrosis by jointly using two machine learning methods, least absolute shrinkage and selection operator and random forest (RF) (21). The prediction models were steadily superior to existing scoring systems, including the APRI, FIB-4, and AST/ALT ratio, with greater sensitivity, specificity, area under the receiver operating characteristic curve (auROC) and area under the precision–recall curve (auPR). However, in further studies and clinical applications, increasing attention has been given to the limitations of machine learning models. First, the computational process of a model is a “black box” to users, and no formula can be given. This ambiguity has impeded its popularity in clinical practice. Second, the overfitting problem is increasingly recognized in patients with diverse backgrounds. Machine learning models usually require a much higher number of training samples and more independent validation sets (to avoid overfitting) than conventional methods due to their complicated structure and a large number of parameters. As large-scale (e.g., over 2,000) samples of liver biopsy-confirmed NAFLD patients are not easy to obtain, complex machine learning methods are considered to be an over-examination for NAFLD patients. Thus, the contradiction between the sample size demand and the poor compliance of patients could not be solved in the short term.
Logistic regression (LR), a simple and classical method, has been used in thousands of studies for disease status assessment. Considering the limitations of machine learning methods and the practical value of LR, in this report, we constructed an LR model for the differentiation between early and advanced fibrosis in NAFLD patients. Our strengths include the following: (1) Three independent cohorts with sample sizes of 540, 147, and 97 were used for model construction and validation; (2) All the patients were evaluated by liver biopsy; (3) Our model used routine medical test markers that can be obtained during routine medical examinations regardless of the medical condition; (4) Diagnostic performances were examined and compared comprehensively with FIB-4 and NFS; and (5) An integrated web tool, LiveFbr, was developed for biological research and clinical application. This paper is organized as follows: Section Materials and Methods introduces the cohorts, data sets, and methodology for model construction and validation. Section Results introduces the basic characteristics of the cohorts, the process of parameter selection and model construction, and the results of model evaluation. Section Discussion summarizes the work and highlights its strengths and limitations.
Materials and Methods
Cohorts and Ethics
A total of 784 patients with hepatic fibrosis from three independent cohorts were enrolled in this study. Except for cohort 1, the other two cohorts were collected prospectively from anonymous data sets of existing studies. The discovery set (cohort 1) comprising 540 participants was recruited by authors from Zhongshan Hospital Affiliated to Fudan University, China. Liver biopsy specimens were acquired from all patients who met the diagnostic criteria for NAFL or NASH and underwent liver biopsy (22). Subjects were excluded from the study if they had any of the following conditions: history of cancer, alcoholic intemperance, or other causes of chronic liver disease. Peripheral venous blood samples were taken after a 12-h fasting period. The samples were provided in a de-identified fashion, and the lab staff who prepared the samples were blinded to the clinical information. This study conformed to the ethical guidelines of the 1975 Declaration of Helsinki, and approval was obtained from the Research Ethics Committee of Zhongshan Hospital Affiliated to Fudan University (no. B2013-132, date: November 2013). Written informed consent was obtained from each participant. Validation set 1 (cohort 2), consisting of 147 patients, and validation set 2 (cohort 3), consisting of 97 patients, were recruited by the author from University of Malaya Medical Center at different periods (set one was recruited between November 2012 and April 2014, and set 2 began from 2016; for detailed information, please refer to the original publications) (23, 24).
Liver Biopsy
Liver biopsies with ultrasound-guided 1.6-mm-diameter needles were performed by professionally trained operators for patients in the discovery set (cohort 1). For the validation sets (cohorts 2 and 3), percutaneous needle biopsy examinations were performed by one of two experienced operators (WKC and SM) using an 18-G Temno® II semi-automatic biopsy needle (Cardinal Health, Dublin, Ohio, USA) (24). All liver tissue samples of each cohort were examined by an experienced pathologist who was completely blinded to the research design. The non-alcoholic fatty liver disease activity score was used to assess hepatic status based on a standardized histological scoring system (25), namely, included steatosis (0–3), lobular inflammation (0–3), hepatocellular ballooning (0–2), and fibrosis (0–4).
Blood Sample Collection and Test
For subjects in the discovery set, routine fasting (12 h) blood samples were collected. Biochemical measurements were performed using standard laboratory procedures. The ALB concentration was examined by the bromocresol green method. Fasting blood glucose (FBG) was assessed by the glucose oxidase method. The level of low-density lipoprotein cholesterol (LDL) was calculated by the Friedewald equation. The concentrations of γ-glutamyltransferase (GGT), high-density lipoprotein cholesterol, total cholesterol, triglyceride (TG), total bilirubin, PLT, ALT, and AST were measured by an automated bioanalyzer (Hitachi 7600, Hitachi, Tokyo, Japan). Glycated hemoglobin (HbA1c) was estimated by a high-pressure liquid chromatography analyzer (HLC-723 G7, Tosoh Corporation, Japan). Detailed sample collection and test information for the validation sets can be found in the original reports (23, 24).
Model Construction and Validation
Marker Selection
Biological markers are characteristics that are objectively measured and evaluated as indicators of normal biological processes, pathogenic processes, or pharmacologic responses to a therapeutic intervention (26). Marker selection is carried out to eliminate irrelevant or redundant markers (features) and select key features that are truly relevant to the study aim. This step is important to reduce the number of features and to simplify a subsequent model construction. In this study, two steps were taken for marker selection. First, three methods, including stepwise logistic regression, receiver operating characteristic curve analysis, and hypothesis testing [Student's t-test for normal parameters, Wilcoxon–Mann–Whitney test for non-normal parameters, and chi-square test or Fisher's exact test (if the expected count is <5 in contingency tables) for categorical parameters] were applied separately for all parameters. The parameters that met two or more conditions (auROC > 0.6, stepwise logistic regression p < 0.05, or hypothesis testing p < 0.05 between early and advanced fibrosis) were screened out for further selection. Second, all possible combinations among these selected parameters were used to construct numerous LR models. The final optimal parameter set was determined by balancing the number of parameters and the model performances (primarily based on the value of auROC + auPR). The design of our two-step strategy was advanced and effective. The first step reduced the data size and simplified the problem. The second step is time-consuming but necessary, as it is not unusual that a model with fewer parameters performs better than that with more parameters, probably due to the complicated synergistic and competitive relationships among parameters. All these were conducted on the discovery set.
Model Construction and Validation
Based on the optimized parameters, an LR model was established on the full discovery set to differentiate early and advanced fibrosis (S0–2 vs. S3–4). The performances of the LR predictive score were evaluated by ROC and PR curve, auROC, auPR, accuracy, F1 value, and sensitivity (when specificity is 0.8) and were compared with FIB-4 and NFS. The ROC curve is a comprehensive method reflecting sensitivity and specificity. The PR curve is a comprehensive method reflecting recall and precision. auROC and auPR are the area values under these curves. The larger the area is, the better the classification performance. We also employed Wilcoxon tests and box plots to compare FIB-4, NFS, and LR scores in early vs. advanced fibrosis. These results were further validated in two independent validation sets.
To estimate the independence of the LR model on potential confounders, we further applied LR to the predictive score of the model and five parameters that were significantly different between early and advanced fibrosis but were not used in LR model construction.
Considering the good performance of machine learning methods in our previous studies, we constructed an RF and a GB model using the optimal parameter set (with default parameter settings) and compared their performance with that of our LR model.
Code, Data, and Web Tool Availability Statement
R (v 4.0.2) was used for data analysis and figure plotting in this study. The LR, RF, and GB models were built by the stats (v 4.0.2), randomForest (v 4.6–14), and gbm (v 2.1.8) packages, respectively. The data sets and code for result generation are accessible at https://github.com/chentianlu/LiveFbr. A web-based tool, LiveFbr, has also been developed to provide fast access to our diagnosis system (https://metabolomics.cc.hawaii.edu/software/LiveFbr/, Figure 1).
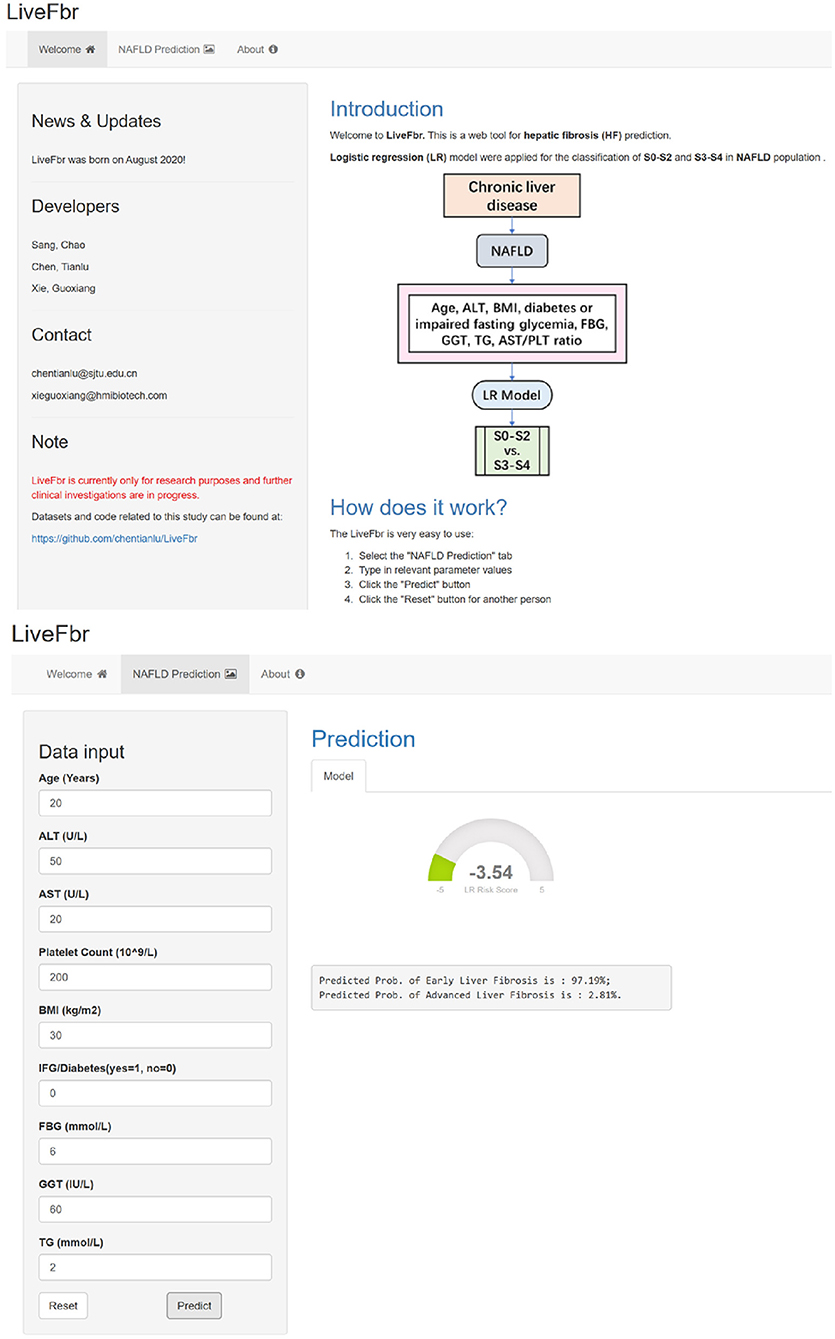
Figure 1. The main pages of the web tool LiveFbr.
Definitions
The formula of FIB-4 was age × AST (IU/L)/[PLT (×109/L) × √ALT (IU/L)] (8). The formula of NFS was −1.675 + 0.037 × age (years) + 0.094 × BMI (kg/m2) + 1.13 × DM/IFG (yes = 1, no = 0) + 0.99 × AST/ALT ratio−0.013 × PLT (×109/L)−0.66 × ALB (g/dl) (9). The AST/ALT ratio was calculated as AST (IU/L)/ALT (IU/L). The AST/PLT ratio was calculated as AST (IU/L)/PLT (×109/L). The F1 score of a group was calculated as 2PR/(P + R), where P and R were the precision and the recall of the group, respectively. The accuracy was calculated as (true positive + true negative)/all samples.
Results
Basic Characteristics of the Discovery Set
A total of 540 biopsy-proven NAFLD patients were involved in model discovery. Two-thirds of the participants, 391 (72.41%), had early fibrosis, and the remaining one-third, 149 (27.59%), were diagnosed with advanced fibrosis. Generally, patients with advanced fibrosis were older, with a higher proportion of females, and had impaired fasting glycemia or the presence of diabetes. In addition, their AST, FBG, GGT, HbA1c, AST/ALT ratio, and AST/PLT ratio levels were higher, and the PLT and TG levels were lower than those of early fibrosis patients (more details are listed in Table 1).
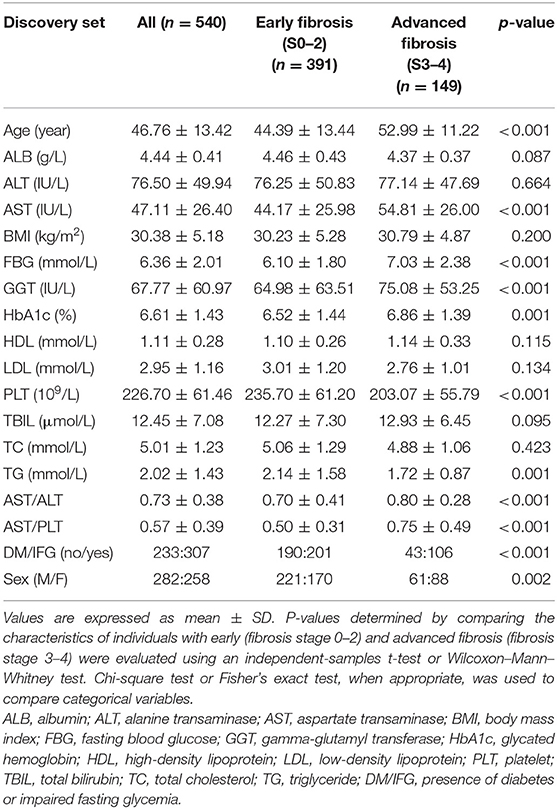
Table 1. Clinical and demographic characteristics of the discovery cohort.
Optimal Parameter Set Selection
Two steps were conducted for optimal parameter set selection using all the samples in the discovery set (step 1 in Figure 2). After the first step, 14 of the 18 parameters were preselected by logistic regression, ROC, and hypothesis testing: AST, AST/ALT ratio, AST/PLT ratio, DM/IFG, FBG, GGT, PLT, TG, ALT, BMI, LDL, HbA1c, and sex. In the second step, all possible parameter combinations among them were used to construct numerous LR models. Eight parameters were finally selected, balancing the number of parameters used and the values of auPR + auROC, accuracy, and F1 score (Supplementary Figure 1). The optimal parameter set consisted of age, ALT, BMI, DM/IFG, FBG, GGT, TG, and AST/PLT ratio.
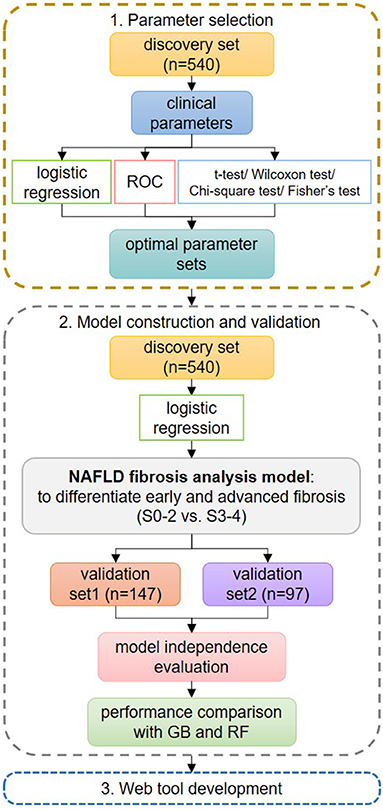
Figure 2. Flowchart of the study design. In step 1 of parameter set selection, stepwise logistic regression, receiver operating characteristic curve, and hypothesis testing were used jointly for preselection, and the final set was determined from all possible combinations. In step 2 of model construction and validation, the logistic regression (LR) model was constructed using the optimal parameter set and was compared with GIB-4 and non-alcoholic fatty liver disease fibrosis scores on the discovery set. Then, the LR model was validated on the validation sets. Its independence from possible confounders was evaluated. Its performances were compared to those of other machine learning methods. In step 3, we developed a web tool for fast applications.
Model Construction
An LR model was constructed to differentiate early and advanced fibrosis among NAFLD patients using the optimal parameter set on the full discovery set. According to the LR model, the LR score could be obtained as follows: −5.26952 + 0.041784 × age −0.01357 × ALT + 0.043788 × BMI + 0.574987 × DM/IFG + 0.089424 × FBG + 0.001741 × GGT −0.490716 × TG + 7.738743 × AST/PLT ratio. As Figure 3A and Table 2 show, the auROC and auPR values of our model (0.82 and 0.63, respectively) were higher than those of FIB-4 (0.79 and 0.58) and NFS (0.75 and 0.49), indicating the superiority of the LR model relative to FIB-4 and NFS. We further assessed the group differences in the LR model-generated predictive score and the FIB-4 and NFS scores. All the scores were significantly (Wilcoxon test, p < 0.05) different between early and advanced fibrosis (Figure 3B). The detailed classification performances of the LR model, FIB-4, and NFS are listed in Table 2. As expected, most of the criteria of the LR model were the highest compared with those of FIB-4 and NFS.
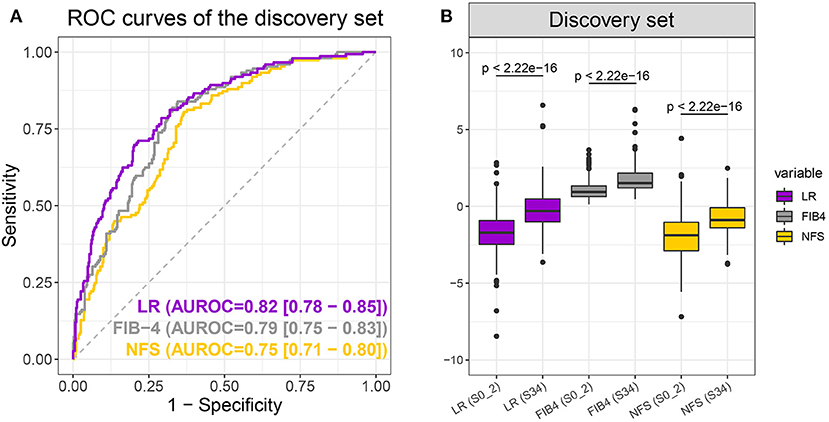
Figure 3. Receiver operating characteristic curves (A) of the logistic regression (LR) model (purple), FIB-4 (gray), and non-alcoholic fatty liver disease fibrosis scores (NFS) (yellow) and boxplot (B) of LR, FIB-4, and NFS scores when differentiating S0–2 vs. S3–4 on the discovery set. P-values were calculated using the Wilcoxon test.
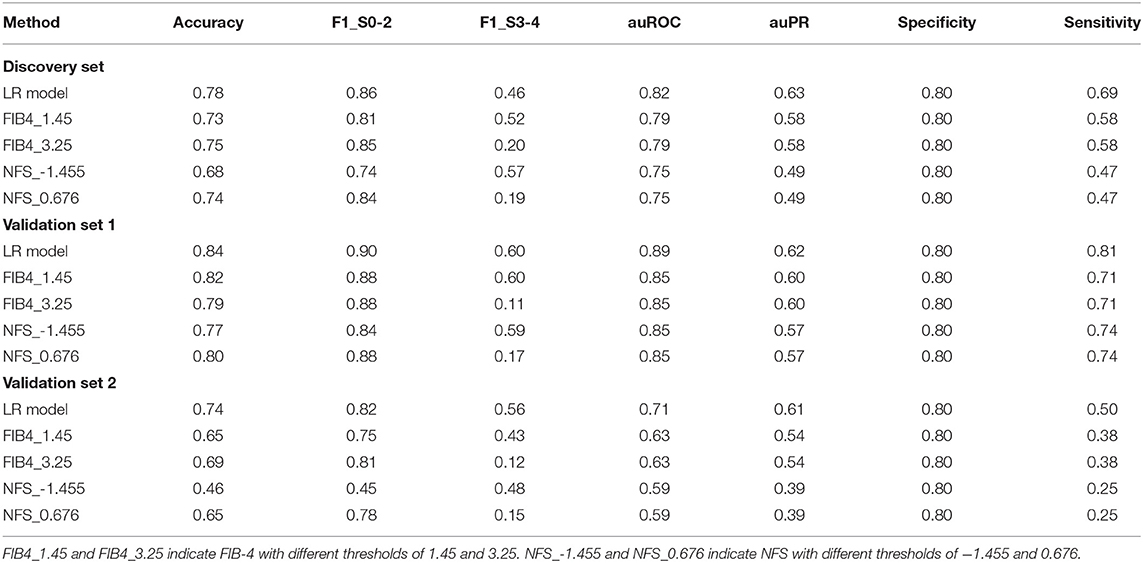
Table 2. Performances of the logistic regression (LR) model, FIB-4, and non-alcoholic fatty liver disease fibrosis scores (NFS) in the diagnosis of advanced liver fibrosis.
Model Validation
The LR model obtained by the discovery set was validated in two independent validation sets. Validation set 1 consisted of 147 NAFLD patients, 116 with early fibrosis and 31 with advanced fibrosis, and validation set two consisted of 97 NAFLD patients, 65 with early fibrosis, and 32 with advanced fibrosis. More specific demographic and biological information is available in Supplementary Table 1. As expected, the LR model performed best with the highest auROC, auPR, and sensitivity (when specificity was 0.8) of 0.89, 0.62, and 0.81, respectively, for validation set 1 and 0.71, 0.61, and 0.50, respectively, for validation set 2 (Figures 4A,C and Table 2). Moreover, the group differences of the LR model were apparently more significant than those of the NFS and FIB-4 in both validation sets (Figures 4B,D). In summary, the LR model was consistently superior to FIB-4 and NFS for early and advanced fibrosis classifications.
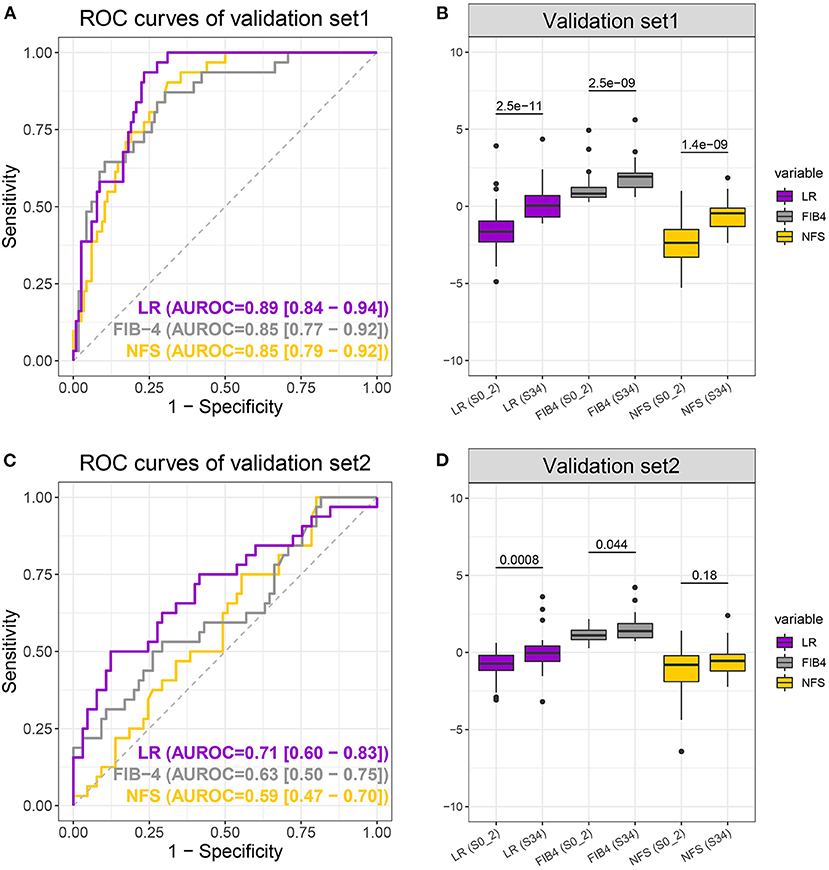
Figure 4. Receiver operating characteristic curves (A,C) of the logistic regression (LR) model (purple), FIB-4 (gray), and non-alcoholic fatty liver disease fibrosis scores (NFS) (yellow) and boxplot (B,D) of LR, FIB-4, and NFS scores when differentiating S0–2 vs. S3–4 on the validation sets. P-values were calculated using the Wilcoxon test.
Model Independence Evaluation
The 14 parameters selected by step 1 were distinctly different between early and advanced fibrosis in the discovery set and were possible confounders for fibrosis staging. Among them, AST, HbA1c, PLT, AST/ALT ratio, and sex were not chosen in our LR model. Hence, logistic regression was applied to the independent assessment of the LR score for these confounders (Table 3). The crude OR (95% CI) of the LR score was 2.718 (2.225–3.384) in the discovery set, 3.545 (2.258–6.120) in validation set 1, and 2.466 (1.461–4.739) in validation set 2, with all p < 0.05. After adjusting for AST, HbA1c, PLT, AST/ALT ratio, and sex, the LR score was still statistically significant (p < 0.05) in the discovery and validation sets, indicating the independence of our model.
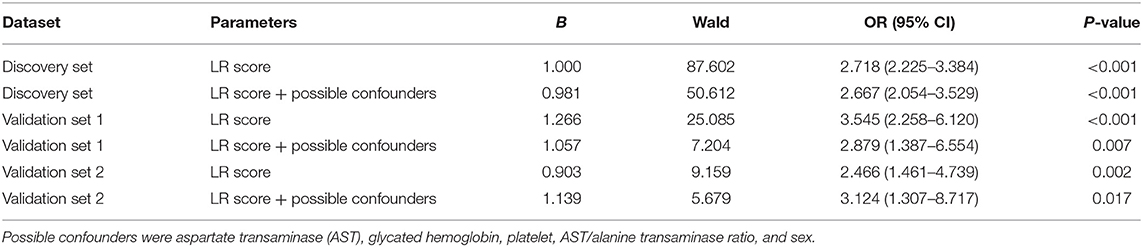
Table 3. Results of logistic regression (LR) with the LR score only and the LR score + possible confounders.
Performance Comparison With Other Machine Learning Methods
Two machine learning models, an RF and a GB model, were constructed using the optimal parameter set and the discovery set and then tested by the validation sets. The auROC, auPR, and sensitivity (when specificity was 0.8) of the GB model were 0.83, 0.63, and 0.70, respectively, for the discovery set, 0.83, 0.54, and 0.74, respectively, for validation set 1, and 0.71, 0.60, and 0.47, respectively, for validation set 2. The auROC, auPR, and sensitivity of the RF model were 0.83, 0.76, and 0.68, respectively, for the discovery set, 0.89, 0.59, and 0.81, respectively, for validation set 1, and 0.69, 0.58, and 0.41, respectively, for validation set 2. Comparatively, the LR model had better or comparable auROC, auPR, and sensitivity values than the GB and RF models in the discovery and validation sets.
Discussion
NAFLD has become a significant health problem worldwide; therefore, accurate and reliable assessment of the severity in the NAFLD population is increasingly crucial for treatment decisions and long-term monitoring. A fundamental purpose in the control and management of NAFLD patients is to distinguish those who are more likely to develop significant fibrosis as recently emphasized in the American Association for the Study of Liver Diseases practice guidance, the European Association for the Study of the Liver guidelines, and the Chinese Society of Hepatology guidelines (13, 27, 28). Attempts to establish non-invasive approaches for the stratification of NAFLD patients have yielded various diagnostic panels, indices, and imaging modalities (8, 29, 30) that might be applied in lieu of liver biopsy.
In this study, an LR model was constructed to differentiate early and advanced fibrosis. First, three independent data sets with 784 participants from major ethnic groups in Southeast Asia (Chinese, Malay, and Indian) were used to assess the performance of our model. Our LR model shows admirable diagnostic performance in the discovery and validation sets, although the result in validation set 2 was slightly inferior to that in validation set 1. We carefully compared these data sets and believe that the following differences might lead to different performances: (1) In original studies, validation set 1 was collected for a fibrosis study, and validation set 2 was collected for a steatosis study. The collection criteria for validation set 1 were more similar to those of the discovery set; (2) The patients in validation set 2 were generally older than those in the discovery set and validation set 1; (3) The proportion of patients who had DM or IFG in validation set 2 (no/yes = 10:87) were quite different from that in the discovery set (233:307) and validation set 1 (67:80, Table 1 and Supplementary Table 1). Second, compared with the markers included in FIB-4 and NFS, three additional parameters, FBG, GGT, and TG, were used in our new model. These markers are routine medical test parameters and are also used in other serological diagnostic tools for staging fibrosis or for diagnosing steatosis in patients with NAFLD. Thus, the performance improvement did not come at the cost of the clinical burden. Third, the two-step parameter selection strategy is advanced and practical. In addition to the commonly used difference analysis, all possible combinations of parameters were involved. This is a time-consuming but necessary step to ensure the best solution. Fourth, the performance of our LR model was evaluated comprehensively. Its independence from other parameters was examined. Its diagnostic capability was comparable with some machine learning methods, although LR is sometimes also categorized as a machine learning method.
The limitations of our study include the following: (1) It is well-known that virus infection, NAFLD, heavy drinking, and abnormal immune systems are different etiologies of fibrosis. The patterns of blood parameters and the manner of fibrosis progression in NAFLD patients differ from those in patients with other etiologies. Therefore, our LR model cannot be used directly on other CLD patients. Investigations into different patterns of blood test parameters among CLD patients of various etiologies and the development of general diagnostic tools are ongoing; (2) Longitudinal studies are necessary to further validate the effectiveness and stability of the current findings as well as cross-sectional studies; (3) Our model was validated only by samples from Southeast Asia. Its performances in different data sets were slightly different. Further validation in more and diverse populations is necessary prior to clinical application.
In summary, we constructed a scoring model for the distinction of advanced fibrosis in NAFLD patients. We validated its overall superiority to existing indices and its independence from possible confounders in two independent data sets. The online tool LiveFbr was developed, through which NAFLD patients can obtain auxiliary results of their liver fibrosis severity.
Data Availability Statement
The datasets presented in this study can be found in online repositories. The names of the repository/repositories and accession number(s) can be found below: https://github.com/chentianlu/LiveFbr.
Ethics Statement
The studies involving human participants were reviewed and approved by Research Ethics Committee of Zhongshan Hospital affiliated to Fudan University. The patients/participants provided their written informed consent to participate in this study.
Author Contributions
XG and TC were the principal investigators and designed the study. HB, XG, and WC provided biospecimens and clinical data. TC and CS conducted the data analysis, implemented the methodology, and developed the web tool. HY, XZ, XC, MX, and XS gathered the data and discussed the outcomes. XH was the pathologist. TC, CS, and GX prepared the original draft. WJ, GX, TC, CS, TS, XG, HB, and WC reviewed and edited the final manuscript. All authors contributed to the article and approved the submitted version.
Funding
This study was funded by the National Key Research and Development Program of China (2019YFA0802300 and 2017YFC0906800), the National Natural Science Foundation of China (31972935), the Shenzhen Science, Technology and Innovation Commission [2020(82)], and the Shanghai Municipal Science and Technology Major Project (2017SHZDZX01).
Conflict of Interest
GX was employed by Human Metabolomics Institute Inc. The remaining authors declare that the research was conducted in the absence of any commercial or financial relationships that could be construed as a potential conflict of interest.
Acknowledgments
We thank the participating hospitals for their assistance in data acquisition and sample collection.
Supplementary Material
The Supplementary Material for this article can be found online at: https://www.frontiersin.org/articles/10.3389/fmed.2021.637652/full#supplementary-material
References
1. Asrani SK, Devarbhavi H, Eaton J, Kamath PS. Burden of liver diseases in the world. J Hepatol. (2019) 70:151–71. doi: 10.1016/j.jhep.2018.09.014
2. Younossi ZM, Koenig AB, Abdelatif D, Fazel Y, Henry L, Wymer M. Global epidemiology of non-alcoholic fatty liver disease-Meta-analytic assessment of prevalence, incidence, and outcomes. Hepatology. (2016) 64:73–84. doi: 10.1002/hep.28431
3. Charlton M. Non-alcoholic fatty liver disease: a review of current understanding and future impact. Clin Gastroenterol Hepatol. (2004) 2:1048–58. doi: 10.1016/s1542-3565(04)00440-9
4. Sesti G, Sciacqua A, Fiorentino TV, Perticone M, Succurro E, Perticone F. Association between non-invasive fibrosis markers and cardio-vascular organ damage among adults with hepatic steatosis. PLoS ONE. (2014) 9:e104941. doi: 10.1371/journal.pone.0104941
5. Regev A, Berho M, Jeffers LJ, Milikowski C, Molina EG, Pyrsopoulos NT, et al. Sampling error and intraobserver variation in liver biopsy in patients with chronic HCV infection. Am J Gastroenterol. (2002) 97:2614–8. doi: 10.1111/j.1572-0241.2002.06038.x
6. Park SY, Kang KH, Park JH, Lee JH, Cho CM, Tak WY, et al. Clinical efficacy of AST/ALT ratio and platelet counts as predictors of degree of fibrosis in HBV infected patients without clinically evident liver cirrhosis. Korean J Gastroenterol. (2004) 43:246–51
7. Wai CT, Greenson JK, Fontana RJ, Kalbfleisch JD, Marrero JA, Conjeevaram HS, et al. A simple non-invasive index can predict both significant fibrosis and cirrhosis in patients with chronic hepatitis C. Hepatology. (2003) 38:518–26. doi: 10.1053/jhep.2003.50346
8. Sterling RK, Lissen E, Clumeck N, Sola R, Correa MC, Montaner J, et al. Development of a simple non-invasive index to predict significant fibrosis in patients with HIV/HCV coinfection. Hepatology. (2006) 43:1317–25. doi: 10.1002/hep.21178
9. Angulo P, Hui JM, Marchesini G, Bugianesi E, George J, Farrell GC, et al. The NAFLD fibrosis score: a non-invasive system that identifies liver fibrosis in patients with NAFLD. Hepatology. (2007) 45:846–54. doi: 10.1002/hep.21496
10. Cales P, Boursier J, Ducancelle A, Oberti F, Hubert I, Hunault G, et al. Improved fibrosis staging by elastometry and blood test in chronic hepatitis C. Liver Int. (2014) 34:907–17. doi: 10.1111/liv.12327
11. Mansoor S, Collyer E, Alkhouri N. A comprehensive review of non-invasive liver fibrosis tests in pediatric non-alcoholic fatty liver disease. Curr Gastroenterol Rep. (2015) 17:23. doi: 10.1007/s11894-015-0447-z
12. Castera L, Friedrich-Rust M, Loomba R. Non-invasive assessment of liver disease in patients with non-alcoholic fatty liver disease. Gastroenterology. (2019) 156:1264–81.e4. doi: 10.1053/j.gastro.2018.12.036
13. Chalasani N, Younossi Z, Lavine JE, Charlton M, Cusi K, Rinella M, et al. The diagnosis and management of non-alcoholic fatty liver disease: practice guidance from the American Association for the Study of Liver Diseases. Hepatology. (2018) 67:328–57. doi: 10.1002/hep.29367
14. Unalp-Arida A, Ruhl CE. Liver fibrosis scores predict liver disease mortality in the United States population. Hepatology. (2017) 66:84–95. doi: 10.1002/hep.29113
15. Le MH, Devaki P, Ha NB, Jun DW, Te HS, Cheung RC, et al. Prevalence of non-alcoholic fatty liver disease and risk factors for advanced fibrosis and mortality in the United States. PLoS ONE. (2017) 12:e0173499. doi: 10.1371/journal.pone.0173499
16. Yoshihisa A, Sato Y, Yokokawa T, Sato T, Suzuki S, Oikawa M, et al. Liver fibrosis score predicts mortality in heart failure patients with preserved ejection fraction. ESC Heart Fail. (2018) 5:262–70. doi: 10.1002/ehf2.12222
17. Berry SE, Valdes AM, Drew DA, Asnicar F, Mazidi M, Wolf J, et al. Human postprandial responses to food and potential for precision nutrition. Nat Med. (2020) 26:964–73. doi: 10.1038/s41591-020-0934-0
18. Cammarota G, Ianiro G, Ahern A, Carbone C, Temko A, Claesson MJ, et al. Gut microbiome, big data and machine learning to promote precision medicine for cancer. Nat Rev Gastroenterol Hepatol. (2020) 17:635–48. doi: 10.1038/s41575-020-0327-3
19. Oh TG, Kim SM, Caussy C, Fu T, Guo J, Bassirian S, et al. A universal gut-microbiome-derived signature predicts cirrhosis. Cell Metab. (2020) 32:878–88.e6. doi: 10.1016/j.cmet.2020.06.005
20. Wei R, Wang J, Wang X, Xie G, Wang Y, Zhang H, et al. Clinical prediction of HBV and HCV related hepatic fibrosis using machine learning. EBioMedicine. (2018) 35:124–32. doi: 10.1016/j.ebiom.2018.07.041
21. Xie G, Wang X, Wei R, Wang J, Zhao A, Chen T, et al. Serum metabolite profiles are associated with the presence of advanced liver fibrosis in Chinese patients with chronic hepatitis B viral infection. BMC Med. (2020) 18:144. doi: 10.1186/s12916-020-01595-w
22. Bedossa P, Consortium FP. Utility and appropriateness of the fatty liver inhibition of progression (FLIP) algorithm and steatosis, activity, and fibrosis (SAF) score in the evaluation of biopsies of non-alcoholic fatty liver disease. Hepatology. (2014) 60:565–75. doi: 10.1002/hep.27173
23. Chan WK, Nik Mustapha NR, Mahadeva S. A novel 2-step approach combining the NAFLD fibrosis score and liver stiffness measurement for predicting advanced fibrosis. Hepatol Int. (2015) 9:594–602. doi: 10.1007/s12072-014-9596-7
24. Harry S, Lai LL, Nik Mustapha NR, Abdul Aziz YF, Vijayananthan A, Rahmat K, et al. Volumetric liver fat fraction determines grade of steatosis more accurately than controlled attenuation parameter in patients with non-alcoholic fatty liver disease. Clin Gastroenterol Hepatol. (2020) 18:945–53.e2. doi: 10.1016/j.cgh.2019.08.023
25. Kleiner DE, Brunt EM, Van Natta M, Behling C, Contos MJ, Cummings OW, et al. Design and validation of a histological scoring system for non-alcoholic fatty liver disease. Hepatology. (2005) 41:1313–21. doi: 10.1002/hep.20701
26. Biomarkers Definitions Working Group. Biomarkers and surrogate endpoints: preferred definitions and conceptual framework. Clin Pharmacol Ther. (2001) 69:89–95. doi: 10.1067/mcp.2001.113989
27. European Association for the Study of the Liver, European Association for the Study of Diabetes, European Association for the Study of Obesity. EASL-EASD-EASO Clinical Practice Guidelines for the management of non-alcoholic fatty liver disease. J Hepatol. (2016) 64:1388–402. doi: 10.1016/j.jhep.2015.11.004
28. National Workshop on Fatty Liver and Alcoholic Liver Disease, Chinese Society of Hepatology, Chinese Medical Association and Fatty Liver Expert Committee, Chinese Medical Doctor Association. Guidelines of prevention and treatment for non-alcoholic fatty liver disease: a 2018 update. Zhonghua Gan Zang Bing Za Zhi. (2018) 26:195–203. doi: 10.3760/cma.j.issn.1007-3418.2018.03.008
29. Imbert-Bismut F, Ratziu V, Pieroni L, Charlotte F, Benhamou Y, Poynard T. Biochemical markers of liver fibrosis in patients with hepatitis C virus infection: a prospective study. Lancet. (2001) 357:1069–75. doi: 10.1016/s0140-6736(00)04258-6
Keywords: NAFLD, hepatic fibrosis, advanced fibrosis, FIB-4, NFS, logistic regression
Citation: Sang C, Yan H, Chan WK, Zhu X, Sun T, Chang X, Xia M, Sun X, Hu X, Gao X, Jia W, Bian H, Chen T and Xie G (2021) Diagnosis of Fibrosis Using Blood Markers and Logistic Regression in Southeast Asian Patients With Non-alcoholic Fatty Liver Disease. Front. Med. 8:637652. doi: 10.3389/fmed.2021.637652
Received: 04 December 2020; Accepted: 22 January 2021;
Published: 23 February 2021.
Edited by:
Kun Qian, The University of Tokyo, JapanReviewed by:
Weipeng Jiang, Shenzhen University General Hospital, ChinaQiuqiang Kong, University of Surrey, United Kingdom
Ruolan Huang, Shenzhen University General Hospital, China
Copyright © 2021 Sang, Yan, Chan, Zhu, Sun, Chang, Xia, Sun, Hu, Gao, Jia, Bian, Chen and Xie. This is an open-access article distributed under the terms of the Creative Commons Attribution License (CC BY). The use, distribution or reproduction in other forums is permitted, provided the original author(s) and the copyright owner(s) are credited and that the original publication in this journal is cited, in accordance with accepted academic practice. No use, distribution or reproduction is permitted which does not comply with these terms.
*Correspondence: Guoxiang Xie, eGllZ3VveGlhbmdAaG1pYmlvdGVjaC5jb20=; Hua Bian, Ymlhbmh1YWVyQDEyNi5jb20=; Tianlu Chen, Y2hlbnRpYW5sdUBzanR1LmVkdS5jbg==
†These authors have contributed equally to this work and share first authorship