 Jianguo Zhang
 Xing Huang
 Daoyin Ding4
 Wenrong Xu
 Zhimin Tao
- 1Jiangsu Province Key Laboratory of Medical Science and Laboratory Medicine, School of Medicine, Jiangsu University, Zhenjiang, China
- 2Department of Critical Care Medicine, The Affiliated Hospital, Jiangsu University, Zhenjiang, China
- 3Department of Urology, Center for Evidence-Based and Translational Medicine, Zhongnan Hospital of Wuhan University, Wuhan, China
- 4Department of Critical Care Medicine, The First People's Hospital of Jiangxia District, Wuhan, China
Background: Amid the coronavirus disease 2019 (COVID-19) pandemic, we analyzed clinical characteristics of acute lung injury (ALI) in COVID-19 patients and reported their similarity and dissimilarity to those of non-COVID-19 patients in the intensive care unit (ICU).
Methods: We reported on 90 COVID-19 and 130 non-COVID-19 ALI patients in the ICUs of multiple centers. Demographic data, medical histories, laboratory findings, and radiological images were analyzed and compared between the two cohorts and within each cohort between survivors and non-survivors. For ALI survivors, clinical characteristics before and after treatment were also compared.
Findings: Aberrations in blood parameters, such as leukocytosis, neutrophilia, and thrombocytopenia, were observed in both cohorts. More characteristic abnormalities, including significantly higher red cell distribution width (RDW), C-reactive proteins, and lactic dehydrogenase (LDH) but lower troponin (TnT) and procalcitonin, were observed in the COVID-19 cohort than in the non-COVID-19 cohort, whereas D-dimer levels showed a similar elevation in both cohorts. The COVID-19 cohort also showed more diversified CT patterns where severe features such as consolidations and crazy paving patterns were more frequently observed. Multivariate analysis indicated that age, fever symptom, prothrombin time, procalcitonin, partial pressure of carbon dioxide, oxygenated hemoglobin, and crazy paving patterns in CT scans were independent risk factors associated with COVID-19.
Interpretation: Comparison of ALI characteristics between COVID-19 and non-COVID-19 patients in the ICU setting provided insight into the pathogenesis of ALI induced by different risk factors, suggesting distinct treatment plans.
Background
Following the novel viral pneumonia that broke out in December 2019, the responsible pathogen was identified as severe acute respiratory syndrome (SARS) coronavirus 2 (SARS-CoV-2), and the illness was later named as coronavirus disease 2019 (COVID-19) (1). Strikingly, as of November 10, 2020, COVID-19 has swept across the world, infecting over 50 million people with a death rate exceeding 2.5% (2). With no valid treatment, the COVID-19 pandemic posed an unprecedented challenge to global public health.
Now, we learn that COVID-19 is far more than a typical pulmonary disease. Nevertheless, the highly infective SARS-CoV-2 is mainly transmitted via aerosol (3) with the infection beginning predominantly in the lungs, where acute lung injury (ALI) progressed as the illness worsened (4). ALI can develop into acute respiratory distress syndrome (ARDS) as hypoxemia worsens, leading to a high mortality rate among severe ALI patients (5). Studies in the early period of the COVID-19 breakout identified a 67–85% mortality in patients admitted to intensive care units (ICUs), which was attributed to ARDS (6–8). In contrast, general ARDS mortality in ICU patients was estimated as 35.3% (9). Moreover, ARDS mortality after ICU admission in SARS patients was 52.2% (10).
In this study, we focused on the comparison of ALI/ARDS characteristics between COVID-19 and non-COVID-19 patients in the ICU scenario, looking for insight into the heightened death incidence of COVID-19-induced ALI and propose an efficacious treatment plan.
Methods
Study Design
In this retrospective study, we reported 90 COVID-19 ALI patients (admitted between January 2020 and April 2020) and 130 non-COVID-19 ALI patients (admitted between January 2017 and October 2019) from different ICUs of multiple centers. For all selected ICU patients, they were diagnosed with ARDS upon ICU admission. ARDS was defined when positive end expiratory pressure (PEEP) or continuous positive airway pressure (CPAP) was >5 cmH2O and PaO2/FiO2 was <300 mmHg, following a classic Berlin Definition (11). Exclusion criteria were as follows: (1) pediatric patients <18 years old; (2) pregnant or lactating women patients; and (3) patients with malignant tumors, immunodeficiency, or terminal illness. A flowchart indicating the inclusion and exclusion criteria of patients is shown in Figure 1. As a result, 130 ALI patients admitted to the ICU in the Affiliated Hospital of Jiangsu University (TAHJU) were selected as the non-COVID-19 cohort. Patient consents were acquired, and the study was approved by the Medical Ethics Committee of TAHJU. In parallel, 90 ALI patients in the COVID-19 cohort were admitted to the First People's Hospital of Jiangxia District (TFPHJD) at Wuhan and Huangshi Central Hospital (HCH) at Huangshi city, both in the Hubei Province of China. ALI/ARDS management followed the published formal guidelines (12–14). Patient information remains anonymous and written consent was waived. The study was approved by the Ethics Commissions of TFPHJD and HCH. Patient data for comparison were gathered before and after stays in ICU. More details of the study design can be found in the Supplementary Material.
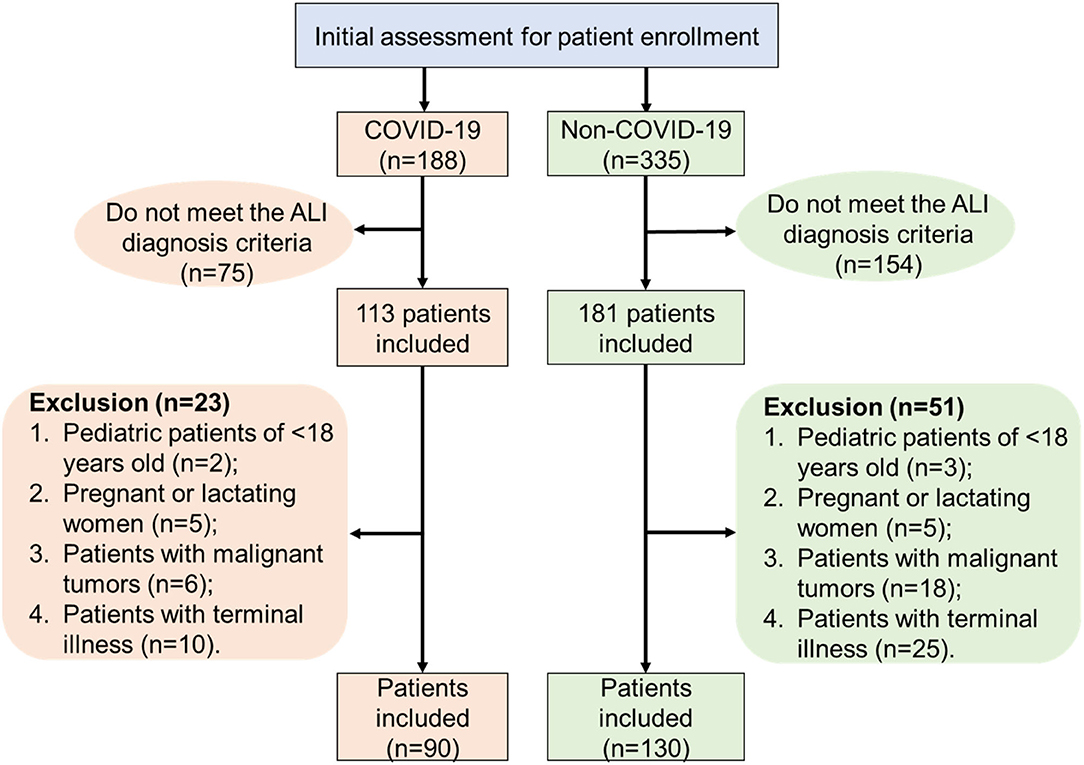
Figure 1. A flowchart that illustrates patient inclusion and exclusion criteria in the patient selection procedure.
Procedure
Details of patient procedures can be found in the Supplementary Material. In particular, all COVID-19 patients were received at TFPHJD and HCH and diagnosed following the standard procedure, and all COVID-19 ICU patients were admitted following published criteria (15) and treated by following the published guidelines during early outbreak (16). For patients with clinical symptoms, such as fever, cough, and radiological abnormality, throat swabs were gathered for SARS-CoV-2 RNA detection by gene sequencing or by real-time RT-PCR as previously reported (7).
Statistical Analysis
The categorical variables were described as frequency rates and percentages, and continuous variables were applied to describe the median and interquartile range (IQR) values. All data were collected and compared between the COVID-19 cohort and the non-COVID-19 cohort. Comparison of continuous variables between the two cohorts was analyzed with Mann–Whitney test, and c2 test was used to compare the categorical variables. These statistical methods followed a published method (17), and methodological details can be found in the Supplementary Material. For key variables with a p < 0.05 in the univariate analysis, multivariate logistic regression analysis was performed to explore the independent risk factors associated with either the COVID-19 or the non-COVID-19 cohort. A p < 0.05 was considered statistically significant.
Results
A total of 220 ICU patients were hospitalized, namely, a COVID-19 cohort of 90 and a non-COVID-19 (non-viral) cohort of 130. Median age was 68.0 (IQR: 57.0–76.0); 33.2% were female and 31.8% had a history of smoking (Table 1). The median ICU stay was 13 days, and the eventual mortality rate reached 44.5%. Compared to the non-COVID-19 cohort, the COVID-19 cohort showed younger age, fewer male patients, shorter ICU stays, and higher death rate (p < 0.05), although smoking history had a similar effect on both cohorts; 74.5% of patients had comorbidity, with the COVID-19 cohort (65.5%) having a significantly lower proportion of patients with comorbidity than the non-COVID-19 cohort (80.8%). Hypertension, diabetes, bronchitis, and cardiovascular disease were the most common comorbidities. The frequency of each comorbidity showed no significant difference between the two cohorts. Despite different disease pathogeneses, patients in both cohorts experienced similar symptoms, including cough, fever, dyspnea, expectoration, fatigue, and vomiting (Table 1). Notably, the COVID-19 cohort had significantly more patients with fever but fewer showing expectoration. In our previous study, significantly fewer COVID-19 patients experienced expectoration than influenza patients despite sharing flu-like symptoms (17).
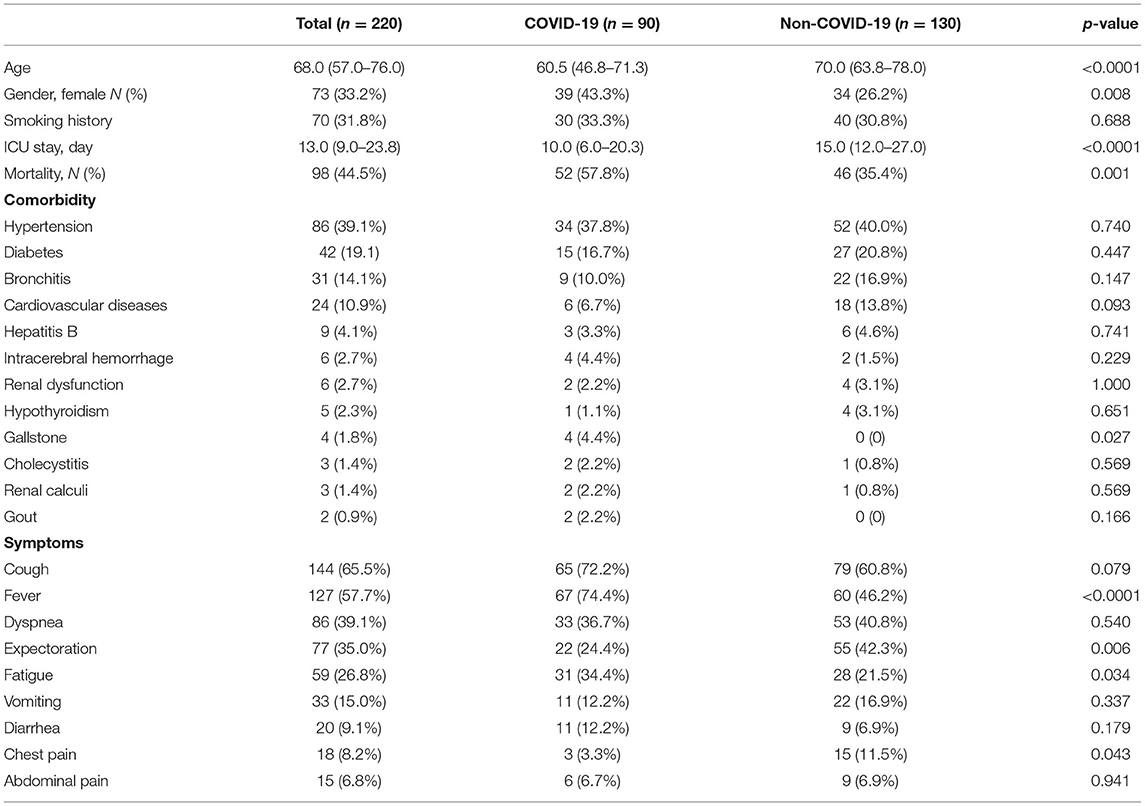
Table 1. Demographic data, medical history, and clinical symptoms of 220 ALI patients.
Baseline blood characteristics for all patients upon ICU admission are shown in Table 2. Compared to the non-COVID-19 cohort, the COVID-19 cohort showed a higher proportion of patients with leukocytosis or thrombocytopenia, but a lower proportion with neutrophilia or monocytosis. Similarly, both cohorts exhibited an overwhelmingly low red blood cell count and low levels of hemoglobin or hematocrit, indicating serious anemia in ALI patients regardless of pathogenesis. Nevertheless, a notably higher proportion of COVID-19 patients with elevated values of red cell distribution width (RDW) compared with that of non-COVID-19 patients was found, establishing a distinctive feature of COVID-19 infection. This finding was consistent with another report (18). For coagulation factors, abnormally increased prothrombin time, activated partial thromboplastin time, thrombin time, D-dimer level, international normalized ratio, and decreased fibrinogen level were found in a substantial number of ALI patients in both cohorts. Among them, D-dimer elevation has been reported to correlate with the severity of COVID-19 (19, 20). In our study, most ALI patients showed heightened D-dimer levels, but these were indistinguishable between the COVID-19 or non-COVID-19 cohorts. In addition, ALI patients showed reduced protein and ionic concentrations, and augmented levels of many metabolic proteins and enzymatic biomarkers (Table 2), including C-reactive proteins (CRPs), bilirubin, ALT, AST, BUN, LDH, and CPK. Among them, compared to the non-COVID-19 cohort, COVID-19 patients demonstrated much higher levels of CRP and LDH, but a dramatically lower level of TnT and procalcitonin.
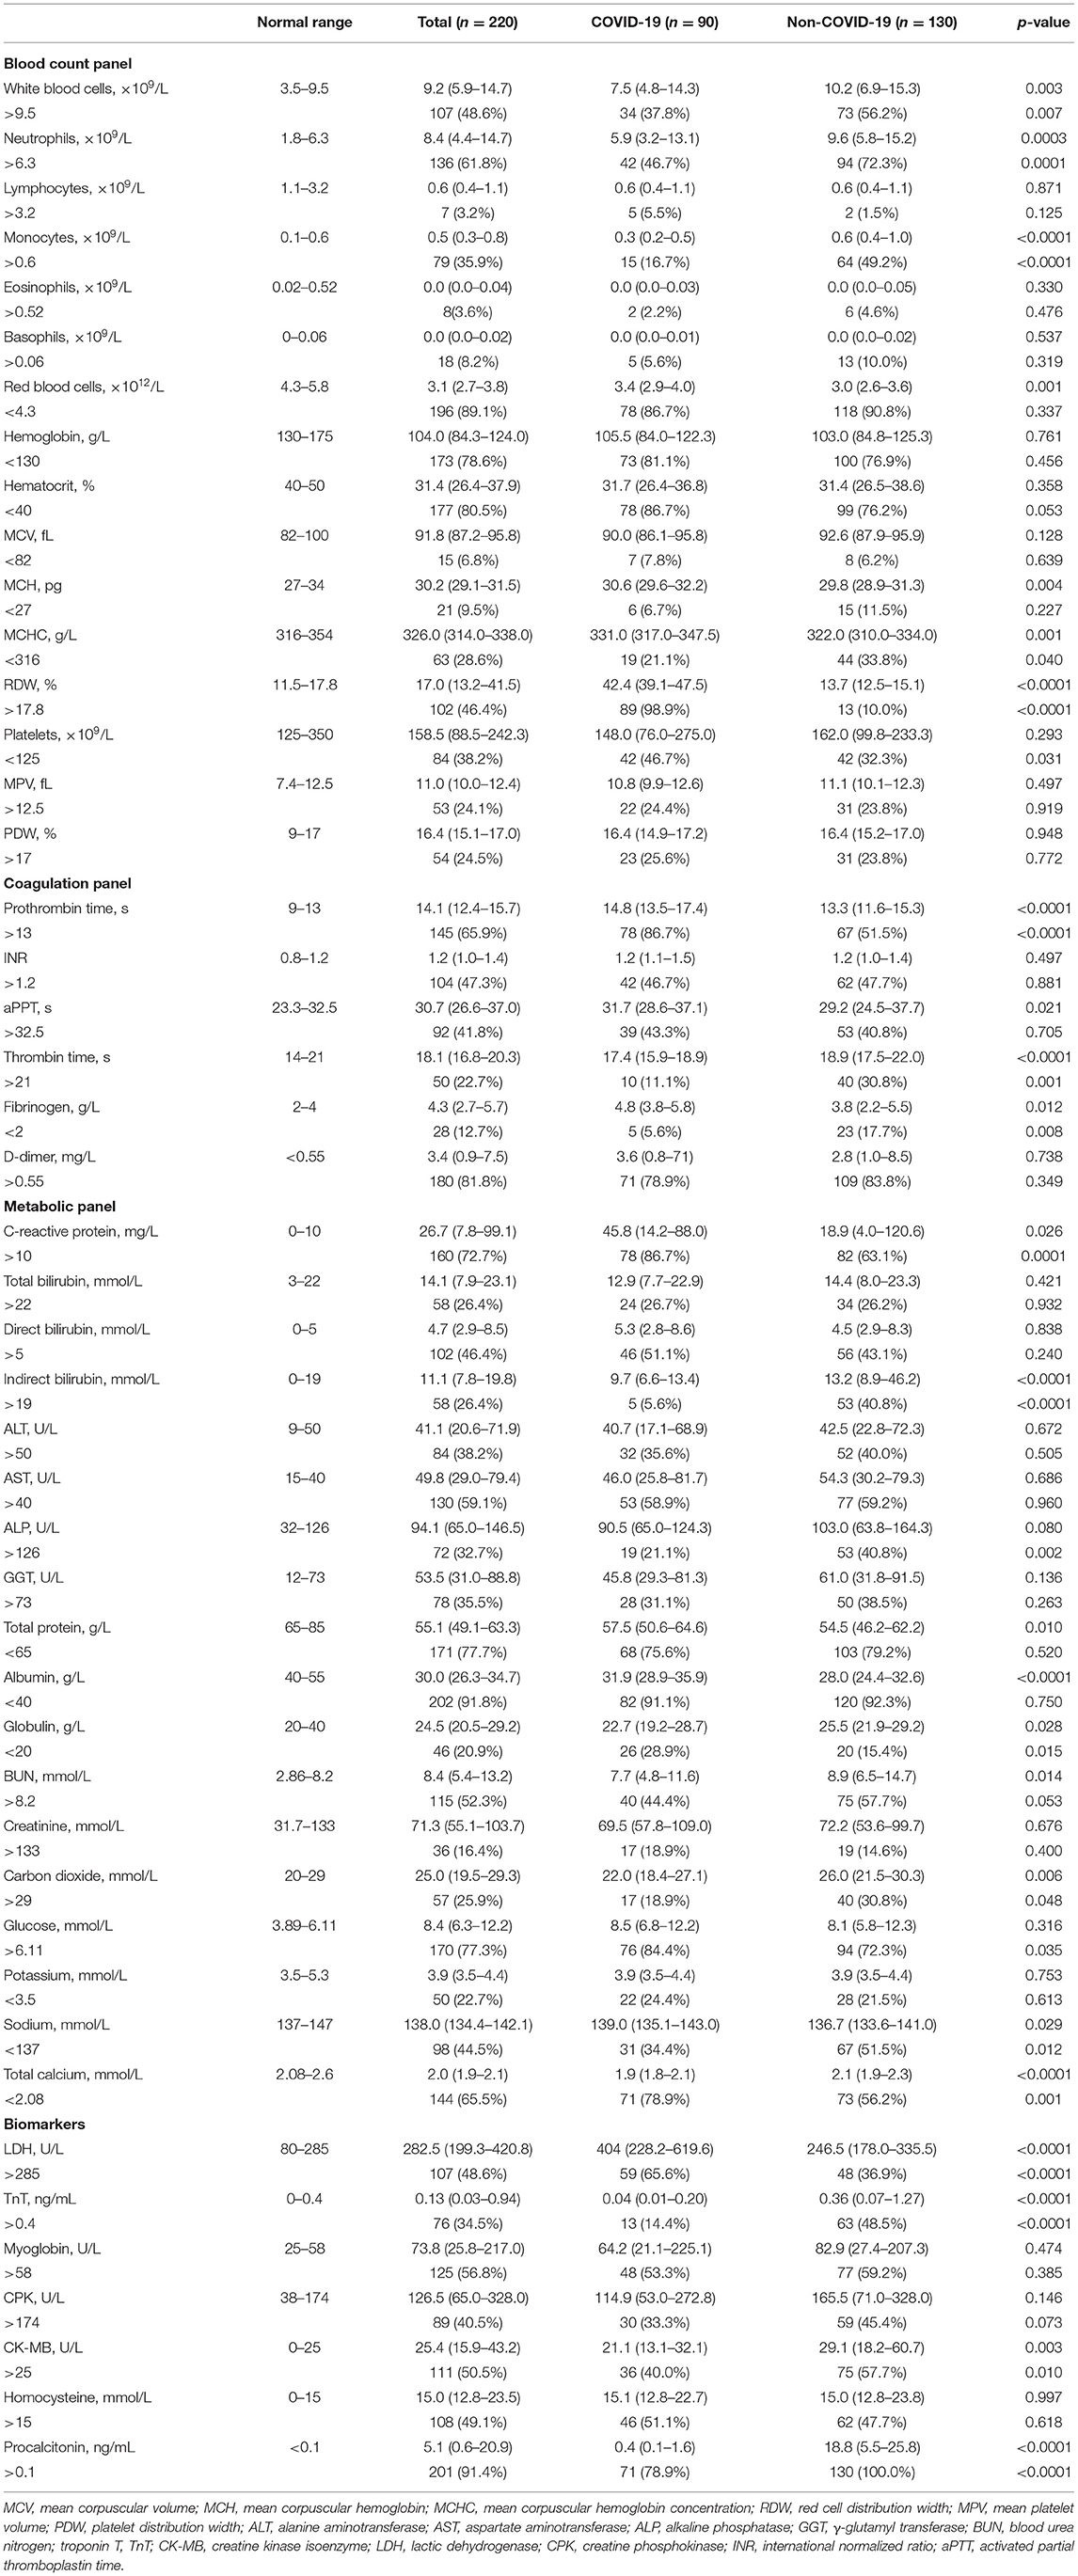
Table 2. Laboratory testing results of ALI patients in the COVID-19 and non-COVID-19 cohorts.
Next, arterial blood gas profiles were examined for all ICU ALI patients (Table 3). Compared to the non-COVID-19 cohort, the COVID-19 cohort exhibited similar levels of blood parameters such as acidity and base excess but significantly lower levels of actual bicarbonate, partial pressure of carbon dioxide or oxygen, oxygen saturation, and oxygenated hemoglobin. In parallel, CT examination was performed for all patients upon ICU admission and image patterns were compared between the two cohorts (Table 4). The COVID-19 cohort showed infections with substantially expanded lung involvement, with a significantly higher portion of ALI patients with bilateral lung involvement, multilobular lesions (with lobe number = 4, 5), and more lesions in each lobe. Specific CT patterns, such as consolidation and pleural effusion, were found significantly more frequently in the COVID-19 cohort. More characteristically, crazy paving patterns, linear opacity, rounded opacity, halo sign, nodules, tree-in-bud sign, air bronchogram, and interlobular septal thickening were more frequently observed in the COVID-19 cohort than the non-COVID-19 cohort, highlighting explicit CT features caused by SARS-CoV-2 infection.
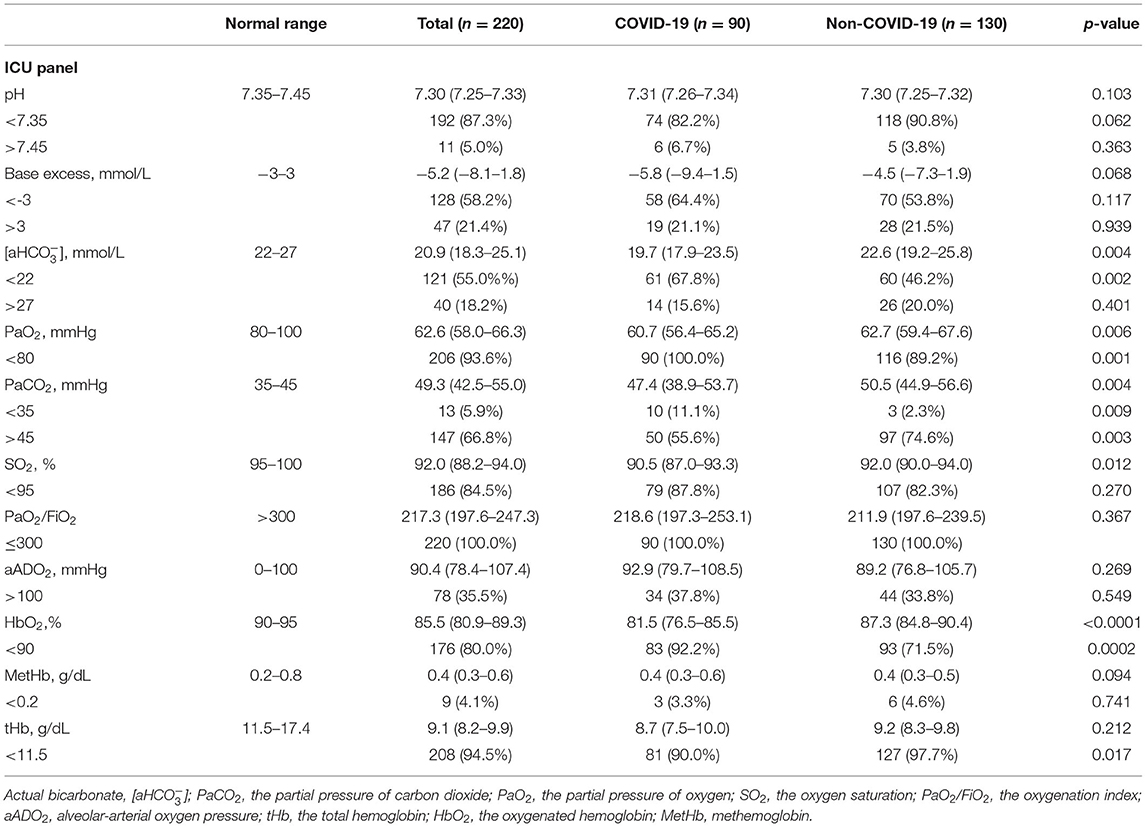
Table 3. Arterial blood gas profiles for ALI patients in the COVID-19 and non-COVID-19 cohorts.
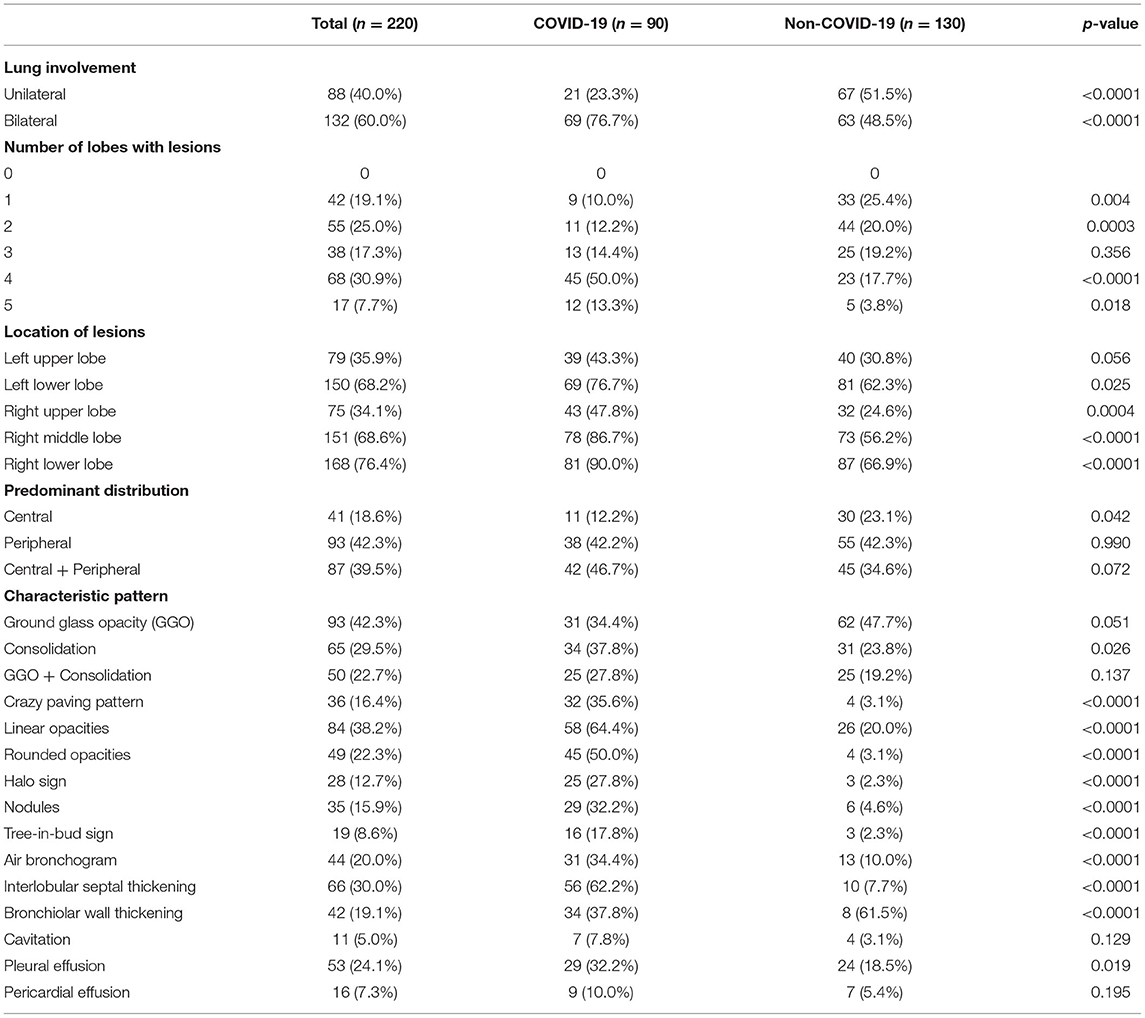
Table 4. Radiological findings of ALI patients in the COVID-19 and non-COVID-19 cohorts.
Variables with a p < 0.05 in the previous univariate analysis were put into multivariate logistic regression analysis, and results are shown in Table 5. It can be concluded that age, fever symptom, prothrombin time, procalcitonin, PaCO2, HbO2, and crazy paving patterns in CT scans are independent risk factors for differentiating COVID-19 ALI patients from non-COVID-19 ALI patients. Compared to the non-COVID-19 cohort, the COVID-19 cohort exhibited more inclination to younger population, experiencing fever, lengthened prothrombin time, and augmented lung involvement and crazy paving patterns in CT features. In addition, the COVID-19 patients also showed higher disposition to demonstrate abnormally lower levels of procalcitonin, PaCO2, and HbO2.
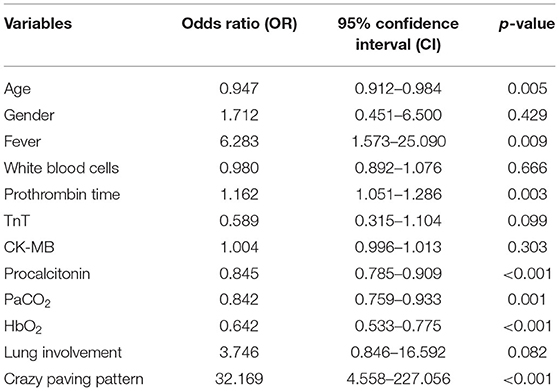
Table 5. Multivariate analysis of independent risk factors for differentiating COVID-19 ALI from non-COVID-19 ALI cases.
Critically ill ALI patients typically developed hypoxemia, dyspnea, and even respiratory failure requiring invasive or non-invasive oxygen support (Table 6). For the COVID-19 cohort, patients were treated with an array of antiviral drugs, including 16.7% with oseltamivir, 44.4% with arbidol, 53.3% with ribavirin, and 61.1% with α-interferon. They were also given a variety of antibiotics, including 18.9% with sulbactam/cefoperazone sodium, 38.9% with piperacillin/tazobactam sodium, 43.3% with imipenem/cilastatin, and 50.0% with moxifloxacin. For the non-COVID-19 cohort, 50% of patients were given imipenem/cilastatin, 32.3% ceftazidime, 30.0% piperacillin/sulbactam sodium, and 26.2% tigecycline. As a result, mortality was 57.8% in the COVID-19 cohort and 35.4% in the non-COVID-19 cohort.
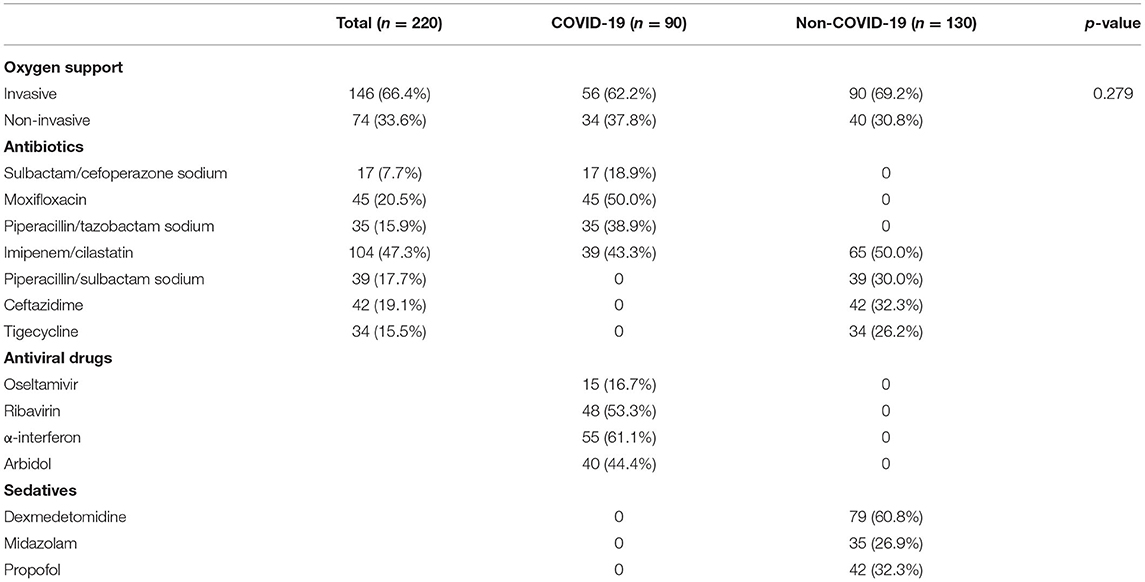
Table 6. Treatment of ALI patients in the COVID-19 and non-COVID-19 cohorts.
Within the COVID-19 cohort, baseline characteristics and radiological parameters were compared between survivors and non-survivors (Supplementary Tables 1–5). High age was found as a risk factor for mortality, while no substantial difference was found between survivors and non-survivors in their other demographic information, medical history, clinical symptoms, and CT patterns upon ICU admission. Between survivors and non-survivors, blood parameters were found to be similar; however, many arterial blood gas features were significantly different. Compared to survivors, non-survivors exhibited lower pH, PaO2, SO2, PaO2/FiO2, aADO2, HbO2, and tHb, but higher PaCO2, portending more severely impaired gas exchange in their virus-infected lungs.
In parallel, within the non-COVID-19 cohort, baseline characteristics and radiological parameters were compared between survivors and non-survivors (Supplementary Tables 6–10). Instead of high age, male gender was found to be a risk factor for mortality, while no substantial difference was found between survivors and non-survivors in their other demographic information, co-existing disease, clinical symptoms, and most CT patterns. Paradoxically, many blood parameters were found to be worse in survivors than in non-survivors upon ICU admission, such as aberrantly higher values of white blood cells, neutrophils, D-dimers, LDH, CRP, and procalcitonin, and lower values of PaO2/FiO2, aADO2, and HbO2. This could be associated with various pathogeneses of non-COVID-19 ALI (Supplementary Table 10), including direct and indirect lung infection, mostly triggered by sepsis, and leading to various impacts on the patient after ICU admission.
After different treatment plans were adopted in the two cohorts, all arterial blood gas profiles in ALI survivors recovered well and their laboratory parameters and CT characters were significantly ameliorated upon transfer to non-ICU wards (Supplementary Tables 11–16). However, in the COVID-19 cohort, RDW, D-dimer, CRP, and procalcitonin were similarly abnormal compared to before treatment, showing a slow recovery in those values due to COVID-19 infection despite such ICU patients having been discharged from critical care. In contrast, D-dimer, CRP, and procalcitonin were significantly improved in survivors of the non-COVID-19 cohort after treatment.
Discussion
As pulmonary injuries (e.g., pneumonia and aspiration) may cause direct damage to alveolar epithelium, extrapulmonary insults (e.g., systemic infection, trauma, or other non-pulmonary acute disease) could pose an indirect threat to the integrity of the capillary endothelium. Such impairment can lead to the production of pro-inflammatory cytokines, induction of cell death and leakage at intercellular junctions in the alveolar capillary membrane, and eventual migration of immune cells from microvessels into the alveolar airspace that initiates diffuse alveolar damage (DAD) (21). In the early stage of DAD, an exudative phase takes place where polymorphonuclear leukocytes (e.g., neutrophils and eosinophils), platelets, and plasma proteins in the alveolar capillary are recruited across the damaged ACM to flood interstitium and airspace, interacting with resident macrophages and forming edema (22). Consisting of cell debris, surfactant, cytokines, and other proteins, edema further promotes the formation of hyaline membrane that deposits along the alveolar walls and becomes characteristic of DAD, radiologically featured as patchy ground glass densities (23, 24). During this phase, the initial inflammation from primary insults are exacerbated, and gaseous exchange is seriously impeded.
Then, a proliferative phase follows as a self-repair mechanism when type II pneumocytes start to proliferate and differentiate into type I pneumocytes, to pump the edema into interstitium for drainage, to reproduce surfactants to lower pulmonary tension, and to summon macrophages to clear cell fragments (25, 26). As a result, the permeability barrier of the ACM may recover with improved oxygenation. Conversely, inability to clear alveolar fluid will lead to hypoxemia and hypercapnic acidosis resulting in acute respiratory failure.
In this study, compared to the COVID-19 cohort, the non-COVID-19 patients exhibited higher age, higher male ratio, longer ICU stay, and lower death rate, suggesting a higher incidence of non-viral ALI associated with older age and male gender, consistent with a previous report (5). While common clinical symptoms may include fever, dry cough, dyspnea, fatigue, and diarrhea for both cohorts, a much higher proportion of COVID-19 patients may experience fever but not expectoration.
ALI in the COVID-19 cohort is induced by SARS-CoV-2 infection, a direct pulmonary injury to the patients. In the non-COVID-19 (non-viral) cohort, due to the diversity of primary disease. ALI may be caused by trauma, surgery (non-thoracic or thoracic), and gastrointestinal bleeding (non-pulmonary sepsis), showing a mixture of extrapulmonary and pulmonary induction of acute injury. For hospitalized ALI patients, leading comorbidities include hypertension, diabetes, bronchitis, and cardiovascular diseases, indicating an elevated instability of ACM in those with compromised immune systems.
Besides commonly observed aberrations in blood parameters due to systemic infection, such as leukocytosis, neutrophilia, and thrombocytopenia, more characteristic abnormalities in COVID-19 ALI patients were noticed when compared to their non-COVID-19 counterparts, including significantly higher RDW, CRP, and LDH but lower TnT and procalcitonin, whereas D-dimer levels showed similar elevation between the two cohorts. Furthermore, debilitated oxygenation in arterial blood was noticed more commonly in the COVID-19 cohort than in the non-COVID-19 cohort. After individual treatment and discharge from ICU, those characteristic abnormalities were ameliorated in the non-COVID-19 cohort and to a much lesser degree in the COVID-19 cohort where the characteristic parameters remained markedly out of the normal range, demonstrating a more sluggish recovery from direct lung infection by SARS-CoV-2.
Thoracic CT scan has been recommended as a diagnostic standard of positive COVID-19 following initial nucleic acid testing of pathogen (15, 27). Both asymptomatic and symptomatic COVID-19 patients demonstrated abnormality in CT images, typically progressing from unilateral or bilateral and multifocal ground glass opacities (GGOs) to intensified consolidation, until formation of reticular pave pattern (28, 29). In our study, COVID-19 patients showed more diversified and complicated CT patterns, with severe features such as consolidations and crazy paving patterns in comparison with non-COVID-19 patients.
Possible correlation between specific genes and the incidence of ALI/ARDS was unclear, except that the angiotensin-converting enzyme 2 (ACE2), actively expressed in alveolar epithelial and endothelial cells, is responsible for adjusting alveolar permeability and repairing lung injury and was also identified as the viral entry receptor for SARS-CoV and SARS-CoV-2 (30, 31). In our study, the COVID-19 cohort showed more severe ALI/ARDS with higher mortality and slower recovery among survivors, possibly because inhaled SARS-CoV-2 directly bound and downregulated ACE2, further weakening the lungs (32, 33). To further differentiate COVID-19 ALI characteristics from non-COVID-19 cases, multivariate analysis indicated that age, fever symptom, prothrombin time, levels of procalcitonin, PaCO2 and HbO2, and crazy paving patterns in CT manifestations are independent risk factors.
Antibiotics were commonly used in the ICU for ALI patients due to possible bacterial (co)infection. Here, in the COVID-19 cohort, highly effective and broad-spectrum antibiotics were recommended for treatment along with antiviral drugs. At the same time, mechanical ventilation, whether invasive or non-invasive, was applied to support respiration. However, antibiotic treatment did not improve the survival of severe COVID-19 patients, consistent with a recent report (34). Moreover, early administration of antibiotics in severe COVID-19 patients may cause antibiotic resistance in the late stage of treatment (35). Invasive and non-invasive oxygen support by mechanical ventilation did not significantly influence the survival of non-COVID-19 patients. Invasive but not non-invasive mechanical ventilation caused a higher fatality rate in the COVID-19 cohort, as described in other reports (36, 37). This suggested that intubation could further damage lung function and aggravate the condition of critically ill COVID-19 patients, whereas simpler, non-invasive respiratory support should be prioritized. Even with limited understanding of COVID-19 during the beginning of pandemic, antiviral treatments (α-interferon, ribavirin, arbidol, and oseltamivir) applied in our COVID-19 cohort enabled efficacious clearance of SARS-CoV-2 and improved patient prognosis. Validated treatment plans against COVID-19 extend to remdesivir, chloroquine, corticosteroids, convalescent plasma, and monoclonal antibodies (38).
This study has several limitations. First, the sample size is small, which leads to a high variability, causing bias. In this retrospective study, we collected patient data from three regional hospitals, where a limited number of ALI patients had been admitted. Second, given a large set of variables studied but the relatively small size of the sample, the validity of multivariate analysis may be weakened, although it did yield useful information. Third, most blood parameters were not continuously monitored or recorded in the ICU settings. This may restrict our understanding toward the disease development and so limit our conclusion.
In conclusion, our study highlights the distinction in ALI characteristics between severe COVID-19 and non-COVID-19 patients and demonstrated the efficacy of our current therapeutic regimen in the ICU scenario through improved survival of critically ill ALI patients. This work will enhance our understanding of this life-threatening illness and help develop refined treatment regimens leading to better outcomes.
Data Availability Statement
The data analyzed in this study is subject to the following licenses/restrictions: Data available on request due to privacy/ethical restrictions. Requests to access these datasets should be directed to Zhimin Tao, anN1dGFvQHVqcy5lZHU=.cn.
Ethics Statement
The studies involving human participants were reviewed and approved by the Affiliated Hospital of Jiangsu University, Jiangxia First People's Hospital, Huangshi Central Hospital. The patients/participants provided their written informed consent to participate in this study.
Author Contributions
JiaZ and ZT conceived the idea and designed the study. JiaZ, XH, DD, JinZ, LX, ZH, and ZT contributed to the data acquisition, processing, and table preparation. JiaZ, WX, and ZT contributed to the manuscript writing. JiaZ, XH, and ZT contributed to the statistical analysis. All authors reviewed and approved the manuscript submission.
Funding
We are grateful for financial support from Jiangsu University.
Conflict of Interest
The authors declare that the research was conducted in the absence of any commercial or financial relationships that could be construed as a potential conflict of interest.
Publisher's Note
All claims expressed in this article are solely those of the authors and do not necessarily represent those of their affiliated organizations, or those of the publisher, the editors and the reviewers. Any product that may be evaluated in this article, or claim that may be made by its manufacturer, is not guaranteed or endorsed by the publisher.
Supplementary Material
The Supplementary Material for this article can be found online at: https://www.frontiersin.org/articles/10.3389/fmed.2021.666629/full#supplementary-material
References
1. World Health Organization. Naming the Coronavirus Disease (COVID-19) and the Virus That Causes it. WHO (2020).
3. Bourouiba L. Turbulent gas clouds and respiratory pathogen emissions: potential implications for reducing transmission of COVID-19. JAMA. (2020) 323:1837–8. doi: 10.1001/jama.2020.4756
4. Li L, Huang Q, Wang DC, Ingbar DH, Wang X. Acute lung injury in patients with COVID-19 infection. Clin Transl Med. (2020) 10:20–7. doi: 10.1002/ctm2.16
5. Rubenfeld GD, Caldwell E, Peabody E, Weaver J, Martin DP, Neff M, et al. Incidence and outcomes of acute lung injury. N Engl J Med. (2005) 353:1685–93. doi: 10.1056/NEJMoa050333
6. Chen T, Wu D, Chen H, Yan W, Yang D, Chen G, et al. Clinical characteristics of 113 deceased patients with coronavirus disease 2019: retrospective study. BMJ. (2020) 368:m1091. doi: 10.1136/bmj.m1091
7. Huang C, Wang Y, Li X, Ren L, Zhao J, Hu Y, et al. Clinical features of patients infected with 2019 novel coronavirus in Wuhan, China. Lancet. (2020) 395:497–506. doi: 10.1016/S0140-6736(20)30183-5
8. Yang X, Yu Y, Xu J, Shu H, Xia J, Liu H, et al. Clinical course and outcomes of critically ill patients with SARS-CoV-2 pneumonia in Wuhan, China: a single-centered, retrospective, observational study. Lancet Respir Med. (2020) 8:475–81. doi: 10.1016/S2213-2600(20)30079-5
9. Bellani G, Laffey JG, Pham T, Fan E, Brochard L, Esteban A, et al. Epidemiology, patterns of care, and mortality for patients with acute respiratory distress syndrome in intensive care units in 50 countries. JAMA. (2016) 315:788–800. doi: 10.1001/jama.2016.0291
10. Lew TW, Kwek TK, Tai D, Earnest A, Loo S, Singh K, et al. Acute respiratory distress syndrome in critically ill patients with severe acute respiratory syndrome. JAMA. (2003) 290:374–80. doi: 10.1001/jama.290.3.374
11. Force ADT, Ranieri VM, Rubenfeld GD, Thompson BT, Ferguson ND, Caldwell E, et al. Acute respiratory distress syndrome: the Berlin definition. JAMA. (2012) 307:2526–33. doi: 10.1001/jama.2012.5669
12. Chinese Society of Critical Care Medicine Chinese Medical Association. [Guidelines for management of acute lung injury/acute respiratory distress syndrome: an evidence-based update by the Chinese society of critical care medicine (2006)]. Zhongguo Wei Zhong Bing Ji Jiu Yi Xue. (2006) 18:706–10.
13. Griffiths MJD, Mcauley DF, Perkins GD, Barrett N, Blackwood B, Boyle A, et al. Guidelines on the management of acute respiratory distress syndrome. BMJ Open Respir Res. (2019) 6:e000420. doi: 10.1136/bmjresp-2019-000420
14. Papazian L, Aubron C, Brochard L, Chiche JD, Combes A, Dreyfuss D, et al. Formal guidelines: management of acute respiratory distress syndrome. Ann Intensive Care. (2019) 9:69. doi: 10.1186/s13613-019-0540-9
15. Li T. Diagnosis and clinical management of severe acute respiratory syndrome coronavirus 2 (SARS-CoV-2) infection: an operational recommendation of peking union medical college hospital (V2.0). Emerg Microbes Infect. (2020) 9:582–5. doi: 10.1080/22221751.2020.1735265
16. Peng F, Tu L, Yang Y, Hu P, Wang R, Hu Q, et al. Management and treatment of COVID-19: the Chinese experience. Can J Cardiol. (2020) 36:915–30. doi: 10.1016/j.cjca.2020.04.010
17. Zhang J, Ding D, Huang X, Zhang J, Chen D, Fu P, et al. Differentiation of COVID-19 from seasonal influenza: a multicenter comparative study. J Med Virol. (2020) 93:1512–9. doi: 10.1002/jmv.26469
18. Foy BH, Carlson JCT, Reinertsen E, Padros IVR, Pallares Lopez R, Palanques-Tost E, et al. Association of red blood cell distribution width with mortality risk in hospitalized adults with SARS-CoV-2 infection. JAMA Netw Open. (2020) 3:e2022058. doi: 10.1001/jamanetworkopen.2020.22058
19. Wang D, Hu B, Hu C, Zhu F, Liu X, Zhang J, et al. Clinical characteristics of 138 hospitalized patients with 2019 novel coronavirus-infected pneumonia in Wuhan, China. JAMA. (2020) 323:1061–9. doi: 10.1001/jama.2020.1585
20. Zhou F, Yu T, Du R, Fan G, Liu Y, Liu Z, et al. Clinical course and risk factors for mortality of adult inpatients with COVID-19 in Wuhan, China: a retrospective cohort study. Lancet. (2020) 395:1054–62. doi: 10.1016/S0140-6736(20)30566-3
21. Matthay MA, Zemans RL, Zimmerman GA, Arabi YM, Beitler JR, Mercat A, et al. Acute respiratory distress syndrome. Nat Rev Dis Primers. (2019) 5:18. doi: 10.1038/s41572-019-0069-0
22. Sweeney RM, Mcauley DF. Acute respiratory distress syndrome. Lancet. (2016) 388:2416–30. doi: 10.1016/S0140-6736(16)00578-X
23. Obadina ET, Torrealba JM, Kanne JP. Acute pulmonary injury: high-resolution CT and histopathological spectrum. Br J Radiol. (2013) 86:20120614. doi: 10.1259/bjr.20120614
24. Zompatori M, Ciccarese F, Fasano L. Overview of current lung imaging in acute respiratory distress syndrome. Eur Respir Rev. (2014) 23:519–30. doi: 10.1183/09059180.00001314
25. Olajuyin AM, Zhang X, Ji HL. Alveolar type 2 progenitor cells for lung injury repair. Cell Death Discov. (2019) 5:63. doi: 10.1038/s41420-019-0147-9
26. Wu A, Song H. Regulation of alveolar type 2 stem/progenitor cells in lung injury and regeneration. Acta Biochim Biophys Sin. (2020) 52:716–22. doi: 10.1093/abbs/gmaa052
27. Li Y, Xia L. Coronavirus disease 2019 (COVID-19): role of chest CT in diagnosis and management. AJR Am J Roentgenol. (2020) 214:1280–6. doi: 10.2214/AJR.20.22954
28. Shi H, Han X, Jiang N, Cao Y, Alwalid O, Gu J, et al. Radiological findings from 81 patients with COVID-19 pneumonia in Wuhan, China: a descriptive study. Lancet Infect Dis. (2020) 20:P425–34. doi: 10.1016/S1473-3099(20)30086-4
29. Zhou S, Wang Y, Zhu T, Xia L. CT features of coronavirus disease 2019 (COVID-19) pneumonia in 62 patients in Wuhan, China. AJR Am J Roentgenol. (2020) 214:1287–94. doi: 10.2214/AJR.20.22975
30. Acosta-Herrera M, Pino-Yanes M, Perez-Mendez L, Villar J, Flores C. Assessing the quality of studies supporting genetic susceptibility and outcomes of ARDS. Front Genet. (2014) 5:20. doi: 10.3389/fgene.2014.00020
31. Samavati L, Uhal BD. ACE2, much more than just a receptor for SARS-COV-2. Front Cell Infect Microbiol. (2020) 10:317. doi: 10.3389/fcimb.2020.00317
32. Ni W, Yang X, Yang D, Bao J, Li R, Xiao Y, et al. Role of angiotensin-converting enzyme 2 (ACE2) in COVID-19. Crit Care. (2020) 24:422. doi: 10.1186/s13054-020-03120-0
33. Silhol F, Sarlon G, Deharo JC, Vaïsse B. Downregulation of ACE2 induces overstimulation of the renin–angiotensin system in COVID-19: should we block the renin–angiotensin system? Hypertens Res. (2020) 43:854–6. doi: 10.1038/s41440-020-0476-3
34. Buetti N, Mazzuchelli T, Priore EL, Balmelli C, Llamas M, Pallanza M, et al. Early administered antibiotics do not impact mortality in critically ill patients with COVID-19. J Infect. (2020) 81:e148–9. doi: 10.1016/j.jinf.2020.06.004
35. Ginsburg AS, Klugman KP. COVID-19 pneumonia and the appropriate use of antibiotics. Lancet Glob Health. (2020) 8:e1453–4. doi: 10.1016/S2214-109X(20)30444-7
36. Hua J, Qian C, Luo Z, Li Q, Wang F. Invasive mechanical ventilation in COVID-19 patient management: the experience with 469 patients in Wuhan. Crit Care. (2020) 24:348. doi: 10.1186/s13054-020-03044-9
37. Lim ZJ, Subramaniam A, Reddy MP, Blecher G, Kadam U, Afroz A, et al. Case fatality rates for COVID-19 patients requiring invasive mechanical ventilation: a meta-analysis. Am J Respir Crit Care Med. (2020) 203:54–66. doi: 10.1164/rccm.202006-2405OC
Keywords: COVID-19, intensive care unit, acute lung injury, acute respiratory distress syndrome, treatment
Citation: Zhang J, Huang X, Ding D, Zhang J, Xu L, Hu Z, Xu W and Tao Z (2021) Comparative Study of Acute Lung Injury in COVID-19 and Non-COVID-19 Patients. Front. Med. 8:666629. doi: 10.3389/fmed.2021.666629
Received: 10 February 2021; Accepted: 28 June 2021;
Published: 16 August 2021.
Edited by:
Reinaldo Salomao, Federal University of São Paulo, BrazilReviewed by:
Ming Fang, Guangdong Academy of Medical Sciences, ChinaFelipe Dal Pizzol, Universidade Do Extremo Sul Catarinense, Brazil
Copyright © 2021 Zhang, Huang, Ding, Zhang, Xu, Hu, Xu and Tao. This is an open-access article distributed under the terms of the Creative Commons Attribution License (CC BY). The use, distribution or reproduction in other forums is permitted, provided the original author(s) and the copyright owner(s) are credited and that the original publication in this journal is cited, in accordance with accepted academic practice. No use, distribution or reproduction is permitted which does not comply with these terms.
*Correspondence: Zhimin Tao, anN1dGFvQHVqcy5lZHUuY24=