Abstract
Introduction: Glomerular hyperfiltration (GHF) is an early kidney injury. We investigated whether GHF is associated with arterial stiffness expressed by increase of brachial–ankle pulse wave velocity (baPWV) and pulse pressure (PP), and whether the coexistence of GHF and abnormal metabolism increases the risk of arterial stiffness.
Methods: In this prospective cohort study, 2,133 non-chronic kidney disease (CKD) participants aged ≥40 years were followed for a mean period of 3.3 years. The extent of arterial stiffness was expressed by measures of baPWV and PP. GHF was defined as eGFR exceeding the age- and sex-specific 90th percentile. Multivariate logistic regression models were used to assess the association between GHF/abnormal metabolism and increased baPWV/PP. The interaction indexes of GHF and abnormal metabolism on arterial stiffness were calculated based on the OR in a multivariate logistic regression model.
Results: GHF alone was not associated with increased baPWV or PP in all participants in this study. However, when GHF coexisted with abnormal metabolism, the risk of increased PP increased 3.23-fold [OR = 3.23(1.47–7.13)] compared with participants with normal filtration and normal metabolism, in which the interaction accounted for 55.1% of the total effect and 79.8% of the effect from GHF and abnormal metabolism. After subtracting the independent effects of GHF and abnormal metabolism, their combined effect still resulted in a 1.78-fold increase in PP.
Conclusion: GHF could interact with abnormal metabolism to significantly enhance arterial stiffness. Since abnormal metabolism commonly exists in the general population, even slight changes in renal function should be distinguished to prevent arterial stiffness risk.
Introduction
Chronic kidney disease (CKD) is an identified risk factor for cardiovascular diseases (CVDs) and independent of traditional CVD risk factors (1). Decline of eGFR in CKD patients might cause micro- and macrovascular disease through arterial stiffness, which is considered as a possible mechanism of cardiorenal connection (2). GHF is an intermediate process of eGFR from normal to decline. However, whether GHF could increase the risk of arterial stiffness as eGFR decline does is not clear (3, 4).
Molecular studies indicated that the primary pathology causing GHF included activation of the renin angiotensin aldosterone system (RAAS) (5) and sympathetic nervous system (6), as well as oxidative stress and systemic inflammation, which may drive vascular lesions and lead to arterial stiffness (7). On the basis of these studies, we postulated that GHF may cause CVDs by increasing arterial stiffness. Abnormal metabolism is an important risk factor for inflammation, which could also be able to aggravate arterial stiffness (8). Abnormal metabolism is highly prevalent in the general population. However, When GHF and abnormal metabolism coexist, whether they could interact to enhance arterial stiffness is not clear.
Brachial–ankle pulse wave velocity (baPWV) and pulse pressure (PP) are the early clinical manifestation of pathological alteration of blood vessels and CVDs, both of them are indicators of arterial stiffness (9, 10). In this study, we used baPWV and PP as indicators to examine the influence of GHF and abnormal metabolism on arterial stiffness. We also investigated the influence of coexistence of GHF and abnormal metabolism on arterial stiffness.
Methods
Study Design and Participants
The survey Risk Evaluation of Cancers in Chinese Diabetic Individuals (REACTION) is an on-going study (11). The purpose of REACTION is to demonstrate the association between diabetes and cancer in the Chinese population. Considering the representativeness of the general population in China, this study selected 25 local communities in different regions of China based on geographic area, degree of urbanization, and economic development. Pingguoyuan communities, Beijing, China, is a single city center in the REACTION study. From December 2011 to August 2012, 10,216 participants aged 40 years or over were enrolled from the Pingguoyuan communities of Beijing and the first follow-up was conducted 3 years later. The flow chart of this study is shown in Figure 1, we excluded the following participants: (1) previous kidney diseases, (2) previous CVDs, including myocardial infarction, stroke, and coronary artery disease, (3) eGFR <90 mL/min/1.73 m2, (4) baseline baPWV and PP in the upper quartile, and (5) incomplete information on baPWV or PP or other important covariates. Thus, 2,133 participants were finally included in the analysis.
Figure 1
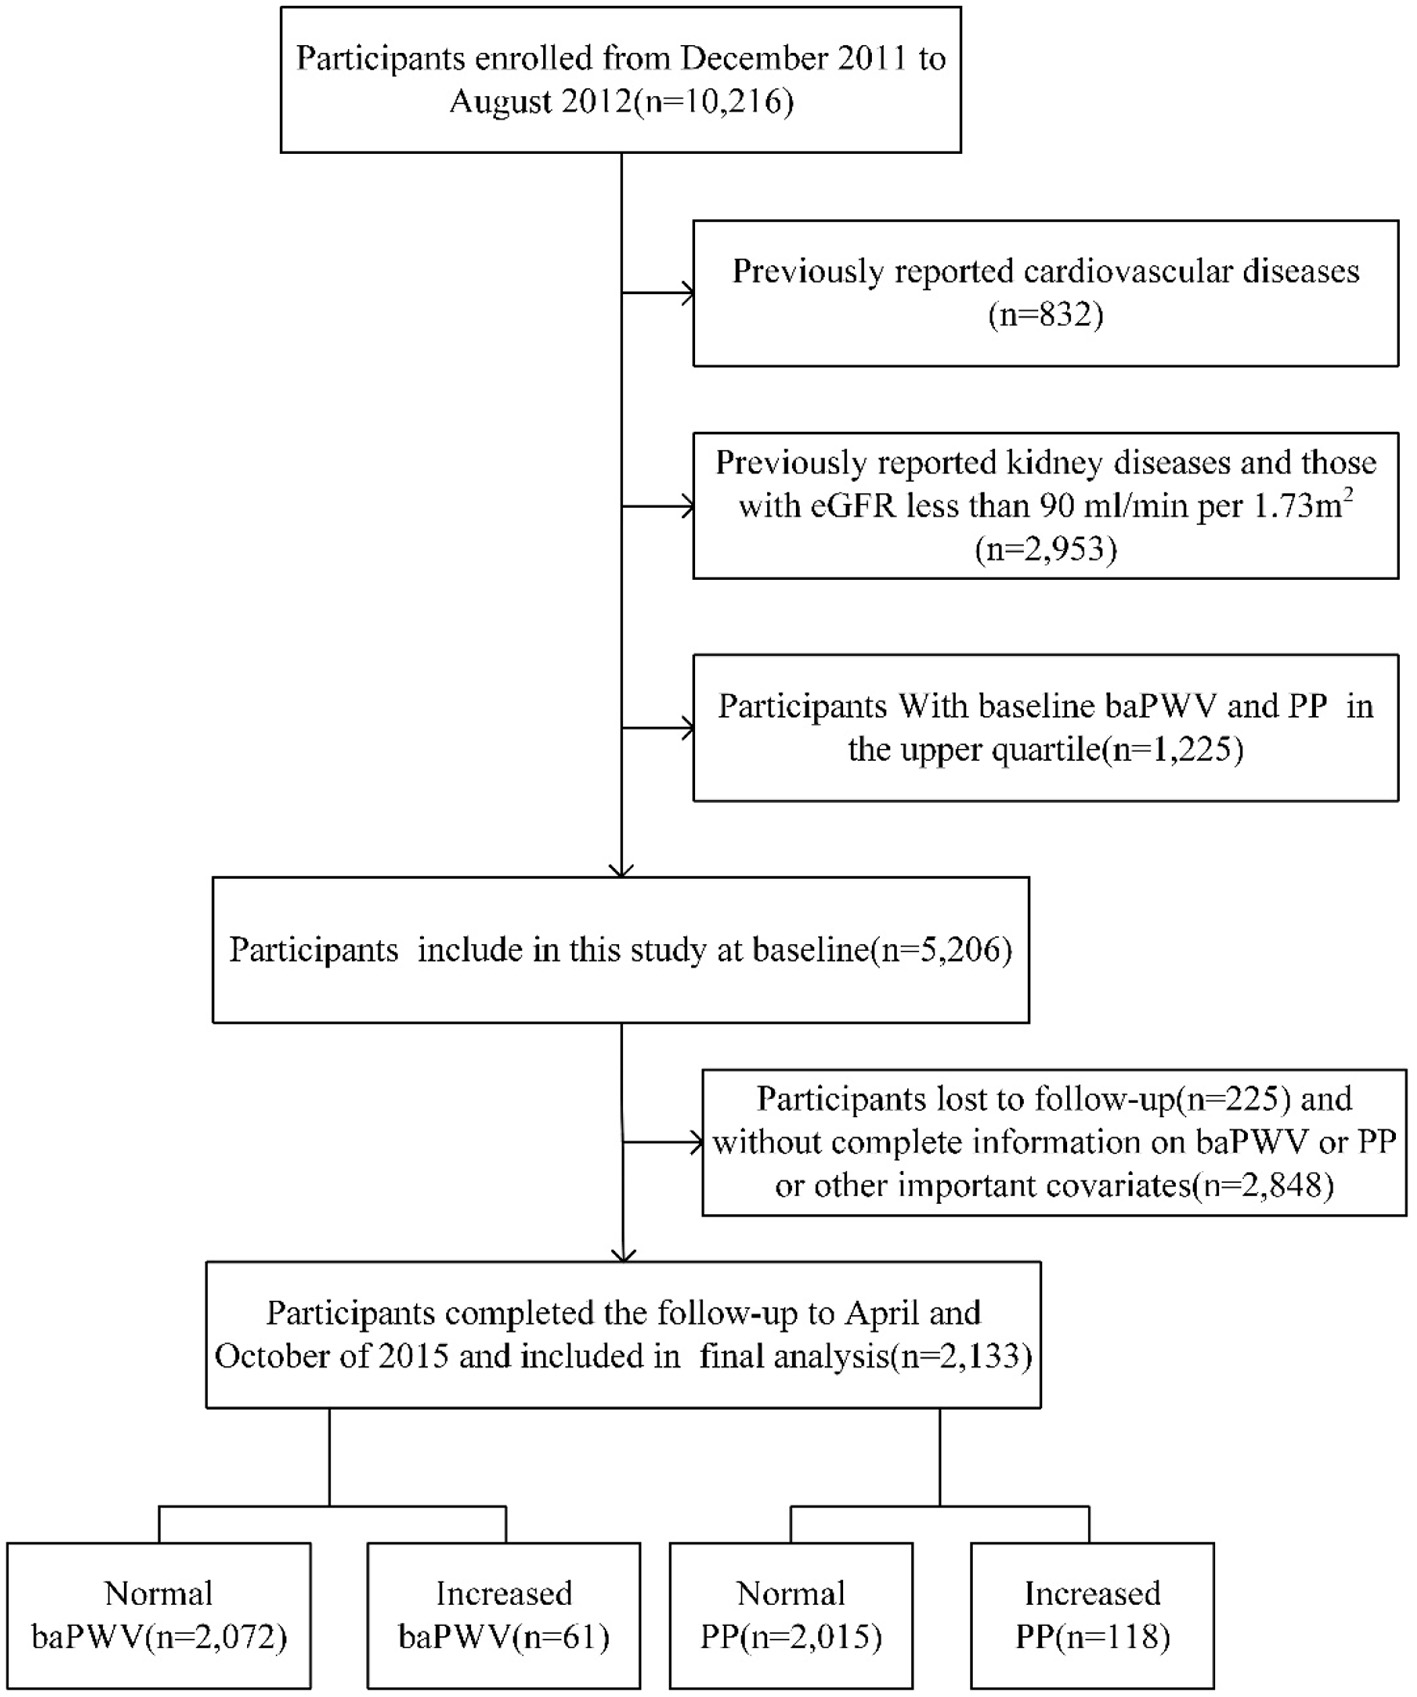
Study flow diagram. baPWV, brachial–ankle pulse wave velocity; PP, pulse pressure; eGFR, estimated glomerular filtration rate.
This study was approved by the Medical Ethics Committee of Ruijin Hospital, Shanghai Jiaotong University. All study participants provided written informed consent at baseline in accordance with the Declaration of Helsinki.
Outcomes
The main outcomes were increased baPWV and increased PP, which were defined as baPWV and PP equal or higher than their respective cut-off point at follow-up. The cut-off points for increased baPWV and increased PP were determined as the baPWV and PP in their respective upper quartile at baseline (12, 13); in this study they were 1705.13 cm/s and 63.67 mmHg, respectively.
Data Collection
Collecting baseline information such as demographics, disease history, situation of medication, and behavioral information (smoking and drinking) of participants was undertaken using a standard questionnaire through personal interviews. Height and weight measurements were taken under standard conditions. Body mass index (BMI) was calculated as weight (kilograms) divided by height (meters) squared (kg/m2).
PP, baPWV, ankle brachial index (ABI), and heart rate (HR) were measured simultaneously by an automatic waveform analyzer (model VP-1000; Colin Co, Komaki, Japan). The baPWV value was calculated as the distance/transit time ratio (cm/s). The mean of the left-side and right-side baPWV/ABI were obtained for all participants. HR and blood pressure (BP) were calculated as the mean value of the three readings. PP was calculated as systolic blood pressure (SBP) minus diastolic blood pressure (DBP).
A total of 10 mL of blood samples was provided by all participants after an overnight fast (at least 10 h) for biochemical analyses, including fasting plasma glucose (FPG), glycated hemoglobin A1c (HbA1c), total cholesterol (TC), triglycerides (TG), high-density lipoprotein cholesterol (HDL-C), low-density lipoprotein cholesterol (LDL-C), and serum creatinine (Scr). Lipids and Scr were measured with an autoanalyzer (c16000 system, ARCHITECT ci16200 analyzer; Abbott Laboratories, Chicago, IL, USA), in which the creatinine measurements were standardized to an isotope dilution mass spectrometry reference measurement procedure.
Definitions
GHF was defined as an eGFR over the 90th percentile in different age (40–49, 50–59, and ≥60 years) and sex categories (14) at baseline, the 90th percentile cut-off points (15–17) of the Modification of Diet in Renal study (MDRD) eGFR were from 124.65 to 149.58 mL/min per 1.73 m2.
Three main metabolic risk factors including plasma glucose, BP, and lipids were used to define the population with abnormal metabolism (18). According to baseline data, dysglycemia was defined by the ADA criteria (19) or self-reported previous diagnosis of diabetes mellitus (DM) by physicians or taking antidiabetic medications. Hypertension was defined as use of any antihypertensive agents and/or SBP ≥ 140 mm Hg and/or DBP ≥ 90 mm Hg (20) or having been previously diagnosed by a health professional. Dyslipidemia was defined as TC ≥ 6.22 mmol/L and/or TG ≥ 2.26 mmol/L and/or LDL-C ≥ 4.14 mmol/L and/or HDL-C <1.04 mmol/L according to Chinese guidelines on prevention and treatment of dyslipidemia in adults (21).
Risk factors such as current smoking and drinking were adjusted as covariates. Participants who smoked one cigarette per day or seven per week regularly during the past 6 months were defined as current smokers. The frequency of alcohol consumption was recorded, and those who consumed alcohol once per week regularly during the past 6 months were defined as current drinkers.
At the end of the follow-up, new onset DM was defined as no dysglycemia at baseline but diagnosed as DM at follow-up. New onset hypertension, dyslipidemia, and overweight/obesity were defined as no hypertension, dyslipidemia, and overweight/obesity at baseline but diagnosed at follow-up, respectively. Being overweight was defined as a BMI of 25.0–29.9 kg/m2 and obesity was defined as a BMI of 30.0 kg/m2 or higher, according to the World Health Organization definitions.
Statistical Analysis
All statistical analyses were performed with SPSS software V.23.0 for Windows (SPSS, Chicago, IL, USA). Continuous variables were described as means ± SD or medians (inter-quartile ranges). Categorical variables were described using percentages. Differences in laboratory values between groups were evaluated using Student's t test for normally distributed continuous data, Kruskal–Wallis test for skew-distributed continuous data, or χ2 test for categorical variables. Except for SBP, because of the skewed distribution of continuous covariates, log-transformation was performed before statistical analysis. ORs and 95% CIs from multivariate logistic regression models were used to assess the association of GHF/abnormal metabolism in all participants with the occurrence of increased baPWV/PP, in which some potential confounding factors were adjusted. The interaction between GHF and abnormal metabolism was evaluated by the synergy index (S), the attributable proportion of interaction (API), the pure attributable proportion of interaction (API'), and the relative excess risk due to interaction (RERI), based on the ORs in the adjusted multivariate regression model (22). Finally, sensitivity analysis was conducted (1) in participants with ABI ≥ 0.9 to avoid the influence of peripheral arterial diseases, (2) to use the 95th percentile (16) cut-off points in different age and sex categories to define GHF, (3) to add baseline baPWV and PP in the covariates, (4) to analyze the association between different GHF status and increased baPWV/PP, and adjust the baseline baPWV and PP, (5) in participants with baseline high baPWV and PP, and adjust the baseline baPWV and PP, and (6) to analyze GHF, abnormal metabolism, and baPWV/PP at follow-up in the generalized linear model in all participants, and to adjust the baseline baPWV and PP.
The statistical tests were two-sided, and a P value < 0.05 was considered statistically significant.
Results
Characteristics of the Participants
The mean age of the 2,133 participants was 55 (48–57) years and 556 participants (26.1%) were men. Among all participants, 210 participants had GHF. Table 1 shows the baseline characteristics of participants stratified by GHF. Baseline PP in participants with GHF was higher than those without GHF.
Table 1
| Characteristics | Total participant | Normal filtration | Hyperfiltration | pa |
|---|---|---|---|---|
| (n = 2,133) | (n = 1,923) | (n = 210) | ||
| Baseline | ||||
| Age (years) | 53 (48–57) | 53 (48–57) | 52 (48–55) | 0.26 |
| Male, No. (%) | 556 (26.1) | 502 (26.1) | 54 (25.7) | 0.903 |
| BMI (kg/m2) | 25.3 (23.2–27.5) | 25.3 (23.2–27.5) | 25.5 (23.7–27.6) | 0.101 |
| Current smokers, No. (%) | 317 (14.9) | 283 (14.7) | 34 (16.2) | 0.738 |
| Current drinkers, No. (%) | 226 (10.6) | 203 (10.6) | 23 (11) | 0.649 |
| eGFR (mL/min/1.73 m2) | 114.1 (103.4–127.3) | 112.1 (102.3–122.9) | 151.5 (144.7–161.7) | <0.001 |
| TC (mmol/L) | 5.3 (4.7–5.9) | 5.3 (4.7–5.9) | 5.1 (4.6–5.8) | 0.119 |
| TG (mmol/L) | 1.2 (0.9–1.7) | 1.2 (0.9–1.7) | 1.2 (0.8–1.6) | 0.438 |
| LDL- C (mmol/L) | 3.19 (2.7–3.7) | 3.2 (2.7–3.7) | 3.2 (2.6–3.7) | 0.789 |
| HDL- C (mmol/L) | 1.5 (1.2–1.7) | 1.5 (1.2–1.7) | 1.4 (1.2–1.7) | 0.376 |
| HbA1c (%) | 5.9 (5.6–6.2) | 5.9 (5.6–6.2) | 5.9 (5.7–6.3) | 0.046 |
| SBP (mm Hg) | 124.3 ± 11.3 | 124.1 ± 11.3 | 125.6 ± 11.2 | 0.071 |
| DBP (mm Hg) | 74 (68–79.7) | 74 (68.3–79.7) | 73.7 (67.9–79.3) | 0.722 |
| HR (beats/min) | 77 (70.7–83.7) | 76.7 (70.7–83.7) | 77.3 (72–83.4) | 0.201 |
| PP (mm Hg) | 50.3 (45.2–55.7) | 50.3 (45–55.7) | 52.5 (47.3–57) | 0.009 |
| baPWV (cm/s) | 1,400 (1279.8–1,517) | 1,398 (1,278–1511.5) | 1411.8 (1293.9–1550.8) | 0.1 |
| Follow-up | ||||
| PP (mm Hg) | 46 (39.7–52.7) | 46 (39.7–52.7) | 47 (40–53) | 0.259 |
| baPWV (cm/s) | 1,290 (1,170–1426.5) | 1289.5 (1167.5–1425.5) | 1,296 (1174.6–1437.4) | 0.983 |
| New onset Hypertension, No. (%) | 152 (7.1) | 142 (7.4) | 10 (4.8) | 0.161 |
| New onset Diabetes, No. (%) | 103 (4.8) | 92 (4.8) | 11 (5.2) | 0.771 |
| New onset Dyslipidemia, No. (%) | 224 (10.5) | 205 (10.7) | 19 (9) | 0.469 |
| New onset Overweight/Obesity, No. (%) | 71 (3.3) | 62 (3.2) | 9 (4.3) | 0.415 |
Characteristics of individuals with normal glomerular filtration or hyperfiltration.
BMI, body mass index; TC, total cholesterol; TG, triglyceride; eGFR, estimated glomerular filtration rate; HDL- C, high-density lipoprotein cholesterol; LDL- C, low- density lipoprotein cholesterol; HbA1c, glycated hemoglobin A1c; SBP, systolic blood pressure; DBP, diastolic blood pressure; HR, heart rate; PP, pulse pressure; baPWV, brachial–ankle pulse wave velocity.
Data were expressed as median (IQR 25–75%) for continuous variables, except SBP which was expressed as mean ± SD, number (percentage) for categorical variables.
p from t test, Kruskal-Wallis test or chi-square, comparing the normal filtration with the hyperfiltration group.
GHF Was Not Associated With Increased baPWV/PP in All Participants
During a median follow-up of 3.3 (IQR, 3.2–3.3) years, 61 and 118 participants developed increased baPWV and increased PP, respectively. The associations between GHF or abnormal metabolism with increased baPWV/PP in all participants were examined in multivariate logistic regression models. After adjusting for some variables as indicated in Table 2, we found that both GHF {baPWV [OR = 1.21 (0.50–2.95)] and PP [OR = 1.73 (0.91–3.30)]} and abnormal metabolism {baPWV [OR = 1.29 (0.68–2.46)] and PP [OR = 1.66 (0.98–2.82)} were not associated with increased baPWV/PP compared with the normal glomerular filtration or normal metabolism, respectively. Abnormal metabolism tended to be a risk factor for increased PP (P = 0.059).
Table 2
| Increased baPWV | Increased PP | |||||
|---|---|---|---|---|---|---|
| Case/N (%) | OR (95% CI)a | p | Case/N (%) | OR (95% CI)a | p | |
| Kidney function | ||||||
| Normal filtration | 213/1,923 (11.1) | Reference | 187/1,923 (9.7) | Reference | ||
| Hyperfiltration | 25/210 (11.9) | 1.21 (0.50, 2.95) | 0.673 | 21/210 (10.0) | 1.73 (0.91, 3.30) | 0.095 |
| Metabolic status | ||||||
| Normal metabolism | 14/574 (2.4) | Reference | 24/574 (4.2) | Reference | ||
| Abnormal metabolism | 47/1,559 (3.0) | 1.29(0.68, 2.46) | 0.43 | 94/1,559 (6.0) | 1.66 (0.98, 2.82) | 0.059 |
Association between hyperfiltration/abnormal metabolism and outcomes in all participants.
PP, pulse pressure; baPWV, brachial–ankle pulse wave velocity.
aOR (odds ratio) and 95% CI (confidence interval) were from multivariate logistic regression.
aAdjusted sex, age, current smoking, current drinking, BMI, SBP, TC, TG, LDL-C, HR, HbA1c at base line, new onset hypertension, diabetes, dyslipidemia, overweight/obesity during follow-up for kidney function and sex, age, current smoking, current drinking, BMI, HR at base line, New onset hypertension, diabetes, dyslipidemia, overweight/obesity during follow-up for metabolic status.
The Coexistence of GHF and Abnormal Metabolism Enhance the Risk of Increased PP
To examine whether GHF and abnormal metabolism interact to influence arterial stiffness, the participants were divided into four groups: A0H0, A1H0, A0H1, A1H1 (A0: normal metabolism; A1: abnormal metabolism; H0: normal filtration; H1: GHF) according to their metabolism and GHF status. As shown in Table 3, compared to the participants with normal metabolism and normal filtration, those who had GHF and abnormal metabolism had a significantly increased risk of increased PP [OR = 3.23 (1.47–7.13)]. There was an interaction between GHF and abnormal metabolism on increased PP (S = 4.96), the interaction accounted for 55.11 and 79.82% of the total effect or effect caused by GHF and abnormal metabolism of increased PP, respectively. When combining the effect of GHF and abnormal metabolism minus their independent effect, there was still a 1.78-fold increase in PP.
Table 3
| Increased baPWV | Increased PP | |||||
|---|---|---|---|---|---|---|
| Case/N (%) | OR (95% CI)a | p | Case/N (%) | OR (95% CI)a | p | |
| Variables | ||||||
| Sex (male) | 20/556 (3.6) | Reference | 42/556 (7.6) | Reference | ||
| female | 41/1,577 (2.6) | 0.40 (0.19, 0.85) | 0.017 | 76/1,577 (4.8) | 0.54 (0.28, 1.02) | 0.057 |
| Age | 1.11 (1.06, 1.16) | <0.001 | 1.12 (1.08, 1.16) | <0.001 | ||
| BMI | 1 (0.92, 1.08) | 0.994 | 1.10 (1.03, 1.17) | 0.003 | ||
| HR | 1.01 (0.99, 1.02) | 0.215 | 0.97 (0.95, 0.99) | 0.015 | ||
| Current smoking (never) | 53/1,699 (3.1) | Reference | 91/1,699 (5.4) | Reference | ||
| Yes | 6/317 (1.9) | 0.31 (0.11, 0.91) | 0.033 | 21/317 (6.6) | 0.63 (0.30, 1.34) | 0.231 |
| Current drinking (never) | 43/1439 (3.0) | Reference | 78/1439 (5.4) | Reference | ||
| Yes | 6/226 (2.7) | 0.78 (0.26, 2.30) | 0.651 | 16/226 (7.1) | 0.82 (0.38, 1.79) | 0.629 |
| New onset Hypertension (no) | 45/1,981 (2.3) | Reference | 70/1,981 (3.5) | Reference | ||
| Yes | 16/152 (10.5) | 6.04 (3.20, 11.40) | <0.001 | 48/152 (31.6) | 17.46 (10.86, 28.06) | <0.001 |
| New onset Diabetes (no) | 56/2,030 (2.8) | Reference | 106/2030 (5.2) | Reference | ||
| Yes | 5/103 (4.9) | 1.37 (0.50, 3.79) | 0.54 | 12/103 (11.7) | 1.55 (0.72, 3.34) | 0.261 |
| New onset Dyslipidemia (no) | 50/1,909 (2.6) | Reference | 107/1,909 (5.6) | Reference | ||
| Yes | 11/224 (4.9) | 2.23 (1.10, 4.51) | 0.026 | 11/224 (4.9) | 0.88 (0.43, 1.80) | 0.716 |
| New onset Overweight/Obesity (no) | 59/2,062(2.9) | Reference | 114/2,062 (5.5) | Reference | ||
| Yes | 2/71 (2.8) | 0.97 (0.22, 4.33) | 0.972 | 4/71 (5.6) | 1.22 (0.38, 3.97) | 0.741 |
| Groups | ||||||
| A0H0 | 13/528 (2.5) | Reference | 22/528 (4.2) | Reference | ||
| A1H0 | 42/1,395 (3) | 1.26 (0.65, 2.45) | 0.502 | 81/1,395 (5.8) | 1.52 (0.88, 2.65) | 0.137 |
| A0H1 | 1/46 (2.2) | 1.07 (0.13, 8.83) | 0.953 | 2/46 (4.3) | 0.93 (0.15, 5.68) | 0.939 |
| A1H1 | 5/164 (3) | 1.64 (0.55, 4.85) | 0.373 | 13/164 (7.9) | 3.23 (1.47, 7.13) | 0.004 |
| Interaction indexes | ||||||
| S | 1.94 | 4.96 | ||||
| API | 18.90% | 55.11% | ||||
| API' | 48.44% | 79.82% | ||||
| RERI | 0.31 | 1.78 | ||||
Association between groups of different hyperfiltration and metabolic status and outcomes in all participants.
PP, pulse pressure; baPWV, brachial–ankle pulse wave velocity; S, the synergy index; API, attributable proportion of interaction. API', pure attributable proportion of interaction; RERI, the relative excess risk due to interaction; A0/A1, normal metabolism/abnormal metabolism, H0/H1, normal filtration/hyperfiltration.
a OR (odds ratio) and 95% CI (confidence interval) were from multivariate logistic regression, in which sex, age, current smoking, current drinking, BMI, HR at baseline and new onset hypertension, diabetes, dyslipidemia, overweight/obesity during follow-up were adjusted.
Sensitivity Analysis
In the sensitivity analysis, (1) the 19 participants with ABI <0.9 were excluded to avoid the effects of lower extremity arterial diseases. Figure 2 shows that the coexistence of GHF and abnormal metabolism increased the risk of increased PP [OR=3.38(1.52–7.51)]. The interaction (S = 4.25) accounted for 76% of the risk of increased PP caused by GHF and abnormal metabolism. After subtracting the independent effects of GHF and abnormal metabolism, their combined effect still resulted in a 1.82-fold increase in PP. (2) In Supplementary Tables S1, S2, we define GHF with the 95th percentile in different age and sex categories. Results showed that those with GHF and abnormal metabolism had a significantly increased risk of increased PP [OR = 2.84 (1.034, 7.803)]. After combining the effect of GHF and abnormal metabolism minus their independent effect, there was still a 1.66-fold increase in PP. (3) In Supplementary Tables S3, S4, after adjusting the covariates and baseline baPWV/PP respectively in models, the coexistence of GHF and abnormal metabolism enhanced the risk of increased PP [OR = 2.44 (1.08, 5.49)]. (4) As shown in Supplementary Table S5, those who had GHF at baseline but not at follow-up did not have a statistically significant association with the outcomes. Then all participants were grouped by different GHF status as H00 (normal filtration at baseline and follow-up), H10 (GHF at baseline and normal filtration at follow-up), H01 (normal filtration at baseline and GHF at follow-up), and H11 (GHF at baseline and follow-up). Compared with the H00 group, participants with only baseline GHF, follow-up GHF, and both baseline and follow-up GHF had the trend of increased baPWV and PP; the P for all trends was <0.05. (5) In Supplementary Tables S6, S7, baseline high baPWV participants (≥1623.93 cm/s) were referred to as those above the increased baPWV threshold (1705.13cm/s) by a ≤ 5% increase in the baseline level, the same was applied to the definition of baseline high PP (≥60.64 cm/s). GHF increased the risk of increased PP [OR = 4.79 (1.03, 22.36)] in participants with high PP at baseline, the coexistence of GHF and abnormal metabolism significantly enhanced the risk of increased PP [OR = 18.97 (1.80, 200.13)], and even after the combined effect of GHF and abnormal metabolism minus their independent effect, there was still a 15.39-fold increase in PP. (6) As shown in Supplementary Table S8, abnormal metabolism and GHF had an interactive effect and were positively correlated with baPWV [β = 0.016 (0.005, 0.027)] and PP [β = 0.023 (0.007, 0.039)] at follow-up.
Figure 2

The forest plot of association between groups of different hyperfiltration and metabolic status and outcomes among participants with ABI ≥ 0.9 in sensitivity analysis. PP, pulse pressure; baPWV, brachial–ankle pulse wave velocity; S, the synergy index; API, attributable proportion of interaction. API', pure attributable proportion of interaction; RERI, the relative excess risk due to interaction; A0/A1, normal metabolism/abnormal metabolism; H0/H1, normal filtration/hyperfiltration. OR (odds ratio) and 95% CI (confidence interval) were from multivariate logistic regression, in which sex, age, current smoking, current drinking, BMI, HR at baseline and new onset hypertension, diabetes, dyslipidemia, overweight/obesity during follow-up were adjusted.
Discussion
In this prospective cohort study, although we found that GHF was not associated with increased baPWV or PP in a 3-year follow-up, the coexistence of GHF and abnormal metabolism significantly increased the risk of increased PP in all participants, and the interaction between GHF and abnormal metabolism accounted for most of this effect.
Some previous cross-sectional studies (23–25) had shown that GHF was not statistically associated with arterial stiffness. However, cross-sectional studies cannot establish causality, and these studies were limited only to CKD or T1 DM participants. The present prospective cohort study was conducted in participants with eGFR ≥ 90 mL/min/1.73 m2. Participants with baseline baPWV and PP in the upper quartile were excluded to ensure prospective and further adjusted for the potential risk factors of arterial stiffness, which included new onset diseases or metabolic disorders of DM, hypertension, dyslipidemia, and overweight/obesity during follow-up. Those all made the results more reliable and suggested that GHF was not an independent predictor of arterial stiffness in a period of 3 years. As the earliest stage of kidney injury, GHF and its hemodynamic determinants (the increased glomerular pressures and flows) may injure the capillary network and disrupt normal vascular integrity (26). Therefore, we could not rule out that long-term GHF may increase arterial stiffness and further lead to vascular disease. This view has been confirmed by a prospective study. This study demonstrated that high eGFR was associated with increased risk of CVDs during a 10-year follow-up (27). This association was completely independent of albuminuria, SBP, DBP, and plasma glucose (3). There was also a study suggesting that GHF may be associated with increased arterial stiffness. A cross-sectional study involving participants without CKD (13) suggested that GHF was associated with arterial stiffness measured by baPWV and PP. This study was conducted in participants with high BP and TG, which could significantly enhance the effect of GHF on arterial stiffness as demonstrated by our study, however, this study did not examine whether this effect was from the interaction between GHF and abnormal metabolism or from GHF alone.
Although we found GHF or abnormal metabolism alone was not associated with increased arterial stiffness, we demonstrated that participants with GHF and abnormal metabolism had a 3.23-fold risk of increased PP compared with the participants without GHF or abnormal metabolism; the interaction accounted for 79.8% of the effect. This interaction may partly be explained by some biological pathways or factors that GHF and abnormal metabolism commonly shared, including pathways which may injure the capillary network, large artery dysfunctions (28), and inflammatory factors such as fibrinogen and adhesion molecules, which increase arterial stiffness by causing vascular fibrosis and calcification through collagen deposition (8, 26, 29).
In addition, this study suggested that arterial stiffness caused by GHF and abnormal metabolism was more likely to be reflected by increased PP but not increased baPWV; several studies had observed similar results (30, 31). There are several possible potential mechanisms. On one hand, the common mechanism linking GHF and abnormal metabolism to arterial stiffness through macrovascular dysfunctions may favor an increase in SBP and also a decrease in DBP (28). On the other hand, PWV marked increases with age and out of proportion to the minor increase of PP with age (32); the association between GHF and baPWV may be weakened when analyzing eGFR calculated by age.
This study has several strengths. First, we inferred causality between GHF and arterial stiffness in a prospective cohort study, and discussed the interaction between GHF and abnormal metabolism. Second, we adjusted new onset DM, hypertension, dyslipidemia, and overweight/obesity during follow-up in the analytic model to attenuate their influence on artery stiffness, and some sensitivity analyses were also conducted; it made the results more reliable. There were also several limitations in this study. First, all participants were at age 40 years or over and from a single center only, which could introduce selection bias, but these people could best reflect the benefits of disease prevention. Second, a single measurement of baPWV and BP, rather than two or more measurements over time was used to define arterial stiffness, which may lead to misdiagnosis. Third, GFR was estimated using a single-serum creatinine value entered in the MDRD equation instead of measurement, but this equation is validated in general healthy people individuals with normal kidney function (33). Finally, as the information of proteinuria is not available, the results of association and interaction of this study may biased by the influence of renal injury and its related pathological process which induced proteinuria.
Conclusions
In this prospective cohort, we found that GHF alone may not be potent enough to enhance arterial stiffness in a relatively short period. However, when GHF and abnormal metabolism coexisted, the unfavorable effect on arterial stiffness significantly increased. The finding from this study emphasizes that future arterial stiffness risks cannot be ignored in subjects with GHF and abnormal metabolism.
Funding
This work was supported by the National Natural Science Foundation of China [Grant Nos: 82073648 and 31672375].
Publisher's Note
All claims expressed in this article are solely those of the authors and do not necessarily represent those of their affiliated organizations, or those of the publisher, the editors and the reviewers. Any product that may be evaluated in this article, or claim that may be made by its manufacturer, is not guaranteed or endorsed by the publisher.
Statements
Data availability statement
The data in this study were obtained from a third party and are not publicly available. Requests to access these datasets should be directed to jingtaodou@163.com.
Ethics statement
This study was approved by the Medical Ethics Committee of Ruijin Hospital, Shanghai Jiaotong University. All study participants provided written informed consent at baseline in accordance with the Declaration of Helsinki.
Author contributions
QZ and YH: conception and design and manuscript writing. QZ, YZu, and XS: collection and assembly of data. JW, MW, QZ, YZu, YZh, and XS: data analysis and interpretation. YZh: literature search. HG: editing. YH: review of this manuscript. All authors read and approved the final manuscript.
Acknowledgments
All authors appreciate the efforts of all participants who contributed to sample measurements and data collection.
Conflict of interest
The authors declare that the research was conducted in the absence of any commercial or financial relationships that could be construed as a potential conflict of interest.
Supplementary material
The Supplementary Material for this article can be found online at: https://www.frontiersin.org/articles/10.3389/fmed.2021.732413/full#supplementary-material
References
1.
PiepoliMFHoesAWAgewallSAlbusCBrotonsCCatapanoALet al. 2016 European guidelines on cardiovascular disease prevention in clinical practice. The sixth joint task force of the European Society of Cardiology and Other Societies on Cardiovascular Disease Prevention in clinical practice (constituted by representatives of 10 societies and by invited experts. Developed with the special contribution of the European Association for Cardiovascular Prevention & Rehabilitation. Eur Heart J. (2016) 37:2315–81. 10.1093/eurheartj/ehw106
2.
TownsendRR. Arterial stiffness in CKD: a review. Am J Kidney Dis. (2019) 73:240–7. 10.1053/j.ajkd.2018.04.005
3.
MallamaciCZF. The overdriven glomerulus as a cardiovascular risk factor. Kidney Int. (2018) 93:13–5. 10.1016/j.kint.2017.08.035
4.
GeorgianosPIMorfesisPZebekakisPE. Exploring the association of arterial stiffness with estimated glomerular filtration rate: another chicken-egg paradigm?J Hypertens. (2017) 35:650–1. 10.1097/HJH.0000000000001238
5.
CherneyDZLaiVScholeyJWMillerJAZinmanBReichHN. Effect of direct renin inhibition on renal hemodynamic function, arterial stiffness, and endothelial function in humans with uncomplicated type 1 diabetes: a pilot study. Diabetes Care. (2010) 33:361–5. 10.2337/dc09-1303
6.
RubingerDBackenrothRSapoznikovD. Sympathetic nervous system function and dysfunction in chronic hemodialysis patients. Semin Dial. (2013) 26:333–43. 10.1111/sdi.12093
7.
KanbayMErtugluLAAfsarBOzdoganEKucuksumerZSOrtizAet al. Renal hyperfiltration defined by high estimated glomerular filtration rate: a risk factor for cardiovascular disease and mortality. Diabetes Obes Metab. (2019) 21:2368–83. 10.1111/dom.13831
8.
MozosIMalainerCHorbańczukJGugCStoianDLucaCTet al. Inflammatory markers for arterial stiffness in cardiovascular diseases. Front Immunol. (2017) 8:1058. 10.3389/fimmu.2017.01058
9.
VlachopoulosCAznaouridisKStefanadisC. Prediction of cardiovascular events and all-cause mortality with arterial stiffness. J Am Coll Cardiol. (2010) 55:1318–27. 10.1016/j.jacc.2009.10.061
10.
MillarJALeverAFBurkeV. Pulse pressure as a risk factor for cardiovascular events in the MRC mild hypertension trial. J Hypertens. (1999) 17:1065–72. 10.1097/00004872-199917080-00004
11.
BiYLuJWangWMuYZhaoJLiuCet al. Cohort profile: risk evaluation of cancers in Chinese diabetic individuals: a longitudinal (REACTION) study. J Diabetes. (2014) 6:147–57. 10.1111/1753-0407.12108
12.
KimEDTanakaHBallewSHSangYHeissGCoreshJet al. Associations between kidney disease measures and regional pulse wave velocity in a large community-based cohort: the atherosclerosis risk in communities (ARIC) study. Am J Kidney Dis. (2018) 72:682–90. 10.1053/j.ajkd.2018.04.018
13.
LinLPengKDuRHuangXSunWDingLet al. High glomerular filtration rate is associated with arterial stiffness in Chinese population. J Hypertens. (2017) 35:385–91. 10.1097/HJH.0000000000001158
14.
CachatFCombescureCCauderayMGirardinEChehadeH. A systematic review of glomerular hyperfiltration assessment and definition in the medical literature. Clin J Am Soc Nephrol. (2015) 10:382–9. 10.2215/CJN.03080314
15.
MelsomTMathisenUDIngebretsenOCJenssenTGNjølstadISolbuMDet al. Impaired fasting glucose is associated with renal hyperfiltration in the general population. Diabetes Care. (2011) 34:1546–51. 10.2337/dc11-0235
16.
MelsomTScheiJStefanssonVTSolbuMDJenssenTGMathisenUDet al. Prediabetes and risk of glomerular hyperfiltration and albuminuria in the general nondiabetic population: a prospective cohort study. Am J Kidney Dis. (2016) 67:841–50. 10.1053/j.ajkd.2015.10.025
17.
LimHIJunSJLeeSW. Glomerular hyperfiltration may be a novel risk factor of restrictive spirometry pattern: analysis of the Korea National Health and Nutrition Examination Survey (KNHANES) 2009–2015. PLoS ONE. (2019) 14:e0223050. 10.1371/journal.pone.0223050
18.
GrundySMStoneNJBaileyALBeamCBirtcherKKBlumenthalRSet al. 2018 AHA/ACC/AACVPR/AAPA/ABC/ACPM/ADA/AGS/APhA/ASPC/NLA/PCNA guideline on the management of blood cholesterol: a report of the American College of Cardiology/American Heart Association Task Force on clinical practice guidelines. Circulation. (2019) 139:e1082–143. 10.1161/CIR.0000000000000698
19.
AmericanDiabetes Association. Erratum. Classification and diagnosis of diabetes. Sec. 2. In Standards of Medical Care in Diabetes-2016. Diabetes Care 2016;39(Suppl. 1):S13-S22. Diabetes Care. (2016) 39:1653. 10.2337/dc16-er09
20.
UngerTBorghiCCharcharFKhanNAPoulterNRPrabhakaranDet al. 2020 International society of hypertension global hypertension practice guidelines. Hypertension. (2020) 75:1334–57. 10.1161/HYPERTENSIONAHA.120.15026
21.
ChuJGaoRZhaoSLuGZhaoDLiJ. Joint committee for developing chinese guidelines on P, treatment of dyslipidemia in A. Chinese guidelines on prevention and treatment of dyslipidemia in adults. Zhonghua Xin Xue Guan Bing Za Zhi. (2007) 35:390–419. 10.3760/cma.j.issn.0253-3758.2016.10.005
22.
HosmerDWLemeshowS. Confidence interval estimation of interaction. Epidemiology. (1992) 3:452–6. 10.1097/00001648-199209000-00012
23.
McIntyreNJFluckRJMcIntyreCWFakisATaalMW. Determinants of arterial stiffness in chronic kidney disease stage 3. PLoS ONE. (2013) 8:e55444. 10.1371/journal.pone.0055444
24.
CherneyDZSochettEBLaiVDekkerMGSlorachCScholeyJWet al. Renal hyperfiltration and arterial stiffness in humans with uncomplicated type 1 diabetes. Diabetes Care. (2010) 33:2068–70. 10.2337/dc10-0767
25.
HermansMMHenryRDekkerJMKoomanJPKostensePJNijpelsGet al. Estimated glomerular filtration rate and urinary albumin excretion are independently associated with greater arterial stiffness: the hoorn study. J Am Soc Nephrol. (2007) 18:1942–52. 10.1681/ASN.2006111217
26.
HostetterTHOlsonJLRennkeHGVenkatachalamMABrennerBM. Hyperfiltration in remnant nephrons: a potentially adverse response to renal ablation. J Am Soc Nephrol. (2001) 12:1315–25. 10.1681/ASN.V1261315
27.
Van BiesenWDe BacquerDVerbekeFDelangheJLameireNVanholderR. The glomerular filtration rate in an apparently healthy population and its relation with cardiovascular mortality during 10 years. Eur Heart J. (2007) 28:478–83. 10.1093/eurheartj/ehl455
28.
CzernichowSGreenfieldJRGalanPJellouliFSafarMEBlacherJet al. Macrovascular and microvascular dysfunction in the metabolic syndrome. Hypertens Res. (2010) 33:293–7. 10.1038/hr.2009.228
29.
CzernichowSGreenfieldJRGalanPBastardJPCharnauxNSamarasKet al. Microvascular dysfunction in healthy insulin-sensitive overweight individuals. J Hypertens. (2010) 28:325–32. 10.1097/HJH.0b013e328333d1fc
30.
BrietMBozecELaurentSFassotCLondonGMJacquotCet al. Arterial stiffness and enlargement in mild-to-moderate chronic kidney disease. Kidney Int. (2006) 69:350–7. 10.1038/sj.ki.5000047
31.
LilitkarntakulPDhaunNMelvilleVKerrDWebbDJGoddardJ. Risk factors for metabolic syndrome independently predict arterial stiffness and endothelial dysfunction in patients with chronic kidney disease and minimal comorbidity. Diabetes Care. (2012) 35:1774–80. 10.2337/dc11-2345
32.
AdjiAO'RourkeMFNamasivayamM. Arterial stiffness, its assessment, prognostic value, and implications for treatment. Am J Hypertens. (2011) 24:5–17. 10.1038/ajh.2010.192
33.
SarwarNDaneshJEiriksdottirGSigurdssonGWarehamNBinghamSet al. Triglycerides and the risk of coronary heart disease: 10 158 incident cases among 262 525 participants in 29 western prospective studies. Circulation. (2007) 115:450–8. 10.1161/CIRCULATIONAHA.106.637793
Summary
Keywords
arterial stiffness, glomerular hyperfiltration, brachial-ankle pulse wave velocity, pulse pressure, abnormal metabolism
Citation
Zhai Q, Wen J, Wang M, Zuo Y, Su X, Zhang Y, Gaisano H and He Y (2021) Glomerular Hyperfiltration Interacts With Abnormal Metabolism to Enhance Arterial Stiffness in Middle-Aged and Elderly People. Front. Med. 8:732413. doi: 10.3389/fmed.2021.732413
Received
29 June 2021
Accepted
24 September 2021
Published
21 October 2021
Volume
8 - 2021
Edited by
Audrey Adji, Victor Chang Cardiac Research Institute, Australia
Reviewed by
Jonathan P. Troost, University of Michigan, United States; Enrique Rodilla, Hospital de Sagunto, Spain
Updates
Copyright
© 2021 Zhai, Wen, Wang, Zuo, Su, Zhang, Gaisano and He.
This is an open-access article distributed under the terms of the Creative Commons Attribution License (CC BY). The use, distribution or reproduction in other forums is permitted, provided the original author(s) and the copyright owner(s) are credited and that the original publication in this journal is cited, in accordance with accepted academic practice. No use, distribution or reproduction is permitted which does not comply with these terms.
*Correspondence: Yan He yanhe1220@126.com
This article was submitted to Nephrology, a section of the journal Frontiers in Medicine
Disclaimer
All claims expressed in this article are solely those of the authors and do not necessarily represent those of their affiliated organizations, or those of the publisher, the editors and the reviewers. Any product that may be evaluated in this article or claim that may be made by its manufacturer is not guaranteed or endorsed by the publisher.