 Yang An1,2†
 Shixue Xu1†
 Yiting Liu1,3†Xiangbo Xu1,2†
 Cyriac Abby Philips4†Jiang Chen1
 Nahum Méndez-Sánchez5Xiaozhong Guo1
 Xingshun Qi1*
- 1Meta-Analysis Study Group, Department of Gastroenterology, General Hospital of Northern Theater Command, Shenyang, China
- 2Postgraduate College, Shenyang Pharmaceutical University, Shenyang, China
- 3Department of Physical Examination Center, The First Affiliated Hospital, China Medical University, Shenyang, China
- 4The Liver Unit and Monarch Liver Laboratory, Cochin Gastroenterology Group, Ernakulam Medical Center, Kochi, India
- 5Liver Research Unit Medica Sur Clinic and Foundation and Faculty of Medicine, National Autonomous University of Mexico, Mexico City, Mexico
Background: Galectins, a family of β-galactoside-binding proteins, are related to the development and progression of various human diseases such as cancer, heart failure, and chronic kidney disease. However, its role in liver diseases is unclear.
Methods: The PubMed, Embase, and Cochrane Library databases were searched. Hazard ratios (HRs), odds ratios (ORs), and mean differences (MDs) with 95% CIs were pooled to evaluate the association of the galectins with the outcomes and risk of liver diseases by a random effects model.
Results: Thirty three studies involving 43 cohorts and 4,168 patients with liver diseases were included. In the patients with hepatocellular carcinoma (HCC), high expression of galectin-1 and -3 in the tissues was significantly associated with worse overall survival (galectin-1: HR = 1.94, 95% CI = 1.61–2.34, p < 0.001; galectin-3: HR = 3.29, 95% CI = 1.62–6.68, p < 0.001) and positive vascular invasion (galectin-1: OR = 1.74, 95% CI = 1.18–2.58, p = 0.005; galectin-3: OR = 2.98, 95% CI = 1.58–5.60, p = 0.001); but, high expression of galectin-4 and −9 in the tissues was significantly associated with better overall survival (galectin-4: HR = 0.53, 95% CI = 0.36–0.79, p = 0.002; galectin-9: HR = 0.56, 95% CI = 0.44–0.71, p < 0.001) and negative vascular invasion (galectin-4: OR = 0.36, 95% CI = 0.19–0.72, p = 0.003; galectin-9: OR = 0.60, 95% CI = 0.37–0.97, p = 0.037). Serum galectin-3 level was significantly higher in HCC (MD = 3.06, 95% CI = 1.79–4.32, p < 0.001), liver failure (MD = 0.44, 95% CI = 0.23–0.66, p < 0.001), liver cirrhosis (MD = 1.83, 95% CI = 1.15–2.51, p < 0.001), and chronic active hepatitis B (MD = 18.95, 95% CI = 10.91–27.00, p < 0.001); serum galectin-9 level was significantly higher in HCC (MD = 3.74, 95% CI = 2.57–4.91, p < 0.001) and autoimmune hepatitis (MD = 8.80, 95% CI = 7.61–9.99, p < 0.001).
Conclusion: High galectin-1 and -3 and low galectin-4 and -9 expression indicate worse outcomes of patients with HCC. Serum galectin-3 and -9 levels are positively associated with the risk of chronic liver diseases.
Introduction
Liver diseases, including chronic hepatitis, liver fibrosis or cirrhosis, acute liver injury or liver failure, and hepatocellular carcinoma (HCC), are a major global health burden. They are often subtle, but potentially lethal (1). According to the report of the Global Burden of Disease Study 2019, there are 79,200 deaths from acute hepatitis (2), 1,470,000 deaths from liver cirrhosis and other chronic liver diseases (3), and 485,000 deaths from HCC (4) in the world. Early assessment and identification of liver diseases by molecular biomarkers are clinically important.
Galectins are a family of lectins composed of one or two carbohydrate recognition domains (CRDs) that bind to the β-galactoside-containing glycans (5). Galectins are classified into three groups according to their molecular-structural characteristics: “prototype” galectins with a single CRD (i.e., galectin-1,-2,-5,-7,-10,-11,-13,-14,-15, and -16); “chimeric-type” galectins (i.e., galectin-3) with the tandem repeats of proline- and glycine-rich short stretches fused onto the CRD; and “tandem repeat”-type galectins with two distinct CRDs (i.e., galectin-4,-6,-8,-9, and -12) (6). Galectins are responsible for the regulation of premessenger RNA (mRNA) splicing, cell cycle, cell growth, and cell apoptosis (7), and the development and/or progression of many human diseases, including cancer, heart failure, and chronic kidney disease (8).
Galectins play a regulatory role in liver diseases by binding their CRDs to the glycoconjugates expressed in the hepatocytes (9). Abnormal expression of the galectins may be related to the development of hepatitis and liver fibrosis/cirrhosis and the progression of HCC (10). In this study, we conducted a systematic review and meta-analysis to evaluate the role of galectins in various liver diseases.
Methods
This meta-analysis was performed in accordance with the Preferred Reporting Items for Systematic Reviews and Meta-Analyses (PRISMA) statement (11).
Registration
The registration number was CRD42020210038 in the PROSPERO.
Literature Search
The literature was searched via the PubMed, Embase, and Cochrane Library databases from the earliest available publication until September 18, 2020. Search items were as follows: “(galectin)” and “(liver)” or “(hepatic)” or “(hepatitis)” or “(hepatocellular)” or “(fibrosis)” or “(failure).” There was no language restriction.
Selection Criteria
The inclusion criteria were as follows: (1) study population should be the patients diagnosed with liver diseases and (2) galectin expression or level was detected in patients with liver diseases. The exclusion criteria were as follows: (1) duplicate papers; (2) reviews, meta-analyses, or case reports; (3) notes, conferences, corrections, editorials, comments, or letters; (4) experimental or animal studies; and (5) studies which were lacking of detailed data regarding galectin expression or level.
Data Extraction
We extracted the following data from each study, including first author, publication year, country, study design, enrollment period, sample size, subtypes of the galectins, and methods to detect the galectins. As for the studies regarding the clinicopathological features and the outcomes of HCC, we specifically extracted the data as follows: galectin expression and its grouping; clinicopathological features including tumor size, tumor-node-metastasis (TNM) stage, differentiation grade, and vascular invasion; and outcomes, which include overall survival (OS), disease-free survival (DFS), and relapse-free survival (RFS). As for the studies regarding the risk of liver diseases, we specifically extracted the data regarding the type of liver diseases, the Child–Pugh class, and the level of serum galectins.
As for the survival data, we directly extracted or indirectly estimated the hazard ratio (HR) and 95% CI. If a study did not give the HR and 95% CI, but only reported the Kaplan–Meier curves, we would employ the Engauge Digitizer 4.1 software (Linux, Mac OSX, and Windows Slashdot Media, CA, USA) to extract the survival rate at the different time points from the Kaplan–Meier curves and then utilize Tierney's table (12) to estimate its correlative HR with 95% CI.
Study Quality Assessment
Quality of the case–control and cohort studies were evaluated by the Newcastle–Ottawa Scale (NOS), which included the three parts (i.e., selection, comparability, and outcomes) and eight questions (13). The highest NOS score was nine points. High quality was considered if the NOS score was more than six points.
Statistical Analysis
The Stata version 12.0 (Stata Corporation, College Station, Texas, USA) was employed for the statistical analysis. Only a random effects model was implemented. HRs, odds ratios (ORs), and mean differences (MDs) with 95% CIs were pooled. A two-sided p < 0.05 was considered as statistically significant. If the data were expressed as median with range, mean with SD would be estimated (14). Heterogeneity was evaluated by the I2 statistics and the Cochran's Q test. I2 > 50% or p < 0.1 was considered as a statistically significant heterogeneity. Sensitivity analysis was performed after omitting one study at a time in order to check the consistency to estimate the overall effect. Publication bias was assessed by Egger's test (15) and p < 0.1 was considered to imply a significant publication bias.
Results
Study Selection and Characteristics
Among the 4,005 papers initially retrieved, 33 papers were eligible (Figure 1). They were published from 2008 to 2020 (16–48). Members of the galectins evaluated included galectin-1,-3,-4, and -9. The sample size ranged from 10 to 386; 25 studies came from Asia (16–20, 22, 25–39, 42, 44, 46, 47), six studies came from Europe (21, 40, 41, 43, 45, 48), and two studies came from Oceania (23, 24); five studies were published as the abstracts (27, 28, 35, 37, 42) and 28 studies were published as the full texts (16–26, 29–34, 36, 38–41, 43–48); and 29 studies were of high quality (16–26, 29, 30, 32–39, 41–48), but four studies were of low quality (27, 28, 31, 40).
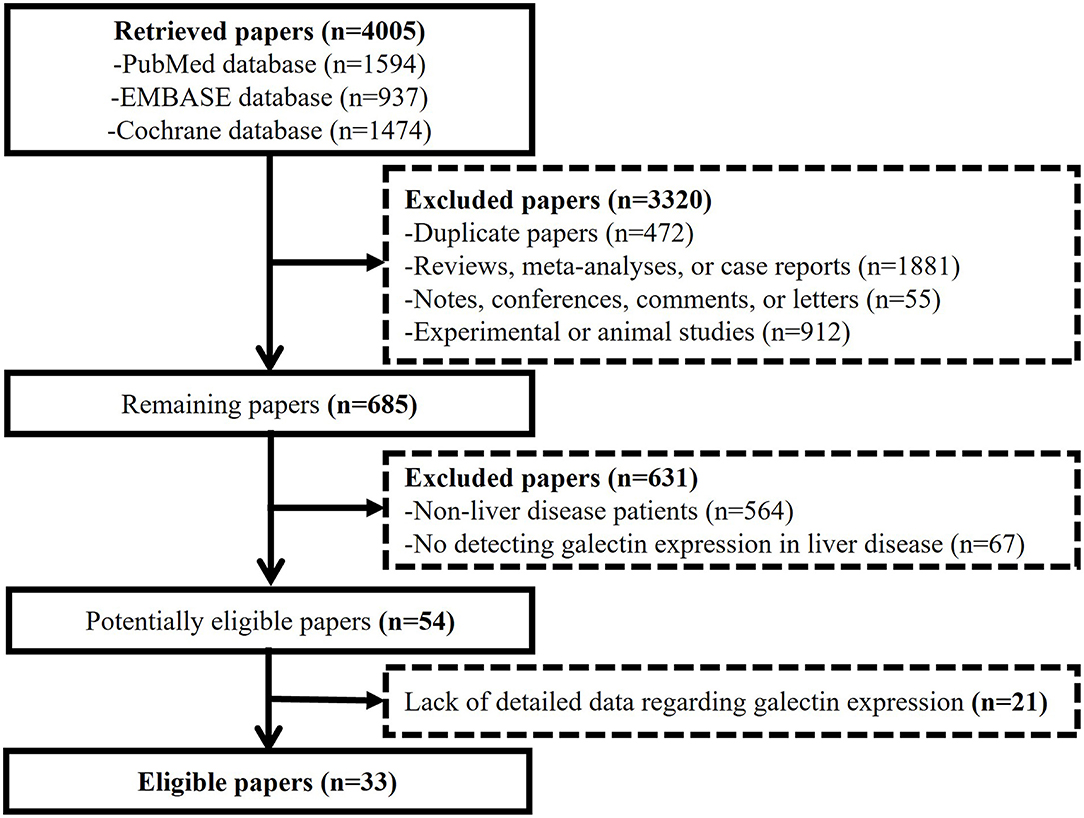
Figure 1. Flow diagram for the selection of the papers.
Meta-Analyses Regarding the Galectins With Prognosis and Clinicopathological Features of the Hepatocellular Carcinoma
Seventeen studies involving 19 cohorts and 3,120 patients focused on the relationship of the galectins expressed in the tissues with prognosis and clinicopathological features of HCC (16–32) (Table 1). Among them, five study cohorts focused on galectin-1 (17–21), seven study cohorts focused on galectin-3 (22, 25–29, 31), one study cohort focused on galectin-4 (32), and six study cohorts focused on galectin-9 (16, 23, 24, 26, 30). Results of the meta-analyses are shown in Table 2.
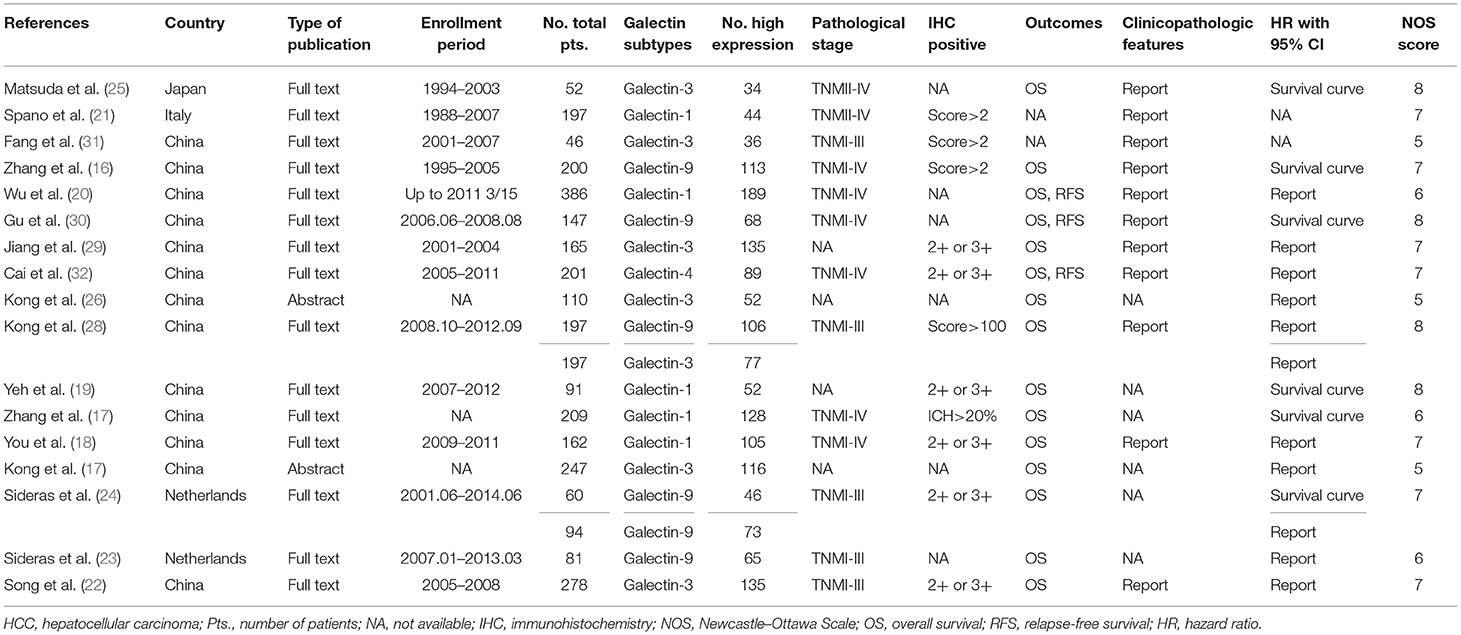
Table 1. Characteristics of the included studies regarding the galectins with the prognosis and clinicopathological features of HCC in the tissues.
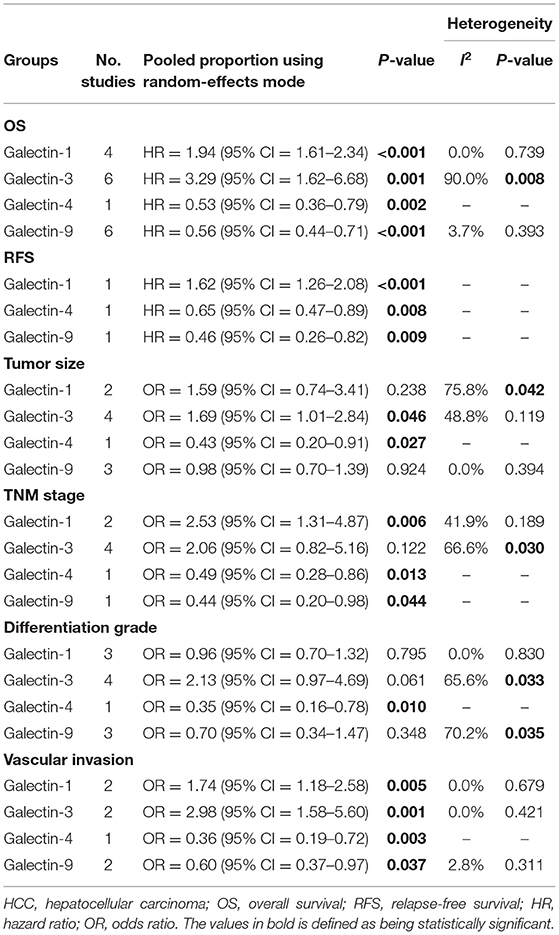
Table 2. Galectins with the prognosis and clinicopathological features of HCC: results of the meta-analyses.
Overall Survival
The relationship between the galectins and OS was explored in 17 study cohorts (16–20, 22–30, 32).
High galectin-1 expression was significantly correlated with worse OS in the patients with HCC (HR = 1.94, 95% CI = 1.61–2.34, p < 0.001) without significant heterogeneity (I2 = 0.0%, p = 0.739).
High galectin-3 expression was significantly correlated with worse OS in the patients with HCC (HR = 3.29, 95% CI = 1.62–6.68, p = 0.001) with a significant heterogeneity (I2 = 90.00%, p = 0.008). Sensitivity analysis illustrated that the study by Song et al. (22) displayed an apparent influence on the overall result of the meta-analysis (Supplementary Figure 1). After the exclusion of this study, the pooled HR was similar (HR = 2.51, 95% CI = 1.51–4.16, p < 0.001), but with a mild reduction in heterogeneity (I2 = 71.10%, p = 0.008).
High galectin-4 expression was significantly correlated with better OS in the patients with HCC (HR = 0.53, 95% CI = 0.36–0.79, p = 0.002).
High galectin-9 expression was significantly correlated with better OS in the patients with HCC (HR = 0.56, 95% CI = 0.44–0.71, p < 0.001) without significant heterogeneity (I2 = 3.7%, p = 0.393).
Relapse-Free Survival
The relationship between the galectins and RFS was explored in three study cohorts (20, 30, 32).
High galectin-1 expression was significantly correlated with worse RFS in the patients with HCC (HR = 1.62, 95% CI = 1.26–2.08, p < 0.001).
High galectin-4 (HR = 0.65, 95% CI = 0.47–0.89, p = 0.008) and galectin-9 (HR = 0.46, 95% CI = 0.26–0.82, p = 0.009) expression were significantly correlated with better RFS in the patients with HCC.
Tumor Size
The relationship between the galectins and tumor size was explored in 10 study cohorts (16, 18, 20, 22, 25, 26, 29, 30, 32).
High galectin-1 expression was not significantly associated with tumor size (OR = 1.59, 95% CI = 0.74–3.41, p = 0.238) with a significant heterogeneity (I2 = 75.8%, p = 0.042).
High galectin-3 expression was significantly associated with bigger tumor size (OR = 1.69, 95% CI = 1.01–2.84, p = 0.046) without significant heterogeneity (I2 = 48.8%, p = 0.119).
High galectin-4 expression was significantly associated with smaller tumor size (OR = 0.43, 95% CI = 0.2–0.91, p = 0.027); by contrary, high galectin-9 expression was not significantly associated with tumor size (OR = 0.98, 95% CI = 0.7–1.39, p = 0.924) without significant heterogeneity (I2 = 0.0%, p = 0.394).
Tumor-Node-Metastasis Stage
The relationship between the galectins and TNM stage was explored in eight study cohorts (18, 21, 22, 25, 26, 31, 32).
High galectin-1 expression was significantly associated with advanced TNM stage (OR = 2.53, 95% CI = 1.31–4.87, p = 0.006) without significant heterogeneity (I2 = 41.9%, p = 0.189).
High galectin-3 expression was not significantly associated with TNM stage (OR = 2.06, 95% CI = 0.82–5.16, p = 0.122) with a significant heterogeneity (I2 = 66.6%, p = 0.030). Sensitivity analysis illustrated that the study by Kong et al. (26) displayed an apparent influence on the overall result of the meta-analysis (Supplementary Figure 2). After the exclusion of this study, the pooled OR was similar (OR = 2.90, 95% CI = 1.84–4.56, p = 0.044), but the heterogeneity was statistically insignificant (I2 = 0.0%, p = 0.731).
High galectin-4 (OR = 0.49, 95% CI = 0.28–0.86, p = 0.013) and galectin-9 (OR = 0.44, 95% CI = 0.20–0.98, p = 0.044) expression were significantly associated with early TNM stage.
Differentiation Grade
The relationship between the galectins and tumor differentiation grade was explored in 11 study cohorts (16, 18, 20–22, 26, 29–32).
High galectin-1 expression was not significantly associated with differentiation grade (OR = 0.96, 95% CI = 0.7–1.32, p = 0.795) without significant heterogeneity (I2 = 0.0%, p = 0.830).
High galectin-3 expression was not significantly associated with differentiation grade (OR = 2.13, 95% CI = 0.97–4.69, p = 0.061) with a significant heterogeneity (I2 = 65.6%, p = 0.033). Sensitivity analysis demonstrated that the study by Fang et al. (31) displayed an apparent influence on the overall result of the meta-analysis (Supplementary Figure 3). After the exclusion of this study, the pooled OR was similar (OR = 1.65, 95% CI = 1.01–2.69, p = 0.044), but the heterogeneity was statistically insignificant (I2 = 18.5%, p = 0.293).
High galectin-4 expression was significantly associated with well-differentiation grade (OR = 0.35, 95% CI = 0.16–0.78, p = 0.010).
High galectin-9 expression was not significantly associated with tumor differentiation grade (OR = 0.70, 95% CI = 0.34–1.47, p = 0.348) with a significant heterogeneity (I2 = 70.2%, p = 0.035). Sensitivity analysis illustrated that the study by Gu et al. (30) displayed an apparent influence on the overall result of the meta-analysis (Supplementary Figure 4). After the exclusion of this study, the pooled OR was similar (OR = 0.51, 95% CI = 0.28–0.95, p = 0.034), but the heterogeneity was statistically insignificant (I2 = 35.0%, p = 0.215).
Vascular Invasion
The relationship between the galectins and vascular invasion was explored in seven study cohorts (16, 20–22, 25, 30, 32).
High galectin-1 expression was significantly associated with positive vascular invasion (OR = 1.74, 95% CI = 1.18–2.58, p = 0.005) without significant heterogeneity (I2 = 0.0%, p = 0.679).
High galectin-3 expression was significantly associated with positive vascular invasion (OR = 2.98, 95% CI = 1.58–5.60, p = 0.001) without significant heterogeneity (I2 = 0.0%, p = 0.421).
High galectin-4 expression was significantly associated with negative vascular invasion (OR = 0.36, 95% CI = 0.19–0.72, p = 0.003).
High galectin-9 expression was significantly associated with negative vascular invasion (OR = 0.60, 95% CI = 0.37–0.97, p = 0.037) without significant heterogeneity (I2 = 2.8%, p = 0.311).
Meta-Analyses Regarding the Galectins With the Risk of Different Liver Diseases
About 18 studies involving 24 cohorts and 1,048 patients focused on the relationship between the serum galectin levels and the risk of different liver diseases (25, 30, 33–48) (Table 3). Among them, 16 studies focused on galectin-3 (25, 33–38, 40–48), and two studies focused on galectin-9 (30, 39). Results of the meta-analyses are shown in Table 4.
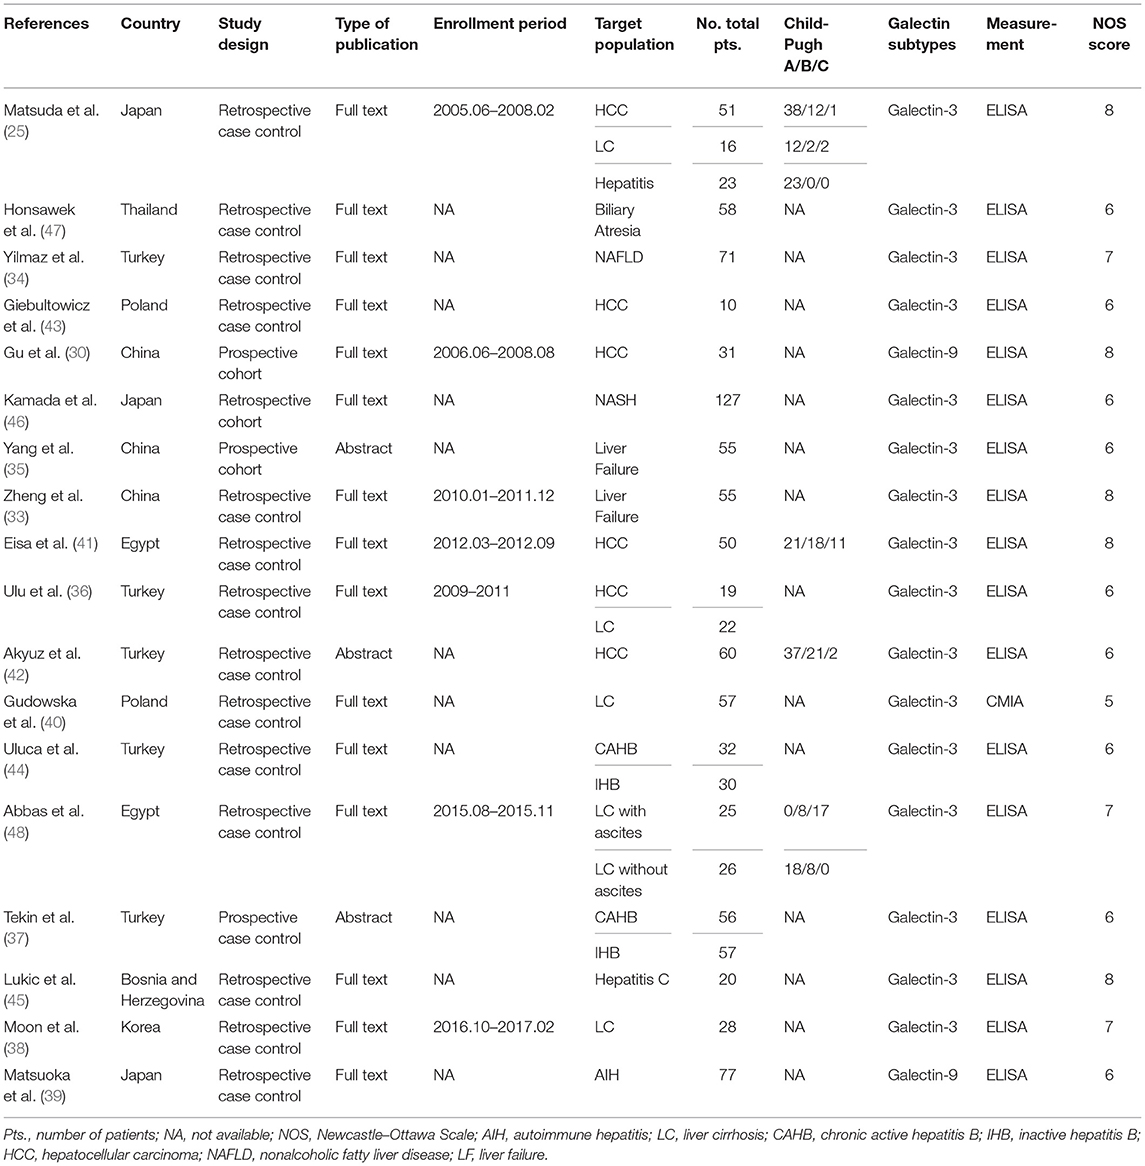
Table 3. Characteristics of the included studies regarding the galectins with the risk of different liver diseases.
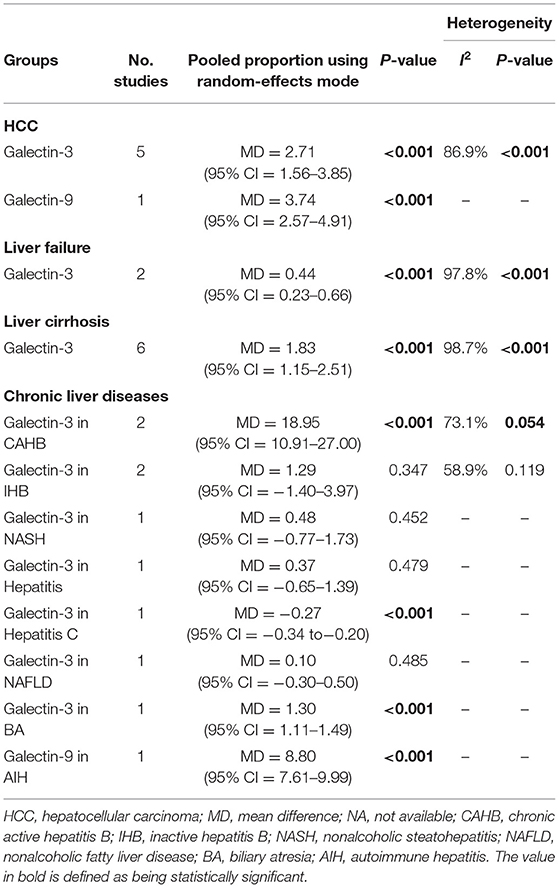
Table 4. Galectins with the risk of different liver diseases: results of the meta-analyses.
Hepatocellular Carcinoma
The relationship between the galectins and the risk of HCC was explored in six study cohorts (25, 30, 36, 41–43). Among them, five study cohorts selected the healthy volunteers as the control subjects, and one study cohort selected the patients with chronic hepatitis as the control subjects.
Serum galectin-3 level was significantly higher in the patients with HCC compared to the healthy volunteers or the patients with chronic hepatitis (MD = 2.71, 95% CI = 1.56–3.85, p < 0.001) with a significant heterogeneity (I2 = 86.9%, p < 0.001). Sensitivity analysis illustrated that the study by Akyuz et al. (42) displayed an apparent influence on the overall result of the meta-analysis (Supplementary Figure 5). After the exclusion of this study, the pooled MD was similar (MD = 2.28, 95% CI = 2.07–2.50, p < 0.001), but the heterogeneity was statistically insignificant (I2 = 0.6%, p = 0.389).
Serum galectin-9 level was significantly higher in the patients with HCC compared to the healthy volunteers (MD = 3.74, 95% CI = 2.57–4.91, p < 0.001).
Liver Failure
The relationship between galectin-3 and the risk of liver failure was explored in two study cohorts, both of which selected the healthy volunteers as the control subjects (33, 35).
Serum galectin-3 level was significantly higher in the patients with liver failure compared to the healthy volunteers (MD = 0.44, 95% CI = 0.23–0.66, p < 0.001) with a significant heterogeneity (I2 = 97.8%, p < 0.001).
Liver Cirrhosis
The relationship between galectin-3 and the risk of liver cirrhosis was explored in six study cohorts, all of which selected healthy volunteers as the control subjects (25, 36, 38, 40, 48).
Serum galectin-3 level was significantly higher in the patients with liver cirrhosis compared to the healthy volunteers (MD = 1.83, 95% CI = 1.15–2.51, p < 0.001) with a significant heterogeneity (I2 = 98.3%, p < 0.001). Sensitivity analysis did not find any source of heterogeneity.
Other Chronic Liver Diseases
The relationship between the galectins and the risk of other chronic liver diseases, including inactive hepatitis B, chronic active hepatitis B, non-alcoholic steatohepatitis, hepatitis C, autoimmune hepatitis, non-alcoholic fatty liver disease, and biliary atresia, was explored in 10 study cohorts. All of them selected healthy volunteers as the control subjects (25, 34, 37, 39, 44–47).
In comparison to the healthy volunteers, serum galectin-3 level was significantly higher in chronic active hepatitis B (MD = 18.95, 95% CI = 10.91–27.00, p < 0.001) and biliary atresia (MD = 1.30, 95% CI = 1.11–1.49, p < 0.001), but not inactive hepatitis B (MD = 1.29, 95% CI = 1.40–3.97, p = 0.347), non-alcoholic steatohepatitis (MD = 0.48, 95% CI = 0.77–1.73, p = 0.452), hepatitis (MD = 0.37, 95% CI = 0.65–1.39, p = 0.479), or non-alcoholic fatty liver disease (MD = 0.10, 95% CI = 0.30–0.50, p = 0.485); on the contrary, serum galectin-3 level was significantly lower in hepatitis C (MD = 0.27, 95% CI = 0.34–0.20, p < 0.001) (Figure 2).
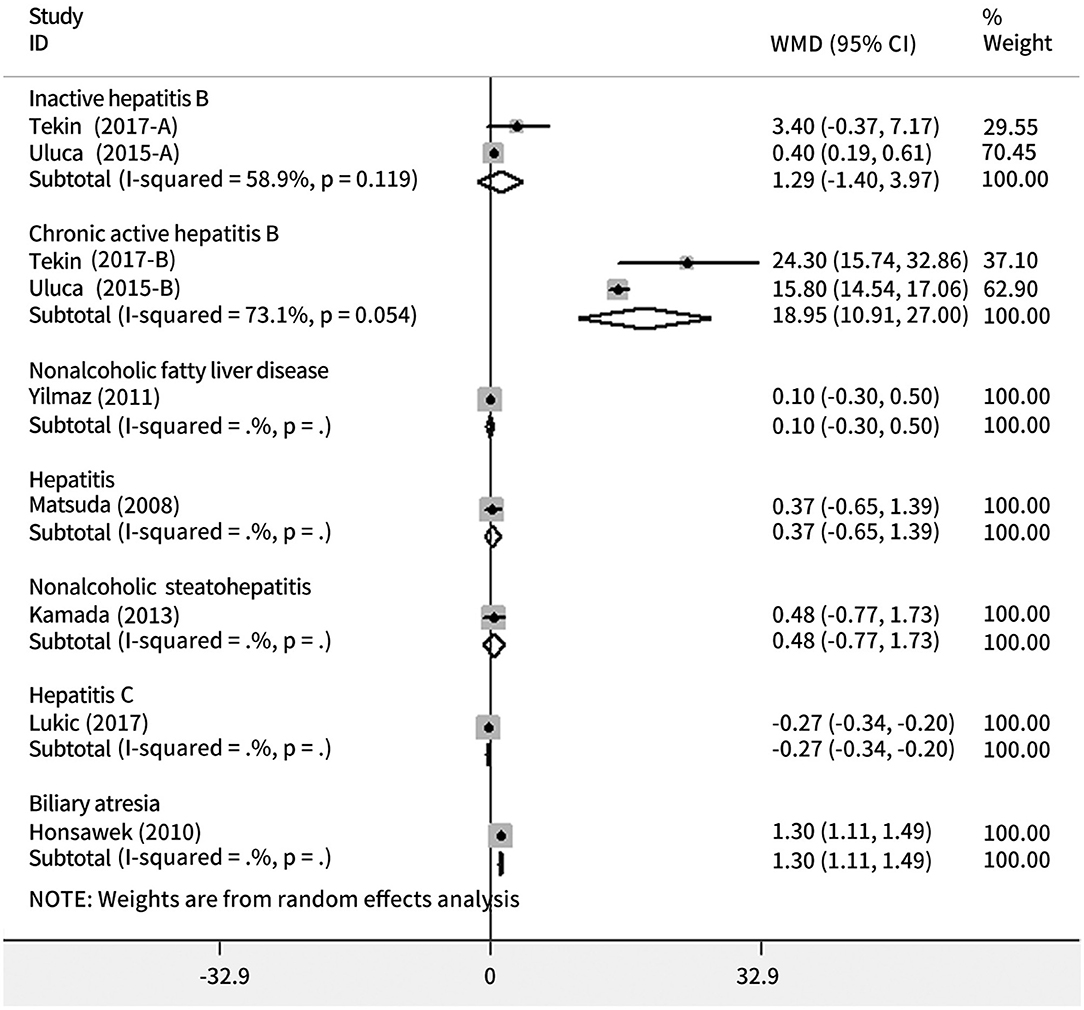
Figure 2. Forest plots showing the association between the risk of chronic liver diseases and galectin-3.
Serum galectin-9 level was significantly higher in the patients with autoimmune hepatitis compared to the healthy volunteers (MD = 8.80, 95% CI = 7.61–9.99, p < 0.001).
Publication Bias
Publication bias is reported in Supplementary Table 1.
Discussion
Until now, 11 subtypes of galectins family have been identified in humans, of which galectin-1,-3, and -9 are the most commonly studied in various diseases (49). According to the current systematic analyses, the role of galectin-1,-3,-4, and -9 was studied in patients with liver diseases.
Patients with HCC have a 5-year survival rate of <12% (50). Therefore, it is vital to identify the biomarkers to predict the prognosis of HCC (51). This study found that the higher serum galectin-3 and -9 levels were associated with an increased risk of HCC and high galectin-1 and -3 and low galectin-4 and -9 expression were significantly associated with worse OS and positive vascular invasion in HCC. Indeed, experimental studies have also suggested the potential mechanisms of galectin-1,-3, and -9 expression in the development and progression of HCC. First, galectin-1 can induce the epithelial–mesenchymal transition (EMT), which is a major process during the progression of cancer in the HCC cells of humans (52). Galectin-1 inhibitor combined with sorafenib can further decrease the tumor size (53). Second, galectin-3 can inhibit the tumor-reactive T cells and promote tumor growth in the mice receiving the tumor-reactive CD8+ T cells (54). Silencing of galectin-3 can significantly reduce the mRNA and protein levels of urokinase-type plasminogen activator receptor (uPAR) and downstream signaling transduction pathway of uPARs in the HCC cells by inhibiting the MEK/ERK signaling pathway, further influencing the proliferation, migration, and invasion of the HCC cells (55). Third, galectin-9 can inhibit the growth of the HCC cell lines by inducing cell apoptosis (56). Galectin-9 also increases the number of Tim-3+ dendritic cells and CD8+ T cells and enhances antitumor immunity through the interaction of galectin-9 with Tim-3 (57). By comparison, blockade of the Tim-3/galectin-9 signaling pathway importantly increases the functionality of tumor-infiltrating Tim-3+ T cells and is negatively associated with the survival of patients with HCC (58).
Another major finding of this study was that higher serum galectin-3 level was associated with an increased risk of liver failure, liver cirrhosis, and chronic active hepatitis B. Other evidence was also in favor of the importance of galectin-3 in these liver diseases. First, if the patients with acute-on-chronic liver failure related to hepatitis B had galectin-3 methylated promoter, they would have shorter survival time, higher 3-month mortality, and higher model for end-stage liver disease (MELD) score (59). Second, galectin-3 modulates the phagocytosis-induced hepatic stellate cell activation and liver fibrosis in vivo (60). Galectin-3 level is significantly higher in the Child–Pugh class C and positively correlates with the MELD score, suggesting the association of galectin-3 level with hepatic decompensation (61). By comparison, the galectin-3 inhibitor can reduce the hepatic venous pressure gradient in patients with esophageal varices (62). Third, galectin-3 deficiency can lead to a significant reduction in the incidence of concanavalin A-induced hepatitis in mice by inhibiting inflammation (63).
This study did not find any significant association of serum galectin-3 level with inactive hepatitis B, non-alcoholic steatohepatitis, or non-alcoholic fatty liver disease. This illustrated that the impact of galectin-3 level on chronic liver diseases might be dependent upon the severity and stage of liver damage (40). Indeed, the evidence regarding the role of galectin-3 in non-alcoholic fatty liver disease and non-alcoholic steatohepatitis is also controversial. Some studies have shown that galectin-3 deficiency in male mice can spontaneously develop non-alcoholic fatty liver disease and more severe hepatic injury (64, 65). In contrast, other studies have reported that galectin-3 ablation protected the mice from the diet-induced non-alcoholic steatohepatitis (66).
There were several limitations in this study. First, this meta-analysis contained a relatively small number of studies, which might lead to insufficient statistical power. Second, the cutoff values of high galectin expression were heterogeneous among the studies. Third, HR values were not directly reported in the six included studies, where their survival data were extracted from the Kaplan–Meier curves by the Engauge Digitizer 4.1 software. Fourth, most of the included studies were from Asia. Our findings are not a global representation.
In conclusion, based on this systematic review and meta-analysis, both high galectin-1 and -3 and low galectin-4 and -9 expression in the tissues were significantly related to worse prognosis and positive vascular invasion in patients with HCC and serum galectin-3 level was associated with the risk of HCC, liver failure, liver cirrhosis, and chronic active hepatitis B (Figure 3). Further studies are needed to explore the role of galectins as a potential therapeutic target and biomarker for liver diseases.
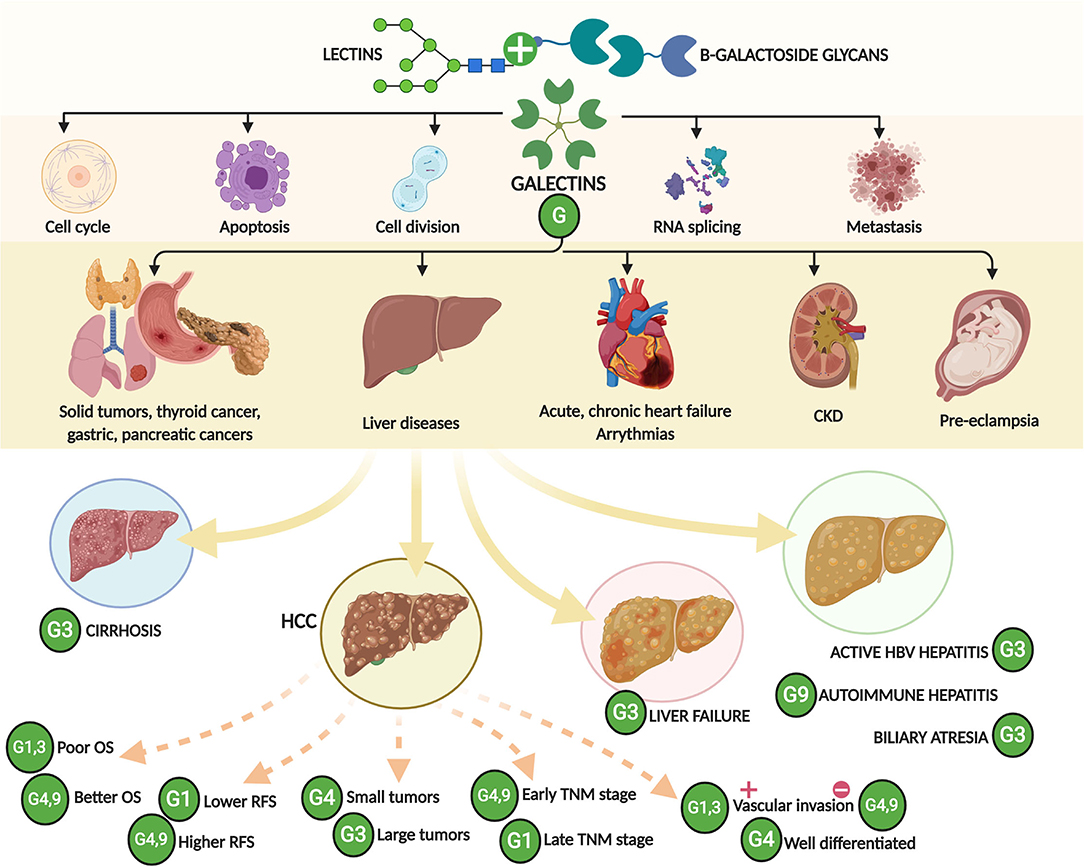
Figure 3. A schematic drawing showing the major findings of this study. CKD, chronic kidney disease; OS, overall survival; RFS, relapse-free survival; HCC, hepatocellular carcinoma; TNM, tumor-node-metastasis.
Data Availability Statement
The original contributions presented in the study are included in the article/Supplementary Material, further inquiries can be directed to the corresponding author/s.
Author Contributions
XQ contributed to the conceptualization, supervision, and project administration. YA, SX, YL, XX, and XQ contributed to the methodology, formal analysis, data curation, and writing the original draft. YA, SX, YL, XX, CP, JC, NM-S, XG, and XQ contributed to the validation, writing, review, and editing. All authors contributed to the article and approved the submitted version.
Conflict of Interest
The authors declare that the research was conducted in the absence of any commercial or financial relationships that could be construed as a potential conflict of interest.
Publisher's Note
All claims expressed in this article are solely those of the authors and do not necessarily represent those of their affiliated organizations, or those of the publisher, the editors and the reviewers. Any product that may be evaluated in this article, or claim that may be made by its manufacturer, is not guaranteed or endorsed by the publisher.
Supplementary Material
The Supplementary Material for this article can be found online at: https://www.frontiersin.org/articles/10.3389/fmed.2021.744518/full#supplementary-material
Supplementary Figure 1. Sensitivity analysis of galectin-3 expression with overall survival (OS) in HCC.
Supplementary Figure 2. Sensitivity analysis of galectin-3 expression with TNM stage in HCC.
Supplementary Figure 3. Sensitivity analysis of galectin-3 expression with the differentiation grade in HCC.
Supplementary Figure 4. Sensitivity analysis of galectin-9 expression with the differentiation grade in HCC.
Supplementary Figure 5. Sensitivity analysis of serum galectin-3 level with the risk of HCC.
Supplementary Table 1. Publication bias.
References
1. Sarin SK, Kumar M, Eslam M, George J, Al Mahtab M, Akbar SMF, et al. Liver diseases in the Asia-Pacific region: a lancet gastroenterology & hepatology commission. Lancet Gastroenterol Hepatol. (2020) 5:167–228. doi: 10.1016/S2468-1253(19)30342-5
2. Available, online at: http://www.healthdata.org/results/gbd_summaries/2019/acute-hepatitis-level-3-cause.
3. Available, online at: http://www.healthdata.org/results/gbd_summaries/2019/cirrhosis-and-other-chronic-liver-diseases-level-3-cause.
4. Available, online at: http://www.healthdata.org/results/gbd_summaries/2019/liver-cancer-level-3-cause.
5. Barondes SH, Castronovo V, Cooper DN, Cummings RD, Drickamer K, Feizi T, et al. Galectins: a family of animal beta-galactoside-binding lectins. Cell. (1994) 76:597–8. doi: 10.1016/0092-8674(94)90498-7
6. Timoshenko AV. Towards molecular mechanisms regulating the expression of galectins in cancer cells under microenvironmental stress conditions. Cell Mol Life Sci. (2015) 72:4327–40. doi: 10.1007/s00018-015-2008-x
7. Liu FT, Patterson RJ, Wang JL. Intracellular functions of galectins. Biochim Biophys Acta. (2002) 1572:263–73. doi: 10.1016/S0304-4165(02)00313-6
8. Liu Y, Meng H, Xu S, Qi X. Galectins for diagnosis and prognostic assessment of human diseases: an overview of meta-analyses. Med Sci Monit. (2020) 26:e923901. doi: 10.12659/MSM.923901
9. Sun MJ, Cao ZQ, Leng P. The roles of galectins in hepatic diseases. J Mol Histol. (2020) 51:473–84. doi: 10.1007/s10735-020-09898-1
10. Bacigalupo ML, Manzi M, Rabinovich GA, Troncoso MF. Hierarchical and selective roles of galectins in hepatocarcinogenesis, liver fibrosis and inflammation of hepatocellular carcinoma. World J Gastroenterol. (2013) 19:8831–49. doi: 10.3748/wjg.v19.i47.8831
11. Moher D, Liberati A, Tetzlaff J, Altman DG. Preferred reporting items for systematic reviews and meta-analyses: the PRISMA statement. PLoS Med. (2009) 6:e1000097. doi: 10.1371/journal.pmed.1000097
12. Tierney JF, Stewart LA, Ghersi D, Burdett S, Sydes MR. Practical methods for incorporating summary time-to-event data into meta-analysis. Trials. (2007) 8:16. doi: 10.1186/1745-6215-8-16
13. Stang A. Critical evaluation of the Newcastle-Ottawa scale for the assessment of the quality of nonrandomized studies in meta-analyses. Eur J Epidemiol. (2010) 25:603–5. doi: 10.1007/s10654-010-9491-z
14. Higgins JP, White IR, Anzures-Cabrera J. Meta-analysis of skewed data: combining results reported on log-transformed or raw scales. Statist Med. (2008) 27:6072–92. doi: 10.1002/sim.3427
15. Egger M, Davey Smith G, Schneider M, Minder C. Bias in meta-analysis detected by a simple, graphical test. BMJ. (1997) 315:629–34. doi: 10.1136/bmj.315.7109.629
16. Zhang ZY, Dong JH, Chen YW, Wang XQ, Li CH, Wang J, et al. Galectin-9 acts as a prognostic factor with antimetastatic potential in hepatocellular carcinoma. Asian Pacific J Cancer Prevent. (2012) 13:2503–9. doi: 10.7314/APJCP.2012.13.6.2503
17. Zhang PF, Li KS, Shen YH, Gao PT, Dong ZR, Cai JB, et al. Galectin-1 induces hepatocellular carcinoma EMT and sorafenib resistance by activating FAK/PI3K/AKT signaling. Cell Death Dis. (2016) 7:324. doi: 10.1038/cddis.2015.324
18. You Y, Tan JX, Dai HS, Chen HW, Xu XJ, Yang AG, et al. MiRNA-22 inhibits oncogene galectin-1 in hepatocellular carcinoma. Oncotarget. (2016) 7:57099–116. doi: 10.18632/oncotarget.10981
19. Yeh CC, Hsu CH, Shao YY, Ho WC, Tsai MH, Feng WC, et al. Integrated stable isotope labeling by amino acids in cell culture (SILAC) and isobaric tags for relative and absolute quantitation (iTRAQ) quantitative proteomic analysis identifies galectin-1 as a potential biomarker for predicting sorafenib resistance in liver cancer. Mol Cell Proteomics. (2015) 14:1527–45. doi: 10.1074/mcp.M114.046417
20. Wu H, Chen P, Liao R, Li YW, Yi Y, Wang JX, et al. Overexpression of galectin-1 is associated with poor prognosis in human hepatocellular carcinoma following resection. J Gastroenterol Hepatol. (2012) 27:1312–9. doi: 10.1111/j.1440-1746.2012.07130.x
21. Spano D, Russo R, Di Maso V, Rosso N, Terracciano LM, Roncalli M, et al. Galectin-1 and its involvement in hepatocellular carcinoma aggressiveness. Mol Med. (2010) 16:102–15. doi: 10.2119/molmed.2009.00119
22. Song M, Pan Q, Yang J, He J, Zeng J, Cheng S, et al. Galectin-3 favours tumour metastasis via the activation of β-catenin signalling in hepatocellular carcinoma. Br J Cancer. (2020) 123:1521–34. doi: 10.1038/s41416-020-1022-4
23. Sideras K, de Man RA, Harrington SM, Polak WG, Zhou G, Schutz HM, et al. Circulating levels of PD-L1 and Galectin-9 are associated with patient survival in surgically treated Hepatocellular Carcinoma independent of their intra-tumoral expression levels. Sci Rep. (2019) 9:10677. doi: 10.1038/s41598-019-47235-z
24. Sideras K, Biermann K, Verheij J, Takkenberg BR, Mancham S, Hansen BE, et al. PD-L1, Galectin-9 and CD8(+) tumor-infiltrating lymphocytes are associated with survival in hepatocellular carcinoma. Oncoimmunology. (2017) 6:e1273309. doi: 10.1080/2162402X.2016.1273309
25. Matsuda Y, Yamagiwa Y, Fukushima K, Ueno Y, Shimosegawa T. Expression of galectin-3 involved in prognosis of patients with hepatocellular carcinoma. Hepatol Res. (2008) 38:1098–111. doi: 10.1111/j.1872-034X.2008.00387.x
26. Kong F, Ma HX, Jiang J, Song Y, Guo CS, Jin MS, et al. Expressions of Galectin-3 and Galectin-9 in hepatocellular carcinoma patients and their relationship with prognosis. J Jilin University Med Edition. (2014) 40:351–7. doi: 10.13481/j.1671-587x.20140226
27. Kong F, Jiang J, Jin M. Increased galectin-3 expression is related to poor prognosis in hepatocellular carcinoma. Hepatol Int. (2016) 10:S62. doi: 10.1007/s12072-016-9707-8
28. Kong F, Cao X, Jiang J, Jin MS, Ma HX, Niu JQ. Increased galectin-3 expression but not galectin-9 is related to poor prognosis in hepatocellular carcinoma. J Gastroenterol Hepatol. (2014) 29:193. doi: 10.13481/j.1671-587x.20140206
29. Jiang SS, Weng DS, Wang QJ, Pan K, Zhang YJ, Li YQ, et al. Galectin-3 is associated with a poor prognosis in primary hepatocellular carcinoma. J Transl Med. (2014) 12:273. doi: 10.1186/s12967-014-0273-3
30. Gu CJ, Wu H, Sheng CY, Ni QC. Expression and prognostic value of galectin-9 in hepatocellular carcinoma patients. Zhonghua yi xue za zhi. (2013) 93:2025–8. doi: 10.3760/ema.j.issn.0376-2491.2013.26.003
31. Fang QQ, Ni RZ, Xiao MB, Jiang F, Lu CH. [Serum and tissue expressions of galectin-3 in hepatocellular carcinoma and the clinical significances]. Zhonghua gan zang bing za zhi. (2011) 19:527–31. doi: 10.3760/cma.j.issn.1007-3418.2011.07.014
32. Cai Z, Liu X, Liu J. Galectin-4 serves as a prognostic biomarker for the early recurrence / metastasis of hepatocellular carcinoma. Hepatol Int. (2017) 11:S384. doi: 10.1111/cas.12536
33. Zheng Y, Wu Z, Dong L, Zhang L, Xiao L, Shi DY, et al. Relationship between serum galectin-3 levels and mortality of subacute on chronic liver failure. Zhonghua gan zang bing za zhi. (2014) 22:295–8. doi: 10.3760/cma.j.issn.1007-3418.2014.04.012
34. Yilmaz Y, Eren F, Kurt R, Yonal O, Polat Z, Senates E, et al. Serum galectin-3 levels in patients with nonalcoholic fatty liver disease. Clin Biochem. (2011) 44:955–8. doi: 10.1016/j.clinbiochem.2011.05.015
35. Yang YF, Zhen YS, Zhang L, Shi DY, Xiao LY. Serum galectin-3 levels in patients with liver failure and its correlation with prognosis. J Hepatol. (2014) 60:S68. doi: 10.1016/S0168-8278(14)60168-9
36. Ulu M, Alacacioglu A, Yuksel E, Pamukk BO, Bozkaya G, Ari A, et al. Prognostic significance of serum galectin-3 levels in patients with hepatocellular cancer and chronic viral hepatitis. Saudi J Gastroenterol. (2015) 21:47–50. doi: 10.4103/1319-3767.151228
37. Tekin R, Deveci O, Celen MK. Evulation of prolidase enzyme, hidroxiprolyne and galectin levels as a marker for fibrosis in patients with chronic hepatitis B. Hepatol Int. (2017) 11:S48–S9. doi: 10.1007/s12072-016-9783-9
38. Moon HW, Park M, Hur M, Kim H, Choe WH, Yun YM. Usefulness of enhanced liver fibrosis, glycosylation isomer of mac-2 binding protein, galectin-3, and soluble suppression of tumorigenicity 2 for assessing liver fibrosis in chronic liver diseases. Ann Lab Med. (2018) 38:331–7. doi: 10.3343/alm.2018.38.4.331
39. Matsuoka N, Kozuru H, Koga T, Abiru S, Yamasaki K, Komori A, et al. Galectin-9 in autoimmune hepatitis: Correlation between serum levels of galectin-9 and M2BPGi in patients with autoimmune hepatitis. Medicine. (2019) 98:e16924. doi: 10.1097/MD.0000000000016924
40. Gudowska M, Panasiuk A, Gruszewska E, Cylwik B, Flisiak R, Rogalska M, et al. Galectin-3 concentration in liver diseases. Clin Chem Lab Med. (2015) 53:S1244. doi: 10.1515/cclm-2015-5032
41. Eisa NH, Ebrahim MA, Ragab M, Eissa LA, El-Gayar AM. Galectin-3 and matrix metalloproteinase-9: Perspective in management of hepatocellular carcinoma. J Oncol Pharm Pract. (2015) 21:323–30. doi: 10.1177/1078155214532698
42. Akyuz F, Akyuz U, Iliaz R, Duranyildiz D, Serilmez M, Evirgen S, et al. Are there any new biomarkers as a predictor of survival in hepatocellular carcinoma? United Eur Gastroenterol J. (2015) 3:A525. doi: 10.1177/2050640615601623
43. Giebultowicz J, Polanska-Plachta M, Wroczynski P, Zaborowski P, Polanski JA. How echinoccocosis affects potential cancer markers in plasma: galectin-3, sN-cadherin and sE-cadherin? A preliminary report. Diagnostic Pathol. (2012) 7:17. doi: 10.1186/1746-1596-7-17
44. Uluca Ü, Sen V, Ece A, Tan I, Karabel D, Aktar F, et al. Serum galectin-3 levels in children with chronic hepatitis B infection and inactive hepatitis B carriers. Med Sci Monit. (2015) 21:1376–80. doi: 10.12659/MSM.894035
45. Lukic R, Gajovic N, Jovanovic I, Jurisevic M, Mijailovic Z, Maric V, et al. Potential hepatoprotective role of galectin-3 during HCV infection in end-stage renal disease patients. Dis Markers. (2017) 2017:6275987. doi: 10.1155/2017/6275987
46. Kamada Y, Fujii H, Fujii H, Sawai Y, Doi Y, Uozumi N, et al. Serum Mac-2 binding protein levels as a novel diagnostic biomarker for prediction of disease severity and nonalcoholic steatohepatitis. Proteomics Clin App. (2013) 7:648–56. doi: 10.1002/prca.201200137
47. Honsawek S, Chongsrisawat V, Praianantathavorn K, Theamboonlers A, Poovorawan Y. Elevation of serum galectin-3 and liver stiffness measured by transient elastography in biliary atresia. Eur J Pediatric Surg. (2011) 21:250–4. doi: 10.1055/s-0031-1273776
48. Abbas WA, Kasem Ahmed SM, Abdel Aal AM, Mahmoud AA, Abdelmalek MO, Mekky MA, et al. Galactin-3 and brain natriuretic peptide versus conventional echocardiography in the early detection of cirrhotic cardiomyopathy. Turk J Gastroenterol. (2016) 27:367–74. doi: 10.5152/tjg.2016.16100
49. Chou FC, Chen HY, Kuo CC. Role of galectins in tumors and in clinical immunotherapy. Int J Mol Sci. (2018) 19:430. doi: 10.3390/ijms19020430
50. El-Serag HB. Hepatocellular carcinoma. N Engl J Med. (2011) 365:1118–27. doi: 10.1056/NEJMra1001683
51. Zhang X, Bai Y, Xu L, Zhang B, Feng S, Xu L, et al. Clinical and morpho-molecular classifiers for prediction of hepatocellular carcinoma prognosis and recurrence after surgical resection. Hepatol Int. (2019) 13:715–25. doi: 10.1007/s12072-019-09978-9
52. Bacigalupo ML, Manzi M, Espelt MV, Gentilini LD, Compagno D, Laderach DJ, et al. Galectin-1 triggers epithelial-mesenchymal transition in human hepatocellular carcinoma cells. J Cell Physiol. (2015) 230:1298–309. doi: 10.1002/jcp.24865
53. Leung Z, Ko FCF, Tey SK, Kwong EML, Mao X, Liu BHM, et al. Galectin-1 promotes hepatocellular carcinoma and the combined therapeutic effect of OTX008 galectin-1 inhibitor and sorafenib in tumor cells. J Experi Clin Cancer Res. (2019) 38:423. doi: 10.1186/s13046-019-1402-x
54. Peng W, Wang HY, Miyahara Y, Peng G, Wang RF. Tumor-associated galectin-3 modulates the function of tumor-reactive T cells. Cancer Res. (2008) 68:7228–36. doi: 10.1158/0008-5472.CAN-08-1245
55. Zheng D, Hu Z, He F, Gao C, Xu L, Zou H, et al. Downregulation of galectin-3 causes a decrease in uPAR levels and inhibits the proliferation, migration and invasion of hepatocellular carcinoma cells. Oncol Rep. (2014) 32:411–8. doi: 10.3892/or.2014.3170
56. Fujita K, Iwama H, Sakamoto T, Okura R, Kobayashi K, Takano J, et al. Galectin-9 suppresses the growth of hepatocellular carcinoma via apoptosis in vitro and in vivo. Int J Oncol. (2015) 46:2419–30. doi: 10.3892/ijo.2015.2941
57. Nagahara K, Arikawa T, Oomizu S, Kontani K, Nobumoto A, Tateno H, et al. Galectin-9 increases Tim-3+ dendritic cells and CD8+ T cells and enhances antitumor immunity via galectin-9-Tim-3 interactions. J Immunol. (2008) 181:7660–9. doi: 10.4049/jimmunol.181.11.7660
58. Li H, Wu K, Tao K, Chen L, Zheng Q, Lu X, et al. Tim-3/galectin-9 signaling pathway mediates T-cell dysfunction and predicts poor prognosis in patients with hepatitis B virus-associated hepatocellular carcinoma. Hepatology. (2012) 56:1342–51. doi: 10.1002/hep.25777
59. Zhao J, Fan YC, Liu XY, Zhao ZH, Li F, Wang K. Hypermethylation of the galectin-3 promoter is associated with poor prognosis of acute-on-chronic hepatitis B liver failure. Digestive Liver Dis. (2017) 49:664–71. doi: 10.1016/j.dld.2017.01.158
60. Jiang JX, Chen X, Hsu DK, Baghy K, Serizawa N, Scott F, et al. Galectin-3 modulates phagocytosis-induced stellate cell activation and liver fibrosis in vivo. Am J Physiol Gastrointestinal Liver Physiol. (2012) 302:G439–46. doi: 10.1152/ajpgi.00257.2011
61. Wanninger J, Weigert J, Wiest R, Bauer S, Karrasch T, Farkas S, et al. Systemic and hepatic vein galectin-3 are increased in patients with alcoholic liver cirrhosis and negatively correlate with liver function. Cytokine. (2011) 55:435–40. doi: 10.1016/j.cyto.2011.06.001
62. Chalasani N, Abdelmalek MF, Garcia-Tsao G, Vuppalanchi R, Alkhouri N, Rinella M, et al. Effects of belapectin, an inhibitor of galectin-3, in patients with nonalcoholic steatohepatitis with cirrhosis and portal hypertension. Gastroenterology. (2020) 158:1334–45.e5. doi: 10.1053/j.gastro.2019.11.296
63. Volarevic V, Milovanovic M, Ljujic B, Pejnovic N, Arsenijevic N, Nilsson U, et al. Galectin-3 deficiency prevents concanavalin A-induced hepatitis in mice. Hepatology. (2012) 55:1954–64. doi: 10.1002/hep.25542
64. Nomoto K, Tsuneyama K, Abdel Aziz HO, Takahashi H, Murai Y, Cui ZG, et al. Disrupted galectin-3 causes non-alcoholic fatty liver disease in male mice. J Pathol. (2006) 210:469–77. doi: 10.1002/path.2065
65. Nomoto K, Nishida T, Nakanishi Y, Fujimoto M, Takasaki I, Tabuchi Y, et al. Deficiency in galectin-3 promotes hepatic injury in CDAA diet-induced nonalcoholic fatty liver disease. Sci World J. (2012) 2012:959824. doi: 10.1100/2012/959824
Keywords: galectins, hepatocellular carcinoma, cirrhosis, hepatitis, fibrosis
Citation: An Y, Xu S, Liu Y, Xu X, Philips CA, Chen J, Méndez-Sánchez N, Guo X and Qi X (2021) Role of Galectins in the Liver Diseases: A Systematic Review and Meta-Analysis. Front. Med. 8:744518. doi: 10.3389/fmed.2021.744518
Received: 20 July 2021; Accepted: 22 September 2021;
Published: 27 October 2021.
Edited by:
Carmen Peralta Uroz, Institut de Recerca Biomèdica August Pi i Sunyer (IDIBAPS), SpainReviewed by:
María Fernanda Troncoso, Universidad de Buenos Aires, ArgentinaDebjyoti Kundu, Indiana University School of Medicine, United States
Copyright © 2021 An, Xu, Liu, Xu, Philips, Chen, Méndez-Sánchez, Guo and Qi. This is an open-access article distributed under the terms of the Creative Commons Attribution License (CC BY). The use, distribution or reproduction in other forums is permitted, provided the original author(s) and the copyright owner(s) are credited and that the original publication in this journal is cited, in accordance with accepted academic practice. No use, distribution or reproduction is permitted which does not comply with these terms.
*Correspondence: Xingshun Qi, eGluZ3NodW5xaUAxMjYuY29t
†These authors share first authorship