 Shuo-Ming Ou1,2,3,4,5,6
 Ming-Tsun Tsai1,2,3,4,5,6
 Huan-Yuan Chen7
 Fu-An Li7
 Wei-Cheng Tseng1,2,3,4,5,6
 Kuo-Hua Lee1,2,3,4,5,6
 Fu-Pang Chang8,9
 Yao-Ping Lin1,2,3,4,5,6
 Ruey-Bing Yang7*
 Der-Cherng Tarng1,2,3,4,5,6,10,11*
- 1Division of Nephrology, Department of Medicine, Taipei Veterans General Hospital, Taipei, Taiwan
- 2School of Medicine, National Yang-Ming University, Taipei, Taiwan
- 3School of Medicine, National Yang Ming Chiao Tung University, Taipei, Taiwan
- 4Institute of Clinical Medicine, National Yang-Ming University, Taipei, Taiwan
- 5Institute of Clinical Medicine, National Yang Ming Chiao Tung University, Taipei, Taiwan
- 6Center for Intelligent Drug Systems and Smart Bio-devices (IDS2B), National Yang Ming Chiao Tung University, Hsinchu, Taiwan
- 7Institute of Biomedical Sciences, Academia Sinica, Taipei, Taiwan
- 8Department of Pathology and Laboratory Medicine, Taipei Veterans General Hospital, Taipei, Taiwan
- 9Inflammation and Immunity Research Center, National Yang-Ming University, Taipei, Taiwan
- 10Department and Institute of Physiology, National Yang-Ming University, Taipei, Taiwan
- 11Department and Institute of Physiology, National Yang Ming Chiao Tung University, Taipei, Taiwan
Background: Galectin-3 (Gal-3) is a multifunctional glycan-binding protein shown to be linked to chronic inflammation and fibrogenesis. Plasma Gal-3 is associated with proteinuria and renal dysfunction, but its role has never been confirmed with kidney biopsy results. In our study, we aimed to explore the expression of Gal-3 in biopsy-proven patients, and we tested the hypothesis that chronic kidney disease (CKD) leads to upregulation of plasma Gal-3 expression in corresponding biopsy findings and RNA sequencing analysis.
Method: In 249 patients (male/female: 155/94, age: 57.2 ± 16.3 years) who underwent kidney biopsy, plasma levels of Gal-3 were measured to estimate the association of renal fibrosis. Relationships between plasma Gal-3 levels, estimated glomerular filtration rate (eGFR) and renal histology findings were also assessed. We further examined the gene expression of Gal-3 in RNA-sequencing analysis in biopsy-proven patients.
Results: Compared to patients without CKD, CKD patients had higher levels of plasma Gal-3 (1,016.3 ± 628.1 pg/mL vs. 811.6 ± 369.6 pg/ml; P = 0.010). Plasma Gal-3 was inversely correlated with eGFR (P = 0.005) but not with proteinuria. Higher Gal-3 levels were associated with interstitial fibrosis, tubular atrophy and vascular intimal fibrosis. RNA-sequencing analysis showed the upregulation of Gal-3 in fibrotic kidney biopsy samples, and the differentially expressed genes were mainly enhanced in immune cell activation and the regulation of cell-cell adhesion.
Conclusions: Plasma Gal-3 levels are inverse correlated with eGFR but positively correlated with renal fibrosis, which may be involved in the immune response and associated pathways. These findings support the role of Gal-3 as a predictive marker of renal fibrosis.
Introduction
Chronic kidney disease (CKD) remains a major public health problem and is one of the leading causes of mortality and morbidity worldwide (1–3). CKD patients are generally asymptomatic, so it is difficult to recognize the early clinical signs or symptoms of CKD (4). Current biomarkers, such as serum blood urea nitrogen, serum creatinine and proteinuria, lack sensitivity for the early detection of the development of CKD (5, 6). Interstitial fibrosis is characterized by the accumulation of collagen-rich extracellular matrix in the interstitium (7, 8). Tubular atrophy is defined as the presence of tubular epithelial thinning with pyknotic nuclei or dilated and thin tubules (9). Interstitial fibrosis and tubular atrophy are considered as the common pathway for CKD progression (9–11). If we can identify these patients in the early disease stage, their renal function decline may be slowed or even reversed. Therefore, it is important to find useful predictive biomarkers to identify individuals at risk for renal fibrosis at the earliest possible stage (12).
Human galectin-3 (Gal-3) is a β-galactoside-binding lectin protein encoded by a single gene (LGALS3) located on chromosome 14 (13). Gal-3 plays a role in signaling in angiogenesis, oncogenic transformation, inflammatory responses and fibrogenic processes (14, 15). Upregulation of Gal-3 expression has been considered a key regulator of inflammation and fibrosis and may contribute to multiple organ fibrosis (16–18). In an in vitro model, Gal-3−/− fibroblasts showed reduced collagen production in response to transforming growth factor-beta 1 (TGF-β1). Moreover, in an in vivo model, Gal-3 knockout mice exhibited a decrease in collagen accumulation and resistance to the development of fibrosis (19, 20). Because there is increasing evidence that Gal-3 is associated with the development of organ fibrosis (21), Gal-3 may serve as a potential biomarker for renal fibrosis through its possible pathogenic mechanisms of action.
In the general population, data from the Framingham Offspring Study, which involved 2,450 subjects, showed that higher plasma levels of Gal-3 were associated with a higher risk of CKD but not with the risk of albuminuria (21). Other studies found that higher plasma Gal-3 levels were associated with poorer survival, renal insufficiency and late allograft failure (22, 23). However, another study consisting of 7,968 subjects from the Prevention of REnal and Vascular ENd-stage Disease (PREVEND) cohort found that the correlation between Gal-3 and renal function was weak (24). Because some inconsistent results exist, this topic deserves further investigation of the links between plasma Gal-3 levels, Gal-3 gene expression and detailed renal pathologic findings.
To address this problem, we performed a prospective study on patients who underwent kidney biopsy to examine the association between their plasma Gal-3 levels and renal histopathology findings. In addition, we examined the gene expression of Gal-3 using RNA-sequencing analysis in kidney specimens. The present study aimed to (1) characterize the associations between plasma Gal-3 and clinical variables and laboratory results, (2) investigate whether plasma Gal-3 was associated with the pathological findings of CKD, such as renal fibrosis and/or tubular atrophy, and (3) identify the gene expression of Gal-3 using RNA-sequencing analysis in kidney biopsy specimens. We also attempted to perform Gene Ontology (GO) and Kyoto Encyclopedia of Genes and Genomes (KEGG) pathway enrichment analyses to explore the possible pathogenesis and potential pathways of Gal-3 in the development of renal fibrosis.
Methods
Study Design and Population
All patients who underwent renal biopsies at the Taipei Veteran General Hospitals between 2018 and 2021 were included in this cohort study. Patients who were younger than 20 years of age, who were unable or unwilling to provide signed informed consent or who were missing plasma Gal-3 measurements were excluded from our study. Finally, 249 patients who underwent renal biopsies and signed the informed consent form were enrolled. The study protocol was approved by the Institutional Review Board of the Taipei Veteran General Hospitals (2018-06-008B).
Clinical Variables and Data Collection
Information for all enrolled patients, including demographic data, underlying comorbidities and laboratory results, was collected. The demographic data included age, sex, body mass index [BMI, calculated using the following formula: weight (kg)/height2 (m2)], systolic blood pressure, and diastolic blood pressure. The underlying comorbidities included diabetes mellitus, coronary artery disease, congestive heart failure, hypertension, dyslipidemia and malignancy. The laboratory parameters assessed were low-density lipoprotein cholesterol, uric acid, albumin, and eGFR. Urinary samples were collected from the patients, and the urine albumin-to-creatinine ratio (UACR) and urine protein-to-creatinine ratio (UPCR) were calculated.
Plasma Gal-3 Measurement and Outcome Definitions
Blood samples were collected at the time of renal biopsy, immediately centrifuged and stored frozen at −80°C until assayed. The plasma Gal-3 concentration was measured as picograms per milliliter (pg/mL) using an inhouse multiplex bead-based immunoassay (25, 26). The estimated GFR (eGFR) was calculated by using the CKD Epidemiology Collaboration equation (27, 28).
Histopathologic Analysis of Kidney Biopsies
Kidney biopsies were reviewed by one pathologist using light microscopy (LM), immunohistochemistry and electron microscopy. Formalin-fixed and paraffin-embedded kidney biopsy specimens were used for LM. The kidney specimens sent for LM were stained with hematoxylin and eosin (H&E), periodic acid–Schiff (PAS) and Masson's trichrome stains. Immunofluorescence staining was performed on frozen kidney specimen sections, which were then examined for immunoglobulin or complement deposits inside the tissues. Electron microscopy examinations of the kidney specimens were performed to observe the ultrastructure of the glomerulus and tubulointerstitium. Pathological findings, including glomerular descriptions (e.g., global sclerosis, segmental sclerosis, double contour of glomerular basement membrane [GBM], GBM rigid, GBM thickening, GBM collapse, GBM attenuation, glomerular necrosis, glomerular inflammatory change, glomerular ischemic change, endocapillary hypertrophy, extracapillary hypertrophy, mesangial hypertrophy, mesangial matrix expansion, mesangial matrix mesangiolysis), tubulointerstitial descriptions (e.g., interstitial inflammation, tubulitis, interstitial edema, interstitial fibrosis, tubular atrophy, acute tubular necrosis, casts and calcinosis) and vasculature descriptions (e.g., hyaline arteriosclerosis, vascular intimal fibrosis, vascular medial proliferation, and vascular necrosis) were examined.
RNA-Sequencing Analysis and Identification of Differentially Expressed Genes (DEGs)
After kidney biopsy specimens were obtained, kidney biopsy specimens were storage in RNAlater and then frozen in −80°C until microdissection. During microdissection, the morphology of glomeruli was identified and carefully picked up by fine forceps in microscopy. After then, the renal tubulointerstitial segments were sent for RNA-sequencing analysis. RNA was extracted using the RNeasy mini kit, and RNA sequencing was performed on the Illumina NovaSeq 6000 platform at 150 bp paired end (29). The annotated RNA counts (fastq) were calculated, and sequence quality was also surveyed with FastQC (30). After trimming adaptors and lower-quality bases, the DEGs among fibrotic groups and control groups were identified using R software with a limma package from the Bioconductor project (31). Fold-changes (FCs) in the gene expression values were calculated, and a FC > 2 and P-value < 0.05 were considered the cutoff values for identifying DEGs.
GO and KEGG Enrichment Analyses
GO is a structured, controlled vocabulary to unify the representation of genes and classify gene functions. The enriched GO terms included three non-overlapping ontologies, including biological process (BP), cellular component (CC) and molecular function (MF) (32, 33). KEGG is a collection of databases for systematic analysis of gene functions and biological systems, which includes most of the known metabolic and gene regulatory pathways for data visualization (34). We conducted GO enrichment and KEGG analyses of the DEGs by using the clusterProfiler package in R software.
Statistical Analyses
In our study, plasma Gal-3 was considered to be a continuous variable and a categorical variable according to the tertile of plasma Gal-3 levels. Correlations between Gal-3, eGFR, serum creatinine, UPCR and UACR were assessed using Pearson's correlation. We also analyzed non-linear associations between plasma Gal-3 levels and eGFR change by restricted cubic spline plots with three knots using tertile of plasma Gal-3 levels. The statistical significance was P < 0.05. Data were analyzed using SAS software (version 9.4; SAS Institute Inc., Cary, NC, USA) and R software (version 3.5.2 for Windows).
Results
Patient Characteristics
The demographic and clinical characteristics of our patients are shown in Table 1. Of the 249 study participants, we divided the study participants into three groups based on the tertile of plasma Gal-3 levels (<610.7, 610.8–1039.8, and >1039.9 pg/mL, respectively). The mean (SD) age of the patients was 57.2 (16.3) years and 62.3% were male. Among them, 64 (25.7%) patients had diabetes mellitus and 105 (42.2%) patients had hypertension. The UACR and UPCR did not differ between the groups.
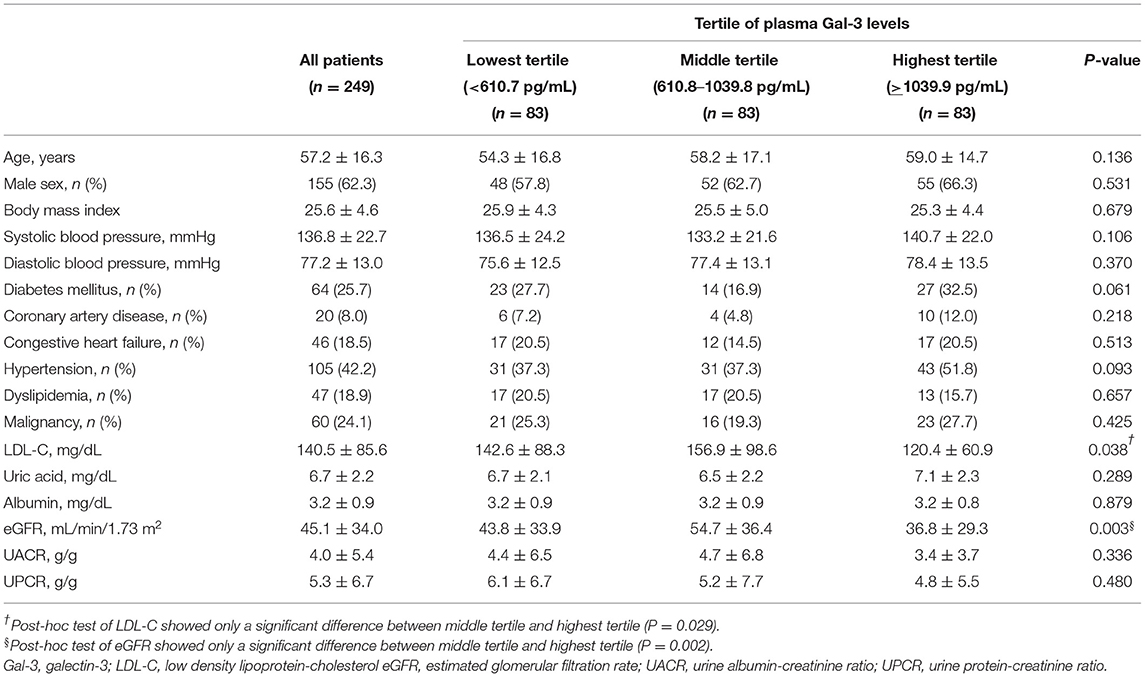
Table 1. Clinical characteristics of our study participants stratified by tertile of plasma Gal-3 levels.
The Associations Between Plasma Gal-3, Survival and CKD
In our study, non-survivors were found to have significantly higher levels of plasma Gal-3 than survivors (1678.9 ± 725.2 pg/mL vs. 944.8 ± 563.9 pg/mL; P = 0.005; Supplementary Figure 1A). Supplementary Table 1 shows the demographic and clinical characteristics of our patients stratified by the presence and absence of CKD. Among the study participants, 180 (72.3%) were in the CKD group (defined as eGFR <60 ml/min/1.73 m2), and 69 (27.7%) were in the non-CKD group. Patients in the CKD group had significantly higher levels of plasma Gal-3 than those in the non-CKD group (1016.3 ± 628.1 pg/mL vs. 811.6 ± 369.6 pg/mL; P = 0.010; Supplementary Figure 1B). In multivariate logistic regression analysis, increment of plasma Gal-3 level was significantly associated with the risks of CKD (per 100 pg/mL increases: adjusted odds ratio 1.07; 95% confidence interval 1.01–1.14; P = 0.032; Supplementary Table 2).
Correlations of Gal-3 With EGFR, Creatinine, UPCR, and UACR
An inverse correlation between Ga1-3 levels and eGFR (P = 0.005) and a positive correlation between Gal-3 levels and serum creatinine (P = 0.005) were found (Figures 1A,B). Notably, while plasma Gal-3 levels appeared to have an inverse correlation with eGFR, the UACR and UPCR were not significantly correlated with plasma Gal-3 levels (Figures 1C,D).
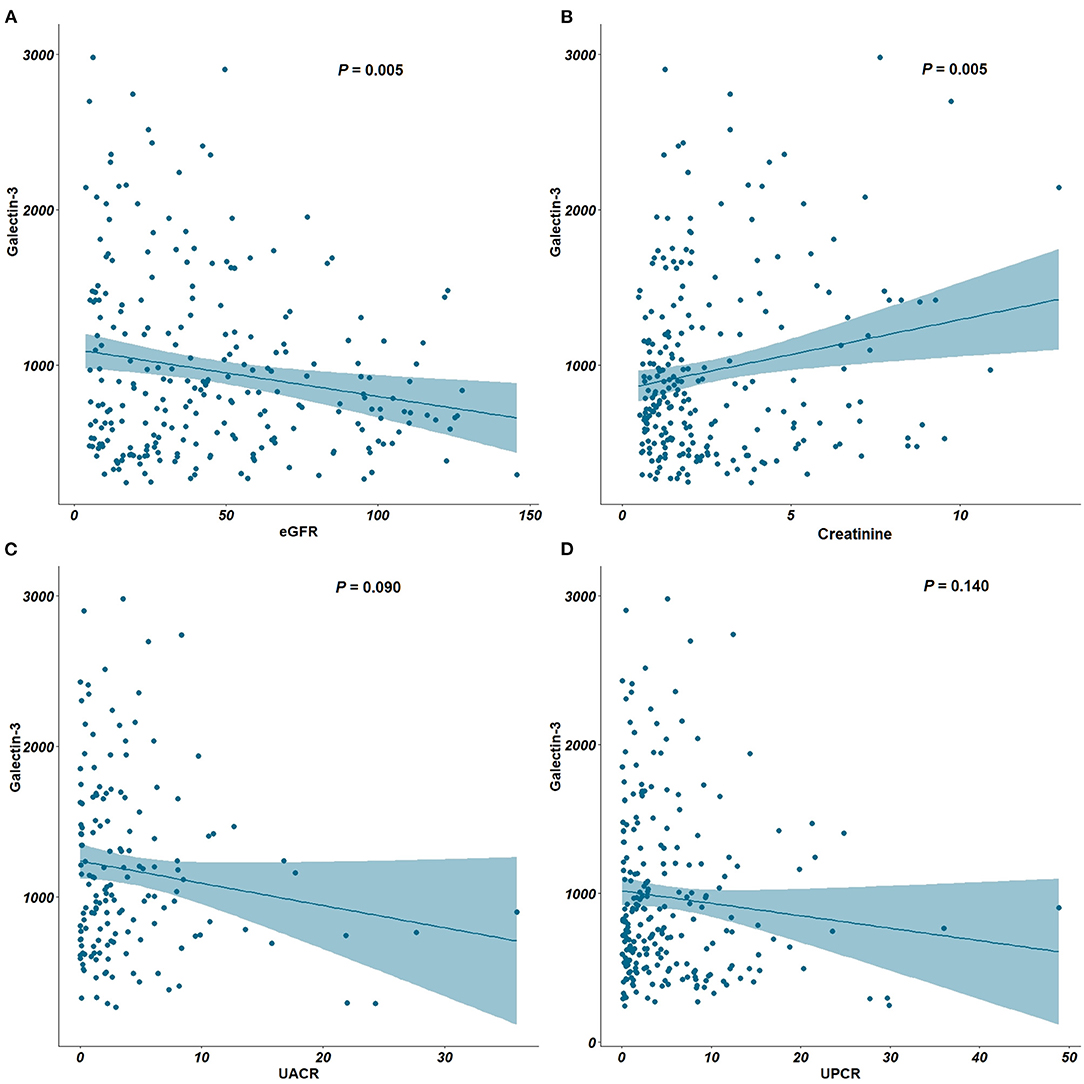
Figure 1. Correlation between plasma Gal-3, eGFR, creatinine, UACR and UPCR. (A) Correlation plots between Gal-3 and eGFR. (B) Correlation plots between Gal-3 and creatinine. (C) Correlation plots between Gal-3 and UACR. (D) Correlation plots between Gal-3 and UPCR. Gal-3, Galectin-3; eGFR, estimated glomerular filtration rate; UACR, urine albumin-creatinine ratio; UPCR, urine protein-creatinine ratio.
Plasma Gal-3 and Annual Change of EGFR in Non-CKD Patients
In non-CKD patients, we analyzed the associations between plasma Gal-3 and eGFR change. Figure 2A shows the restricted cubic spline plots displaying the association between plasma Gal-3 levels and the annual change of eGFR. The higher levels of plasma Gal-3 were associated with significantly greater loss of eGFR. Based on the tertile of plasma Gal-3 levels, the annual change of eGFR showed increase in the lowest tertile of plasma Gal-3, stable in the middle tertile of plasma Gal-3 and decline in the highest tertile of plasma Gal-3. Highest tertile of plasma Gal-3 was associated with significantly greater loss of eGFR compared to middle and lowest tertile of plasma Gal-3 levels (Figure 2B).
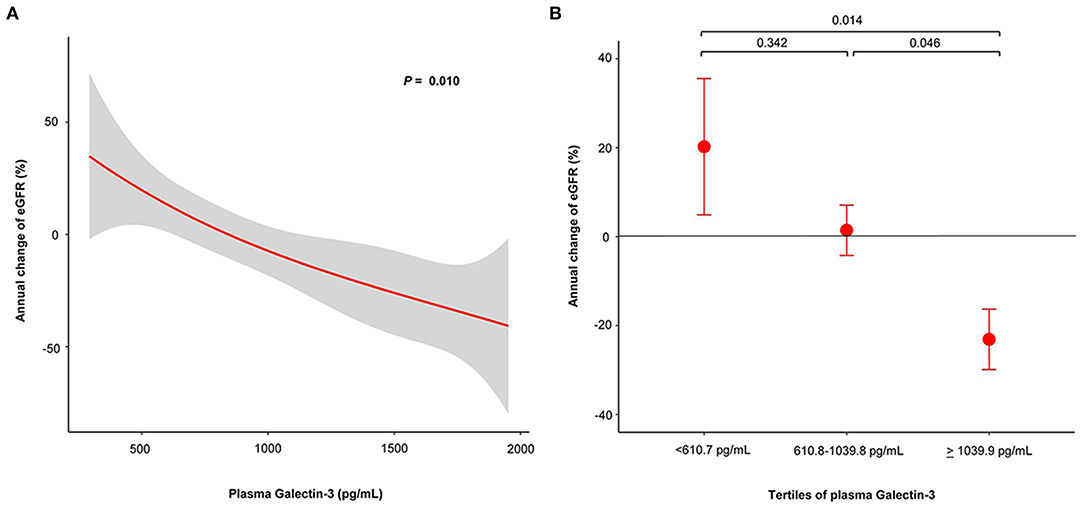
Figure 2. Plasma Gal-3 predicts risk of annual change of eGFR in non-CKD patients whose eGFR > 60 ml/min/1.73 m2. (A) Restricted cubic spline plots of the association between annual change of eGFR and plasma Gal-3 levels. The red line indicates the change of eGFR with the respective 95% confidence interval (gray area). (B) Annual change of eGFR according to tertile of plasma Gal-3 levels. Gal-3, Galectin-3; eGFR, estimated glomerular filtration rate; CKD, chronic kidney disease.
Histopathologic Analysis of Kidney Biopsies
The algorithm of collected kidney biopsy specimens sent for pathology and RNA sequencing analysis is shown in Figure 3A. Plasma Gal-3 levels were not significantly different among the different pathological diagnoses (Figure 3B). The associations between different pathological diagnoses and eGFR, UACR and UPCR are shown in Supplementary Figure 2.
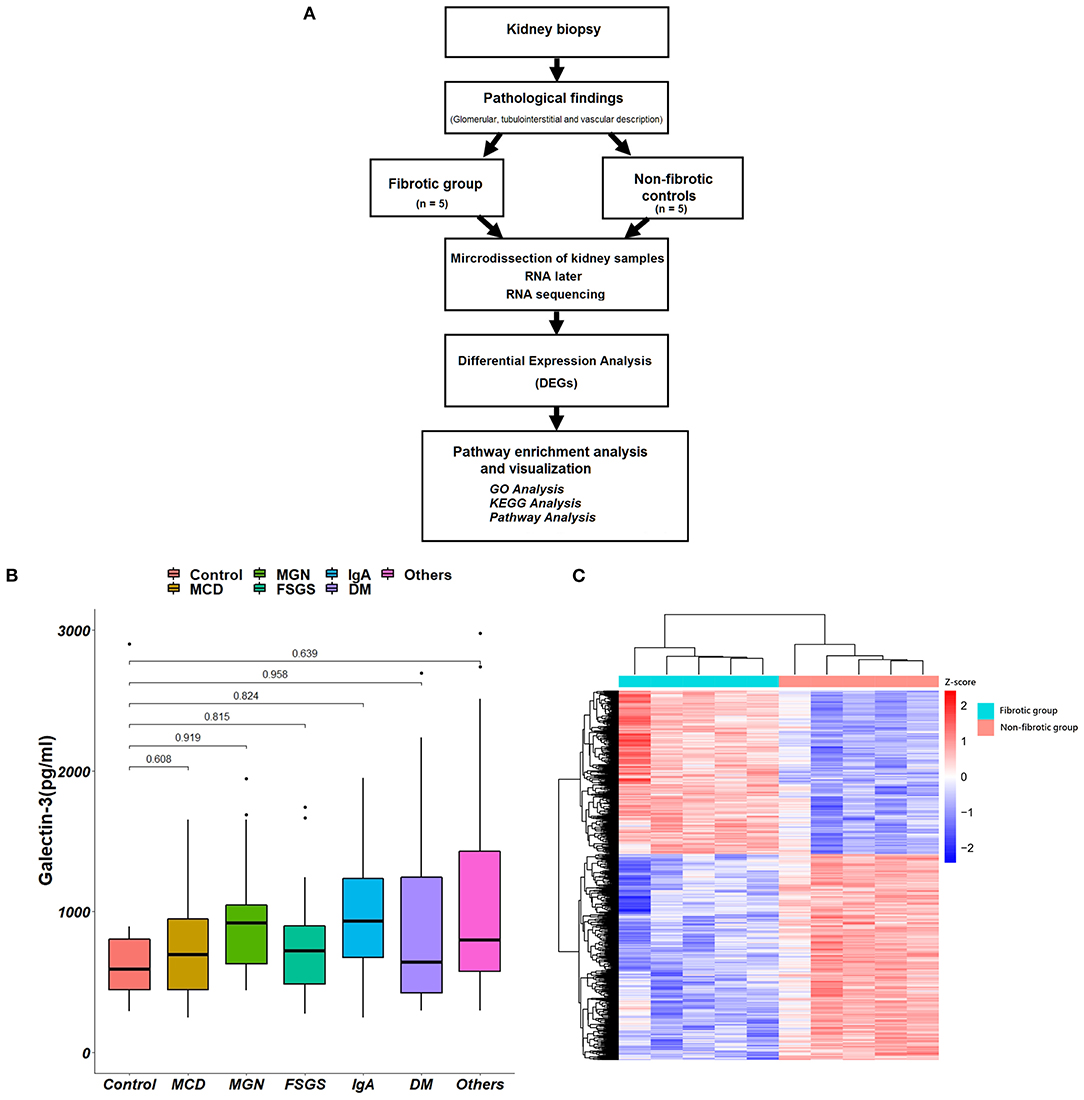
Figure 3. Kidney biopsy specimens for pathology and RNA sequencing analysis. (A) The algorithm of the collections of kidney biopsy specimens. (B) The associations between different pathological diagnoses and plasma Gal-3 levels. (C) The hierarchical clustering heat map shows the expression of different genes between fibrotic groups and non-fibrotic controls. Gal-3, galectin-3; GO, Gene Ontology; KEGG, Kyoto Encyclopedia of Genes and Genomes; MCD, minimal change disease; FSGS, focal segmental glomerulosclerosis; IgA, immunoglobulin A; DM, diabetes mellitus.
As shown in Table 2, we found that higher Gal-3 levels were significantly associated with GBM double contour (P < 0.001), GBM rigid (P = 0.029), glomerular necrosis (P = 0.017), and extracapillary hypertrophy (P = 0.039). Higher Gal-3 levels were associated with interstitial fibrosis (P = 0.028) and tubular atrophy (P = 0.032). For vascular structure, higher Gal-3 levels were also associated with increased vascular intimal fibrosis (P < 0.001) and vascular necrosis (P = 0.017).
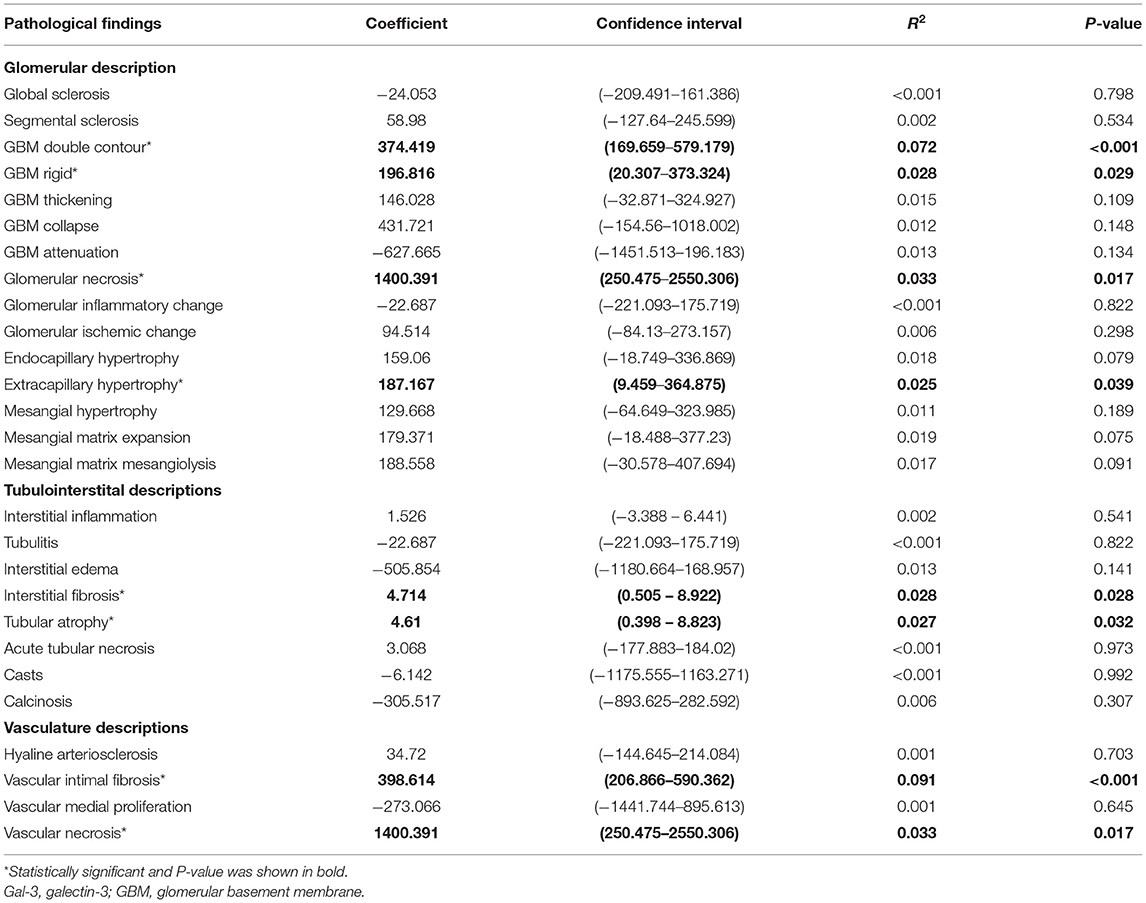
Table 2. Regression for plasma Gal-3 and renal pathological findings.
RNA-Sequencing Analysis Identifies the Gene Expression of Gal-3
We compared the transcriptome profile of renal tubulointerstitial compartments between fibrotic kidney biopsy samples (n = 5; the degree of interstitial fibrosis > 50%) and non-fibrotic controls (n = 5). Heatmaps of the up- and downregulated genes among the DEGs are presented in Figure 3C.
Gene Ontology Analysis
A total of 5,644 DEGs were identified, including 3,164 upregulated genes and 2,480 downregulated genes in fibrotic samples compared to non-fibrotic controls. The volcano plot of the DEGs is shown in Figure 4A. The Gal-3 gene (LGALS3) was upregulated in fibrotic groups compared to non-fibrotic groups. We further performed GO enrichment analysis (Figure 4B). Regarding the BPs, the DEGs were mainly enhanced for T cell activation, regulation of cell-cell adhesion, monocyte cell differentiation and leukocyte cell-cell adhesion involved in the immune response. For the CC functional group, DEGs were enriched on the external side of plasma membrane, collagen-containing extracellular matrix and apical part of the cells, etc. Moreover, for the MF functional group, DEGs were enhanced in immune receptor activity and cytokine binding, etc.
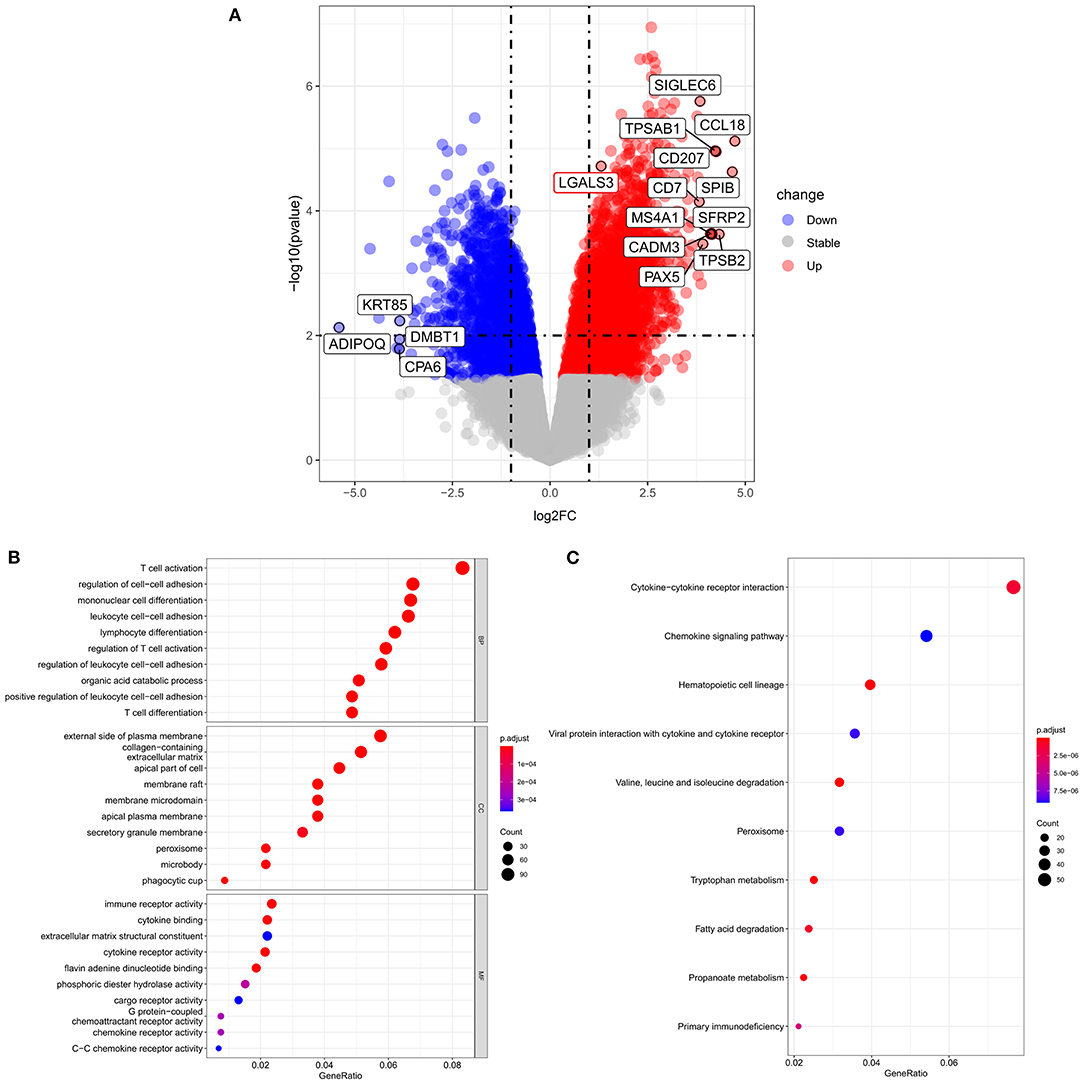
Figure 4. Volcano plots and GO and KEGG enrichment analysis according to RNA sequence analysis. (A) Volcano plot of differentially expressed genes between fibrotic groups and non-fibrotic controls. (B) The biological process, cellular components and molecular function identified from the GO and (C) KEGG enrichment analysis of the RNA sequencing. GO, Gene Ontology; KEGG, Kyoto Encyclopedia of Genes and Genomes.
KEGG Analyses and Pathway Enrichment Analysis
KEGG analyses (Figure 4C) indicated that the top three KEGG pathways included cytokine-cytokine receptor interactions, chemokine signaling pathways, and hematopoietic cell lineages. The KEGG pathways were further visualized by enrichmap according to overlapping gene sets. The Gal-3-encoded gene LGALS3 was connected by both the leukocyte cell-cell adhesion pathway and the regulation of T cell activation pathways (Supplementary Figure 3).
Discussion
Our study aims to explore the association between the expression of Gal-3, pathological findings of kidney biopsy and RNA-sequencing analysis. First, we found that higher Gal-3 levels were associated with an increased risk of renal fibrosis, and Gal-3 was inversely associated with eGFR. Second, we further demonstrated that Gal-3 was associated with interstitial fibrosis, tubular atrophy and vascular intimal fibrosis. Finally, the expression of Gal-3 was upregulated in fibrotic kidney biopsy samples in RNA-sequence analysis. GO enrichment analysis found that the DEGs were mainly enhanced in T cell activation, monocyte cell differentiation, and the regulation of cell-cell adhesion. KEGG analyses also found an association between cytokine-cytokine receptor interactions and chemokine signaling pathways. Taken together, our data suggest that Gal-3 may be associated with a risk of lower eGFR and the development of renal fibrosis through the involved immune response and pathway.
The Framingham Offspring Study, which investigated 2,450 participants from the general population with 10 years of follow-up, found that higher levels of Gal-3 were associated with CKD despite adjustment for other confounding factors (21). The Atherosclerosis Risk in Communities Study consisted of 9,148 African American and white men and women without pre-existing heart failure. Higher plasma Gal-3 levels were also associated with an increased risk of incident CKD, and the association became stronger in patients with hypertension (35). In contrast, however, in the Cardiovascular Heart Study including 2,763 subjects, the association between baseline Gal-3 levels and CKD was not statistically significant in the final analyses (36). Our study provided support that Gal-3 was inversely associated with eGFR in our study participants.
A hospital-based study including 205 outpatients found that Gal-3 levels were considered an early marker for renal dysfunction and the progression of cardiorenal syndrome in heart failure. Stepwise regression analysis found that Gal-3 was not associated with microalbuminuria (37). In contrast, the Framingham Offspring Study including 2,450 participants from 1995 to 2008 found that higher Gal-3 levels were associated with higher risks of incident CKD but were not associated with increased risks of albuminuria. Similar to the findings of the Framingham Offspring Study, our study found that Gal-3 was not associated with either the UPCR or UACR.
Although Gal-3 might play a causal role in tissue remodeling and the development of organ fibrosis (38), a previous study focused on kidney biopsy findings in humans remains scarce (39). In our study, we found that Gal-3 was associated with interstitial fibrosis, tubular atrophy and vascular intimal fibrosis, irrespective of the etiology of renal diseases. Gal-3 is widely expressed in immune cells (40–42), especially in monocytes/macrophages, which profoundly affect critical macrophage functions, such as phagocytosis and phenotype transition (43–45). A mouse model of unilateral ureteral obstruction showed that Gal-3 expression was upregulated, and depletion of Gal-3 protected against the accumulation of renal myofibroblasts and further fibrosis (45). Profibrotic microphages also demonstrated upregulation of several profibrotic genes to stimulate the production of fibronectin and extracellular matrix proteins (46). In addition, extracellular Gal-3 also has the ability to regulate T cell function to regulate further immune responses during fibrotic processes (47, 48). In our RNA sequence analysis, we found that LGALS3 was significantly upregulated in fibrotic groups compared to controls. For the GO enrichment analyses, the DEGs were mainly enhanced for monocyte cell differentiation, T cell activation and cell-cell adhesion. The KEGG pathways also showed that DEGs were enhanced in cytokine-cytokine receptor interactions and chemokine signaling pathways. Laminin, fibronectin and integrins are known ligands for Gal-3, and therefore, Gal-3 may promote pathological fibrotic processes by regulating cell-cell adhesion and cell proliferation (49, 50). Therefore, our study may provide some evidence that Gal-3 plays a multifaceted role in the regulation of inflammatory responses to promote cell-cell interactions and adhesions, which contributes to renal fibrosis that is associated with renal failure.
The strengths of our study are the well-characterized sample, completeness of the data collection and verification of participating patients. Our study showed a positive correlation between Gal-3 and the risk of renal fibrosis. We provided new data indicating that patients with higher levels of Gal-3 have a significantly higher risk of interstitial fibrosis, vascular intimal fibrosis and tubular atrophy than those with lower levels of Gal-3. Another major strength of this study is that it provides RNA-sequencing evidence of the gene expression of Gal-3 and renal pathological findings, which lends further credence to the study findings.
Our study has some limitations that should be considered. All eGFRs were measured once at the time of kidney biopsy. Therefore, it is possible that acute kidney injury or variability in renal function may not have been detected in our analyses. However, all participants in our study had undergone kidney biopsy, and therefore, the definitive etiology of CKD may be assured. Detailed biopsy information, such as the degree of tubular atrophy and interstitial fibrosis, was also identified in our study. Second, the data of our participants were based on a tertiary medical center, which may include more complicated cases with more underlying diseases, and thus, this may limit the generalizability of our results. Finally, we did not perform serial measurements of plasma Gal-3 over time, so whether the change in Gal-3 was associated with renal function progression was unknown. Further prospective studies may be needed to confirm our results and the potential ability of Gal-3 as a biomarker of CKD progression.
In conclusion, we found an association between plasma Gal-3 and the risk of renal fibrosis in kidney biopsy specimens. Gal-3 may be considered a potential biomarker for detecting renal fibrosis, potentially affording an opportunity for early intervention to prevent disease progression. However, the precise mechanisms of Gal-3 in the development of CKD warrant further investigation.
Data Availability Statement
The datasets presented in this study can be found in online repositories. The names of the repository/repositories and accession number(s) can be found below: https://www.ncbi.nlm.nih.gov/bioproject/770300. Accession number(s):PRJNA770300.
Ethics Statement
The studies involving human participants were reviewed and approved by Taipei Veteran General Hospitals (2018-06-008B). The patients/participants provided their written informed consent to participate in this study.
Author Contributions
S-MO, M-TT, H-YC, F-AL, W-CT, K-HL, F-PC, Y-PL, R-BY, and D-CT: conception and study design. S-MO, M-TT, H-YC, F-AL, W-CT, K-HL, F-PC, and D-CT: data acquisition. S-MO, M-TT, R-BY, and D-CT: data analysis/interpretation and statistical analysis. S-MO, M-TT, H-YC, F-AL, W-CT, K-HL, F-PC, Y-PL, R-BY, and D-CT: drafting of the manuscript. All authors contributed to the article and approved the submitted version.
Funding
This work was supported in part by the Ministry of Science and Technology, Taiwan (MOST 106-2314-B-010-039-MY3, MOST 107-2314-B-075-052, MOST 108-2314-B-075-008, MOST 109-2314-B-075−067-MY3, MOST 109-2320-B-075-006, MOST 110-2321-B-A49-003); Taipei Veterans General Hospital (V107B-027, V108B-023, V108C-103, V108D42-004-MY3-1, V108D42-004-MY3-2, V108D42-004-MY3-3, V109B-022, V109C-114, V109D50-001-MY3-1, V109D50-001-MY3-2, V110C-152, V110E-003-2); Taipei, Taichung, Kaohsiung Veterans General Hospital, Tri-Service General Hospital, Academia Sinica Joint Research Program (VTA110-V1-3-1); Taipei Veterans General Hospital-National Yang-Ming University Excellent Physician Scientists Cultivation Program (No. 104-V-B-044); Institute of Biomedical Sciences, Academia Sinica (IBMS-CRC110-P04 and AS-VTA-110-03) and Foundation for Poison Control (FPC-109-002).
Conflict of Interest
The authors declare that the research was conducted in the absence of any commercial or financial relationships that could be construed as a potential conflict of interest.
Publisher's Note
All claims expressed in this article are solely those of the authors and do not necessarily represent those of their affiliated organizations, or those of the publisher, the editors and the reviewers. Any product that may be evaluated in this article, or claim that may be made by its manufacturer, is not guaranteed or endorsed by the publisher.
Acknowledgments
We thank the Academia Sinica Inflammation Core Facility, IBMS for technical support. The core facility is funded by the Academia Sinica Core Facility and Innovative Instrument Project (AS-CFII-108-118). We also thank the “Center for Intelligent Drug Systems and Smart Bio-devices (IDS2B)” from the Featured Areas Research Center Program within the framework of the Higher Education Sprout Project by the Ministry of Education (MOE) in Taiwan.
Supplementary Material
The Supplementary Material for this article can be found online at: https://www.frontiersin.org/articles/10.3389/fmed.2021.748225/full#supplementary-material
References
1. Thomas R, Kanso A, Sedor JR. Chronic kidney disease and its complications. Prim Care. (2008) 35:329–44. doi: 10.1016/j.pop.2008.01.008
2. Bansal N, Katz R, Robinson-Cohen C, Odden MC, Dalrymple L, Shlipak MG, et al. Absolute rates of heart failure, coronary heart disease, and stroke in chronic kidney disease: an analysis of 3 community-based cohort studies. JAMA Cardiol. (2017) 2:314–8. doi: 10.1001/jamacardio.2016.4652
3. Li H, Lu W, Wang A, Jiang H, Lyu J. Changing epidemiology of chronic kidney disease as a result of type 2 diabetes mellitus from 1990 to 2017: estimates from Global Burden of Disease 2017. J Diabetes Investig. (2021) 12:346–56. doi: 10.1111/jdi.13355
4. Berns JS. Routine screening for CKD should be done in asymptomatic adults… selectively. Clin J Am Soc Nephrol. (2014) 9:1988–92. doi: 10.2215/CJN.02250314
5. Chapter 1: definition and classification of CKD. Kidney Int Suppl. (2013) 3:19–62. doi: 10.1038/kisup.2012.64
6. Rysz J, Gluba-Brzózka A, Franczyk B, Jabłonowski Z, Ciałkowska-Rysz A. Novel biomarkers in the diagnosis of chronic kidney disease and the prediction of its outcome. Int J Mol Sci. (2017) 18:1702. doi: 10.3390/ijms18081702
7. Meran S, Steadman R. Fibroblasts and myofibroblasts in renal fibrosis. Int J Exp Pathol. (2011) 92:158–67. doi: 10.1111/j.1365-2613.2011.00764.x
8. Bülow RD, Boor P. Extracellular matrix in kidney fibrosis: more than just a scaffold. J Histochem Cytochem. (2019) 67:643–61. doi: 10.1369/0022155419849388
9. Schelling JR. Tubular atrophy in the pathogenesis of chronic kidney disease progression. Pediatr Nephrol. (2016) 31:693–706. doi: 10.1007/s00467-015-3169-4
10. Farris AB, Colvin RB. Renal interstitial fibrosis: mechanisms and evaluation. Curr Opin Nephrol Hypertens. (2012) 21:289–300. doi: 10.1097/MNH.0b013e3283521cfa
11. Ruiz-Ortega M, Rayego-Mateos S, Lamas S, Ortiz A, Rodrigues-Diez RR. Targeting the progression of chronic kidney disease. Nat Rev Nephrol. (2020) 16:269–88. doi: 10.1038/s41581-019-0248-y
12. Provenzano M, Rotundo S, Chiodini P, Gagliardi I, Michael A, Angotti E, et al. Contribution of predictive and prognostic biomarkers to clinical research on chronic kidney disease. Int J Mol Sci. (2020) 21:5846. doi: 10.3390/ijms21165846
13. Sciacchitano S, Lavra L, Morgante A, Ulivieri A, Magi F, De Francesco GP, et al. Galectin-3: one molecule for an alphabet of diseases, from A to Z. Int J Mol Sci. (2018) 19:379. doi: 10.3390/ijms19020379
14. Newlaczyl AU, Yu LG. Galectin-3–a jack-of-all-trades in cancer. Cancer Lett. (2011) 313:123–8. doi: 10.1016/j.canlet.2011.09.003
15. Fortuna-Costa A, Gomes AM, Kozlowski EO, Stelling MP, Pavão MS. Extracellular galectin-3 in tumor progression and metastasis. Front Oncol. (2014) 4:138. doi: 10.3389/fonc.2014.00138
16. Desmedt V, Desmedt S, Delanghe JR, Speeckaert R, Speeckaert MM. Galectin-3 in renal pathology: more than just an innocent bystander. Am J Nephrol. (2016) 43:305–17. doi: 10.1159/000446376
17. Chen SC, Kuo PL. The role of galectin-3 in the kidneys. Int J Mol Sci. (2016) 17:565. doi: 10.3390/ijms17040565
18. Hsu DK, Dowling CA, Jeng KC, Chen JT, Yang RY, Liu FT. Galectin-3 expression is induced in cirrhotic liver and hepatocellular carcinoma. Int J Cancer. (1999) 81:519–26.
19. Mackinnon AC, Gibbons MA, Farnworth SL, Leffler H, Nilsson UJ, Delaine T, et al. Regulation of transforming growth factor-β1-driven lung fibrosis by galectin-3. Am J Respir Crit Care Med. (2012) 185:537–46. doi: 10.1164/rccm.201106-0965OC
20. Calvier L, Martinez-Martinez E, Miana M, Cachofeiro V, Rousseau E, Sádaba JR, et al. The impact of galectin-3 inhibition on aldosterone-induced cardiac and renal injuries. JACC Heart Fail. (2015) 3:59–67. doi: 10.1016/j.jchf.2014.08.002
21. O'Seaghdha CM, Hwang SJ, Ho JE, Vasan RS, Levy D, Fox CS. Elevated galectin-3 precedes the development of CKD. J Am Soc Nephrol. (2013) 24:1470–7. doi: 10.1681/ASN.2012090909
22. Tang WH, Shrestha K, Shao Z, Borowski AG, Troughton RW, Thomas JD, Klein AL. Usefulness of plasma galectin-3 levels in systolic heart failure to predict renal insufficiency and survival. Am J Cardiol. (2011) 108:385–90. doi: 10.1016/j.amjcard.2011.03.056
23. Sotomayor CG, Te Velde-Keyzer CA, Diepstra A, van Londen M, Pol RA, Post A, et al. Galectin-3 and risk of late graft failure in kidney transplant recipients: a 10-year prospective cohort study. Transplantation. (2021) 105:1106–15. doi: 10.1097/TP.0000000000003359
24. de Boer RA, van Veldhuisen DJ, Gansevoort RT, Muller Kobold AC, van Gilst WH, Hillege HL, et al. The fibrosis marker galectin-3 and outcome in the general population. J Intern Med. (2012) 272:55–64. doi: 10.1111/j.1365-2796.2011.02476.x
25. Tsai MT, Tseng WC, Ou SM, Lee KH, Yang CY, Tarng DC. Comparison of simplified creatinine index and systemic inflammatory markers for nutritional evaluation of hemodialysis patients. Nutrients. (2021) 13:1870. doi: 10.3390/nu13061870
26. Tsai MT, Ou SM, Chen HY, Tseng WC, Lee KH, Yang CY, et al. Relationship between circulating galectin-3, systemic inflammation, and protein-energy wasting in chronic hemodialysis patients. Nutrients. (2021) 13:2803. doi: 10.3390/nu13082803
27. Levey AS, Stevens LA, Schmid CH, Zhang YL, Castro AF III, Feldman HI, et al. A new equation to estimate glomerular filtration rate. Ann Intern Med. (2009) 150:604–12. doi: 10.7326/0003-4819-150-9-200905050-00006
28. Silveiro SP, Araújo GN, Ferreira MN, Souza FD, Yamaguchi HM, Camargo EG. Chronic Kidney Disease Epidemiology Collaboration (CKD-EPI) equation pronouncedly underestimates glomerular filtration rate in type 2 diabetes. Diabetes Care. (2011) 34:2353–5. doi: 10.2337/dc11-1282
29. Zhou L, Ng HK, Drautz-Moses DI, Schuster SC, Beck S, Kim C, et al. Systematic evaluation of library preparation methods and sequencing platforms for high-throughput whole genome bisulfite sequencing. Sci Rep. (2019) 9:10383. doi: 10.1038/s41598-019-46875-5
30. Conesa A, Madrigal P, Tarazona S, Gomez-Cabrero D, Cervera A, McPherson A, et al. A survey of best practices for RNA-seq data analysis. Genome Biol. (2016) 17:13. doi: 10.1186/s13059-016-0881-8
31. Ritchie ME, Phipson B, Wu D, Hu Y, Law CW, Shi W, Smyth GK. limma powers differential expression analyses for RNA-sequencing and microarray studies. Nucleic Acids Res. (2015) 43:e47. doi: 10.1093/nar/gkv007
32. The gene ontology resource: 20 years and still going strong. Nucleic Acids Res. (2019) 47:D330–8. doi: 10.1093/nar/gky1055
33. Harris MA, Clark J, Ireland A, Lomax J, Ashburner M, Foulger R, et al. The Gene Ontology (GO) database and informatics resource. Nucleic Acids Res. (2004) 32:D258–61. doi: 10.1093/nar/gkh036
34. Kanehisa M, Goto S. KEGG: kyoto encyclopedia of genes and genomes. Nucleic Acids Res. (2000) 28:27–30. doi: 10.1093/nar/28.1.27
35. Rebholz CM, Selvin E, Liang M, Ballantyne CM, Hoogeveen RC, Aguilar D, et al. Plasma galectin-3 levels are associated with the risk of incident chronic kidney disease. Kidney Int. (2018) 93:252–9. doi: 10.1016/j.kint.2017.06.028
36. Bansal N, Katz R, Seliger S, DeFilippi C, Sarnak MJ, Delaney JA, et al. The Cardiovascular Health Study (CHS). Am J Kidney Dis. (2016) 67:994–6. doi: 10.1053/j.ajkd.2015.12.022
37. Iacoviello M, Aspromonte N, Leone M, Paradies V, Antoncecchi V, Valle R, et al. Galectin-3 serum levels are independently associated with microalbuminuria in chronic heart failure outpatients. Res Cardiovasc Med. (2016) 5:e28952. doi: 10.5812/cardiovascmed.28952
38. Slack RJ, Mills R, Mackinnon AC. The therapeutic potential of galectin-3 inhibition in fibrotic disease. Int J Biochem Cell Biol. (2021) 130:05881. doi: 10.1016/j.biocel.2020.105881
39. Dang Z, MacKinnon A, Marson LP, Sethi T. Tubular atrophy and interstitial fibrosis after renal transplantation is dependent on galectin-3. Transplantation. (2012) 93:477–84. doi: 10.1097/TP.0b013e318242f40a
40. Díaz-Alvarez L, Ortega E. The many roles of galectin-3, a multifaceted molecule, in innate immune responses against pathogens. Mediators Inflamm. (2017) 2017:9247574. doi: 10.1155/2017/9247574
41. Chung AW, Sieling PA, Schenk M, Teles RM, Krutzik SR, Hsu DK, et al. Galectin-3 regulates the innate immune response of human monocytes. J Infect Dis. (2013) 207:947–56. doi: 10.1093/infdis/jis920
42. de Oliveira FL, Gatto M, Bassi N, Luisetto R, Ghirardello A, Punzi L, et al. Galectin-3 in autoimmunity and autoimmune diseases. Exp Biol Med. (2015) 240:1019–28. doi: 10.1177/1535370215593826
43. Sano H, Hsu DK, Apgar JR, Yu L, Sharma BB, Kuwabara I, et al. Critical role of galectin-3 in phagocytosis by macrophages. J Clin Invest. (2003) 112:389–97. doi: 10.1172/JCI200317592
44. MacKinnon AC, Farnworth SL, Hodkinson PS, Henderson NC, Atkinson KM, Leffler H, et al. Regulation of alternative macrophage activation by galectin-3. J Immunol. (2008) 180:2650–8. doi: 10.4049/jimmunol.180.4.2650
45. Henderson NC, Mackinnon AC, Farnworth SL, Kipari T, Haslett C, Iredale JP, et al. Galectin-3 expression and secretion links macrophages to the promotion of renal fibrosis. Am J Pathol. (2008) 172:288–98. doi: 10.2353/ajpath.2008.070726
46. Sureshbabu A, Muhsin SA, Choi ME. TGF-β signaling in the kidney: profibrotic and protective effects. Am J Physiol Renal Physiol. (2016) 310:F596–606. doi: 10.1152/ajprenal.00365.2015
47. Breuilh L, Vanhoutte F, Fontaine J, van Stijn CM, Tillie-Leblond I, Capron M, et al. Galectin-3 modulates immune and inflammatory responses during helminthic infection: impact of galectin-3 deficiency on the functions of dendritic cells. Infect Immun. (2007) 75:5148–57. doi: 10.1128/IAI.02006-06
48. Hsu DK, Chen HY, Liu FT. Galectin-3 regulates T-cell functions. Immunol Rev. (2009) 230:114–27. doi: 10.1111/j.1600-065X.2009.00798.x
49. Margadant C, van den Bout I, van Boxtel AL, Thijssen VL, Sonnenberg A. Epigenetic regulation of galectin-3 expression by β1 integrins promotes cell adhesion and migration. J Biol Chem. (2012) 287:44684–93. doi: 10.1074/jbc.M112.426445
Keywords: galectin-3, chronic kidney disease, tubular atrophy, interstitial fibrosis, kidney biopsy, RNA-sequencing analysis
Citation: Ou S-M, Tsai M-T, Chen H-Y, Li F-A, Tseng W-C, Lee K-H, Chang F-P, Lin Y-P, Yang R-B and Tarng D-C (2021) Identification of Galectin-3 as Potential Biomarkers for Renal Fibrosis by RNA-Sequencing and Clinicopathologic Findings of Kidney Biopsy. Front. Med. 8:748225. doi: 10.3389/fmed.2021.748225
Received: 27 July 2021; Accepted: 13 October 2021;
Published: 12 November 2021.
Edited by:
Xiao-Han Tang, Cornell University, United StatesReviewed by:
Ashish Verma, Boston University, United StatesJiang Tian, Marshall University, United States
Copyright © 2021 Ou, Tsai, Chen, Li, Tseng, Lee, Chang, Lin, Yang and Tarng. This is an open-access article distributed under the terms of the Creative Commons Attribution License (CC BY). The use, distribution or reproduction in other forums is permitted, provided the original author(s) and the copyright owner(s) are credited and that the original publication in this journal is cited, in accordance with accepted academic practice. No use, distribution or reproduction is permitted which does not comply with these terms.
*Correspondence: Ruey-Bing Yang, cmJ5YW5nQGlibXMuc2luaWNhLmVkdS50dw==; Der-Cherng Tarng, ZGN0YXJuZ0B2Z2h0cGUuZ292LnR3