Abstract
Objective:
To investigate body fluid status in diabetic macular edema (DME) patients and the extent to which it is affected by renal function.
Methods:
One hundred and thirty-two eyes from 132 patients with diabetes mellitus (DM) were prospectively collected in this cross-sectional, observational study. Thirty-five were DM patients without diabetic retinopathy (DR), 31 were DR patients without DME, and 66 were DME patients. The fluid status of each participant was quantified with extracellular water-to-total body water ratio (ECW/TBW) using a body composition monitor. Central subfield thickness (CST) and macular volume (MV) were obtained using optical coherence tomography (OCT). Urine albumin-to-creatinine ratio (UACR), estimated glomerular filtration rate (eGFR), and albumin was obtained using serum and urine laboratory data.
Results:
ECW/TBW was significantly increased in DME patients (39.2 ± 0.9, %) compared to DM (38.1 ± 0.7, %, P = 0.003) and DR patients without DME (38.7 ± 0.9, %, P < 0.001). In multilinear regression, fluid overload was positively related to DME and UACR (DME vs. DM: β = 2.418, P < 0.001; DME vs. DR: β = 1.641, P = 0.001; UACR, per 102, β = 1.017, P = 0.01). In the binary logistic regression for DME risk, the area under the receiver operating characteristic curve (AUROC) increased significantly by adding ECW/TBW along with UACR and age (AUC: 0.826 vs. 0.768).
Conclusion:
DME patients had elevated body fluid volume independent of kidney functions. The assessment of extracellular fluid status may help in the management of DME.
Introduction
The burden of diabetes mellitus (DM) is growing globally, with a worldwide estimated prevalence of 4.1% in 2010 expected to increase to 7.7% by 2030 (1, 2). In China, up to 11.6% of the population aged 18 years and older has diabetes (3). Diabetic microvascular complications such as retinopathy (DR) and macular edema (DME) are the major causes of blindness in DM patients in China (4). Diabetic kidney disease (DKD) is another common microvascular complication that leads to kidney failure in approximately 40% of diabetic patients (5). Our group found that the elevation of urine albumin-to-creatinine ratio (UACR) or the worsening in UACR stages, a signature change for renal function in DKD, was correlated with DME (6) and macular thickening (7). Clinical evidence also supports this connection. DME patients with better renal function had greater chances of better prognoses, especially in refractory DME (8, 9). DKD and DR share similar pathogenesis (10). Hyperglycemia-induced inflammation and oxidative stress lead to loss of endothelial cells, pericytes, and disruption of cell junctions, which contribute to the breakdown of vascular barrier in both the kidney and retina (10). For DME, hyperglycemia-linked pathways also contribute to dysfunction of retinal pigment epithelium (RPE) cells and glial cells such as Müller cells, which normally drain the fluid in the retina to the systemic circulation and keep the retina dehydrated (11, 12). Increased entry of fluid through the damaged blood-retinal barrier (BRB) and decreased drainage result in accumulation of fluid, especially in the macula (13).
Interestingly, while DKD has been proven associated with the elevation in extracellular fluid volume (14), a recent study discovered that fluid overload also appeared in DME patients (15). Imbalance of hydrostatic and oncotic pressure explained by starling equation could account for the phenomenon. The fluid status was monitored by body composition measurement (BCM) objectively and non-invasively, which is widely assumed credible assessing the fluid status of patients with chronic kidney diseases in clinical practice (16, 17). DME characterized by exudative fluid accumulation in the macula was speculated as a focal manifestation of extracellular fluid overload. The accessibility of extracellular water to total body water (ECW/TBW) ratio makes it the perfect systemic fluid marker for DME studies and a potential biomarker for DME treatments (18). Still, the confounding effect between DKD and fluid overload has not been discussed deeply regarding the relationship with DME. There lacked evidence of whether the fluid expansion came up through DME pathophysiological alterations along or shared pathogenesis between DME and DKD.
In this paper, the fluid statuses among different DM patients, including DR patients with or without DME and diabetic patients with or without DR, were investigated. By further exploiting associated changes of fluid status and renal function parameters in DME, this study proposed a novel hypothesis for the role of body fluid status in DME mechanisms. It provided significant clinical evidence to guide future DME management and treatments.
Methods
This was a cross-sectional observational study. Diabetic patients diagnosed with or without DR and DME by a multi-disciplinary team at Guangdong Provincial People's Hospital were prospectively included from May 2020 to February 2021. Medical records were reviewed by a chief-resident doctor from the department of ophthalmology and a chief-resident doctor from the department of endocrine of Guangdong Provincial People's Hospital. All patients included were informed of the study contents and signed written consent. This study was conducted following the Declaration of Helsinki and under the supervision of the Research Ethics Committee of Guangdong Provincial People's Hospital, Guangdong Academy of Medical Sciences (registration number: GDREC2018380H).
Participant
Patients aged 18 years or older, diagnosed with DM, with or without DR and DME, and capable of going through funduscopic examination, optical coherence tomography (OCT) scans, and BCM were included in the study. Exclusion criteria were receiving pan-retinal photocoagulation, intravitreal injection or pars-planar vitrectomy within 3 months, other retinal diseases including age-related macular disease, retinal vascular occlusion, retinal vasculitis, macular hole, and epiretinal membrane, significant cataract affecting fundus examination, and severe systemic diseases including myocardial infarction, stroke, CKD at end-stage, and under hemodialysis or peritoneal dialysis.
Clinical Parameters
All patients were examined for the following characteristics and parameters: age, sex, height, body weight, systolic blood pressure (SBP), diastolic blood pressure (DBP), history of hypertension, DM duration. Hypertension was defined as SBP ≥140 mmHg or DBP ≥ 90 mmHg (19). Diagnosis and duration of DM were obtained from medical records. Each participant's DM duration was labeled as those diagnosed for 10 years or more and those who were not. Laboratory parameters included glycated hemoglobin (HbA1c), complete blood count, renal functions such as serum creatinine, urea, UACR, lipid profile including cholesterol, triglyceride, low-density lipoprotein (LDL), and high-density lipoprotein (HDL). Other factors included albumin, total protein (TP), and 25-hydroxyvitamin D. Body mass index (BMI) was calculated using the formula of weight in kilograms divided by height in meters squared (20). The estimated glomerular filtration rate (eGFR) was calculated from serum creatinine using the formula of Chronic Kidney Disease Epidemiology Collaboration (CKD-EPI) equation (21). All blood samples and urine samples were collected in the morning after 8-h fasting before patients taking breakfast.
The eGFR value of all participants was labeled as normal (≥60 mL/min/1.73 m2) and impaired (<60 mL/min/1.73 m2) according to the definition of CKD (22). The stages of albuminuria was classified with the definition of the USA National Kidney Foundation (23) as normoalbuminuria (UACR <30 mg/g), microalbuminuria (UACR ≥ 30mg/g, <300mg/g), and macroalbuminuria (UACR ≥ 300 mg/g).
Ophthalmic Examinations
All patients received comprehensive baseline ophthalmic examination, including best-corrected visual acuity (BCVA), intraocular pressure (IOP), dilated fundus examination, fundus photography, and OCT. BCVA was examined with the Snellen chart and converted into the logarithm of minimal angle of resolution (logMAR) (24). IOP was investigated with non-contact tonometry (TX-20 Full Auto Tonometer; Canon, Inc., Tokyo, Japan). All patients received slit lamp fundus examination and fundus photography (TRC-NW8 non-mydriatic) retinal camera, Topcon, Tokyo, Japan; D7500 DSLR camera, Nikon, Tokyo, Japan) to obtained one fovea-centered and one optic nerve head-centered photo after mydriasis. OCT examination (Spectralis; Heidelberg Engineering, Heidelberg, Germany) was conduct to capture the image of the macula, which was composed of 61 B-scans at an automatic real-time (ART) setting (10 images averaged) in the central 30 × 25° area. Central subfield thickness (CST), which was defined as the mean retinal thickness of the 1 mm fovea-centered area, and macular volume (MV), which was the volume of the nine subfields of the Early Treatment Diabetic Retinopathy Study (ETDRS) grid, were obtained automatically from the integrated software. The manual adjustments were performed when there were obvious segmenting or fovea locating errors. Diagnosis and staging of DR and DME were based on the fundus examination, fundus photography, and OCT images follow the International Clinical Diabetic Retinopathy Disease Severity Scale and International Clinical Diabetic Macular Edema Disease Severity Scale by two experienced ophthalmologists specialized in retinal disease (PDR, κ = 0.897; DME, κ = 0.918) (25). Differing diagnoses were reassessed and diagnosed by a senior chief ophthalmologist.
Body Composition Measurement
All patients underwent BCM examination (InBody S10; InBody CO., LTD., Seoul, Korea), which measured different body compositions via direct segmental multi-frequency bioelectrical impedance analysis (DSM-BIA). An eight-electrode system connecting to the ankles and two fingertips of each patient's hand segments the human body into five parts, including the right arm, left arm, right leg, left leg, and trunk, and measures different body parts compartments. The instrument uses a current of 6 frequencies, including 1 kHz, 5 kHz, 50 kHz, 250 kHz, 500 kHz, and 1 MHz, the varied cell membrane conductivities from high-frequency to low-frequency current are therefore translated into extracellular water (ECW) and intracellular water (ICW) with different impedance (26). In the in-built software, other data including ECW/TBW of the whole body and separate body compartments, including right arm, left arm, trunk, right leg and left leg, and percentage of body fat (PBF), visceral fat area (VFA), skeletal muscle index (SKI) and phase angle (PhA) were calculated. All patients went through the examination in a supine position after 8-h fasting before breakfast, right before the OCT examination.
Statistical Analysis
Participants were divided into three groups, including DM group (without DR), DR group (diagnosed with DR but no DME), and DME group (diagnosed with DR and DME) according to their diagnosis. Normally distributed continuous variables were shown as mean ± standard deviation in Table 1; χ2 tests were carried out to compare non-parametric variables among the three groups. Tests for homogeneity of variance were conducted on the general characteristics, BCM parameters, and renal function parameters, and no variate was found significant. For each participant, the one eye with higher CST, MV, and more severe DR stage was included in the data analysis. Analysis of variance (ANOVA) was applied to compare the quantitative characteristics, including age, SBP, DBP, BMI, BCVA, IOP, blood test parameters, and BCM results among three groups. Two multivariate linear models were carried out to estimate the effect of renal functions on body fluid status among three diabetic groups after adjusting for significant covariates identified in the univariate linear model. Step-by-step multivariate binary logistic regressions with a backward method were conducted to predict DME risk. The models' receiver operating characteristic (ROC) curves were then drawn to demonstrate their predictive power quantified by the area under the curves (AUC). All statistical analysis was performed using SPSS software (version 26.0, IBM Corp., Armonk, NY, USA). A P < 0.05 indicates statistical significance.
Table 1
| Characteristics | DM, n = 35 | DR, n = 31 | DME, n = 66 | P a | P b | P c | P d |
|---|---|---|---|---|---|---|---|
| Female, n (%) | 19 (54.3) | 17 (54.8) | 23 (34.8) | 0.075e | - | - | - |
| Hypertension, n (%) | 11 (31.4) | 14 (45.2) | 31 (47.0) | 0.303e | - | - | - |
| DM duration <10 years, n (%) | 25 (71.4) | 7 (22.6) | 27 (40.9) | <0.001*e | - | - | - |
| Age, years | 56.3 ± 15.5 | 60.6 ± 8.8 | 57.7 ± 9.3 | 0.293 | 0.380 | 1.000 | 0.707 |
| SBP, mmHg | 131.8 ± 24.7 | 133.3 ± 20.7 | 137.6 ± 18.5 | 0.358 | 1.000 | 0.551 | 1.000 |
| DBP, mmHg | 82.5 ± 14.8 | 78.6 ± 11.4 | 81.5 ± 11.6 | 0.406 | 0.606 | 1.000 | 0.820 |
| MAP, mmHg | 98.9 ± 16.7 | 96.8 ± 13.2 | 100.2 ± 12.0 | 0.516 | 1.000 | 1.000 | 0.755 |
| BMI, kg/m2 | 24.9 ± 3.0 | 24.1 ± 3.4 | 23.1 ± 2.7 | 0.013* | 0.885 | 0.012* | 0.324 |
| HbA1c, % | 8.5 ± 3.1 | 8.7 ± 2.0 | 8.1 ± 1.8 | 0.620 | 1.000 | 1.000 | 0.572 |
| Hemoglobin, g/L | 135.2 ± 15.3 | 121.8 ± 21.6 | 120.1 ± 17.5 | 0.387 | 0.009* | <0.001* | 1.000 |
| TP, mg/L | 69.2 ± 7.4 | 71.9 ± 5.8 | 71.6 ± 8.9 | 0.281 | 0.525 | 0.445 | 1.000 |
| Albumin, g/L | 39.8 ± 3.2 | 40.0 ± 4.7 | 38.7 ± 5.4 | 0.381 | 1.000 | 0.897 | 0.673 |
| Urea, mmol/L | 5.6 ± 2.1 | 8.3 ± 4.5 | 9.1 ± 4.4 | <0.001* | 0.016* | <0.001* | 1.000 |
| Creatinine, μmol/L | 68.3 ± 20.0 | 134.8 ± 166.3 | 116.4 ± 77.7 | 0.016* | 0.020* | 0.061 | 1.000 |
| eGFR, mL/min/1.73 m2 | 95.6 ± 24.0 | 67.3 ± 25.5 | 68.8 ± 28.4 | <0.001* | <0.001* | <0.001* | 1.000 |
| UACR, mg/gCr | 21.6 ± 29.9 | 785.3 ± 1640.8 | 1265.7 ± 1381.4 | <0.001* | 0.057 | <0.001* | 0.271 |
| UACR stage, median (range)f | 1 (1–2) | 2 (1–3) | 3 (1–3) | <0.001*e | - | - | - |
| 25-hydroxyvitamin D, ng/mL | 24.7 ± 7.8 | 17.5 ± 6.9 | 18.7 ± 7.0 | 0.023* | 0.029* | 0.038* | 1.000 |
| NLR | 2.2 ± 1.2 | 2.7 ± 1.3 | 2.9 ± 1.2 | 0.056 | 0.422 | 0.050 | 1.000 |
| MLR, 10−1 | 2.4 ± 1.2 | 2.7 ± 1.3 | 2.9 ± 1.2 | 0.021* | 0.515 | 0.017* | 0.767 |
| PLR | 112.2 ± 43.2 | 145.4 ± 50.5 | 149.1 ± 51.1 | 0.001* | 0.021* | 0.001* | 1.000 |
| Ocular parameters | |||||||
| LogMAR | 0.1 ± 0.2 | 0.4 ± 0.5 | 0.6 ± 0.4 | <0.001* | 0.085 | <0.001* | 0.010* |
| IOP, mmHg | 14.0 ± 3.0 | 14.0 ± 3.4 | 13.8 ± 3.8 | 0.942 | 1.000 | 1.000 | 1.000 |
| OCT values | |||||||
| CST, μm | 264.9 ± 20.6 | 268.0 ± 29.6 | 417.5 ± 168.1 | <0.001* | 1.000 | <0.001* | <0.001* |
| MV, mm3 | 8.5 ± 0.4 | 8.7 ± 0.5 | 10.9 ± 2.6 | <0.001* | 1.000 | <0.001* | <0.001* |
| BCM parameters | |||||||
| ECW/TBW, % | 38.1 ± 0.7 | 38.7 ± 0.9 | 39.2 ± 0.9 | <0.001* | 0.008* | <0.001* | 0.019* |
| PBF, % | 29.3 ± 7.3 | 27.7 ± 5.8 | 26.3 ± 7.8 | 0.125 | 1.000 | 0.130 | 1.000 |
| VFA, cm2 | 91.8 ± 35.6 | 87.9 ± 28.9 | 78.8 ± 28.5 | 0.101 | 1.000 | 0.131 | 0.546 |
| BMR, kcal | 1386.3 ± 184.2 | 1336.7 ± 212.2 | 1354.3 ± 213.9 | 0.604 | 0.991 | 1.000 | 1.000 |
| SMI, kg/m2 | 7.1 ± 1.1 | 6.8 ± 1.1 | 6.9 ± 1.2 | 0.467 | 0.766 | 0.913 | 1.000 |
| Phase angle | 5.7 ± 0.8 | 5.3 ± 0.8 | 4.9 ± 0.8 | <0.001* | 0.231 | <0.001* | 0.014* |
General characteristics, systemic parameters and ocular parameters of patients among three groups.
DM, diabetes mellitus; DR, diabetic retinopathy; DME, diabetic macular edema; SBP, systolic blood pressure; DBP, diastolic blood pressure; MAP, mean arterial pressure; BMI, body mass index; HbA1c, glycated hemoglobin; TP, total protein; eGFR, estimated glomerular filtration rate; UACR, urine albumin-to-creatinine ratio; NLR, neutrophil-to-lymphocyte ratio; MLR, monocyte-to-lymphocyte ratio; PLR, platelet-to-lymphocyte ratio; LogMAR, the logarithm of minimal angle of resolution, for best-corrected visual acuity; IOP, intraocular pressure; CST, central subfield thickness; MV, macular volume; ECW/TBW, extracellular water-to-total body water ratio; PBF, percentage of body fat; VFA, visceral fat area; BMR, basal metabolic rate; SMI, skeletal muscle index.
, b, c, dwere acquired using one-way ANOVA;
was acquired using χ2 tests.
a, eP-value among three group.
P-value between DM group and DR group.
P-value between DM group and DME group.
P-value between DR group vs DME group.
dUACR stage including normoalbuminuria, microalbuminuria and macroalbuminuria were denoted as stage 1 to 3.
Stand for P <0.05.
Results
One hundred thirty-two patients (73 male and 59 female) with 132 eyes were enrolled in the study. Table 1 shows the details of general characteristics, systemic factors, ocular parameters and BCM parameters among the DM group (n = 35), DR group (n = 31), and DME group (n = 66). As for general characteristics, there was no statistically significant difference in sex, age, hypertension, blood pressure, weight among the three groups (all P > 0.05), and there were significant differences in DM duration (P < 0.001) and BMI (P = 0.013). BCVA, CST and MV were significantly different among three groups (all P < 0.001) while IOP was not (P = 0.942).
Systemic Factors and BCM Parameters Among Three Groups
All parameters of blood test and BCM parameters were found normally distributed. In the test of homogeneity, PhA and ECW/TBW showed a high level of collinearity. Hence PhA was excluded in further analysis. In the post-hoc analysis, systemic parameters including urea and PLR in both the DME group and DR group were significantly higher than the DM groups (all P < 0.05), while hemoglobin, 25-hydroxyvitamin D, eGFR were significantly lower than the DM group (all P < 0.05). UACR (DME group: 1265.7 ± 1381.4 mg/gCr; DM group: 21.6 ± 29.9 mg/gCr, P < 0.001) and MLR (DME group: 2.9 ± 1.2 × 10⁻¹; DM group: 2.4 ± 1.2 × 10⁻¹, P = 0.017) was found elevated in the DME group compared to DM group. As for BCM parameters, the DME group had significantly higher ECW/TBW than both the DM group and DR group (P < 0.001). No significant differences of PBF, VFA, BMR, and SMI were detected among three groups (all P > 0.05).
Association Between DME and Fluid Overload
Table 2 demonstrates the association between DME and fluid overload. Univariate linear model (Model 1) shows that DME (compared to both DR and DM), age, DM duration, and UACR were positively associated with fluid overload, while albumin level and eGFR were negatively associated with fluid overload (all P < 0.05). No significant association was found between MAP and ECW/TBW (P = 0.188). In the multivariate linear model, DME, DR, age, MAP, and albumin showed significant impact on ECW/TBW (all P < 0.05; Model 2), while eGFR was not significantly associated with ECW/TBW (P = 0.620; Model 2). In the multivariate model focusing on UACR, only DME, age, and UACR were positively associated with ECW/TBW (all P < 0.05), while MAP showed a negative association with ECW/TBW (P = 0.005).
Table 2
| Model 1 | Model 2 | Model 3 | ||||||||||
|---|---|---|---|---|---|---|---|---|---|---|---|---|
| β | 95%CI | Exp β | P | β | 95%CI | Exp β | P | β | 95%CI | Exp β | P | |
| Groups | ||||||||||||
| DM | Reference | – | – | – | Reference | – | – | – | Reference | – | – | – |
| DR | 0.627 | 0.229–1.026 | 1.873 | 0.002* | 0.526 | 0.123–0.929 | 1.692 | 0.011* | 0.387 | 0.036–0.809 | 1.472 | 0.073 |
| DME | 1.131 | 0.793–1.469 | 3.099 | <0.001* | 1.095 | 0.765–1.425 | 2.989 | <0.001* | 0.883 | 0.530–1.236 | 2.418 | <0.001* |
| Groups | ||||||||||||
| DR | Reference | – | – | – | Reference | – | – | – | Reference | – | – | – |
| DME | 0.504 | 0.152–0.855 | 1.656 | <0.001* | 0.569 | 0.268–0.869 | 1.767 | <0.001* | 0.496 | 0.196–0.796 | 1.642 | 0.001* |
| Age | 0.037 | 0.024–0.05 | 1.038 | <0.001* | 0.038 | 0.026–0.049 | 1.038 | <0.001* | 0.038 | 0.027–0.048 | 1.039 | <0.001* |
| DM Duration | 0.160 | 0.005–0.315 | 1.173 | 0.043* | −0.057 | −0.185–0.072 | 0.945 | 0.389 | −0.006 | −0.137–0.125 | 0.994 | 0.926 |
| MAP | −0.008 | −0.02–0.004 | 0.992 | 0.188 | −0.011 | −0.019 to −0.002 | 0.990 | 0.017* | −0.012 | −0.021 to −0.004 | 0.988 | 0.005* |
| Albumin | −0.051 | −0.084–0.018 | 0.950 | 0.003* | −0.046 | −0.073 to −0.02 | 0.955 | 0.001* | −0.018 | −0.052–0.016 | 0.982 | 0.296 |
| eGFR | −0.013 | −0.018–0.008 | 0.987 | <0.001* | −0.001 | −0.006–0.004 | 0.999 | 0.620 | – | – | – | – |
| UACR | 0.030 | 0.019–0.041 | 1.031 | <0.001* | – | – | – | – | 0.017 | 0.004–0.029 | 1.017 | 0.010* |
Influence factors of ECW/TBW with univariate and multivariate linear models.
DM, diabetes mellitus; DR, diabetic retinopathy; DME, diabetic macular edema; MAP, mean arterial pressure; eGFR, estimated glomerular filtration rate; UACR, urine albumin-to-creatinine ratio.
DM duration, every 5 years; MAP, per mmHg; Albumin, per g/L; eGFR, per mL/min/1.73 m2; UACR, per 10−2 mg/g.
Model 1: univariate analysis; Model 2: multivariate model adjusted for systemic covariates and eGFR; Model 3: multivariate model adjusted for systemic covariates and UACR.
P was acquired using generalized linear model.
Stands for P <0.05.
Fluid Overload and Its Related Influence Factors of DME
In the binary logistic regression analysis with backward method of the risk of DME, age (per 1 year, OR = 0.941, P = 0.009), UACR stage (microalbuminuria, OR = 5.16, P = 0.005; macroalbuminuria, OR = 5.198, P = 0.003), and ECW/TBW (per 10−2, OR = 2.814, P = 0.002) entered the model under the probability for removal at 0.05. Details were shown in Table 3. The predictive power of the multivariate regression models was demonstrated as ROC curves shown in Figure 1 (Model 1: ECW/TBW, UACR, and Age: AUC = 0.826; Model 2: UACR and Age: AUC = 0.768; Model 3: ECW/TBW: AUC = 0.737).
Table 3
| β | S.E. | P | Exp (β) | |
|---|---|---|---|---|
| ECW/TBW | 1.035 | 0.327 | 0.002* | 2.814 |
| Age | −0.06 | 0.023 | 0.009* | 0.941 |
| Normoalbuminuria | Reference | - | - | - |
| Microalbuminuria | 1.641 | 0.588 | 0.005* | 5.16 |
| Macroalbuminuria | 1.648 | 0.55 | 0.003* | 5.198 |
Multivariate binary logistic regression for DME risk.
DME, diabetic macular edema; ECW/TBW, extracellular water-to-total body water ratio.
Adjusted r2 of logistic regression model = 0.401.
Exp (β) stands for standardized regression coefficient.
Stands for P <0.05.
Figure 1
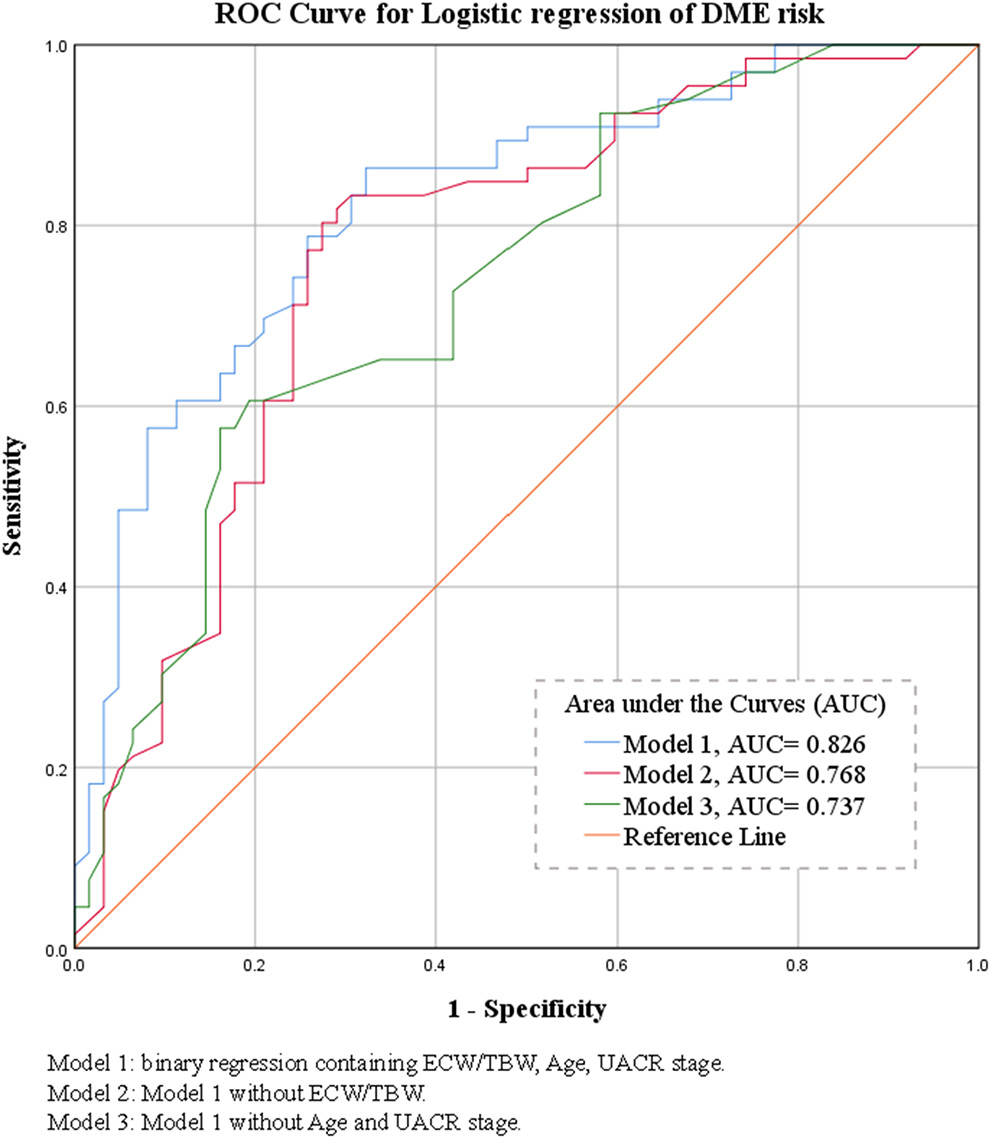
Binary logistic regression receiver operating characteristic curves of the morbidity of DME and their areas under the curve.
Discussion
This study provided new evidence to demonstrate the role of fluid overload in DME. As previously described, the relationship between barrier dysfunction and macular edema, impaired renal function and fluid overload have been investigated, respectively (10, 15). However, the complicated interaction between barrier dysfunction and fluid overload has not been elucidated yet, which make it intricate to explain whether the fluid overload is the mediator between barrier dysfunction and macular edema, or it can lead to DME without the impact from BRB breakdown, as fluid overload also had other influencing factors (27–29). Our study corroborated that fluid overload existed in patients with DME. Furthermore, we were the first to discover that the relationship between fluid retention and DME is independent of renal functions, especially UACR and eGFR. ECW/TBW was proven to be a risk factor for DME, suggesting that fluid overload is a contributing factor to DME apart from BRB disruption.
Tsai et al. (15) had found that the level of fluid overload was correlated with CST in patients with DR, and volume overload was the influence factor of DME. Our study also found a significant difference in fluid status between DME patients and DM patients without DME, either with or without DR. These results suggested that volume expansion might contribute to DME development. Meanwhile, we did not find significant differences in fluid overload status between the DR and DM groups, indicating that fluid overload could be a risk factor for DME but not DR.
A recent study found that fluid overload was correlated with the stages of UACR in T2DM patients with DKD (14). DKD was regarded as a sign of endothelial dysfunction due to oxidative stress and inflammation (30). Also, multiple studies confirmed that UACR levels were significantly associated with DME (6, 7, 31). Hsieh et al. (32) found patients with higher baseline UACR levels to have higher risks for developing DME during the follow-up period than those with lower UACR levels. Nephropathy and retinopathy co-existed in diabetic patients (33). Hemodynamic and structural changes due to inflammatory cytokines and oxidative stress under high blood glucose have been speculated as the cause (31). The increased UACR level suggests albumin leakage in the glomerulus and indicates the vascular barrier breakdown systemically. Even though the BRB was formed predominantly with tight junctions different to peripheral capillaries (34), in our study, the UACR stages were associated with ECW/TBW after adjustment, indicating that UACR is a significant influence factor for fluid overload. Therefore, it was of great importance to consider the role of DKD presented by albuminuria in the process of fluid retention in DME.
As ECW/TBW was reported to be affectable by multiple factors (14, 35, 36), we gradually adjusted for systemic factors, eGFR, and albuminuria, when analyzing fluid status among all participants. DME and ECW/TBW were still positively related after adjusting for confounders, suggesting that in DM patients, DME happens simultaneously with the presence of fluid overload, which was not affected by apparent inner BRB breakdown. Our results confirmed that the two parameters, ECW/TBW and UACR, are independent risk factors for DME. Hence, it could be speculated that the role of systemic fluid overload in DME development may collaborate with other mechanisms than deteriorated BRB function.
Throughout the body, fluid volume, hydrostatic and oncotic pressure, levels of albumin, and capillary permeability are the keys to maintaining the fluid balance between the intracellular and extracellular spaces, which is also true in the retina case. One of the popular theories for DME development was explicated by the starling equation (13). The hydrostatic pressure and oncotic pressure in different compartments govern the movement direction of fluid, which maintain homeostasis under normal circumstances (37). For example, the water transport of RPE cells was proved coupling with lactate, which provide a positive oncotic pressure to drive the water flow (38). It can be speculated that when hydrostatic pressure increases in the capillaries under volume expansion, fluid in the capillaries tends to move to the extravascular space (13). Therefore, high fluid volume can lead to peripheral edema and macular edema in the eyes. Recently, the revised starling equation has risen to make up for the shortcoming of the traditional one (37). The vascular barrier was composed of not only endothelial cells but also a layer which is known as the endothelial surface layer (ESL). ESL is the inner surface of the vascular wall, a semi-permeable layer composed of the glycocalyx and plasma protein such as albumin. Especially, albumin plays a vital role in its filtration function. ESL is usually impaired under systemic inflammation, including DM. The increased production of acute-phase protein suppresses albumin synthesis in the liver due to the limited synthesis capacity. Moreover, increased excretion of albumin from the kidney in the long run in patients with impaired kidney function further decreases the albumin level, leading to the dysfunction of ESL and leakage of fluid and protein. While on the retina, the damaged Müller cells no longer sustain neovascular coupling with DR progression, creating a focal high permeable environment for the albumin (39). Taking together, both fluid overload and impaired blood-retinal barrier can lead to leakage of fluid into the retinal interstitial space, resulting in macular edema.
As retinal thickness decreases with aging (40), we found the model consisting of ECW/TBW, UACR, and age achieved high accuracy in predicting DME risk. This result tally with the hypothesis that fluid overload could be a systemic fluid marker, parallel to the barrier dysfunction represented by albuminuria in the development of DME, in addition to focal VEGF elevation and inflammation.
In clinical practice, anti-VEGF agents are considered the first-line treatment for DME. However, non-responders exits at a considerable percentage (41). Some cases are even refractory to both anti-VEGF treatment and corticosteroid (42), demonstrating the need for additional therapies to treat this disease more comprehensively. Also, it is known that DME does not necessarily fit the regular course of DR progression. It may occur at any stage of DR (43). Therefore, beyond ischemia and inflammation, increased fluid volume may be another critical component in the pathophysiology of DME that has not been given sufficient attention. Several researchers also reported cases in which patients with DME improved, both central retinal thickness reduced and visual acuity improved, after diuretic therapy and restricting salt intake (44, 45), some of whom were even resistant to ophthalmic intervention anti-VEGF and grid laser treatment (46). Considering our findings in this study, we propose that, on the one hand, fluid overload can be one of the mechanisms that cause DME. In this point, treatment to ameliorate extracellular volume expansion such as diuretics and sodium-glucose cotransporter 2 inhibitors may have a role in treating DME patients with high ECW/TBW. On the other hand, in cases of DME who inadequately respond to anti-VEGF therapies and anti-inflammatory drugs, the underlying disease pathology may be mediated by fluid retention. Hence, further study with longitudinal design to observe the treatment response of DME patients with different fluid statuses would be pivotal to confirm the hypothesis.
There were some limitations of the study. The sample size was calculated with preliminary study data. Still, more substantial statistical power might reveal more significant systemic influence factors. Also, the assessment of the risk of DME was to be tested prospectively, and further cohort studies should be conducted to collaborate with our results.
In conclusion, systemic fluid status elevated significantly in patients with DME compared with diabetic patients without DME. Fluid overload and albuminuria were independent risk factors for DME. Fluid overload might have initiated the extravasation in macula edema in addition to barrier dysfunction.
Funding
This work was funded by Guangzhou Municipal Science and Technology Bureau (grant 202102080008) and Bethune-Merck Diabetes Research Fund (G2018030).
Publisher's Note
All claims expressed in this article are solely those of the authors and do not necessarily represent those of their affiliated organizations, or those of the publisher, the editors and the reviewers. Any product that may be evaluated in this article, or claim that may be made by its manufacturer, is not guaranteed or endorsed by the publisher.
Statements
Data availability statement
The raw data supporting the conclusions of this article will be made available by the authors, without undue reservation.
Ethics statement
The studies involving human participants were reviewed and approved by Research Ethics Committee of the Guangdong General Hospital (GDREC2018380H). The patients/participants provided their written informed consent to participate in this study.
Author contributions
JY, QP, and YL contributed to the study conception and design. Material preparation and data collection were performed by AL, JX, XZ, RC, YC, and ZW. Data analysis was conducted and the first draft of the manuscript was written by JY and QP. DC and LZ contributed to the manuscript reviewing and editing and funding acquisition. All authors read and approved the final manuscript.
Acknowledgments
The authors would like to thank DC and LZ for their administrative support, technical support, critical revision, and supervision. The authors would also like to thank the staff of the ophthalmology clinic of Guangdong Provincial People's Hospital for their assistance in the recruitment of the participants.
Conflict of interest
The authors declare that the research was conducted in the absence of any commercial or financial relationships that could be construed as a potential conflict of interest.
- DM
diabetes mellitus
- DR
diabetic retinopathy
- DME
diabetic macular edema
- SBP
systolic blood pressure
- DBP
diastolic blood pressure
- BMI
body mass index
- LogMAR
logarithm of minimal angle of resolution
- BCVA
best-corrected visual acuity
- IOP
intraocular pressure
- CST
central subfield thickness
- MV
macular volume
- UACR
urine albumin-to-creatinine ratio
- eGFR
estimated glomerular filtration rate
- HbA1c
glycated hemoglobin
- TP
total protein
- HDL
high-density lipoprotein
- LDL
low-density lipoprotein
- NLR
neutrophil-to-lymphocyte ratio
- MLR
monocyte-to-lymphocyte ratio
- PLR
platelet-to-lymphocyte ratio
- PBF
percentage of body fat
- ECW/TBW
extracellular water-to-total body water ratio
- VFA
visceral fat area
- BMR
basic metabolic rate
- SMI
skeletal muscle index
- DKD
diabetic kidney disease
- VEGF
vascular endothelial growth factor
- BIA
bioimpedance analysis
- BCM
body composition measurement
- CKD
chronic kidney disease
- OCT
optical coherence tomography
- ART
automatic real time
- DSM-BIA
direct segmental multi-frequency bioelectrical impedance analysis
- ECW
Extracellular water
- ICW
intracellular water
- PhA
phase angle
- CKD-EPI
Chronic Kidney Disease Epidemiology Collaboration
- ESL
endothelial surface layer
- IVI, intravitreous injection, RPE
retinal pigment epithelium
- BRB
blood-retinal barrier.
Abbreviations
References
1.
Chen L Magliano DJ Zimmet PZ . The worldwide epidemiology of type 2 diabetes mellitus–present and future perspectives. Nat Rev Endocrinol. (2011) 8:228–36. 10.1038/nrendo.2011.183
2.
Shaw JE Sicree RA Zimmet PZ . Global estimates of the prevalence of diabetes for 2010 and 2030. Diabetes Res Clin Pract. (2010) 87:4–14. 10.1016/j.diabres.2009.10.007
3.
Zheng Y Ley SH Hu FB . Global aetiology and epidemiology of type 2 diabetes mellitus and its complications. Nat Rev Endocrinol. (2018) 14:88–98. 10.1038/nrendo.2017.151
4.
Song P Yu J Chan KY Theodoratou E Rudan I . Prevalence, risk factors and burden of diabetic retinopathy in China: a systematic review and meta-analysis. J Glob Health. (2018) 8:010803. 10.7189/jogh.08.010803
5.
Doshi SM Friedman AN . Diagnosis and management of type 2 diabetic kidney disease. Clin J Am Soc Nephrol. (2017) 12:1366–73. 10.2215/CJN.11111016
6.
Zhuang X Cao D Yang D Zeng Y Yu H Wang J et al . Association of diabetic retinopathy and diabetic macular oedema with renal function in southern Chinese patients with type 2 diabetes mellitus: a single-centre observational study. BMJ Open. (2019) 9:e031194. 10.1136/bmjopen-2019-031194
7.
Zhuang X Cao D Zeng Y Yang D Yao J Kuang J et al . Associations between retinal microvasculature/microstructure and renal function in type 2 diabetes patients with early chronic kidney disease. Diabetes Res Clin Pract. (2020) 168:108373. 10.1016/j.diabres.2020.108373
8.
Lai IP Huang WL Yang CM Yang CH Ho TC Hsieh YT . Renal biomarkers for treatment effect of ranibizumab for diabetic macular edema. J Diabetes Res. (2020) 2020:7239570. 10.1155/2020/7239570
9.
Warid Al-Laftah FA Elshafie M Alhashimi M Pai A Farouq M . Pretreatment clinical variables associated with the response to intravitreal bevacizumab (Avastin) injection in patients with persistent diabetic macular edema. Saudi J Ophthalmol. (2010) 24:133–8. 10.1016/j.sjopt.2010.05.001
10.
Barrett EJ Liu Z Khamaisi M King GL Klein R Klein BEK et al . Diabetic microvascular disease: an endocrine society scientific statement. J Clin Endocrinol Metab. (2017) 102:4343–410. 10.1210/jc.2017-01922
11.
Reichhart N Strauss O . Ion channels and transporters of the retinal pigment epithelium. Exp Eye Res. (2014) 126:27–37. 10.1016/j.exer.2014.05.005
12.
Reichenbach A Bringmann A . Glia of the human retina. Glia. (2020) 68:768–96. 10.1002/glia.23727
13.
Daruich A Matet A Moulin A Kowalczuk L Nicolas M Sellam A et al . Mechanisms of macular edema: beyond the surface. Prog Retin Eye Res. (2018) 63:20–68. 10.1016/j.preteyeres.2017.10.006
14.
Nakajima H Hashimoto Y Kaji A Sakai R Takahashi F Yoshimura Y et al . Impact of extracellular-to-intracellular fluid volume ratio on albuminuria in patients with type 2 diabetes: a cross-sectional and longitudinal cohort study. J Diabetes Investig. (2020) 12:1202–11. 10.1111/jdi.13459
15.
Tsai MJ Cheng CK Wang YC . Association of body fluid expansion with optical coherence tomography measurements in diabetic retinopathy and diabetic macular edema. Invest Ophthalmol Vis Sci. (2019) 60:3606–12. 10.1167/iovs.19-27044
16.
Fiedler R Jehle PM Osten B Dorligschaw O Girndt M . Clinical nutrition scores are superior for the prognosis of haemodialysis patients compared to lab markers and bioelectrical impedance. Nephrol Dial Transplant. (2009) 24:3812–7. 10.1093/ndt/gfp346
17.
Kraemer M Rode C Wizemann V . Detection limit of methods to assess fluid status changes in dialysis patients. Kidney Int. (2006) 69:1609–20. 10.1038/sj.ki.5000286
18.
Sukackiene D Laucyte-Cibulskiene A Vickiene A Rimsevicius L Miglinas M . Risk stratification for patients awaiting kidney transplantation: role of bioimpedance derived edema index and nutrition status. Clin Nutr. (2020) 39:2759–63. 10.1016/j.clnu.2019.12.001
19.
Giles TD Materson BJ Cohn JN Kostis JB . Definition and classification of hypertension: an update. J Clin Hypertens. (2009) 11:611–4. 10.1111/j.1751-7176.2009.00179.x
20.
Nuttall FQ . Body mass index: obesity, BMI, and health: a critical review. Nutr Today. (2015) 50:117–28. 10.1097/NT.0000000000000092
21.
Levey AS Stevens LA Schmid CH Zhang YL Castro AF 3rd Feldman HI et al . A new equation to estimate glomerular filtration rate. Ann Intern Med. (2009) 150:604–12. 10.7326/0003-4819-150-9-200905050-00006
22.
Glassock RJ Warnock DG Delanaye P . The global burden of chronic kidney disease: estimates, variability and pitfalls. Nat Rev Nephrol. (2017) 13:104–14. 10.1038/nrneph.2016.163
23.
Johnson DW Jones GR Mathew TH Ludlow MJ Chadban SJ Usherwood T et al . Chronic kidney disease and measurement of albuminuria or proteinuria: a position statement. Med J Aust. (2012) 197:224–5. 10.5694/mja11.11468
24.
Elliott DB . The good (logMAR), the bad (Snellen) and the ugly (BCVA, number of letters read) of visual acuity measurement. Ophthalmic Physiol Opt. (2016) 36:355–8. 10.1111/opo.12310
25.
Early treatment diabetic retinopathy study design and baseline patient characteristics . Ophthalmology. (1991) 98:741–56. 10.1016/S0161-6420(13)38009-9
26.
Ling CH de Craen AJ Slagboom PE Gunn DA Stokkel MP Westendorp RG et al . Accuracy of direct segmental multi-frequency bioimpedance analysis in the assessment of total body and segmental body composition in middle-aged adult population. Clin Nutr. (2011) 30:610–5. 10.1016/j.clnu.2011.04.001
27.
Taniguchi M Yamada Y Fukumoto Y Sawano S Minami S Ikezoe T et al . Increase in echo intensity and extracellular-to-intracellular water ratio is independently associated with muscle weakness in elderly women. Eur J Appl Physiol. (2017) 117:2001–7. 10.1007/s00421-017-3686-x
28.
Ohashi Y Joki N Yamazaki K Kawamura T Tai R Oguchi H et al . Changes in the fluid volume balance between intra- and extracellular water in a sample of Japanese adults aged 15-88 yr old: a cross-sectional study. Am J Physiol Renal Physiol. (2018) 314:F614–22. 10.1152/ajprenal.00477.2017
29.
Booth J Pinney J Davenport A . N-terminal proBNP–marker of cardiac dysfunction, fluid overload, or malnutrition in hemodialysis patients?Clin J Am Soc Nephrol. (2010) 5:1036–40. 10.2215/CJN.09001209
30.
Satoh M . Endothelial dysfunction as an underlying pathophysiological condition of chronic kidney disease. Clin Exp Nephrol. (2012) 16:518–21. 10.1007/s10157-012-0646-y
31.
Knudsen ST Bek T Poulsen PL Hove MN Rehling M Mogensen CE . Macular edema reflects generalized vascular hyperpermeability in type 2 diabetic patients with retinopathy. Diabetes Care. (2002) 25:2328–34. 10.2337/diacare.25.12.2328
32.
Hsieh YT Tsai MJ Tu ST Hsieh MC . Association of abnormal renal profiles and proliferative diabetic retinopathy and diabetic macular edema in an Asian population with type 2 diabetes. JAMA Ophthalmol. (2018) 136:68–74. 10.1001/jamaophthalmol.2017.5202
33.
Faselis C Katsimardou A Imprialos K Deligkaris P Kallistratos M Dimitriadis K . Microvascular complications of type 2 diabetes mellitus. Curr Vasc Pharmacol. (2020) 18:117–24. 10.2174/1570161117666190502103733
34.
Naylor A Hopkins A Hudson N Campbell M . Tight junctions of the outer blood retina barrier. Int J Mol Sci. (2019) 21:211. 10.3390/ijms21010211
35.
Park S Lee CJ Jhee JH Yun HR Kim H Jung SY et al . Extracellular fluid excess is significantly associated with coronary artery calcification in patients with chronic kidney disease. J Am Heart Assoc. (2018) 7 e008935. 10.1161/JAHA.118.008935
36.
Tai R Ohashi Y Mizuiri S Aikawa A Sakai K . Association between ratio of measured extracellular volume to expected body fluid volume and renal outcomes in patients with chronic kidney disease: a retrospective single-center cohort study. BMC Nephrol. (2014) 15:189. 10.1186/1471-2369-15-189
37.
Woodcock TE Woodcock TM . Revised Starling equation and the glycocalyx model of transvascular fluid exchange: an improved paradigm for prescribing intravenous fluid therapy. Br J Anaesth. (2012) 108:384–94. 10.1093/bja/aer515
38.
Hamann S Kiilgaard JF la Cour M Prause JU Zeuthen T . Cotransport of H+, lactate, and H2O in porcine retinal pigment epithelial cells. Exp Eye Res. (2003) 76:493–504. 10.1016/S0014-4835(02)00329-9
39.
Coughlin BA Feenstra DJ Mohr S . Muller cells and diabetic retinopathy. Vision Res. (2017) 139:93–100. 10.1016/j.visres.2017.03.013
40.
Duan XR Liang YB Friedman DS Sun LP Wong TY Tao QS et al . Normal macular thickness measurements using optical coherence tomography in healthy eyes of adult Chinese persons: the Handan Eye Study. Ophthalmology. (2010) 117:1585–94. 10.1016/j.ophtha.2009.12.036
41.
Bressler NM Beaulieu WT Glassman AR Blinder KJ Bressler SB Jampol LM et al . Persistent macular thickening following intravitreous aflibercept, bevacizumab, or ranibizumab for central-involved diabetic macular edema with vision impairment: a secondary analysis of a randomized clinical trial. JAMA Ophthalmol. (2018) 136:257–69. 10.1001/jamaophthalmol.2017.6565
42.
Maturi RK Glassman AR Liu D Beck RW Bhavsar AR Bressler NM et al . Effect of adding dexamethasone to continued ranibizumab treatment in patients with persistent diabetic macular edema: A DRCR network phase 2 randomized clinical trial. JAMA Ophthalmol. (2018) 136:29–38. 10.1001/jamaophthalmol.2017.4914
43.
Flaxel CJ Adelman RA Bailey ST Fawzi A Lim JI Vemulakonda GA et al . Diabetic retinopathy preferred practice pattern(R). Ophthalmology. (2020) 127:P66–145. 10.1016/j.ophtha.2019.09.025
44.
Ciardella AP . Partial resolution of diabetic macular oedema after systemic treatment with furosemide. Br J Ophthalmol. (2004) 88:1224–5. 10.1136/bjo.2004.042580
45.
Samanta R Puthalath AS Saraswat N Agrawal A Singh A Mittal S . Rapidly reversing bilateral macular edema associated with fluid overload in a young type 1 diabetic. Indian J Ophthalmol. (2019) 67:1221–3. 10.4103/ijo.IJO_1805_18
46.
Kahtani ES . Diabetic glomerulosclerosis can be the pathogenesis of refractory diabetic macular edema. Clin Ophthalmol. (2015) 9:929–33. 10.2147/OPTH.S80850
Summary
Keywords
diabetic macular edema (DME), optical coherence tomography, body composition measurement, fluid status, albuminuria
Citation
Yao J, Peng Q, Li Y, Liang A, Xie J, Zhuang X, Chen R, Chen Y, Wang Z, Zhang L and Cao D (2022) Clinical Relevance of Body Fluid Volume Status in Diabetic Patients With Macular Edema. Front. Med. 9:857532. doi: 10.3389/fmed.2022.857532
Received
18 January 2022
Accepted
21 March 2022
Published
12 April 2022
Volume
9 - 2022
Edited by
Shaochong Zhang, Shenzhen Eye Hospital, China
Reviewed by
Veena Rao Raiji, Rush University, United States; Embong Zunaina, Universiti Sains Malaysia, Malaysia
Updates
Copyright
© 2022 Yao, Peng, Li, Liang, Xie, Zhuang, Chen, Chen, Wang, Zhang and Cao.
This is an open-access article distributed under the terms of the Creative Commons Attribution License (CC BY). The use, distribution or reproduction in other forums is permitted, provided the original author(s) and the copyright owner(s) are credited and that the original publication in this journal is cited, in accordance with accepted academic practice. No use, distribution or reproduction is permitted which does not comply with these terms.
*Correspondence: Dan Cao dancao5413@163.comLiang Zhang zhangliang5413@163.com
†These authors have contributed equally to this work and share first authorship
This article was submitted to Ophthalmology, a section of the journal Frontiers in Medicine
Disclaimer
All claims expressed in this article are solely those of the authors and do not necessarily represent those of their affiliated organizations, or those of the publisher, the editors and the reviewers. Any product that may be evaluated in this article or claim that may be made by its manufacturer is not guaranteed or endorsed by the publisher.