Abstract
Introduction:
Androgenetic alopecia (AGA) is a common progressive scalp hair loss disorder that leads to baldness. This study aimed to identify core genes and pathways involved in premature AGA through an in-silico approach.
Methods:
Gene expression data (GSE90594) from vertex scalps of men with premature AGA and men without pattern hair loss was downloaded from the Gene Expression Omnibus database. Differentially expressed genes (DEGs) between the bald and haired samples were identified using the limma package in R. Gene ontology and Reactome pathway enrichment analyses were conducted separately for the up-regulated and down-regulated genes. The DEGs were annotated with the AGA risk loci, and motif analysis in the promoters of the DEGs was also carried out. STRING Protein-protein interaction (PPI) and Reactome Functional Interaction (FI) networks were constructed using the DEGs, and the networks were analyzed to identify hub genes that play could play crucial roles in AGA pathogenesis.
Results and discussion:
The in-silico study revealed that genes involved in the structural makeup of the skin epidermis, hair follicle development, and hair cycle are down-regulated, while genes associated with the innate and adaptive immune systems, cytokine signaling, and interferon signaling pathways are up-regulated in the balding scalps of AGA. The PPI and FI network analyses identified 25 hub genes namely CTNNB1, EGF, GNAI3, NRAS, BTK, ESR1, HCK, ITGB7, LCK, LCP2, LYN, PDGFRB, PIK3CD, PTPN6, RAC2, SPI1, STAT3, STAT5A, VAV1, PSMB8, HLA-A, HLA-F, HLA-E, IRF4, and ITGAM that play crucial roles in AGA pathogenesis. The study also implicates that Src family tyrosine kinase genes such as LCK, and LYN in the up-regulation of the inflammatory process in the balding scalps of AGA highlighting their potential as therapeutic targets for future investigations.
Introduction
Androgenetic alopecia (AGA) is a complex genetic disorder characterized by a progressive loss of scalp hair leading to baldness. It is more prevalent in men than women, and the hair loss pattern differs between the sexes (1). In men, AGA, also known as male pattern hair loss, is defined by a distinct M-shaped pattern hair loss that begins with a bi-temporal recession of the frontal hairline, followed by hair thinning at the frontal and vertex scalp region, which eventually converges resulting in complete baldness in the frontal and vertex scalp region (1, 2). Hair loss, particularly adolescent AGA, causes serious psychosocial ramifications in men affecting their self-esteem and quality of life (3).
Hair loss in AGA is attributed to the gradual transformation of thick pigmented large terminal hairs into non-pigmented small fine vellus hair through hair follicle miniaturization process driven by the androgen 5α-dihydrotestosterone (5α-DHT) (1). However, the mechanism of hair follicle miniaturization is poorly understood and the inadequate understanding of the pathobiology of AGA impedes the search for a permanent cure to hair loss (4). Molecular genetic studies have identified 12 genomic regions of interest and genes such as AR, EDA2R, PAX1, FOXA2, HDAC9, TARDBP, HDAC4, AUTS2, IMP5, SETBP1, SUCNR, MBBL1, EBF1, WNT10A, SSPN, and ITPR2 associated with AGA (2). However, these identified genes explain only a limited proportion of the pathogenesis and genetic variance of AGA since most of the identified genetic variants reside in the non-coding region of the genome for which no clear functional effect has been established yet (2). Hence, the identification of additional genetic loci for AGA is warranted to understand the pathobiology and to aid drug discovery.
Recently, Michel et al. (5) performed a microarray gene expression analysis between hairless or bald vertex scalp from young men with premature AGA and haired scalp from control men to identify dysregulated genes in AGA. The identification of differentially expressed genes (DEGs) was carried out by analysis of variance test and Tukey’s post-hoc tests. After Benjamini-Hochberg correction they, found 184 down-regulated and 149 up-regulated genes in the AGA group compared with the healthy group. In this study, we utilized the same data of Michel et al. (5) to identify DEGs in the AGA pathology employing a different method and threshold criteria. We constructed biological networks, such as the STRING protein-protein interaction (PPI) and Reactome Functional Interactome (FI) networks, using the DEGs obtained. We then focused on the hub nodes in both the PPI and FI networks and identified the hub genes that were common to both networks as worthy of further investigation into the signaling pathways involved in AGA development.
Materials and methods
Microarray data
The raw dataset of the gene expression profile GSE90594 generated by Michel et al. (5) was downloaded from the GEO database (6). The data was obtained from scalp biopsies taken from the vertex region of 14 young males with premature alopecia (age 29.4 ± 3.4 years, stage V–VII as per Hamilton-Norwood classification) and 14 healthy volunteers with less than 2% white hairs (age 26.1 ± 3.6 years, Stage I or II according to Hamilton- Norwood classification). Both the alopecia and healthy group did not have any other skin involvement, autoimmune disorders, and systemic diseases (5).
Data preprocessing and differential gene expression analysis
limma v3.50.3 (Linear Models for Microarray Data) package, a R/Bioconductor software package, which provides an integrated solution for analyzing gene expression data from microarray technologies was utilized for data analysis (7). The Data pre-processing included background correction using normexp method and quantile normalization. Boxplot and cluster analyses were performed to identify and remove outliers in the samples. Then the control probes and the unexpressed probes are filtered out while the probes that are expressed above background are retained for further analysis. In addition, for multiple probes corresponding to the same genes in the arrays their average expression value was computed by avereps function in limma. Then the DEGs for the alopecia samples compared to the healthy samples were mined using the single-channel design matrix provided in the limma package. Benjamini and Hochberg’s method was utilized to compute the adjusted p-values (False Discovery Rate, FDR) (8). The probes with adjusted p-value (FDR) < 0.05 were selected as differentially expressed.
Gene ontology and pathway enrichment analysis
ToppGene Suite1 (updated: Mar 2021) was employed to perform gene ontology (GO) functional and pathway analysis to identify items in gene lists that may have relevance to the biological question being investigated (9, 10). The ToppFun function in the ToppGene Suite was utilized to carry out GO (biological process and molecular function), gene family (source: genenames.org), and pathway enrichment (source: Biosystems-Reactome) analyses for the DEGs. All genes that are detected in the microarray analysis were used as background gene set in the ToppGene Suite for these analyses. The probability density function which is the default method for p-value and FDR calculation was selected. Gene count >2 and FDR B&H q-value < 0.05 were chosen as the cut-off criteria for the analyses.
Annotation of differentially expressed genes with AGA risk loci
Windows of 50 kb, 100 kb and 500 kb flanking the 107 lead SNPs associated from 8 genome wide association studies [Study Accession IDs: GCST000250 (11), GCST000251 (12), GCST001548 (13), GCST001297 (14), GCST005116 (15), GCST90043616 (16), GCST003983 (17), and GCST90043619 (16)] for the trait androgenetic alopecia indexed in the NHGRI-EBI GWAS catalog were prepared by calculating coordinates of 50 kb, 100 kb and 500 kb distance on either sides from the SNP position. Gene coordinates of DEGs transcript(s) were annotated using RefSeq Identifiers (Hg38). The flanking coordinates of SNPs were overlapped with the coordinates of DEGs utilizing the intersect function in Bedtools v2.30.0 (18). An overlap is only considered when there is a minimum of 1 bp overlap between the coordinates of DEG transcripts and the flanking coordinates of the lead SNPs (19).
Motif analysis in the promoter regions of differentially expressed genes
The promoter regions of up and down-regulated DEGs were separately subjected to motif analysis utilizing the gene-based analysis method in HOMER v4.11 software2 (20). 2,000 bp upstream and 200 bp downstream relative to the transcriptional start site of the genes were considered as promoter regions (19) and the promoter sets for the DEGs were constructed based on RefSeq genes (Hg38). Motifs of length up to 12 bases were probed with Benjamini-Hochberg-corrected p-value ≤ 0.05 as cut-off value.
STRING protein-protein interaction network
The protein-protein interaction (PPI) interaction network for the DEGs were computed through the STRING database. The online web resource STRING v11.53 is a biological database that includes direct (physical) and indirect (functional) protein-protein association data which are both specific and biologically meaningful (21). The PPI interaction network for the DEGs were computed through the stringApp plugin v1.7.1 in Cytoscape v3.9.1 (22). An interaction score of 0.900 (highest confidence) was used as the cut off criterion for constructing the PPI network.
Reactome functional interaction network
Reactome functional interaction (FI) network was constructed for the DEGs utilizing the Cytoscape application ReactomeFIViz v8.0.4 which probe for disease-related pathways and network patterns using the Reactome functional interaction (FI) network (23, 24) created based on the well-known biological pathway database Reactome4 (25, 26). Reactome FI network 2021 version was used to construct the FI network for the DEGs. Gene ontology biological process and pathway enrichment analysis for the nodes (genes) mapped in the network was carried out through the inbuilt Reactome FI network analysis tool.
Network analysis and hub gene identification
The topological properties of the PPI and FI network were analyzed through the Cytoscape pre-installed network analyzer v4.4.8 tool (27). Cytohubba v0.1 plugin was used to identify hub proteins in the PPI and FI network and rank them based on topological algorithms and centralities such as Maximal Clique Centrality (MCC), Maximum Neighborhood component (MNC), Density of Maximum Neighborhood Component (DMNC), Degree, Closeness, and betweenness (28). The clusters in the networks were determined using the MCODE plugin with specific parameters including a degree cut-off of 2, fluff node density cut-off of 0.1, node score cut-off of 0.2, K-core of 2, and max depth of 100 to determine the highly interconnected nodes (29).
Results
Data processing and screening of differentially expressed genes
The GSE90594 dataset contained 28 samples of which 14 samples are from men with premature AGA and 14 samples from healthy men without hair loss. Cluster analysis of the samples after background correction and normalization of the arrays revealed 9 samples (5 alopecia and 4 healthy samples) as outliers (Supplementary I-1, 2). The outlier samples were removed, and differential gene expression analysis was carried out between 9 alopecia and 10 healthy samples. The probes were annotated with Entrez Gene ID, Gene Symbol, and Gene names using the clusterProfiler 4.0 v4.4.3 package in R by querying the Reference Seq ID (30). From this list, the probes that have a valid Entrez Gene ID are selected for further analysis. Subsequently probes with similar Probe IDs (Probe Names) are averaged using avereps function in limma and the probes with different probe ID for same genes are kept as such.
The analysis returned a total of 289 DEGs (33 up-regulated and 256 down-regulated DEGs) for a threshold cut off of value log2FC > | 1| and q-value < 0.05 (Supplementary II-6). Further to construct a big and detailed STRING PPI and reactome FI networks a total of 2,439 unique DEGs (1,261 up-regulated, 1,171 down-regulated, and 7 genes with probes expressed in both directions) that falls within a cut off value of log2FC > | 0.3| and q-value < 0.05 were mined (Figure 1). The gene family enrichment analysis of these 2,439 DEGs are given in Figure 2 and Supplementary II-7. GO functional analyses revealed that the up-regulated genes enriched for immune system mediated GO terms implying a heightened immune response in hairless scalp, while the down-regulated genes enriched for hair growth related GO terms as expected (Table 1 and Supplementary II-8). The Reactome pathway enrichment analysis also enriched pathways such as keratinization, developmental biology G2/M DNA replication checkpoint for down-regulated genes, wherein for up-regulated genes innate immune system, Cytokine signaling, interferon signaling, adaptive immune system, and antigen processing cross presentation pathways were enriched (Table 2 and Supplementary II-9). The DEG list was inspected for genes known to be involved in various signaling pathways such as Wnt, NF-κB, TGF-β, BMP, and Vitamin D metabolism and the mapped DEGs for these signaling pathways were provided in the Supplementary I-3.
FIGURE 1
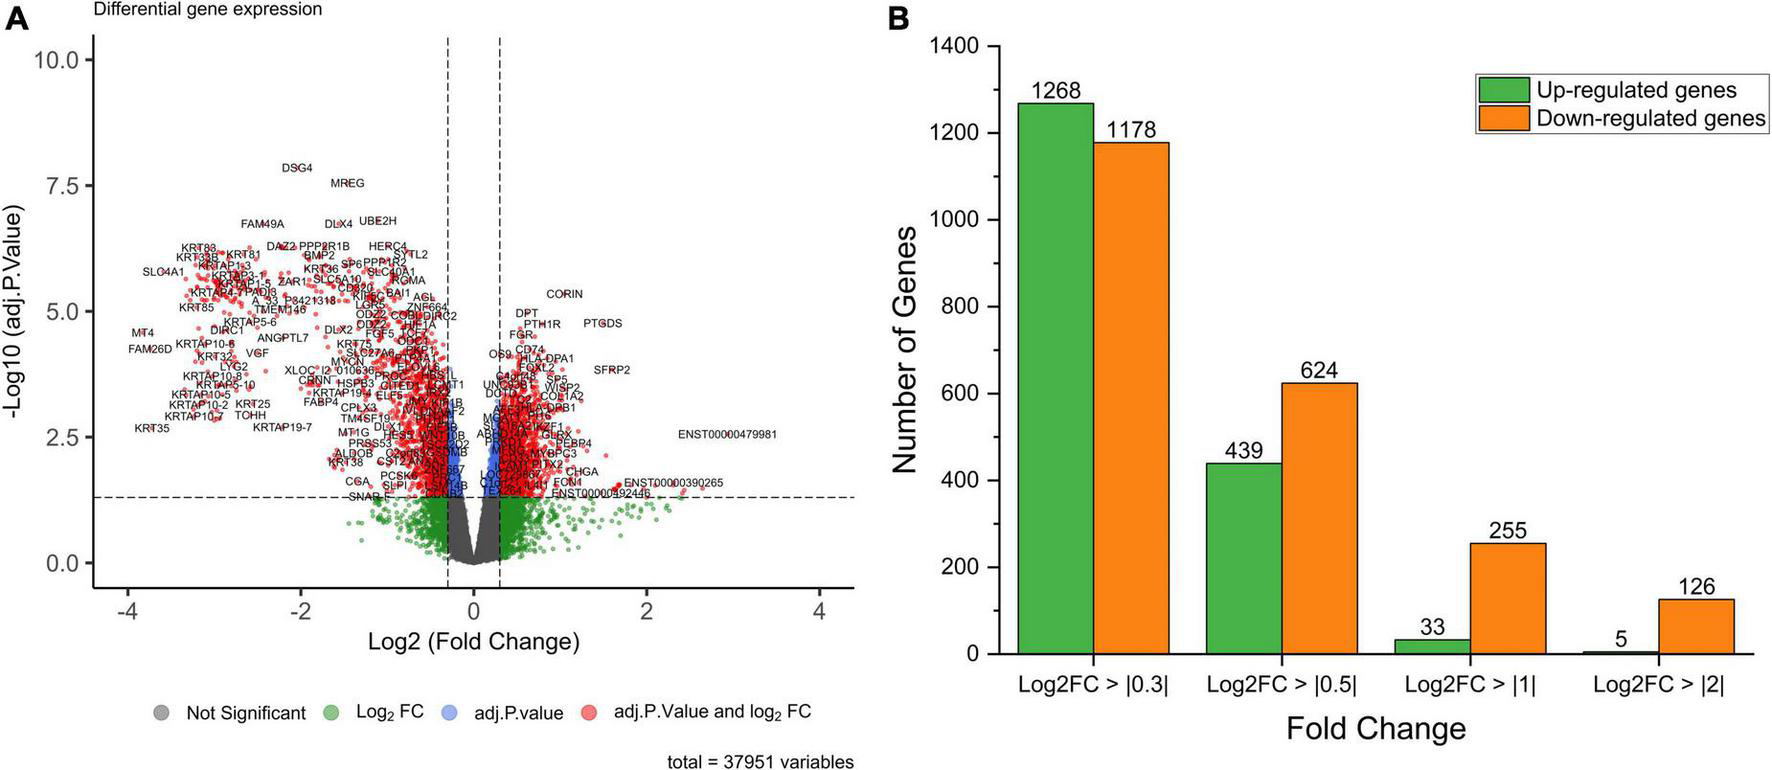
(A) Volcano plot of the differentially expressed genes in AGA with log2FC > | 0.3| and adj. p-value < 0.05 as cut off value. (B) Bar chart depicting the number of differentially expressed genes for the log2FC values.
FIGURE 2
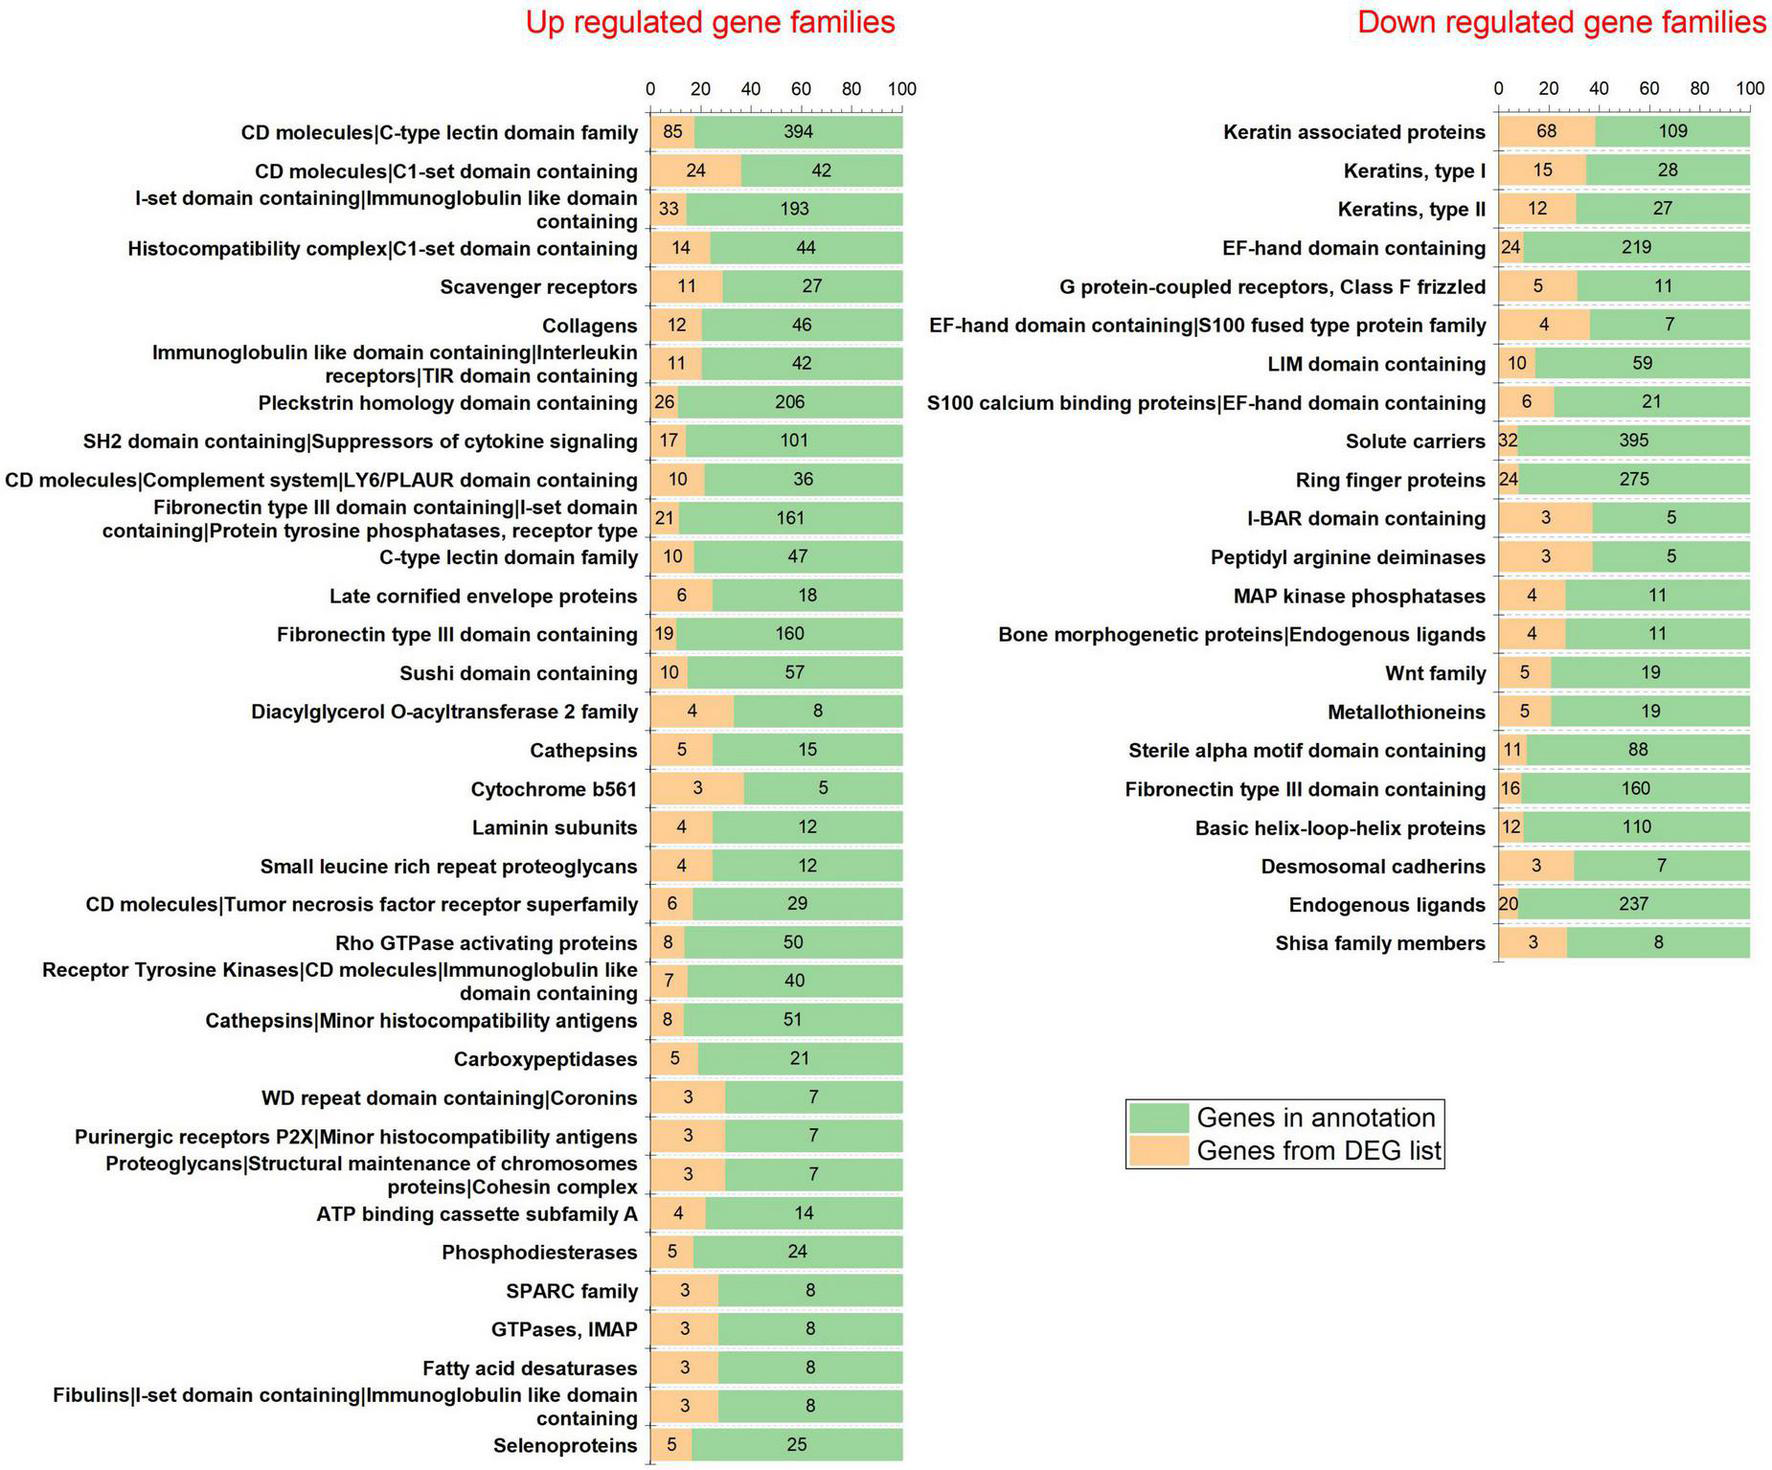
Gene family enrichment analysis of the differentially expressed genes.
TABLE 1
| Gene ontology of up-regulated genes | Gene ontology of down-regulated genes | |||||
| Gene ontology term | Number of genes from DEG list | Number of genes in annotation | Gene ontology term | Number of genes enriched | Number of genes in annotation | |
| Molecular function | Extracellular matrix structural constituent | 44 | 195 | Structural constituent of skin epidermis | 16 | 44 |
| Signaling receptor binding | 181 | 1,813 | Structural molecule activity | 87 | 892 | |
| Protein-containing complex binding | 166 | 1,726 | ||||
| Oxidoreductase activity | 97 | 834 | ||||
| integrin binding | 35 | 171 | ||||
| Immune receptor activity | 34 | 165 | ||||
| Carbohydrate binding | 46 | 315 | ||||
| Antigen binding | 32 | 189 | ||||
| MHC protein Complex binding | 14 | 43 | ||||
| MHC class II protein complex binding | 11 | 27 | ||||
| Biological process | Regulation of immune system process | 239 | 1,821 | Intermediate filament organization | 29 | 74 |
| Cell activation | 208 | 1,464 | Molting cycle | 38 | 149 | |
| leukocyte activation | 184 | 1,277 | Hair cycle | 38 | 149 | |
| Immune effector process | 144 | 895 | Intermediate filament cytoskeleton organization | 30 | 96 | |
| Regulation of immune response | 159 | 1,088 | Intermediate filament-based process | 30 | 98 | |
| Positive regulation of immune system process | 165 | 1,164 | Epithelium development | 180 | 1,979 | |
| Lymphocyte activation | 154 | 1,058 | Skin development | 60 | 387 | |
| Cell adhesion | 211 | 1,742 | Epidermis development | 67 | 500 | |
| Leukocyte mediated immunity | 105 | 594 | Hair follicle development | 27 | 120 | |
| T cell activation | 115 | 704 | Hair cycle process | 27 | 123 | |
| Cellular component | Cell surface | 162 | 1,178 | Intermediate filament | 101 | 229 |
| External side of plasma membrane | 104 | 599 | Keratin filament | 73 | 108 | |
| Side of membrane | 124 | 853 | Intermediate filament cytoskeleton | 103 | 271 | |
| Extracellular matrix | 106 | 678 | Polymeric cytoskeletal fiber | 156 | 889 | |
| External encapsulating structure | 106 | 680 | Supramolecular polymer | 177 | 1,181 | |
| Collagen-containing extracellular matrix | 90 | 541 | Supramolecular fiber | 176 | 1,172 | |
| Intrinsic component of plasma membrane | 202 | 1,992 | Supramolecular complex | 195 | 1,549 | |
| Integral component of plasma membrane | 192 | 1,893 | Anchoring junction | 109 | 1,419 | |
| Secretory granule | 116 | 987 | Cell-cell junction | 53 | 590 | |
| MHC protein complex | 16 | 26 | Extracellular matrix | 58 | 678 | |
Result of gene ontology analysis of DEGs from ToppGene Suite (FDR < 0.05).
TABLE 2
| Reactome ID | Pathway name | Genes from DEG list | Genes in annotation |
| Up-regulated genes | |||
| 1269203 | Innate immune system | 155 | 1,302 |
| 1269310 | Cytokine signaling in immune system | 102 | 760 |
| 1270244 | Extracellular matrix organization | 53 | 297 |
| 1269314 | Interferon gamma signaling | 27 | 94 |
| 1269201 | Immunoregulatory interactions between a Lymphoid and a non-lymphoid cell | 31 | 135 |
| 1457780 | Neutrophil degranulation | 69 | 492 |
| 1269318 | Signaling by interleukins | 70 | 528 |
| 1269340 | Hemostasis | 78 | 639 |
| 1269311 | Interferon Signaling | 33 | 202 |
| 1269173 | Phosphorylation of CD3 and TCR zeta chains | 10 | 25 |
| 1270246 | Collagen biosynthesis and modifying enzymes | 17 | 70 |
| 1269171 | Adaptive immune system | 88 | 823 |
| 1269350 | Platelet activation, signaling and aggregation | 40 | 282 |
| 1470923 | Interleukin-4 and 13 signaling | 22 | 114 |
| 1269174 | Translocation of ZAP-70 to immunological synapse | 9 | 22 |
| 1270260 | Integrin cell surface interactions | 16 | 68 |
| 1270001 | Metabolism of lipids and lipoproteins | 84 | 816 |
| 1269182 | PD-1 signaling | 9 | 26 |
| 1269195 | Antigen processing-cross presentation | 19 | 101 |
| 1270245 | Collagen formation | 18 | 93 |
| Down-regulated genes | |||
| 1457790 | Keratinization | 103 | 214 |
| 1270302 | Developmental biology | 158 | 1,078 |
| 1269756 | G2/M DNA replication checkpoint | 4 | 5 |
| 1269570 | Class B/2 (Secretin family receptors) | 16 | 93 |
Result of reactome pathway enrichment analysis of DEGs from ToppGene Suite (FDR < 0.05).
Annotation of differentially expressed genes with AGA risk loci
Mapping of SNPs identified through GWAS to DEGs annotates genetic variants located in or near the gene regions that are differentially expressed, helps to understand the functional role of DEGs and their association with disease. To identify genes that potentially contribute to AGA pathology, we annotated the coordinates of 107 genomic loci associated with AGA risk in men identified through GWAS with our DEGs. The analysis identified 51 DEGs within the window of 500 kb of 73 AGA risk SNPs and 14 DEGs within the window of 50 kb of 16 lead SNPs (Table 3). Some of the DEGs were mapped to reported AGA risk SNPs including MEMO1 at loci 2p22.3, SRD5A2 at 2p23.1, FOXL2NB at 3q23, FGF5 at 4q21.21, DKK2 at 4q25, EBF1 at 5q33.3, IRF4 at 6p25.3, CENPW at 6q22.32, PAGE2 at Xp11.21, highlighting their association with AGA pathology. Our analysis also identified other DEGs, such as HOXD9 at 2q31.1, LHPP at 10q26.13, CRHR1 at 17q21.31, STH at 17q21.31, and PAGE2B at Xp11.21, as more likely to be candidate gene risks for AGA than the mapped genes in GWAS studies. MEMO1 was down-regulated, and it plays a crucial role in regulating cell proliferation, survival, and differentiation in the hair follicle (30). SRD5A2, whose product inhibits hair growth, was up-regulated (31). HOXD9, a member of the HOX family of genes that plays a crucial role in the development and patterning of various tissues and organs in the body, was up-regulated in our analysis, although its role in hair growth is unknown (32). FGF5, which inhibits hair growth and is involved in the transition of hair follicles from anagen to catagen phase, was down-regulated (33). DKK2, a Wnt inhibitor that leads to hair growth inhibition was up-regulated (1). FOXL2NB, IRF4, CENPW, EBF1, LHPP, CRHR1, and STH located within the AGA risk loci warrant further investigation. The mapped DEGs within 500 kb of lead SNPs may also be considered for future investigation of their association with hair growth and AGA (Table 3).
TABLE 3
| Chr | Cytogenetic region | SNP | Study accession | Mapped genes | 500 kb | 100 kb | 50 kb | Log2FC | |||
| Diff genes | Up/Down | Diff genes | Up/Down | Diff genes | Up/Down | ||||||
| Chr1 | 1p33 | rs61784834 | GCST005116 | RPL21P24, FOXD2 | TRABD2B | Down | – | – | – | – | –0.61 |
| Chr1 | 1p36.11 | rs11249243 | GCST005116 | RUNX3, MIR4425 | RUNX3 | Up | RUNX3 | Up | – | – | 0.38 |
| CLIC4 | Down | – | – | – | – | –0.62 | |||||
| Chr1 | 1p36.11 | rs9803723 | GCST005116 | IFITM3P7, SYF2 | RUNX3 | Up | – | – | – | – | 0.38 |
| CLIC4 | Down | – | – | – | – | –0.62 | |||||
| Chr1 | 1p36.11 | rs2064251 | GCST005116 | IFITM3P7, SYF2 | RUNX3 | Up | – | – | – | – | 0.38 |
| CLIC4 | Down | – | – | – | – | –0.62 | |||||
| Chr1 | 1p36.11 | rs7534070 | GCST003983 | SYF2, IFITM3P7 | RUNX3 | Up | – | – | – | – | 0.38 |
| CLIC4 | Down | – | – | – | – | –0.62 | |||||
| Chr1 | 1p36.22 | rs12565727 | GCST001548 | C1orf127 | ANGPTL7 | Down | – | – | – | – | –2.21 |
| Chr1 | 1p36.22 | rs2095921 | GCST003983 | C1orf127 | ANGPTL7 | Down | – | – | – | – | –2.21 |
| Chr1 | 1p36.22 | rs7542354 | GCST005116 | C1orf127 | ANGPTL7 | Down | – | – | – | – | –2.21 |
| Chr1 | 1q24.2 | rs78003935 | GCST003983 | GORAB-AS1, HAUS4P1 | PRRX1 | Up | – | – | – | – | 0.54 |
| Chr1 | 1q24.2 | rs11578119 | GCST005116 | GORAB, GORAB-AS1 | PRRX1 | Up | – | – | – | – | 0.54 |
| Chr2 | 2p14 | rs6546334 | GCST003983 | LINC01812 | CNRIP1 | Up | – | – | – | – | 0.37 |
| Chr2 | 2p14 | rs62146540 | GCST005116 | FBXL12P1 | CNRIP1 | Up | – | – | – | – | 0.37 |
| PLEK | Up | – | – | – | – | 0.64 | |||||
| Chr2 | 2p21 | rs11694173 | GCST003983 | THADA | ZFP36L2 | Up | – | – | – | – | 0.31 |
| Chr2 | 2p22.3 | rs13021718 | GCST005116 | DPY30, MEMO1 | MEMO1 | Down | MEMO1 | Down | MEMO1 | Down | –0.32 |
| SRD5A2 | Up | – | – | – | – | 0.71 | |||||
| Chr2 | 2p23.1 | rs9282858 | GCST003983 | SRD5A2 | SRD5A2 | Up | SRD5A2 | Up | SRD5A2 | Up | 0.71 |
| GALNT14 | Down | – | – | – | – | –0.59 | |||||
| MEMO1 | Down | – | – | – | – | –0.32 | |||||
| EHD3 | Down | – | – | – | – | –1.49 | |||||
| CAPN14 | Down | – | – | – | – | –0.92 | |||||
| Chr2 | 2q13 | rs3827760 | GCST003983, GCST90043616 | EDAR | GCC2 | Down | – | – | – | – | –0.35 |
| Chr2 | 2q31.1 | rs13405699 | GCST005116, GCST003983 | ’– | MAP3K20 | Down | – | – | – | – | –0.42 |
| Chr2 | 2q31.1 | rs71421546 | GCST005116 | HOXD-AS2 | HOXD9 | Up | HOXD9 | Up | HOXD9 | Up | 0.34 |
| Chr2 | 2q35 | rs74333950 | GCST003983 | WNT10A | CYP27A1 | Up | CYP27A1 | Up | – | – | 0.42 |
| Chr2 | 2q35 | rs7349332 | GCST005116 | WNT10A | CYP27A1 | Up | CYP27A1 | Up | – | – | 0.42 |
| Chr2 | 2q37.3 | rs9287638 | GCST001548 | TWIST2, LINC01937 | TWIST2 | Up | TWIST2 | Up | – | – | 0.48 |
| Chr2 | 2q37.3 | rs11684254 | GCST005116, GCST003983 | LINC01937, TWIST2 | TWIST2 | Up | TWIST2 | Up | – | – | 0.48 |
| Chr3 | 3q23 | rs6788232 | GCST005116 | PRR23A, FOXL2NB | FOXL2NB | Up | FOXL2NB | Up | FOXL2NB | Up | 0.73 |
| FOXL2 | Up | FOXL2 | Up | – | – | 0.95 | |||||
| FOXL2NB | Up | – | – | – | – | 0.73 | |||||
| Chr3 | 3q23 | rs7642536 | GCST005116, GCST003983 | MRPS22 | FOXL2 | Up | – | – | – | – | 0.95 |
| Chr3 | 3q25.1 | rs4679956 | GCST003983 | AADACL2-AS1 | IGSF10 | Up | – | – | – | – | 0.45 |
| Chr3 | 3q25.1 | rs16863765 | GCST005116 | AADACL2-AS1 | IGSF10 | Up | – | – | – | – | 0.45 |
| Chr4 | 4q21.21 | rs7680591 | GCST005116 | FGF5 | FGF5 | Down | FGF5 | Down | FGF5 | Down | –1.09 |
| Chr4 | 4q21.21 | rs4690116 | GCST003983 | FGF5 | FGF5 | Down | FGF5 | Down | FGF5 | Down | –1.09 |
| Chr4 | 4q25 | rs78311490 | GCST003983 | DKK2 | DKK2 | Up | DKK2 | Up | DKK2 | Up | 0.34 |
| Chr5 | 5q33.3 | rs1422798 | GCST005116 | EBF1 | EBF1 | Up | EBF1 | Up | EBF1 | Up | 0.34 |
| RNF145 | Down | – | – | – | – | –0.40 | |||||
| Chr5 | 5q33.3 | rs62385385 | GCST003983 | EBF1 | EBF1 | Up | EBF1 | Up | EBF1 | Up | 0.34 |
| RNF145 | Down | – | – | – | – | –0.40 | |||||
| Chr6 | 6p25.3 | rs12203592 | GCST005116, GCST003983 | IRF4 | IRF4 | Up | IRF4 | Up | IRF4 | Up | 0.49 |
| Chr6 | 6q21 | rs12214131 | GCST005116 | ’– | PREP | Down | – | – | – | – | –0.37 |
| Chr6 | 6q22.32 | rs9398803 | GCST005116 | CENPW | CENPW | Down | CENPW | Down | CENPW | Down | –0.32 |
| Chr6 | 6q22.32 | rs1262557 | GCST003983 | RPS4XP9 | CENPW | Down | – | – | – | – | –0.32 |
| Chr7 | 7p21.1 | rs2073963 | GCST001548 | HDAC9 | TWIST1 | Up | – | – | – | – | 0.57 |
| Chr7 | 7p21.1 | rs71530654 | GCST005116 | HDAC9 | TWIST1 | Up | – | – | – | – | 0.57 |
| Chr7 | 7p21.1 | rs7801037 | GCST003983 | HDAC9 | TWIST1 | Up | – | – | – | – | 0.57 |
| Chr7 | 7q11.22 | rs939963 | GCST005116 | RNU6-832P | AUTS2 | Up | – | – | – | – | 0.31 |
| Chr7 | 7q11.22 | rs34991987 | GCST003983 | RNU6-832P | AUTS2 | Up | – | – | – | – | 0.31 |
| Chr7 | 7q11.22 | rs6945541 | GCST001548 | RNU6-832P | AUTS2 | Up | – | – | – | – | 0.31 |
| Chr7 | 7q11.22 | rs4718886 | GCST005116 | Y_RNA, RNU6-229P | AUTS2 | Up | – | – | – | – | 0.31 |
| Chr7 | 7q32.3 | rs9719620 | GCST005116 | MKLN1, MKLN1-AS | LINC-PINT | Up | – | – | – | – | 0.40 |
| Chr10 | 10q22.3 | rs11593840 | GCST005116, GCST003983 | LRMDA | KCNMA1 | Up | – | – | – | – | 0.46 |
| Chr10 | 10q26.13 | rs3781458 | GCST003983 | FAM53B | LHPP | Up | LHPP | Up | LHPP | Up | 0.30 |
| Chr10 | 10q26.13 | rs3781452 | GCST005116 | FAM53B | LHPP | Up | LHPP | Up | LHPP | Up | 0.30 |
| Chr11 | 11p11.2 | rs11037975 |
GCST005116, GCST003983 |
ALX4 | CD82 | Down | – | – | – | – | –0.33 |
| ACCS | Up | – | – | – | – | 0.56 | |||||
| Chr12 | 12p11.22 | rs7976269 | GCST005116 | FAR2 | TMTC1 | Down | – | – | – | – | –0.48 |
| Chr12 | 12p12.1 | rs9300169 | GCST003983 | SSPN | RASSF8-AS1 | Up | – | – | – | – | 0.38 |
| Chr12 | 12p12.1 | rs7974900 | GCST005116 | SSPN | RASSF8-AS1 | Up | – | – | – | – | 0.38 |
| Chr12 | 12q13.13 | rs180807105 | GCST90043616 | HOXC12 | MAP3K12 | Up | – | – | – | – | 0.31 |
| NFE2 | Up | – | – | – | – | 0.71 | |||||
| Chr12 | 12q24.33 | rs76972608 | GCST005116, GCST003983 | FZD10-AS1, LINC02419 | FZD10 | Down | FZD10 | Down | – | – | –0.55 |
| Chr13 | 13q12.3 | rs9314998 | GCST003983 | LINC00385, KATNAL1 | LINC00426 | Up | – | – | – | – | 0.44 |
| Chr17 | 17q21.31 | rs12373124 | GCST001548 | MAPT-AS1, SPPL2C | CRHR1 | Down | CRHR1 | Down | CRHR1 | Down | –0.72 |
| STH | Up | STH | Up | STH | Up | 0.36 | |||||
| Chr17 | 17q21.31 | rs919462 | GCST005116 | MAPT | STH | Up | STH | Up | STH | Up | 0.36 |
| CRHR1 | Down | – | – | – | – | –0.72 | |||||
| Chr17 | 17q21.31 | rs201408539 | GCST003983 | KANSL1 | STH | Up | STH | Up | – | – | 0.36 |
| CRHR1 | Down | – | – | – | – | –0.72 | |||||
| Chr17 | 17q21.31 | rs572756998 | GCST005116 | ARL17B | CRHR1 | Down | – | – | – | – | –0.72 |
| STH | Up | – | – | – | – | 0.36 | |||||
| WNT3 | Down | – | – | – | – | –0.68 | |||||
| Chr17 | 17q22 | rs17833789 | GCST005116 | AKAP1 | MSI2 | Down | – | – | – | – | –0.33 |
| MTVR2 | Up | – | – | – | – | 0.38 | |||||
| Chr17 | 17q22 | rs62060349 | GCST003983 | LINC02563, AKAP1 | MSI2 | Down | – | – | – | – | –0.33 |
| MTVR2 | Up | – | – | – | – | 0.38 | |||||
| Chr20 | 20p11.22 | rs2180439 | GCST000251, GCST001297 | ’– | PAX1 | Up | – | – | – | – | 0.81 |
| Chr20 | 20p11.22 | rs77410716 | GCST005116 | ’– | PAX1 | Up | – | – | – | – | 0.81 |
| Chr20 | 20p11.22 | rs552649178 | GCST005116 | LINC01432 | PAX1 | Up | – | – | – | – | 0.81 |
| Chr20 | 20p11.22 | rs201563 | GCST003983 | LINC01432 | PAX1 | Up | – | – | – | – | 0.81 |
| Chr20 | 20p11.22 | rs6047844 | GCST001548 | LINC01432 | PAX1 | Up | – | – | – | – | 0.81 |
| Chr20 | 20p11.22 | rs11087368 | GCST005116 | LINC01432 | PAX1 | Up | – | – | – | – | 0.81 |
| Chr20 | 20p11.22 | rs1160312 | GCST000250 | LINC01432 | PAX1 | Up | – | – | – | – | 0.81 |
| ChrX | Xp11.21 | rs185597083 | GCST003983 | FAM104B, PAGE2 | PAGE2 | Up | PAGE2 | Up | PAGE2 | Up | 0.48 |
| ChrX | Xp22.31 | rs5933688 | GCST003983 | ANAPC15P1, NOLC1P1 |
PAGE2B | Up | PAGE2B | Up | PAGE2B | Up | 0.69 |
| ANOS1 | Down | – | – | – | – | –0.61 | |||||
| ChrX | Xp22.31 | rs5934505 | GCST005116 | ANAPC15P1, NOLC1P1 | ANOS1 | Down | – | – | – | – | –0.61 |
| ChrX | Xq12 | rs200644307 | GCST003983 | ’– | AR | Up | – | – | – | – | 0.43 |
| ChrX | Xq12 | rs6625163 | GCST000250 | ’– | AR | Up | – | – | – | – | 0.43 |
| ChrX | Xq12 | rs2497938 | GCST001548, GCST001297 | ’- | AR | Up | – | – | – | – | 0.43 |
| ChrX | Xq12 | rs7061504 | GCST005116 | OPHN1 | AR | Up | – | – | – | – | 0.43 |
Overlap of AGA risk loci from genome-wide significance studies with differentially expressed genes in premature AGA samples compared to normal men.
Motif analysis in the promoter regions of AGA differentially expressed genes
The transcription factor motif enrichment analysis on the promoter regions of the differentially expressed genes was carried to identify potential transcription factors involved in the AGA pathology. The top transcription factor motifs enriched for the down-regulated genes are LEF1 (Lymphoid Enhancer binding Factor 1), HOXB13 (Homeobox B13), NEUROD1 (Neuronal Differentiation 1), ZNF189 (Zinc Finger protein 189), and MEF2C (MADS Box Transcription factor 2, Polypeptide C) (Figure 3 and Supplementary II-10). The transcription factor LEF1 actively participates in the Wnt signaling pathway by activating the transcription of target genes in the presence of β-catenin. Wnt/β-catenin Signaling plays a crucial role in hair follicle differentiation and morphogenesis (31). The transcription factor HOXB13 belongs to HOX gene family which plays a crucial role in regulating embryonic development including hair formation. HOXB13 is implicated in skin development and low level of its expression is associated with telogen hair follicle (32, 34). The transcription factor NEUROD1 is primarily involved in the development and differentiation of the nervous system. NEUROD1 acts by controlling the expression of genes involved in neuronal development and in the formation of axons and dendrites (35). ZNF189 belongs to the zinc finger protein family which play important roles in various biological processes including transcriptional regulation, DNA repair, and cellular signaling. MEF2C belongs to the MADS box transcription factor 2 (MEF2) family of transcription factors and is involved in myogenesis (32). Many transcription factor motifs belonging to the SMAD, HOX, STAT, ZNF, NEURO, FOX, and FOS gene families (Figure 3) are enriched for the down-regulated genes indicating their role in hair growth which has to be studied further.
FIGURE 3
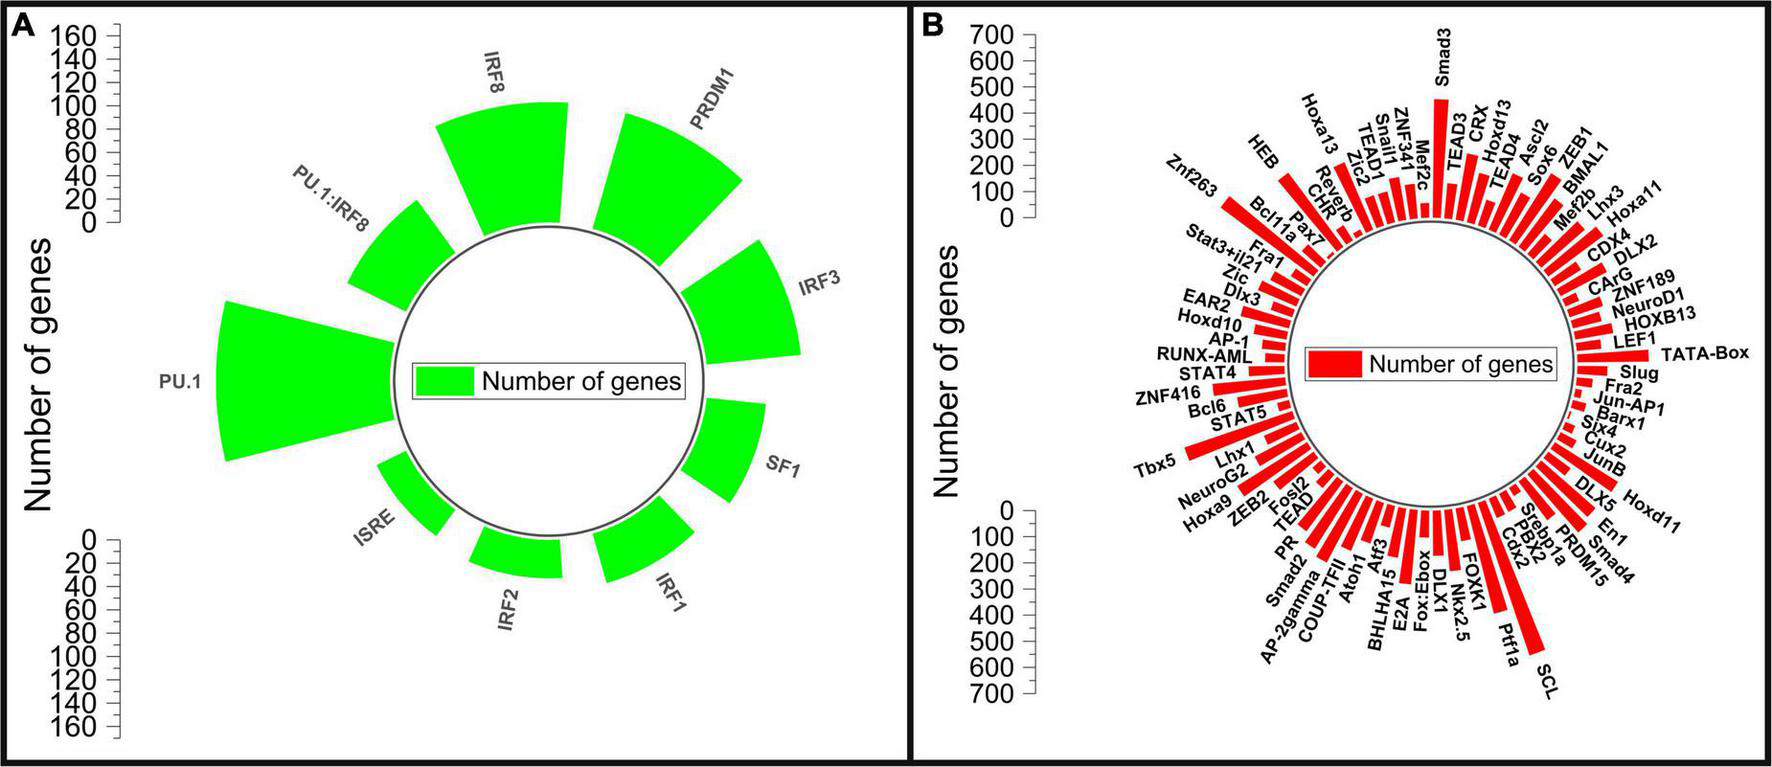
Motif enrichment analysis of the differentially expressed genes. (A) Motifs enriched in up-regulated genes, (B) motifs enriched in down regulated genes.
The motifs for IRF3 (Interferon Regulatory Factor 3), PRDM1 (PR/SET Domain 1), IRF8 (Interferon Regulatory Factor 8), SPI1 (Spi-1 Proto-Oncogene), SPI1:IRF8, ISRE (Interferon-sensitive response element), IRF2 (Interferon Regulatory Factor 2), IRF1 (Interferon Regulatory Factor 1) and SF1 transcription factors were enriched as the top motifs for the up-regulated genes (Figure 3 and Supplementary I-11). The Interferon regulatory factors (IRFs) are a family of transcription factors that regulate various aspects of the immune system from promoting immune cell development to immune cell differentiation. They play a central role in controlling the innate and adaptive immune responses to pathogens (33). IRF1 and IRF2 are important in regulating dendritic cells which participates in antigen presentation and bridge the innate and adaptive immune system. IRF3 involves in type I interferon production and IRF8 regulate myeloid cell development (33). PRDM1 coordinates several important functions in the adaptive immune system that support the key effector functions of B and T lymphocytes (36). SPI-1 encodes an ETS-domain transcription factor that control gene expression involving in the development of myeloid and B-lymphoid immune cells (37). The enrichment of these transcription factor motifs as the top motifs in the up-regulated genes of bald scalp implies a state of heightened immune response in AGA.
STRING protein-protein interaction network analysis and identification of hub genes
The stringApp generated 1967 PPI pairs for the submitted DEGs. The main PPI network, which consisted of 749 nodes (447 up-regulated genes, 273 down-regulated genes, and 29 linker genes) and 1,856 edges, was selected for further analysis while disconnected nodes and small isolated PPI pairs were discarded (Figure 4 and Supplementary II-12). The PPI network had a clustering coefficient of 0.334, a characteristic path length of 5.683, a network diameter of 19, a network density of 0.007, and an average of 4.956 neighbors. The functional enrichment analysis performed using the inbuilt STRING tool on the Reactome and Wikipathway databases revealed that the PPI network was enriched for several immune response-related pathways (Supplementary II-13). The pathway terms related to Cytokine Signaling in the Immune System, Interferon Signaling, T cell receptor signaling, Signaling by Interleukins, Immunoregulatory interactions between a Lymphoid and a non-Lymphoid cell, Adaptive and Innate immune systems, and TCF-dependent signaling in response to WNT were enriched from the Reactome database. Additionally, the Wikipathways database identified significant pathway terms related to the Inflammatory response pathway, Development of pulmonary dendritic cells and macrophage subsets, B cell receptor signaling pathway, and the Vitamin D receptor pathway (Supplementary II-13). These results confirm the credibility of the PPI network and reinforce the observation of immune response-related and hair follicle-related pathways.
FIGURE 4
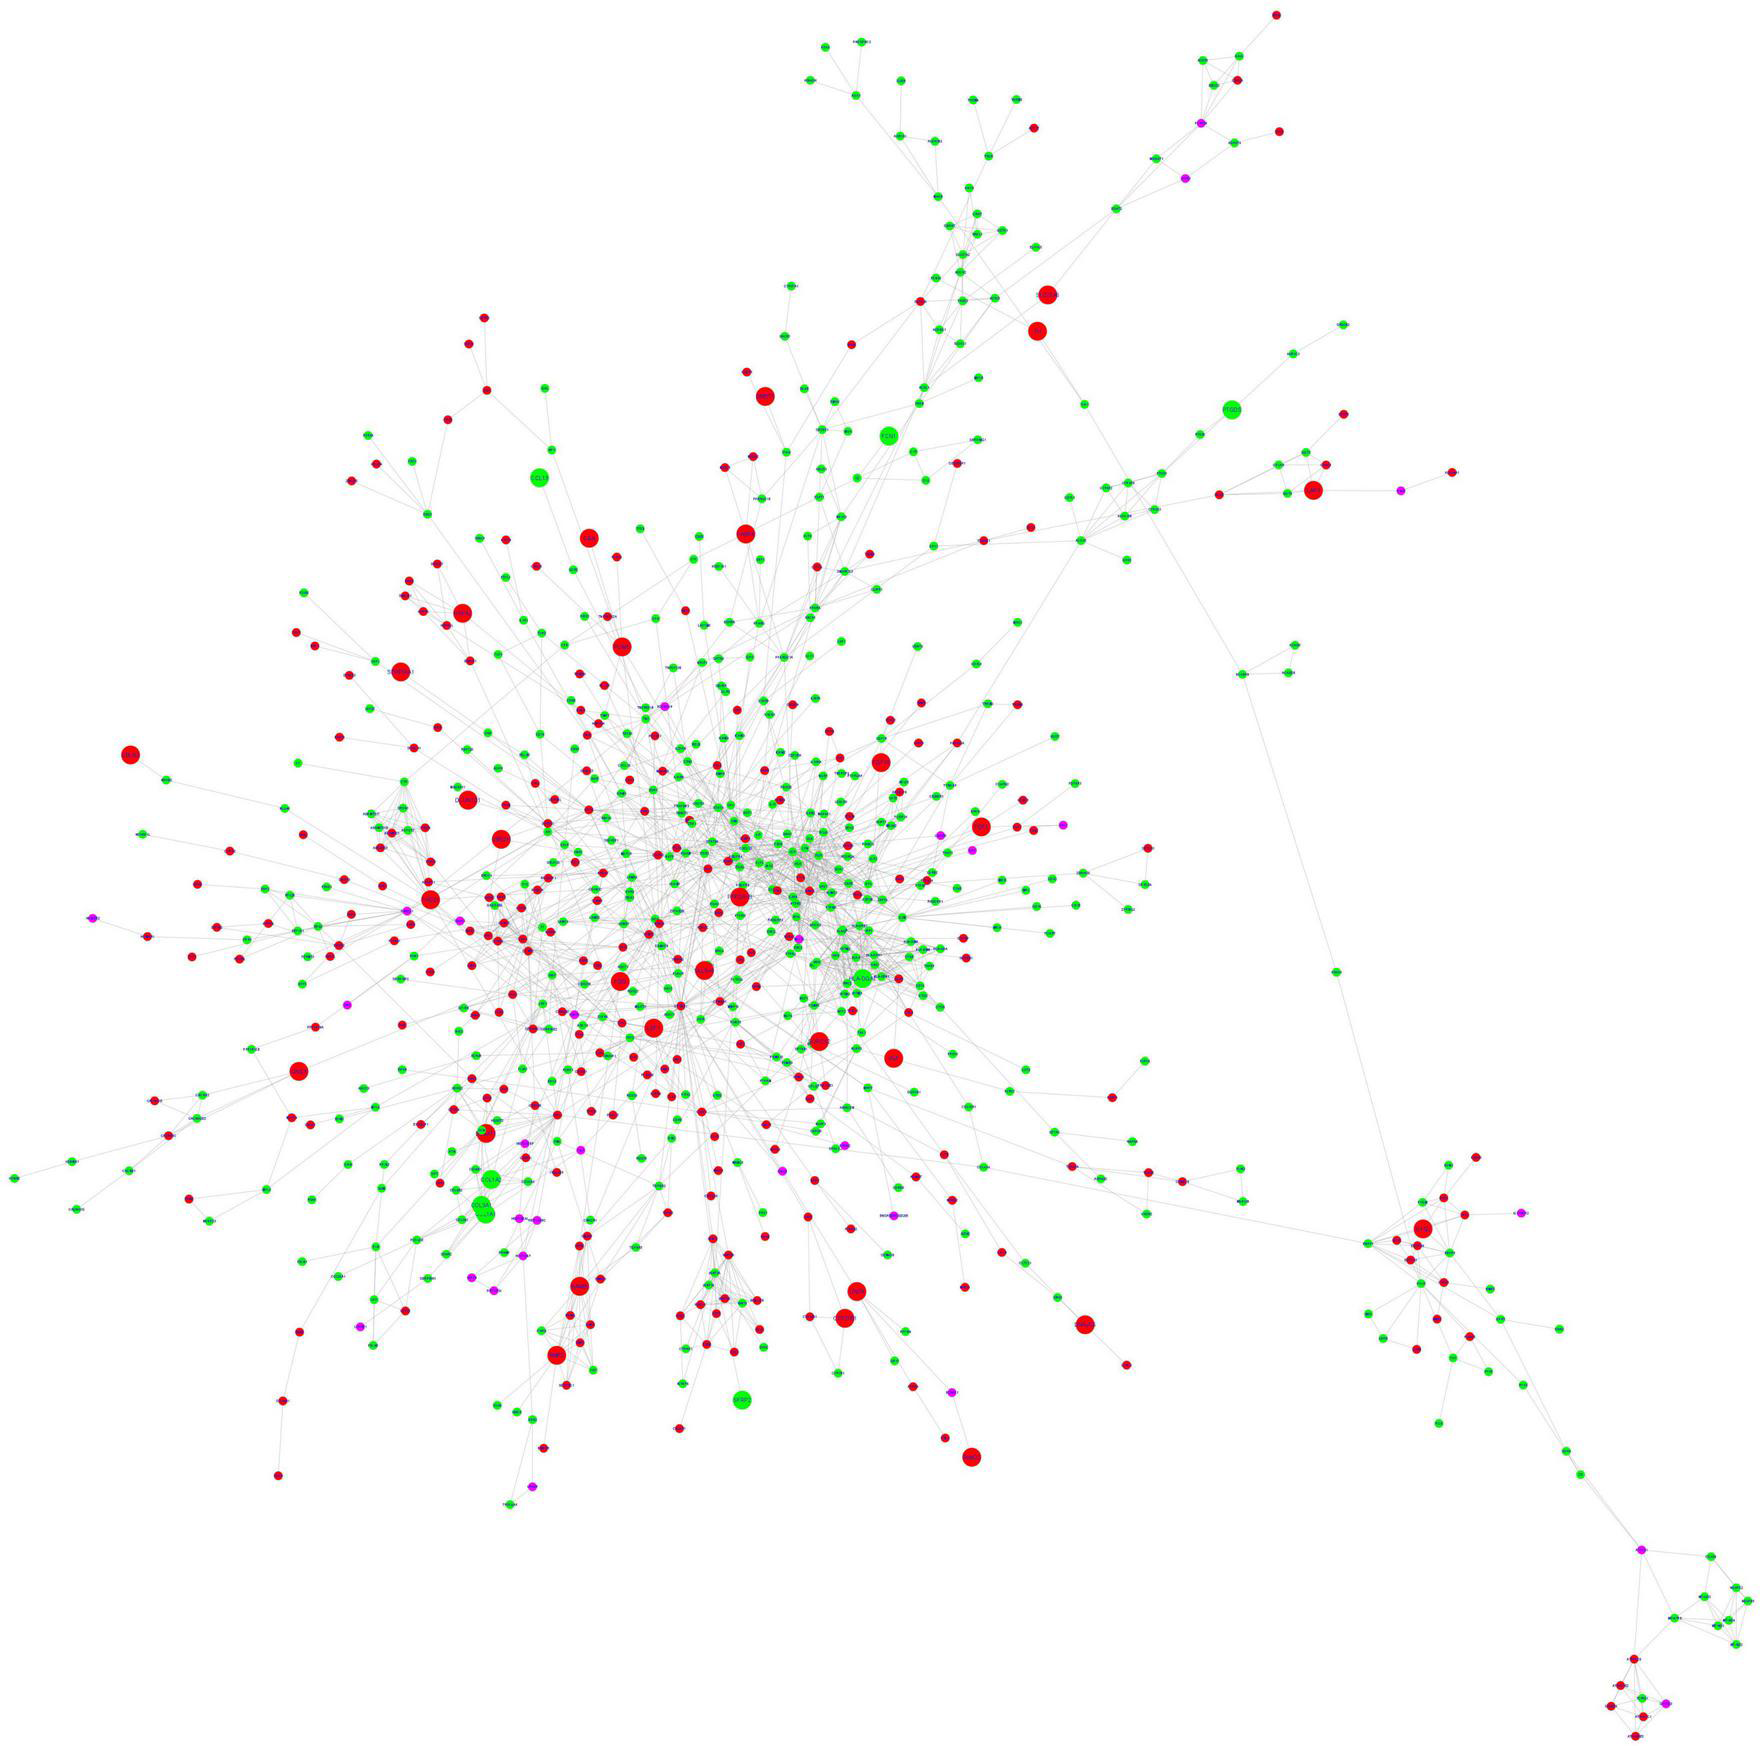
STRING protein-protein interaction network. The nodes are represented as circles and edges as lines. Red and green nodes indicate downregulated and upregulated genes, respectively. The larger nodes represent DEGs that comply with a log2FC > | 1| value. The pink nodes indicate linker genes.
The top 20 ranking hub nodes (genes) in the PPI network were identified using the Cytoscape plugin Cytohubba based on four topological analysis methods and two centralities (MCC, DMNC, MNC, Degree, Closeness, and Betweenness) and are listed in Table 4. Out of these, a total of 15 hub genes that appeared in at least three of these categories were considered as significant hub genes, and the frequently appeared genes are highlighted in the Table 4. The MCODE cluster analysis performed on the String PPI network revealed 8 clusters when using the 15 hub genes as roots for clustering. The 8 clusters were comprised of 53, 63, 101, 59, 37, 41, 53, and 9 nodes, respectively (Supplementary II-14). The top 3 highly interconnected clusters were selected for further analysis (Supplementary 1–4). Cluster 1 had 10 hub genes, cluster 2 contained 5 hub genes, and cluster 3 had 6 hub genes. Our analysis revealed that two hub genes LCK and STAT5A appeared in all 3 clusters strongly suggesting their putative role in AGA.
TABLE 4
| Topological algorithms | Centralities | ||||
| MCC | MNC | DMNC | Degree | Betweenness | Closeness |
| PSMB8 | LYN | IFITM3 | NRAS | CTNNB1 | CTNNB1 |
| IRF9 | LCK | IFITM1 | CTNNB1 | SDC1 | LCK |
| ISG15 | HLA-A | ISG15 | STAT3 | COL4A4 | STAT3 |
| EGR1 | STAT3 | IFITM2 | LYN | ENPP1 | EGF |
| IFITM3 | NRAS | OAS1 | LCK | NRAS | LYN |
| IFITM1 | HLA-DRB1 | EGR1 | HLA-A | HGF | NRAS |
| IFITM2 | PTPN6 | IRF8 | PTPN6 | STAT3 | PTPN6 |
| OAS1 | STAT5A | HLA-G | STAT5A | PPARA | STAT5A |
| HLA-A | PSMB8 | IRF1 | HLA-DRB1 | ITGAM | PDGFRB |
| HLA-F | HLA-F | POFUT2 | EGF | PKLR | VAV1 |
| HLA-E | CDK1 | SPON1 | ITGAM | LYN | HGF |
| IRF4 | HLA-E | THSD4 | B2M | H2AX | HCK |
| IRF1 | CTNNB1 | ADAMTS7 | CDK1 | THBS1 | ITGAM |
| IRF8 | HCK | ADAMTS1 | PSMB8 | TNF | ESR1 |
| HLA-G | CCNB1 | CFP | HLA-F | EGF | AR |
| CFP | FGR | ADAMTS17 | HLA-E | HIF1A | HIF1A |
| POFUT2 | VAV1 | ADAMTS10 | CCNB1 | ACSL1 | CXCL12 |
| SPON1 | CCNA2 | THBS2 | PTPRC | PPARG | HLA-A |
| THSD4 | IRF4 | THBS1 | VAV1 | RACK1 | PTPRJ |
| ADAMTS7 | LCP2 | IRF9 | IRF4 | QPRT | SFN |
Top 20 hub proteins identified by different topological algorithms and centralities utilizing cytohubba plugin in the STRING PPI network.
The highlighted genes are present in more than two columns, as indicated by the color code: Violet denotes presence in 4 columns, blue denotes presence in 3 columns, and green denotes presence in 2 columns.
Reactome protein functional interaction network analysis and identification of hub genes
The ReactomeFIViz tool was utilized to construct the FI network for the DEGs resulting in an initial network of 1,092 connected nodes, 1,340 unconnected nodes, and 4,047 edges (Supplementary II-15). The unconnected nodes were discarded from the analysis and the final FI network consisted of 1,014 nodes (581 up-regulated and 433 down-regulated genes) with 3,980 edges as shown in Figure 5. The FI network had a clustering coefficient of 0.280, a network diameter of 11, a network density of 0.008, and an average number of neighbors of 7.850. The pathway enrichment and GO Biological process analyses were conducted using the inbuilt ReactomeFIViz – analysis network function tool (Supplementary II-16). Reactome pathway terms such as Extracellular matrix organization, Keratinization, Interferon gamma signaling, Regulation of Insulin-like Growth Factor (IGF) transport and uptake by Insulin-like Growth Factor Binding Proteins, Response to elevated platelet cytosolic Ca2 +, Immunoregulatory interactions between a Lymphoid and a non-Lymphoid cell, and WNT ligand biogenesis and trafficking were enriched for the genes present in the FI network. GO Biological process terms such as immune response, transmembrane receptor protein tyrosine kinase signaling pathway, canonical Wnt signaling pathway, and inflammatory response were also enriched.
FIGURE 5
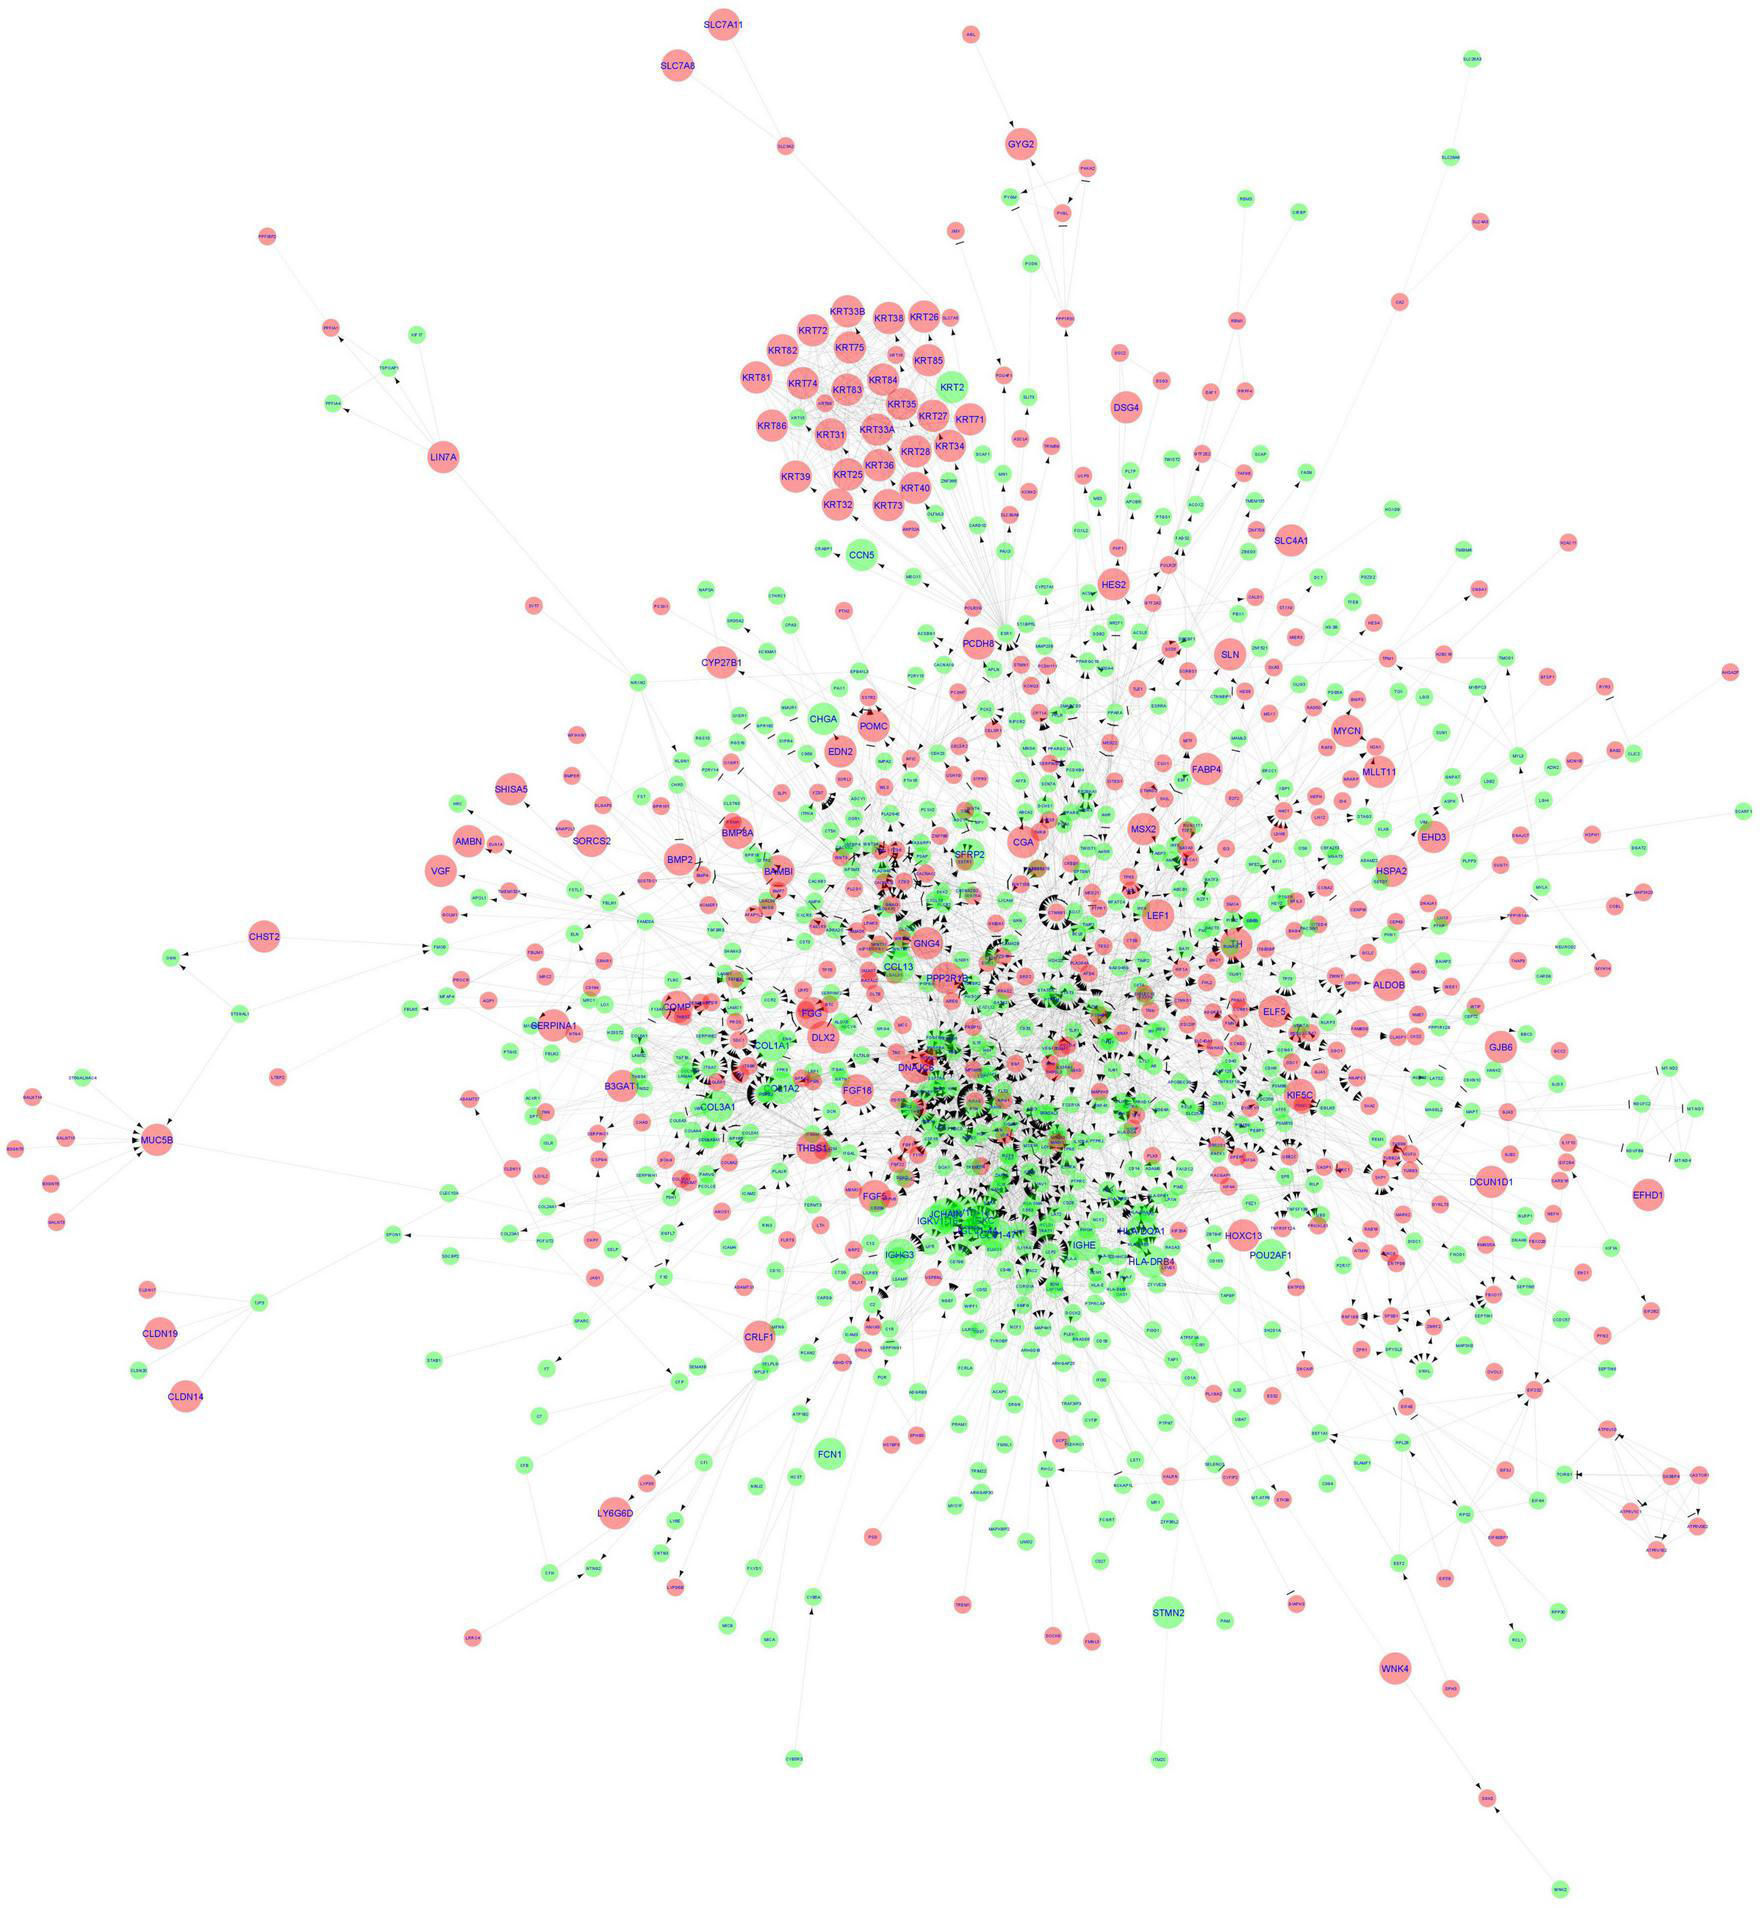
Functional interaction network generated by ReactomeFIViz app. The nodes are represented as circles and edges as lines. Red and green nodes indicate downregulated and upregulated genes, respectively. The larger nodes represent DEGs that comply with a log2FC > | 1| value.
The top 20 ranked hub genes in the FI network identified based on the six algorithms including MCC, DMNC, MNC, Degree, Closeness, and Betweenness are presented in the Table 5. Out of these, a total of 19 hub genes that appeared in at least three of the categories were considered significant hub genes, and the frequently appeared genes are highlighted in the Table 5. The MCODE cluster analysis of the FI network revealed 11 clusters when using the 19 hub genes as roots for clustering. The 11 clusters had node numbers of 189, 55, 216, 47, 34, 59, 153, 180, 29, 69, and 6, respectively (Supplementary II-17). The top 3 clusters ranked based on their cluster score were selected for further analysis (Supplementary I-5). Cluster 1 consisted of 14 hub genes, cluster 2 contained 1 hub genes, and cluster 3 had 9 hub genes. Our results showed that seven hub genes (HCK, GNAI3, RAC2, PDGFRB, EGF, NRAS, and STAT5A) were present in two of the selected clusters indicating their potential role in AGA.
TABLE 5
| Topological algorithms | Centralities | ||||
| MCC | MNC | DMNC | Degree | Betweenness | Closeness |
| LCP2 | STAT3 | LAT2 | STAT3 | ESR1 | STAT3 |
| HLA-DRB1 | LYN | HLA-DOA | CTNNB1 | CTNNB1 | CTNNB1 |
| HLA-DPA1 | CTNNB1 | CD74 | SPI1 | STAT3 | PIK3CD |
| HLA-DRB4 | LCK | SGO1 | ESR1 | SPI1 | PTPN6 |
| HLA-DQA1 | PIK3CD | SKA2 | PIK3CD | PIK3CD | SPI1 |
| HLA-DRB3 | SPI1 | ZWINT | LYN | GNAI3 | LYN |
| HLA-DPB1 | PTPN6 | C1R | LCK | PTPN6 | ESR1 |
| LCK | NRAS | C1S | NRAS | NRAS | STAT5A |
| CD3E | GNAI3 | LCP1 | GNAI3 | HIF1A | LCK |
| ZAP70 | VAV1 | CIITA | PTPN6 | EGR1 | NRAS |
| IGKC | HCK | KIF26A | RAC2 | ITGB7 | EGF |
| IGKV1-16 | EGF | C2 | HCK | GATA2 | GNAI3 |
| IGLV1-44 | PDGFRB | CELSR1 | VAV1 | AR | HCK |
| IGLV1-47 | LCP2 | PCDHB4 | EGF | LYN | PDGFRB |
| IGKV1D-16 | RAC2 | PCDH7 | STAT5A | RAC2 | HIF1A |
| LYN | STAT5A | PCDH8 | PDGFRB | TGFBR2 | EGR1 |
| VAV1 | BTK | DCHS1 | ITGB7 | ITGAM | AR |
| BTK | ITGB7 | KIF4A | LCP2 | TNF | VAV1 |
| HLA-DMB | CD3E | CDH23 | ITGAM | STAT5A | CRKL |
| HLA-DOA | HLA-DRB1 | PCDH11Y | BTK | LCK | BTK |
Top 20 hub proteins identified by different topological algorithms and centralities utilizing cytohubba plugin in the reactome FI network.
The highlighted genes are present in more than two columns, as indicated by the color code: Red denotes presence in 5 columns, violet denotes presence in 4 columns, blue denotes presence in 3 columns, and green denotes presence in 2 columns.
Candidate genes in AGA pathology
The 25 hub genes identified from the analyses of the PPI and FI networks constructed based on the DEGs were considered key genes in the pathology of AGA (Table 6). Out of these 25 hub genes, 21 genes (BTK, ESR1, HCK, ITGB7, LCK, LCP2, LYN, PDGFRB, PIK3CD, PTPN6, RAC2, SPI1, STAT3, STAT5A, VAV1, PSMB8, HLA-A, HLA-F, HLA-E, IRF4, and ITGAM) were found to be up-regulated, while 4 genes (CTNNB1, EGF, GNAI3, and NRAS) were downregulated. The results of the GO biological process and pathway enrichment analysis, conducted using the Toppgene suite, revealed that the hub genes were associated with immune and inflammatory processes (Table 7). The significant biological terms enriched for the hub genes included regulation of immune system process, T cell activation, immune response-regulating cell surface receptor signaling pathways. Furthermore, the significant pathway terms enriched for the hub genes included cytokine signaling in the immune system, signaling by interleukins, signaling by the B cell receptor (BCR), and signaling by SCF-KIT, interleukin-3, 5, and GM-CSF signaling, and the innate immune system.
TABLE 6
| Sr. no. | Gene symbol | Gene name | Gene family | Gene function summary from Uniprot | Expression direction |
| 1 | CTNNB1 | Catenin beta 1 | Armadillo family of proteins | Important for Wnt signaling and cell adhesion | DOWN |
| 2 | EGF | Epidermal growth factor | Epidermal growth factor family | Important for cell growth and differentiation | DOWN |
| 3 | GNAI3 | Guanine nucleotide-binding protein G(I) Subunit Alpha-3 | G protein alpha inhibitory subunit family | Regulates diverse signaling pathways | DOWN |
| 4 | NRAS | NRAS proto-oncogene, Gtpase | Ras family of small GTPases | Involves in regulating cell growth and differentiation | DOWN |
| 5 | BTK | Bruton tyrosine kinase | Tec family of non-receptor tyrosine kinases | Critical for B cell development and activation | UP |
| 6 | ESR1 | Estrogen receptor 1 | Nuclear receptor family | Acts as a transcription factor for estrogen signaling | UP |
| 7 | HCK | HCK proto-oncogene, Src family tyrosine kinase | Src family of non-receptor tyrosine kinases | Has roles in immune cell signaling and activation | UP |
| 8 | ITGB7 | Integrin subunit beta 7 | Integrin family of cell adhesion molecules | Important for immune cell trafficking and activation | UP |
| 9 | LCK | LCK proto-oncogene, Src family tyrosine kinase | Src family of non-receptor tyrosine kinases | Plays a critical role in T cell development and activation. |
UP |
| 10 | LCP2 | Lymphocyte cytosolic protein 2 | SLP-76 family of adapter proteins | Essential for T cell receptor signaling and activation | UP |
| 11 | LYN | LYN proto-oncogene, Src family tyrosine kinase | Src family of non-receptor tyrosine kinases | Functions in B cell signaling and immune responses. | UP |
| 12 | PDGFRB | Platelet derived growth factor receptor beta | Rho family of small GTPases | Involves in actin cytoskeleton organization and cell migration | UP |
| 13 | PIK3CD | Phosphatidylinositol-4,5-bisphosphate 3-kinase Catalytic Subunit Delta | Phosphoinositide 3-kinase catalytic subunit family | Plays a role in various signaling pathways | UP |
| 14 | PTPN6 | Protein tyrosine phosphatase non-receptor type 6 | Protein tyrosine phosphatase family | Regulates immune cell signaling and homeostasis | UP |
| 15 | RAC2 | Rac family small Gtpase 2 | Rho family of small GTPases | Involves in actin cytoskeleton organization and cell migration | UP |
| 16 | SPI1 | Spi-1 proto-oncogene | ETS family of transcription factors | Essential for hematopoietic development and differentiation | UP |
| 17 | STAT3 | Signal transducer and activator Of transcription 3 | STAT family of transcription factors | Involves in cytokine signaling and immune responses | UP |
| 18 | STAT5A | Signal transducer and activator Of transcription 5A | STAT family of transcription factors | Important for immune cell development and activation | UP |
| 19 | VAV1 | Vav guanine nucleotide exchange factor 1 | Vav family of guanine nucleotide exchange factors | Regulates signaling pathways downstream of receptors | UP |
| 20 | PSMB8 | Proteasome 20s subunit beta 8 | Proteasome beta subunit family | Involves in protein degradation and antigen presentation | UP |
| 21 | HLA-A | Major histocompatibility complex, Class I, A | Human leukocyte antigen (HLA) family | Involves in antigen presentation and immune responses | UP |
| 22 | HLA-F | Major histocompatibility complex, class I, F | Human leukocyte antigen (HLA) family | Involves in immune tolerance and immune responses | UP |
| 23 | HLA-E | Major histocompatibility complex, class I, E | Human leukocyte antigen (HLA) family | Involves in antigen presentation and immune regulation | UP |
| 24 | IRF4 | Interferon regulatory factor 4 | Interferon regulatory factor family | Involves in immune cell differentiation and function | UP |
| 25 | ITGAM | Integrin subunit alpha M | Integrin family of cell adhesion molecules | Important for leukocyte function and immune responses | UP |
Hub genes identified common in the STRING PPI and reactome FI network.
TABLE 7
| GO ID | Biological process term | Gene count | Up-regulated genes | Down-regulated genes |
| GO:0002682 | Regulation of immune system process | 20 | IRF4, PTPN6, LCK, SPI1, HLA-A, LCP2, LYN, ITGAM, PIK3CD, HCK, VAV1, ESR1, STAT3, BTK, STAT5A, RAC2, HLA-E, HLA-F | CTNNB1, NRAS |
| GO:0042110 | T cell activation | 15 | IRF4, PTPN6, LCK, SPI1, HLA-A, LYN, ITGAM, PIK3CD, VAV1, STAT3, STAT5A, RAC2, HLA-E, HLA-F | CTNNB1 |
| GO:0050778 | Positive regulation of immune response | 15 | PTPN6, LCK, SPI1, HLA-A, LCP2, LYN, ITGAM, PIK3CD, HCK, VAV1, BTK, STAT5A, HLA-E, HLA-F | NRAS |
| GO:0043299 | Leukocyte degranulation | 10 | SPI1, HLA-A, LYN, ITGAM, PIK3CD, HCK, BTK, RAC2, HLA-E, HLA-F | |
| GO:0002764 | Immune response-regulating signaling pathway | 14 | IRF4, PTPN6, LCK, HLA-A, LCP2, LYN, PIK3CD, HCK, VAV1, ESR1, BTK, HLA-E, HLA-F | NRAS |
| GO:1903131 | Mononuclear cell differentiation | 14 | IRF4, PTPN6, LCK, SPI1, LYN, PIK3CD, VAV1, STAT3, BTK, STAT5A, RAC2, HLA-E, HLA-F | CTNNB1 |
| GO:0045321 | Leukocyte activation | 17 | IRF4, PTPN6, LCK, SPI1, HLA-A, LCP2, LYN, ITGAM, PIK3CD, VAV1, STAT3, BTK, STAT5A, RAC2, HLA-E, HLA-F | CTNNB1 |
| GO:0002521 | Leukocyte differentiation | 15 | IRF4, PTPN6, LCK, SPI1, LYN, ITGAM, PIK3CD, VAV1, STAT3, BTK, STAT5A, RAC2, HLA-E, HLA-F | CTNNB1 |
| GO:0046649 | Lymphocyte activation | 16 | IRF4, PTPN6, LCK, SPI1, HLA-A, LYN, ITGAM, PIK3CD, VAV1, STAT3, BTK, STAT5A, RAC2, HLA-E, HLA-F | CTNNB1 |
| GO:0002768 | Immune response-regulating cell surface receptor signaling pathway | 12 | PTPN6, LCK, HLA-A, LCP2, LYN, PIK3CD, HCK, VAV1, BTK, HLA-E, HLA-F | NRAS |
| Biosystems ID | Reactome pathway name | Gene count | Up-regulated genes | Down-regulated genes |
| 1269310 | Cytokine signaling in immune system | 17 | PSMB8, IRF4, PTPN6, LCK, HLA-A, LYN, ITGAM, PDGFRB, PIK3CD, HCK, VAV1, STAT3, STAT5A, HLA-E, HLA-F | NRAS, EGF |
| 1269318 | Signaling by interleukins | 14 | PSMB8, IRF4, PTPN6, LCK, LYN, ITGAM, PDGFRB, PIK3CD, HCK, VAV1, STAT3, STAT5A | NRAS, EGF |
| 1269171 | Adaptive immune system | 15 | PSMB8, PTPN6, LCK, HLA-A, LCP2, LYN, PDGFRB, PIK3CD, ITGB7, VAV1, BTK, HLA-E, HLA-F | NRAS, EGF |
| 1269357 | GPVI-mediated activation cascade | 7 | PTPN6, LCK, LCP2, LYN, PIK3CD, VAV1, RAC2 | |
| 1269183 | Signaling by the B cell receptor (BCR) | 10 | PSMB8, PTPN6, LCK, LYN, PDGFRB, PIK3CD, VAV1, BTK | NRAS, EGF |
| 1269487 | Signaling by SCF-KIT | 11 | PSMB8, PTPN6, LCK, LYN, PDGFRB, PIK3CD, VAV1, STAT3, STAT5A | NRAS, EGF |
| 1269323 | Interleukin-3, 5 and GM-CSF signaling | 10 | PSMB8, PTPN6, LYN, PDGFRB, PIK3CD, HCK, VAV1, STAT5A | NRAS, EGF |
| 1269203 | Innate immune system | 16 | PSMB8, PTPN6, LCK, HLA-A, LCP2, LYN, ITGAM, PDGFRB, PIK3CD, HCK, VAV1, BTK, HLA-E | NRAS, EGF |
| 1269284 | DAP12 signaling | 10 | PSMB8, LCK, LCP2, PDGFRB, PIK3CD, VAV1, BTK, HLA-E | NRAS, EGF |
| 1268855 | Diseases of signal transduction | 10 | PSMB8, LCK, PDGFRB, PIK3CD, VAV1, STAT3, STAT5A | CTNNB1, NRAS, EGF |
Result of GO biological process and reactome pathway enrichment analysis of hub genes from ToppGene Suite (FDR < 0.05).
CTNNB1 (Catenin Beta 1) is a crucial downstream component of the Canonical Wnt Signaling Pathway. In the presence of Wnt ligand, β-catenin accumulates in the nucleus and functions as a coactivator for the transcription factors TCF/LEF, leading to the activation of Wnt responsive genes (35). The Wnt/β-catenin signaling pathway is essential for hair growth and its inhibition, driven by 5α-dihydrotestosterone through the androgen receptor, can result in hair loss in AGA (1). GNAI3 (G Protein Subunit Alpha I3) functions as a downstream transducer of G protein-coupled receptors (GPCRs) in various signaling pathways (38). GPCRs play a role in regulating skin homeostasis and maintaining hair growth (39–41). NRAS (NRAS Proto-Oncogene, GTPase) is a membrane protein that travels between the plasma membrane and Golgi apparatus (42). EGF (Epidermal Growth Factor) acts as a switch in the hair growth cycle (43). It regulates the expression of hair follicle regulatory genes through Wnt//β-catenin signaling (44). Thus, these 4 downregulated hub genes which are involved in hair growth mechanisms are crucial and their downregulation in AGA is expected.
The LCK (LCK Proto-Oncogene, Src Family Tyrosine Kinase) gene, which encodes a non-receptor protein-tyrosine kinase, is a crucial signaling molecule in the selection and maturation of developing T cells and plays a key role in T cell receptor signal transduction pathways (25, 26). The up-regulation of the LCK gene is also associated with alopecia areata (27). The LYN (LYN Proto-Oncogene, Src Family Tyrosine Kinase) gene encodes a non-receptor tyrosine-protein kinase and is crucial for regulating innate and adaptive immune responses, integrin signaling, growth factor and cytokine responses, and hematopoiesis (24). BTK (Bruton Tyrosine Kinase) and plays a key role in B lymphocyte development and is a target for inflammatory diseases (45). Inhibition of BTK by inhibitors leads to changes in hair and nails texture (38). PIK3CD (Phosphatidylinositol-4,5-Bisphosphate 3-Kinase Catalytic Subunit Delta) is involved in immune system response (46). PTPN6 (Protein Tyrosine Phosphatase Non-Receptor Type 6) is critical for the function of lymphoid and myeloid cells (47). SPI1 (Spi-1 Proto-Oncogene) encodes a transcriptional activator specifically involved in the development of macrophages and B cells. This protein also regulates pre-mRNA splicing (23). STAT3 (Signal Transducer and Activator of Transcription 3) is activated by cytokines and growth factors. This gene plays an important role in maintaining the homeosis of skin (48). STAT5A (Signal Transducer and Activator of Transcription 5A) protein serves a dual function of signal transduction and activation of transcription in cells exposed to cytokine and other growth factors. This protein also mediates cellular responses to activated FGFR1, FGFR2, FGFR3 and FGFR4 (31). Also, STAT5 activation is important for hair growth phase induction in hair dermal papilla cells (DPCs) (34). VAV1 (Vav Guanine Nucleotide Exchange Factor 1) encoded protein is important in hematopoiesis and plays a role in the development and activation of T-cell and B-cell (32). PSMB8 (Proteasome 20S Subunit Beta 8) plays an important role in cellular homeostasis through selective destruction of ubiquitinated proteins. Mutations in this gene are associated with autoinflammatory responses (49). ESR1 (Estrogen Receptor 1) is a nuclear sex steroid hormone receptor which regulates many genes responsible for growth, metabolism and reproductive functions. This gene is known to express in hair follicle cells (50). HCK (HCK Proto-Oncogene, Src Family Tyrosine Kinase) participates in the regulation of innate immune responses by inducing monocyte, neutrophil, macrophage and mast cell functions. This gene is recently reported to play a role in hair regenerative potential of stem cells (51). ITGB7 (Integrin Subunit Beta 7) is an adhesion receptor which mediates signaling from the extra cellular matrix to the cell. They also function as a homing receptor for lymphocytes migration (46). LCP2 (Lymphocyte Cytosolic Protein 2) acts as a substrate for the T cell antigen receptor mediated intracellular tyrosine kinase pathway (46). PDGFRB (Platelet Derived Growth Factor Receptor Beta) gene encodes a cell surface tyrosine-protein kinase receptor for the members of the platelet-derived growth factor family. It plays an essential role in cell proliferation, differentiation, survival, chemotaxis, and migration (52). RAC2 (Rac Family Small GTPase 2) involve in phagocytosis of apoptotic cells and epithelial cell polarization (46). IRF4 (Interferon Regulatory Factor 4) regulates interferon signaling and negatively regulates Toll like receptor in the induction of innate and adaptive immune systems (42). ITGAM (Integrin Subunit Alpha M) functions as macrophage receptor and plays a key role in the adherence of monocytes and neutrophils (42). HLA-A (Major Histocompatibility Complex, Class I, A), HLA-F (Major Histocompatibility Complex, Class I, F) and HLA-E (Major Histocompatibility Complex, Class I, E) plays a central role in immune system by participating in cell presentation for recognition by T cell receptor (42). A majority of the hub genes namely PTPN6, LCK, LCP2, LYN, HCK, VAV1, STAT3, STAT5A, and BTK belongs to the Src homology 2 (SH2) domain containing tyrosine kinases and participate in the immune system process.
We conducted ClueGO reactome pathway enrichment analysis for the genes that were identified by at least two algorithms of the Cytohubba analysis of the biological networks (PPI and FI) as well as 289 DEGs that met the cut-off value of log2FC > | 1| using the ClueGo plugin v2.5.9 in Cytoscape (53). The results were presented as a network of pathways with genes participating in the pathways, which are illustrated in Figure 6. The analysis revealed pathways such as keratinization, formation of the cornified envelope, developmental biology, interferon alpha/beta signaling, cytokine signaling in the immune system, receptor tyrosine kinase signaling, PI5P, PP2A, and IER3 regulation of PI3K/AKT signaling, immunoregulatory interactions between lymphoid and non-lymphoid cells, costimulation by the CD28 family, and the GPVI-mediated activation cascade are the predominant pathways for our input genes. The enrichment of pathways involved in immune system function are consistent with our findings suggesting that immune system dysregulation plays a role in AGA pathology.
FIGURE 6
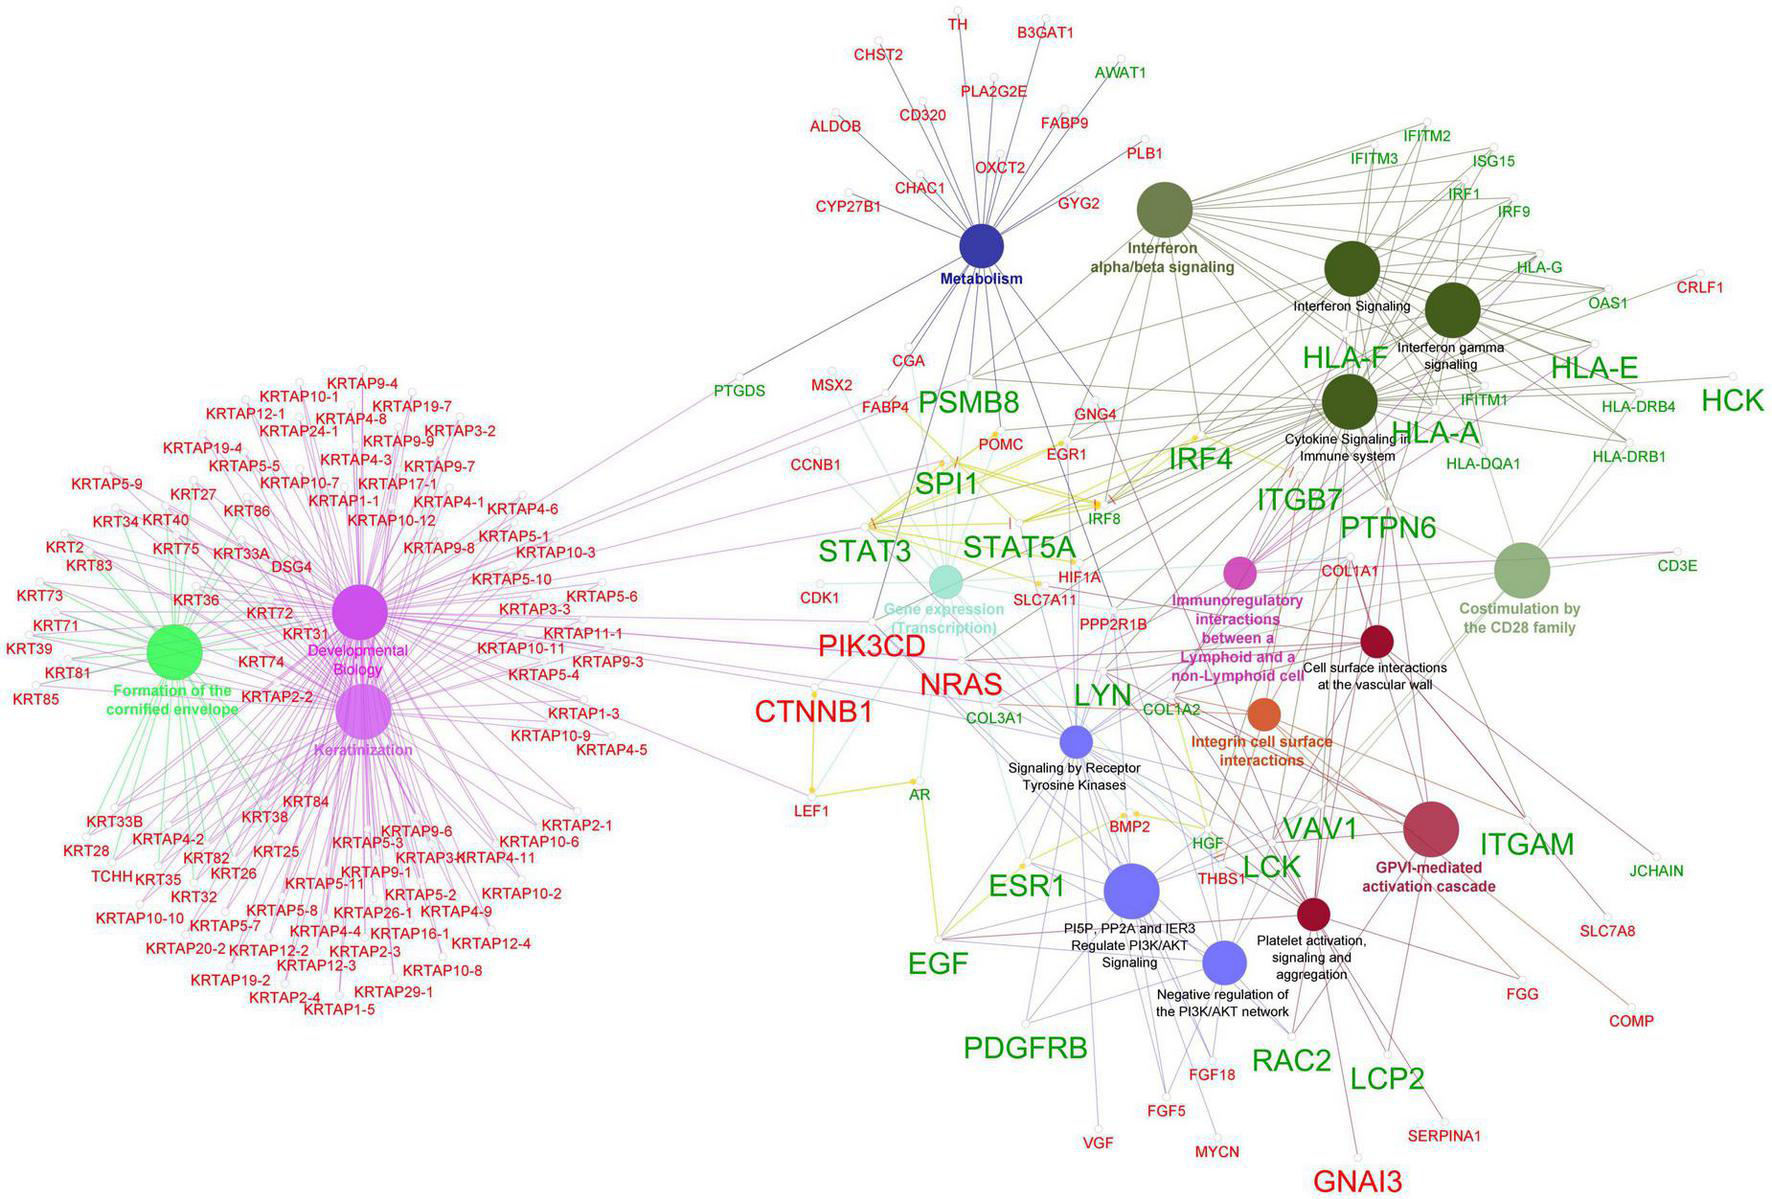
Enrichment of reactome pathway terms for the hub genes and DEGs that comply log2FC > | 1| using Cytohubba plugin ClueGO. The network shows the connectivity between pathway terms based on shared functional nodes and edges among the DEGs with a kappa score of 0.4. The color of the nodes and edges represents their specific functional classes, and only significant values with p < 0.05 are shown in the enrichment. Nodes labeled in red represent down-regulated genes, while nodes labeled in green indicate up-regulated genes. The larger labeled nodes are the hub genes.
Validation of DEGs with other datasets
To validate the results of our analysis of the GEO dataset GSE90594, we compared the DEGs obtained with other datasets available in the GEO database. As of November 1, 2022, we found that no profile in the database contained samples from men with AGA and from normal haired men, except for the profile we analyzed in this study. The few available datasets related to AGA lacked control samples from normal men and the quality of the microarray and RNA-Seq data was questionable. Despite these limitations, we selected two datasets, GSE66663 (which includes hTERT-immortalized DPCs derived from balding frontal and non-balding occipital scalp samples from men with AGA) and GSE212301 (which contains RNA-Seq data from balding vertex and non-balding occipital scalp samples of 10 men with AGA), and performed differential gene expression analyses. The common DEGs between the datasets are presented in the Supplementary II-18. We discovered 490 DEGs were common between GSE90594 and GSE66663 dataset in which 190 genes were differentially regulated in same directions. Whereas 180 DEGs were common between GSE90594 and GSE212301 dataset in which 44 genes were differentially regulated in same directions.
Discussion
Differential gene expression analysis is a technique used to identify genes whose expression levels change significantly between two or more experimental conditions or samples using the data generated from microarray or RNA sequencing experiments. This approach helps to determine which genes are upregulated or downregulated in response to a specific condition, such as a disease state or treatment, which facilitates understanding of the underlying molecular mechanisms of diseases (54). In this study we analyzed gene expression data from the scalps of 9 individuals with premature AGA and 10 normal volunteers from the GEO database profile GSE90594 to identify core genes associated with AGA (5). In Michel et al. (5) analysis report, the authors performed differential gene expression analysis on all 28 samples (14 alopecia and 14 normal samples) using ANOVA and Tukey’s post-hoc tests. After applying the Benjamini-Hochberg correction for multiple testing, they identified 333 DEGs consisting of 184 downregulated and 149 upregulated genes. The authors selected the DEGs using a cut-off of fold change ≥ ± 1.5 (log2FC ≥ ± 0.58) and p ≤ 0.05 for significance (5). In our analysis, we normalized the microarrays, removed the outlier samples, and performed the differential gene expression analysis using the single-channel design matrix provided in the limma package. We used Benjamini and Hochberg’s method to compute the adjusted p-values (FDR or q-value) and considered probes with q ≤ 0.05 to be significant. In our analysis, the fold change values of AGA-associated genes known to play a crucial role in disease pathology, such as AR (log2FC = 0.33), CTNNB1 (log2FC = −0.58), TGFB2 (log2FC = −0.58), and SRD5A2 (log2FC = 0.56) between the AGA patients and healthy group were lower. To thoroughly examine the pathology of AGA, we adopted a stringent criterion of log2FC ≥ ± 0.3 with a strict FDR value (q ≤ 0.05) and obtained 2,439 DEGs, taking into account that subtle differences in gene expression can have a significant biological impact and that some genes are more sensitive to changes in dosage (55, 56).
To shed light on the biological roles and processes associated with the 2,439 DEGs, we performed gene family enrichment, GO (biological process, molecular function, and cellular component) enrichment, and pathway enrichment analyses. Our results revealed that the down-regulated genes belonged to gene families such as keratins, keratin-associated proteins, frizzled receptors, Bone morphogenetic proteins, Wnt, and metallothioneins (Figure 2). The GO enrichment analysis indicated that these down-regulated genes play vital roles in the structural constituents of the skin epidermis, hair follicle development and hair cycle (Table 1). The pathway enrichment analysis showed that these down-regulated genes participate in the keratinization pathway (Table 2). On the other hand, the up-regulated genes were enriched for CD molecules, Immunoglobulin-like domains, Rho GTPase-activating proteins, receptor tyrosine kinases, minor histocompatibility antigens, and selenoproteins as the top gene families (Figure 2). The GO enrichment analysis also demonstrated that these up-regulated genes were involved in MHC protein complex binding, leukocyte activation, regulation of the immune response, and T-cell activation (Table 1). The pathway enrichment analysis found that the up-regulated genes participated in the innate and adaptive immune systems, cytokine signaling, and interferon signaling pathways (Table 2).
The identification of genetic variants associated with AGA is critical for understanding its etiology. In this study, we annotated the coordinates of AGA-associated genomic loci with our DEGs to identify the potential candidate genes contributing to AGA pathology. Our analysis identified several DEGs located within or near reported AGA risk loci such as MEMO1, SRD5A2, FOXL2NB, FGF5, DKK2, EBF1, IRF4, CENPW, and PAGE2. These findings support the existing knowledge of the association between these genes and AGA pathology. Furthermore, our analysis (Table 3) mapped several DEGs including HOXD9, LHPP, CRHR1, STH, and PAGE2B, which are of unknown significance in hair growth, with AGA risk loci in GWAS studies. These genes warrant further investigation. Moreover, the enrichment of many DEGs identified in our analysis within the 500 kb window of AGA risk loci revealed that the genes which have not yet been identified as AGA risk loci could play a critical role in AGA pathology.
In our analysis to identify specific sequence motifs or patterns in the promoter regions of the DEGs, we found several enriched motifs for the down-regulated genes, including those involved in the Wnt/β-catenin signaling pathway (LEF1), TGF-β signaling (SMAD2, SMAD3, and SMAD4), nervous system development (NeuroD1 and NeuroG2), development (HOXB13, HOXD10, HOXA13, HOXA11, HOXD11, and HOXD13), Jun/FOS family (JunB, Jun-AP1, AP-2 gamma, Fosl2, and AP-1), and FOX family (FOXK1, and Fox:Ebox). Among the down-regulated DEGs, we observed the presence of LEF1, SMAD6, SAMD7, HOXA3, HOXC13, FOXN1, FOXE1, and FOXI2. In contrast, the transcription factors such as NEUROD2, HOXD1, HOXD9, FOXL2, and FOXL2NB were up-regulated, confirming that the down-regulation of hair-related genes in AGA may be primarily due to the Wnt/β-catenin signaling component LEF1 (1).
Furthermore, our motif analysis revealed that the top motifs enriched for the up-regulated genes were those for immune system-related transcription factors, such as IRF1, IRF2, IRF3, IRF8, PRDM1, SPI-1 (PU.1), and SF1. Among the up-regulated DEGs, we observed the presence of several IRF family of transcription factors, including IRF1, IRF1-AS1, IRF4, IRF8, IRF9, and SPI. Specifically, IRF1 is critical for apoptosis and the target genes of IRF1 are responsible for apoptotic responses. IRF4 and IRF8 regulate myeloid cell development, while IRF9 mediates STAT1/STAT2 function in downstream signaling of type I IFN receptor signaling and is also involved in autoantibody production (35, 55). These findings suggest that these immune transcription factors may play a role in the up-regulation of immune response genes, implying a heightened immune system activity and immune response against hair growth cycle in the scalp in AGA. Taken together, our results provide further evidence that the genes for hair follicle development and hair cycle are down-regulated, while genes for immune response are up-regulated in the balding scalps of AGA.
The occurrence of inflammatory phenomena in AGA pathogenesis has been reported earlier, but the cause of the inflammation was unknown. Consequently, the role of inflammation in AGA was not heavily emphasized in the past (52, 57). Despite the general belief that scalp inflammation results in folliculitis, perifollicular fibrosis, and destructive scarring alopecia, studies have linked inflammation to male pattern baldness (55–57). Jaworsky et al. (58) discovered the presence of activated T-cell infiltrate in hair follicles and found that these infiltrates were associated with class II antigens. In 2001, Young et al. (56) discovered granular immunoglobulin M and C3 at the basement membrane, as well as porphyrins in the pilosebaceous canal in biopsy specimens from the bald scalps of AGA patients. They suggested that the local microbiologic flora and environmental factors like UV light could be responsible for the inflammatory reactions (56). Mahe et al. (59) proposed in a 2001 review that the inflammatory process associated with AGA be referred to as microinflammation in contrast to classical inflammatory process. Furthermore, the presence of peripilar signs around the hair follicle ostium, which reflect perifollicular inflammation, has established the presence of follicular microinflammation in AGA (60, 61). Despite these findings, the underlying biological reason, pathways, and genes involved in the inflammatory process of AGA have not yet been elucidated.
In order to deepen our understanding of the inflammatory mechanisms in AGA, we constructed gene interaction networks using the DEGs identified in our study. The Cytoscape plugins StringApp and ReactomeFIplugin were utilized to construct the PPI and FI networks, respectively. The DEGS in the PPI network were connected based on their protein-protein interactions obtained from the STRING database, while the DEGs in the FI network were linked based on their involvement in signaling pathways from the Reactome database. The integrated tools within the Cytoscape StringApp and ReactomeFI plugins were utilized to perform GO and pathway enrichment analyses for both networks. The results were consistent with our previous GO, pathway, and motif enrichment analyses. In addition, a Cytohubba analysis was conducted to identify the hub genes of the biological networks. The hub genes were sorted based on their occurrence in more than one algorithm used in the analysis. As a result, 15 genes (LYN, HLA-A, STAT3, NRAS, CTNNB1, PSMB8, HLA-F, HLA-E, IRF4, LCK, PTPN6, STAT5A, VAV1, EGF, and ITGAM) were identified as key hub genes in the PPI network. Similarly, 19 genes (LCK, LYN, BTK, CTNNB1, GNAI3, NRAS, PIK3CD, PTPN6, SPI1, STAT3, STAT5A, VAV1, EGF, ESR1, HCK, ITGB7, LCP2, PDGFRB, and RAC2) were recognized as key hub genes in the FI network as they were consistently identified across multiple algorithms.
To explore the connections between hub genes and DEGs exhibiting log2FC > | 1|, we performed reactome pathway enrichment analysis using the ClueGo plugin in Cytoscape (53). The analysis revealed that the hub genes were strongly associated with several important pathways related to immune system functions including interferon signaling, cytokine signaling, GPVI-mediated activation cascade, PI3K/AKT signaling, and signaling by receptor tyrosine kinases (Figure 6). Interestingly, recent research has linked the activation of the PI3K/Akt pathway with the apoptosis of hair follicle stem cell (HFSC) mediated by 5α-DHT in AGA (62, 63). Furthermore, the ClueGo network (Figure 6) showed that several genes including the hub genes PSMB8, SPI1, STAT3, PIK3CD, NRAS, CTNNB1, and LEF1 connect the keratinization process with inflammatory process terms suggesting that AGA is driven by a complex interplay between various molecular pathways involving immune system dysregulation and abnormal keratinization.
A significant number of the up-regulated hub genes identified in our study such as PTPN6, LCK, LCP2, LYN, HCK, VAV1, STAT3, BTK, and STAT5A belong to the Src Homology 2 (SH2) domain gene family. This group of genes encodes proteins containing SH2 domains, which can recognize and bind to phosphorylated tyrosine residues in other proteins. SH2 domain-containing proteins participate in signal transduction pathways serving as adapter molecules linking tyrosine phosphorylation events to downstream signaling pathways (64). Further of the four non-receptor tyrosine kinase hub genes (BTK, HCK, LCK and LYN), three genes namely HCK, LCK, and LYN belong to the Src family of protein tyrosine kinases (65). Recent studies have highlighted the potential role of Src tyrosine kinase in hair growth. One study found that Src inhibition promotes melanogenesis, leading to the production of hair color pigment melanin (66). In another study the flavonoid quercitrin was shown to stimulate hair growth in cultured DPCs by activating several signal transduction elements, including receptor tyrosine kinases and non-receptor tyrosine kinases. Specifically, Src family proteins such as CSK, FRK, HCK, and SRMS, which were not differentially expressed in our analysis, were found to be activated by quercitrin while promoting the hair growth (67). Additionally, recent researches have shown that Src tyrosine kinase can cross-talk with Wnt signaling (65) and with androgen receptor (AR) signaling (66) suggesting a potential interplay between Src tyrosine kinase and androgen-DHT and Wnt/β-catenin signaling in the balding scalps of AGA. Therefore, we suggest that further investigation into the potential interactions between Src tyrosine kinase family genes, AR-5α-DHT, Wnt/β-catenin signaling, and the inflammatory response is needed to gain a more comprehensive understanding of AGA pathogenesis.
The Hair follicle is a fascinating mini-organ that continuously undergoes cycles of growth (anagen), regression (catagen), resting (telogen), and shedding (exogen). This process is regulated by a number of signaling cascades, including Wnt/β-catenin, Sonic Hedgehog (SHH), bone morphogenetic protein (BMP), notch, transforming growth factor β (TGF-β), NF-κB, and fibroblast growth factors (FGFs), which coordinate communication between the epithelial and mesenchymal cells in the hair follicle (68). Although it is well-known that androgen 5α-DHT modulates the Wnt/β-catenin signaling pathway in DPCs and inhibits the transcription of hair growth genes in AGA, less is known about the behavior of other hair growth signaling pathways in AGA (1). In this study, we identified several DEGs involved in Wnt/β-catenin, NF-κB, TGF-β, BMP, and Vitamin D metabolism signaling pathways more than the original analysis by Michel et al. (5) (Supplementary I-3). Our network analysis also identified core genes that could further elucidate the pathogenesis of AGA, with a focus on the upregulated inflammatory response.
Conclusively, to gain a better understanding of the pathogenesis of AGA a schematic model of 5α-DHT mediated AGA in DPCs including the Wnt/β-catenin signaling pathway and the up-regulated inflammatory process is proposed in Figure 7. The nuclear factor associated with T cells (NFAT) family of transcription factors controls the expression of proinflammatory genes. The Calcineurin-NFAT signaling pathway regulates the immune system and inflammatory response (69–71). The NFAT and Wnt pathways are shown to reciprocally regulate each other constituting a non-canonical Wnt/Ca2 + /NFAT pathway in certain cells and tissues for coordinating their effects on cell growth and differentiation (71, 72). In addition, Src tyrosine kinase gene LCK are shown to interact with calcineurin and NFAT promoting NFAT activity (70, 73–75). Also the Src tyrosine kinase genes such as LCK and LYN promotes cytosolic accumulation of Ca2+ which activates calcineurin (76). In the non-canonical Wnt/Ca2+ signaling pathway calcineurin and NFAT acts downstream, but our analysis shown that the genes coding them are upregulated and the genes in the up-stream of the pathway are down-regulated. Given that the Src tyrosine kinases cross-talk with Wnt signaling and that increased activity of Src is seen during aberrant Wnt signaling in many diseases (77), we suggest that Src-tyrosine kinases may cross-talk with the androgen 5α-DHT modulated Wnt Signaling pathway and promote inflammatory response. Therefore, further investigation into the potential interactions between Src tyrosine kinase family genes, AR-5α-DHT, Wnt/β-catenin signaling, and the inflammatory response is needed to gain a more comprehensive understanding of AGA pathogenesis.
FIGURE 7
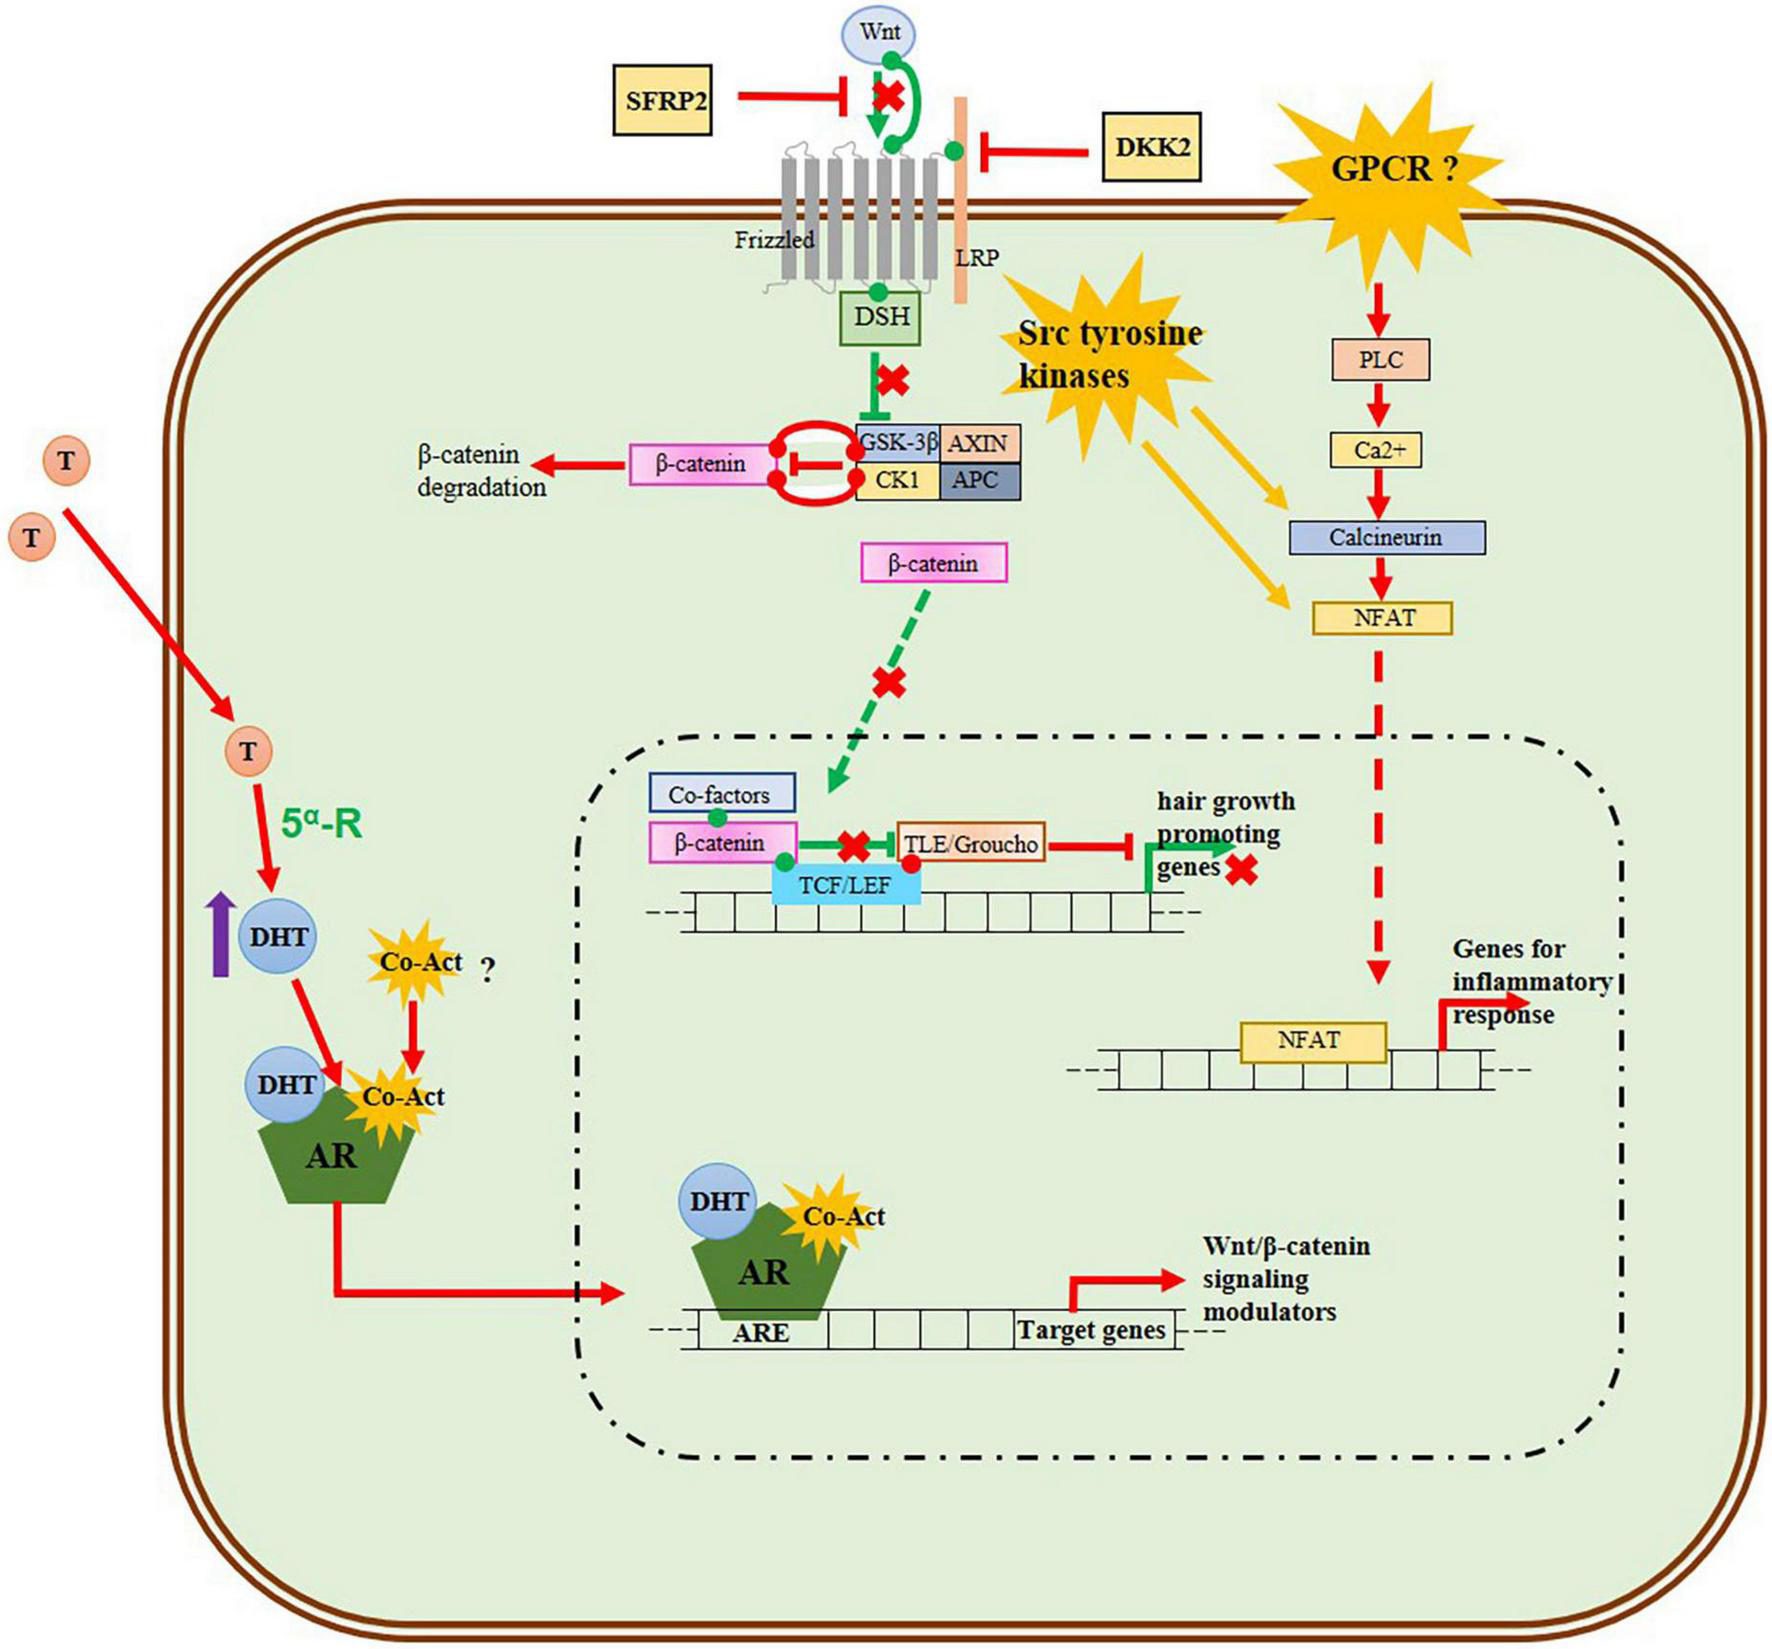
Schematic model of 5α-DHT mediated AGA in DPCs including Wnt/β-catenin signaling pathway and up-regulated inflammatory process. The green lines and arrows represent the normal activated Wnt/β-catenin signaling in the DPCs of normal-haired scalp, while the red lines and arrows denote the behavior of signaling pathways in the DPCs of balding scalp. The androgen 5α-DHT-AR complex inhibits the Wnt signaling by transcribing Wnt/β-catenin inhibitors. In our analysis genes for frizzled receptor, Wnt ligands (Wnt2b, Wnt3, Wnt5a, Wnt10b, and Wnt11), beta-catenin, LEF, and TCF are down-regulated, while the Wnt inhibitors DKK2 and SFRP2 are upregulated implying the downregulation of the normal Wnt/β-signaling pathway in AGA. The genes for phospholipase, calcineurin, and NFAT which function downstream of the non-canonical Wnt/Calcium pathway are upregulated, while the Wnt ligand for this pathway Wnt5a and frizzled receptor in the upstream are down-regulated. We propose that Src tyrosine kinase, known to interact with phospholipase and calcineurin, may activate this Wnt/Calcium pathway pathway and this needs further investigation. In addition, other Wnt ligands such as Wnt3a, Wnt4, and Wnt16 are up-regulated in our analysis and these ligands or some GPCR receptors may play a role in the activation of Wnt/calcium signaling pathway and mediate the up-regulation of NFAT which transcribes inflammatory process genes.
Conclusion
Differential gene expression analysis is a powerful technique for identifying genes associated with specific conditions such as AGA. In this study, we analyzed the gene expression data from the scalps of individuals with premature AGA and normal volunteers to identify core genes associated with AGA. We identified 2,439 DEGs using a stringent criterion of log2FC ≥ ± 0.3 with a strict FDR value and performed gene family enrichment, GO enrichment, pathway enrichment, and motif analysis for the DEGs. Our findings indicate that down-regulated genes in AGA play significant roles in the structural makeup of the skin epidermis, hair follicle development, and hair cycle, while up-regulated genes are implicated in the innate and adaptive immune systems, cytokine signaling, and interferon signaling pathways. Moreover, we identified potential candidate genes that may contribute to AGA pathology and require further investigation. Our study also highlights the critical role of Src family tyrosine kinases in AGA pathology. Overall, this study enhances our understanding of the underlying molecular mechanisms of AGA and may lead to the development of new therapeutic strategies for treating this condition.
Statements
Data availability statement
The datasets presented in this study can be found in online repositories. The names of the repository/repositories and accession number(s) can be found in the article/Supplementary material.
Author contributions
AP: conceptualization, design of study, analysis and interpretation of data, and writting the manuscript. BR: conceiving and supervising the study and reviewing the manuscript. Both authors contributed to the article and approved the submitted version.
Funding
AP acknowledges the financial support provided through the Senior Research Fellowship by the Council of Scientific and Industrial Research, New Delhi, India [Award no. 09/844(0045)2017-EMR-I].
Acknowledgments
The authors acknowledge the Vellore Institute of Technology, Vellore, India for providing the computational facilities.
Conflict of interest
The authors declare that the research was conducted in the absence of any commercial or financial relationships that could be construed as a potential conflict of interest.
Publisher’s note
All claims expressed in this article are solely those of the authors and do not necessarily represent those of their affiliated organizations, or those of the publisher, the editors and the reviewers. Any product that may be evaluated in this article, or claim that may be made by its manufacturer, is not guaranteed or endorsed by the publisher.
Supplementary material
The Supplementary Material for this article can be found online at: https://www.frontiersin.org/articles/10.3389/fmed.2023.1108358/full#supplementary-material
References
1.
Premanand A Reena Rajkumari B . Androgen modulation of Wnt/β-catenin signaling in androgenetic alopecia.Arch Dermatol Res. (2018) 310:391–9. 10.1007/s00403-018-1826-8
2.
Heilmann-Heimbach S Hochfeld L Paus R Nöthen M . Hunting the genes in male-pattern alopecia: how important are they, how close are we and what will they tell us?Exp Dermatol. (2016) 25:251–7. 10.1111/exd.12965
3.
Premanand A Rajkumari B . In silico analysis of gene expression data from bald frontal and haired occipital scalp to identify candidate genes in male androgenetic alopecia.Arch Dermatol Res. (2019) 311:815–24. 10.1007/s00403-019-01973-2
4.
Jain R De-Eknamkul W . Potential targets in the discovery of new hair growth promoters for androgenic alopecia.Expert Opin Ther Targets. (2014) 18:787–806. 10.1517/14728222.2014.922956
5.
Michel L Reygagne P Benech P Jean-Louis F Scalvino S Ly Ka So S et al Study of gene expression alteration in male androgenetic alopecia: evidence of predominant molecular signalling pathways. Br J Dermatol. (2017) 177:1322–36. 10.1111/bjd.15577
6.
Barrett T Wilhite S Ledoux P Evangelista C Kim I Tomashevsky M et al NCBI GEO: archive for functional genomics data sets–update. Nucleic Acids Res. (2013) 41:D991–5. 10.1093/nar/gks1193
7.
Ritchie M Phipson B Wu D Hu Y Law C Shi W et al limma powers differential expression analyses for RNA-sequencing and microarray studies. Nucleic Acids Res. (2015) 43:e47. 10.1093/nar/gkv007
8.
Benjamini Y Hochberg Y . Controlling the false discovery rate: a practical and powerful approach to multiple testing.J R Stat Soc Ser B. (1995) 57:289–300.
9.
Chen J Bardes E Aronow B Jegga A . ToppGene Suite for gene list enrichment analysis and candidate gene prioritization.Nucleic Acids Res. (2009) 37:W305–11. 10.1093/nar/gkp427
10.
Xu Q Fu R Yin G Liu X Liu Y Xiang M . Microarray-based gene expression profiling reveals genes and pathways involved in the oncogenic function of REG3A on pancreatic cancer cells.Gene. (2016) 578:263–73. 10.1016/j.gene.2015.12.039
11.
Richards J Yuan X Geller F Waterworth D Bataille V Glass D et al Male-pattern baldness susceptibility locus at 20p11. Nat Genet. (2008) 40:1282–4. 10.1038/ng.255
12.
Hillmer A Brockschmidt F Hanneken S Eigelshoven S Steffens M Flaquer A et al Susceptibility variants for male-pattern baldness on chromosome 20p11. Nat Genet. (2008) 40:1279–81. 10.1038/ng.228
13.
Li R Brockschmidt F Kiefer A Stefansson H Nyholt D Song K et al Six novel susceptibility Loci for early-onset androgenetic alopecia and their unexpected association with common diseases. PLoS Genet. (2012) 8:e1002746. 10.1371/journal.pgen.1002746
14.
Brockschmidt F Heilmann S Ellis J Eigelshoven S Hanneken S Herold C et al Susceptibility variants on chromosome 7p21.1 suggest HDAC9 as a new candidate gene for male-pattern baldness. Br J Dermatol. (2011) 165:1293–302. 10.1111/j.1365-2133.2011.10708.x
15.
Pirastu N Joshi P de Vries P Cornelis M McKeigue P Keum N et al GWAS for male-pattern baldness identifies 71 susceptibility loci explaining 38% of the risk. Nat Commun. (2017) 8:1584. 10.1038/s41467-017-01490-8
16.
Jiang L Zheng Z Fang H Yang J . A generalized linear mixed model association tool for biobank-scale data.Nat Genet. (2021) 53:1616–21. 10.1038/s41588-021-00954-4
17.
Pickrell J Berisa T Liu J Ségurel L Tung J Hinds D . Detection and interpretation of shared genetic influences on 42 human traits.Nat Genet. (2016) 48:709–17. 10.1038/ng.3570
18.
Quinlan AR . BEDTools: the swiss-army tool for genome feature analysis. Curr Protoc Bioinformatics. (2014) 47:1–34. 10.1002/0471250953.bi1112s47
19.
Chew E Tan J Bahta A Ho B Liu X Lim T et al Differential expression between human dermal papilla cells from balding and non-balding scalps reveals new candidate genes for androgenetic alopecia. J Invest Dermatol. (2016) 136:1559–67. 10.1016/j.jid.2016.03.032
20.
Heinz S Benner C Spann N Bertolino E Lin Y Laslo P et al Simple combinations of lineage-determining transcription factors prime cis-regulatory elements required for macrophage and B cell identities. Mol Cell. (2010) 38:576–89. 10.1016/j.molcel.2010.05.004
21.
Szklarczyk D Morris J Cook H Kuhn M Wyder S Simonovic M et al The STRING database in 2017: quality-controlled protein-protein association networks, made broadly accessible. Nucleic Acids Res. (2017) 45:D362–8. 10.1093/nar/gkw937
22.
Shannon P Markiel A Ozier O Baliga NS Wang JT Ramage D et al Cytoscape: a software environment for integrated models of biomolecular interaction networks. Genome Res. (2003) 13:2498–504. 10.1101/gr.1239303
23.
Wu G Dawson E Duong A Haw R Stein L . ReactomeFIViz: a Cytoscape app for pathway and network-based data analysis.F1000Res. (2014) 3:146. 10.12688/f1000research.4431.2
24.
Wu G Haw R . Functional interaction network construction and analysis for disease discovery.Methods Mol Biol. (2017) 1558:235–53. 10.1007/978-1-4939-6783-4_11
25.
Croft D Mundo A Haw R Milacic M Weiser J Wu G et al The Reactome pathway knowledgebase. Nucleic Acids Res. (2014) 42:D472–7. 10.1093/nar/gkt1102
26.
Fabregat A Sidiropoulos K Garapati P Gillespie M Hausmann K Haw R et al The Reactome pathway Knowledgebase. Nucleic Acids Res. (2016) 44:D481–7. 10.1093/nar/gkv1351
27.
Assenov Y Ramírez F Schelhorn S Lengauer T Albrecht M . Computing topological parameters of biological networks.Bioinformatics. (2008) 24:282–4. 10.1093/bioinformatics/btm554
28.
Chin C Chen S Wu H Ho C Ko M Lin C . cytoHubba: identifying hub objects and sub-networks from complex interactome.BMC Syst Biol. (2014) 8 (Suppl 4):S11. 10.1186/1752-0509-8-S4-S11
29.
Bader G Hogue C . An automated method for finding molecular complexes in large protein interaction networks.BMC Bioinformatics. (2003) 4:2. 10.1186/1471-2105-4-2
30.
Wu T Hu E Xu S Chen M Guo P Dai Z et al clusterProfiler 4.0: a universal enrichment tool for interpreting omics data. Innovation (Camb). (2021) 2:100141. 10.1016/j.xinn.2021.100141
31.
Zhang Y Yu J Shi C Huang Y Wang Y Yang T et al Lef1 contributes to the differentiation of bulge stem cells by nuclear translocation and cross-talk with the Notch signaling pathway. Int J Med Sci. (2013) 10:738–46. 10.7150/ijms.5693
32.
Kömüves L Ma X Stelnicki E Rozenfeld S Oda Y Largman C . HOXB13 homeodomain protein is cytoplasmic throughout fetal skin development.Dev Dyn. (2003) 227:192–202. 10.1002/dvdy.10290
33.
Jefferies C . Regulating IRFs in IFN driven disease.Front Immunol. (2019) 10:325. 10.3389/fimmu.2019.00325
34.
Pruitt K Tatusova T Klimke W Maglott D . NCBI reference sequences: current status, policy and new initiatives.Nucleic Acids Res. (2009) 37:D32–6. 10.1093/nar/gkn721
35.
Nusse R Clevers H . Wnt/β-Catenin signaling, disease, and emerging therapeutic modalities.Cell. (2017) 169:985–99. 10.1016/j.cell.2017.05.016
36.
Ulmert I Henriques-Oliveira L Pereira C Lahl K . Mononuclear phagocyte regulation by the transcription factor Blimp-1 in health and disease.Immunology. (2020) 161:303–13. 10.1111/imm.13249
37.
Gupta P Gurudutta G Saluja D Tripathi R . PU.1 and partners: regulation of haematopoietic stem cell fate in normal and malignant haematopoiesis.J Cell Mol Med. (2009) 13:4349–63. 10.1111/j.1582-4934.2009.00757.x
38.
Soundararajan M Willard F Kimple A Turnbull A Ball L Schoch G et al Structural diversity in the RGS domain and its interaction with heterotrimeric G protein alpha-subunits. Proc Natl Acad Sci U.S.A. (2008) 105:6457–62. 10.1073/pnas.0801508105
39.
Miranda M Avila I Esparza J Shwartz Y Hsu Y Berdeaux R et al Defining a role for G-protein coupled receptor/cAMP/CRE-binding protein signaling in hair follicle stem cell activation. J Invest Dermatol. (2022) 142:53–64.e3. 10.1016/j.jid.2021.05.031
40.
Pedro M Lund K Iglesias-Bartolome R . The landscape of GPCR signaling in the regulation of epidermal stem cell fate and skin homeostasis.Stem Cells. (2020) 38:1520–31. 10.1002/stem.3273
41.
Pasternack S von Kügelgen I Al Aboud K Lee Y Rüschendorf F Voss K et al G protein-coupled receptor P2Y5 and its ligand LPA are involved in maintenance of human hair growth. Nat Genet. (2008) 40:329–34. 10.1038/ng.84
42.
O’Leary N Wright M Brister J Ciufo S Haddad D McVeigh R et al Reference sequence (RefSeq) database at NCBI: current status, taxonomic expansion, and functional annotation. Nucleic Acids Res. (2016) 44:D733–45. 10.1093/nar/gkv1189
43.
Mak K Chan S . Epidermal growth factor as a biologic switch in hair growth cycle.J Biol Chem. (2003) 278:26120–6. 10.1074/jbc.M212082200
44.
Zhang H Nan W Wang S Zhang T Si H Yang F et al Epidermal growth factor promotes proliferation and migration of follicular outer root sheath cells via Wnt/β-Catenin Signaling. Cell Physiol Biochem. (2016) 39:360–70. 10.1159/000445630
45.
Ramírez-Marín H Tosti A . Evaluating the therapeutic potential of ritlecitinib for the treatment of alopecia areata.Drug Des Devel Ther. (2022) 16:363–74. 10.2147/DDDT.S334727
46.
Pruitt K Tatusova T Brown G Maglott D . NCBI reference sequences (RefSeq): current status, new features and genome annotation policy.Nucleic Acids Res. (2012) 40:D130–5. 10.1093/nar/gkr1079
47.
Nesterovitch A Gyorfy Z Hoffman M Moore E Elbuluk N Tryniszewska B et al Alteration in the gene encoding protein tyrosine phosphatase nonreceptor type 6 (PTPN6/SHP1) may contribute to neutrophilic dermatoses. Am J Pathol. (2011) 178:1434–41. 10.1016/j.ajpath.2010.12.035
48.
Miyauchi K Ki S Ukai M Suzuki Y Inoue K Suda W et al Essential role of STAT3 signaling in hair follicle homeostasis. Front Immunol. (2021) 12:663177. 10.3389/fimmu.2021.663177
49.
Kitamura A Maekawa Y Uehara H Izumi K Kawachi I Nishizawa M et al A mutation in the immunoproteasome subunit PSMB8 causes autoinflammation and lipodystrophy in humans. J Clin Invest. (2011) 121:4150–60. 10.1172/JCI58414
50.
Redler S Tazi-Ahnini R Drichel D Birch M Brockschmidt F Dobson K et al Selected variants of the steroid-5-alpha-reductase isoforms SRD5A1 and SRD5A2 and the sex steroid hormone receptors ESR1, ESR2 and PGR: no association with female pattern hair loss identified. Exp Dermatol. (2012) 21:390–3. 10.1111/j.1600-0625.2012.01469.x
51.
Choi N Kim W Oh S Sung J . HB-EGF improves the hair regenerative potential of adipose-derived stem cells via ROS generation and Hck phosphorylation.Int J Mol Sci. (2019) 21:122. 10.3390/ijms21010122
52.
Lattanand A Johnson W . Male pattern alopecia a histopathologic and histochemical study.J Cutan Pathol. (1975) 2:58–70. 10.1111/j.1600-0560.1975.tb00209.x
53.
Bindea G Mlecnik B Hackl H Charoentong P Tosolini M Kirilovsky A et al ClueGO: a Cytoscape plug-in to decipher functionally grouped gene ontology and pathway annotation networks. Bioinformatics. (2009) 25:1091–3. 10.1093/bioinformatics/btp101[Epub ahead of print].
54.
Udhaya Kumar S Thirumal Kumar D Siva R George Priya Doss C Younes S Younes N et al Dysregulation of signaling pathways due to differentially expressed genes from the B-cell transcriptomes of systemic lupus erythematosus patients – A bioinformatics approach. Front Bioeng Biotechnol. (2020) 8:276. 10.3389/fbioe.2020.00276
55.
Abell E . Pathology of male pattern alopecia.Arch Dermatol. (1984) 120:1607–8.
56.
Young J Conte E Leavitt M Nafz M Schroeter A . Cutaneous immunopathology of androgenetic alopecia.J Am Osteopath Assoc. (1991) 91:765–71.
57.
Kligman A . The comparative histopathology of male-pattern baldness and senescent baldness.Clin Dermatol. (1988) 6:108–18. 10.1016/0738-081x(88)90074-0
58.
Jaworsky C Kligman A Murphy G . Characterization of inflammatory infiltrates in male pattern alopecia: implications for pathogenesis.Br J Dermatol. (1992) 127:239–46. 10.1111/j.1365-2133.1992.tb00121.x
59.
Mahé Y Michelet J Billoni N Jarrousse F Buan B Commo S et al Androgenetic alopecia and microinflammation. Int J Dermatol. (2000) 39:576–84. 10.1046/j.1365-4362.2000.00612.x
60.
Deloche C de Lacharrière O Misciali C Piraccini B Vincenzi C Bastien P et al Histological features of peripilar signs associated with androgenetic alopecia. Arch Dermatol Res. (2004) 295:422–8. 10.1007/s00403-003-0447-y
61.
Jain N Doshi B Khopkar U . Trichoscopy in alopecias: diagnosis simplified.Int J Trichol. (2013) 5:170–8. 10.4103/0974-7753.130385
62.
Zhang X Zhou D Ma T Liu Q . Vascular endothelial growth factor protects CD200-rich and CD34-positive hair follicle stem cells against androgen-induced apoptosis through the phosphoinositide 3-Kinase/Akt pathway in patients with androgenic alopecia.Dermatol Surg. (2020) 46:358–68. 10.1097/DSS.0000000000002091
63.
Teng Y Fan Y Ma J Lu W Liu N Chen Y et al The PI3K/Akt pathway: emerging roles in skin homeostasis and a group of non-malignant skin disorders. Cells. (2021) 10:1219. 10.3390/cells10051219
64.
Sudol M . From Src homology domains to other signaling modules: proposal of the ‘protein recognition code’.Oncogene. (1998) 17:1469–74. 10.1038/sj.onc.1202182
65.
Filippakopoulos P Müller S Knapp S . SH2 domains: modulators of nonreceptor tyrosine kinase activity.Curr Opin Struct Biol. (2009) 19:643–9. 10.1016/j.sbi.2009.10.001
66.
Ku K Choi N Oh S Kim W Suh W Sung J . Src inhibition induces melanogenesis in human G361 cells.Mol Med Rep. (2019) 19:3061–70. 10.3892/mmr.2019.9958
67.
Kim J Kim S Choi Y Shin J Kim C Kang N et al Quercitrin stimulates hair growth with enhanced expression of growth factors via activation of MAPK/CREB signaling pathway. Molecules. (2020) 25:4004. 10.3390/molecules25174004
68.
Rishikaysh P Dev K Diaz D Qureshi W Filip S Mokry J . Signaling involved in hair follicle morphogenesis and development.Int J Mol Sci. (2014) 15:1647–70. 10.3390/ijms15011647
69.
Minematsu H Shin M Celil Aydemir A Kim K Nizami S Chung G et al Nuclear presence of nuclear factor of activated T cells (NFAT) c3 and c4 is required for Toll-like receptor-activated innate inflammatory response of monocytes/macrophages. Cell Signal. (2011) 23:1785–93. 10.1016/j.cellsig.2011.06.013
70.
Otsuka S Melis N Gaida M Dutta D Weigert R Ashwell J . Calcineurin inhibitors suppress acute graft-versus-host disease via NFAT-independent inhibition of T cell receptor signaling.J Clin Invest. (2021) 131:e147683. 10.1172/JCI147683
71.
Pan M Xiong Y Chen F . NFAT gene family in inflammation and cancer.Curr Mol Med. (2013) 13:543–54. 10.2174/1566524011313040007
72.
De A . Wnt/Ca2+ signaling pathway: a brief overview.Acta Biochim Biophys Sin (Shanghai). (2011) 43:745–56. 10.1093/abbs/gmr079
73.
Li Q Sun X Wu J Lin Z Luo Y . PKD2 interacts with Lck and regulates NFAT activity in T cells.BMB Rep. (2009) 42:35–40. 10.5483/bmbrep.2009.42.1.035
74.
Carter N Pomerantz J . Calcineurin inhibitors target Lck activation in graft-versus-host disease.J Clin Invest. (2021) 131:e149934. 10.1172/JCI149934
75.
Baer A Colon-Moran W Xiang J Stapleton J Bhattarai N . Src-family kinases negatively regulate NFAT signaling in resting human T cells.PLoS One. (2017) 12:e0187123. 10.1371/journal.pone.0187123
76.
Anguita E Villalobo A . Src-family tyrosine kinases and the Ca2+ signal.Biochim Biophys Acta Mol Cell Res. (2017) 1864:915–32. 10.1016/j.bbamcr.2016.10.022
77.
Min J Park H Lee Y Kim J Kim J Park J . Cross-talk between Wnt signaling and src tyrosine kinase.Biomedicines. (2022) 10:1112. 10.3390/biomedicines10051112
Summary
Keywords
androgenetic alopecia, differential gene expression analysis, reactome functional interaction network, STRING protein-protein interaction network, gene ontology, motif analysis, Wnt/β-catenin signaling, Src family protein tyrosine kinases
Citation
Premanand A and Reena Rajkumari B (2023) Bioinformatic analysis of gene expression data reveals Src family protein tyrosine kinases as key players in androgenetic alopecia. Front. Med. 10:1108358. doi: 10.3389/fmed.2023.1108358
Received
25 November 2022
Accepted
22 March 2023
Published
09 June 2023
Volume
10 - 2023
Edited by
Balu Kamaraj, Imam Abdulrahman Bin Faisal University, Saudi Arabia
Reviewed by
Animesh A. Sinha, University at Buffalo, United States; Majji Rambabu, REVA University, India
Updates
Copyright
© 2023 Premanand and Reena Rajkumari.
This is an open-access article distributed under the terms of the Creative Commons Attribution License (CC BY). The use, distribution or reproduction in other forums is permitted, provided the original author(s) and the copyright owner(s) are credited and that the original publication in this journal is cited, in accordance with accepted academic practice. No use, distribution or reproduction is permitted which does not comply with these terms.
*Correspondence: Baskaran Reena Rajkumari, b.reenarajkumari@vit.ac.in
†ORCID: Adaikalasamy Premanand, orcid.org/0000-0002-8093-9864; Baskaran Reena Rajkumari, orcid.org/0000-0002-2467-4080
This article was submitted to Precision Medicine, a section of the journal Frontiers in Medicine
Disclaimer
All claims expressed in this article are solely those of the authors and do not necessarily represent those of their affiliated organizations, or those of the publisher, the editors and the reviewers. Any product that may be evaluated in this article or claim that may be made by its manufacturer is not guaranteed or endorsed by the publisher.