Abstract
Introduction:
This study aimed to examine the foveal stereo deviations in the different ectopic inner foveal layer (EIFL) stages of idiopathic epiretinal membrane (iERM) and assess its predictive utility for the baseline and postoperative best-corrected visual acuity (BCVA).
Methods:
Based on the calculational combination of foveal displacements in the horizontal and vertical axial optical coherence tomography (OCT) images, the foveal stereotaxic displacement was estimated through the total distance (TD, the distance from the foveal bottom to the inner edge of displaced central foveal) and horizontal distance (HD, projection of the TD in the retinal plane). The preoperative TD, HD, and other OCT- and OCT angiography (OCTA)-related indicators were obtained. The correlations between structural parameters and baseline and postoperative BCVA were evaluated through correlation and multiple linear regression analyses.
Results:
In patients with advanced EIFL stage, there was a significant increase in the HD, TD, baseline log of the minimum angle of resolution unit for BCVA, central macular thickness (CMT), acircularity index, and incidence of microcystic macular edema (MME; p < 0.05). Further, they showed a decreased foveal avascular zone (FAZ) area and perimeter (p < 0.001). HD, TD, CMT, MME, FAZ area, and FAZ perimeter were significantly correlated with the baseline and postoperative BCVA (p < 0.05). TD had the highest correlation indexic and was an individual predictor of the baseline and postoperative BCVA. Moreover, FD-300 and MME were individual predictors of postoperative BCVA.
Discussion:
Stereoscopic foveal deviations significantly correlated with the baseline and postoperative visual acuity. TD may be used as an independent prognostic factor for BCVA.
1. Introduction
Idiopathic epiretinal membrane (iERM) is a common macular disease with unknown etiology. It is characterized by abnormal fibroblast proliferation on the inner macular surface; moreover, it is commonly observed in older individuals (1, 2). The contraction characteristics of iERM can cause anatomical destruction and stratified changes, which results in visual impairment, metamorphopsia, and aniseikonia as the main symptoms (3, 4). Surgical pars plana vitrectomy (PPV) with iERM peeling is the standardized procedure for releasing retinal traction and enhancing retinal repair. However, there are some cases of insufficient anatomical and functional recovery even after successful surgery without significant complications (5–7). Therefore, it is important to predict the probability of postoperative visual recovery and to determine the timing of surgery.
There has been increasing interest in central macular thickness (CMT) and ectopic inner foveal layer (EIFL), which primarily react to retinal alterations caused by vertical iERM traction (6, 8–11). However, iERM contraction or shrinkage can cause foveal displacement. This can result in the loss of light dispersion due to vessel displacement (12), and light propagation anomalies due to muller cell deformation (13–15). Daiki et al. (16) proposed tangential displacement as a parameter for characterizing tangential morphological alterations in the outer retina. They reported that the horizontal and vertical metamorphopsia scores were positively correlated with the absolute values of the vertical and horizontal tangential displacement, respectively.
Given that foveal thickening and deviating under iERM traction is a three-dimensional problem, analysis through appropriate geometry methods is necessary. To further elucidate the pathogenesis of visual impairment, we calculated the horizontal distance (HD) and total distance (TD) in iERM using horizontal and vertical B-scan images from the bottom of the central fovea to the innermost vertex of the central fovea. Further, we analyzed the correlations of HD and TD with baseline and postoperative visual acuities.
2. Materials and methods
2.1. Study participants
This retrospective study included patients diagnosed with iERM between November 2018 and March 2021 at Eye Hospital of Wenzhou Medical University. The iERM was defined as the pathologic fibrocellular membrane that lies immediately superjacent to the inner surface of the retina, excluding cause of secondary epiretinal membrane (4). Inclusion criteria were (1) aged ≥ 45 years; (2) eyes with surgery underwent the 23-gauge standard 3-port PPV that included peeling of the ERM and internal limiting membrane (ILM) and combined cataract surgery. The exclusion criteria were as follows: (1) any other intraocular disease, including diabetic retinopathy, age-related macular degeneration, or hypertensive retinopathy; (2) any history of vitreoretinal surgery; (3) axial length > 26 mm or the presence of myopia of > −6 diopters; and (4) media opacities that prevented good fundus visualization. The study procedures conformed to the tenets of the Declaration of Helsinki (Research Ethics Approval Code: 2019168K160).
2.2. Surgical procedures
Using 0.025% indocyanine green dye staining and a minimal intraoperative exposure time, the iERM was peeled as much as possible and internal limiting membrane were removed from an area around the macula circa 3–4-disc diameter large. Cases without cataract surgery or followed up for less than 11 months would be excluded from the postoperative analysis. Baseline data were obtained from all the initial participants to rule out the presence of selection bias.
2.3. Examination
All patients underwent Spectralis spectral domain–optical coherence tomography (SD-OCT; Heidelberg Engineering GmbH, Heidelberg, Germany) at baseline. Single line B-scans in the horizontal and vertical axial were performed centered at the bottom of the central fovea (Figure 1). Based on the OCT measurements, we calculated the following indexes to determine the foveal stereotaxic displacement. TD reflected the distance from the foveal bottom to the displaced central foveal edge, HD was projection of the TD in the retinal plane and reflected the offset distances in the horizontal plane.
Figure 1
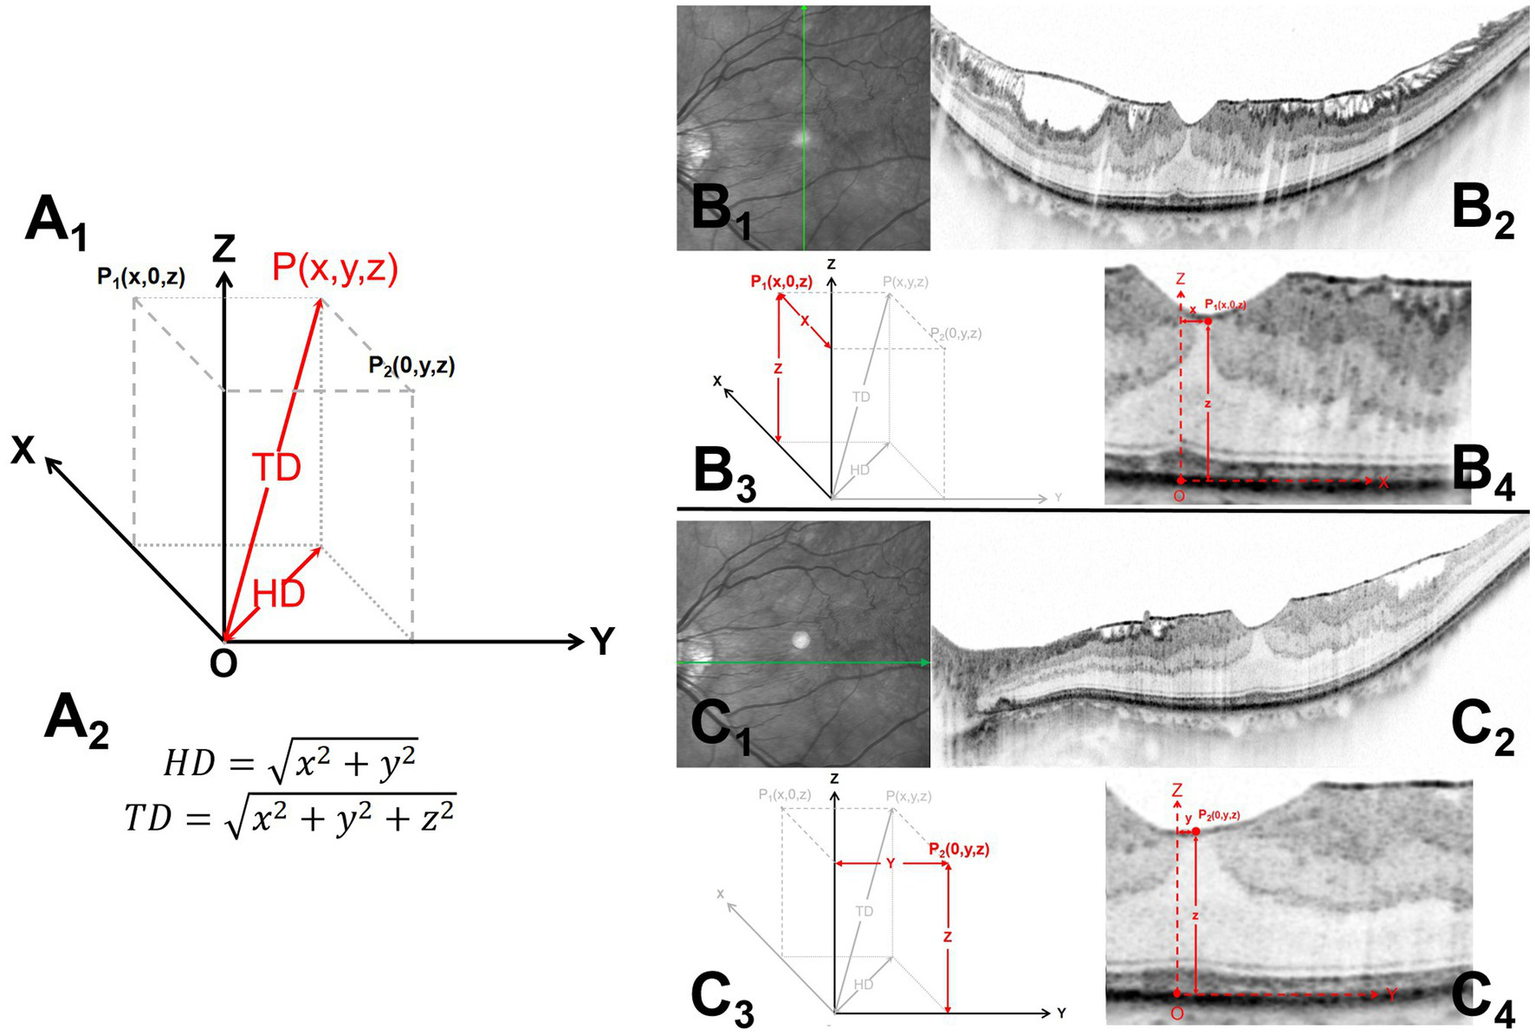
Measurements of the horizontal distance (HD) and total distance (TD) of the foveal stereo deviations on the B-scan images. Al and A2 illustrate the schematic diagram and formula (Pl and P2) for the TD and HD of the foveal stereo deviations obtained from the horizontal and vertical axial B-scan images. B1-4 and C1-4 demonstrate the methods for obtaining Pl and P2, respectively. Bl and Cl indicate the scanning directions, while B2 and C2 show the complete B-scan images. B3 and C3 display the coordinate diagram corresponding to foveal deviation in the horizontal and vertical planes, and B4 and C4 provide specific annotations of O, P1, and P2 in the B-scan images. The specific measurement methods are described below: (1) Microstructures were consistently located at the bottom of the central fovea, including the ellipsoid zone bulge, cotton ball sign (CB), foveolar detachment, and acquired vitelliform lesion. Fixation point locations were also comprehensively considered to identified central fovea. The point on the retinal pigment epithelium (RPE) at the central fovea was identified as the reference starting point (B4, C4). Vertical (B1-2) and horizontal (C1-2) axes scans centered at the coordinate origin (O) were performed. (2) Endpoint (P1, P2) refers to the innermost foveal edge at the thinnest position of the inner retina [from the inner nuclear layer (INL) to the retinal nerve fiber layer] (B4, C4). (3) A coordinate system on the RPE surface was established; moreover, the stereotaxic estimate of the offset central foveal (P(x, y, z)) can be obtained using the corresponding coordinates of the two orthogonal planes (A1). HD = , and TD = .
Microstructures were consistently located at the bottom of the central fovea, (17–24), including the ellipsoid zone bulge, cotton ball sign (CB), foveolar detachment, and acquired vitelliform lesion. Fixation point locations were also comprehensively considered to identified central fovea (16). The lowest point on the retinal pigment epithelium (RPE) at the central fovea was identified as the coordinate origin (O) by referring to these locations. At the fovea, the endpoints in both orthogonal B-scan images, P1 and P2, referred to the innermost foveal edge at the thinnest inner retinal position [from the inner nuclear layer (INL) to the retinal nerve fiber layer].
A coordinate system was established as follows (Figure 2): the X and Y axis formed the RPE horizontal section, while the Z axis was the intersection line of the two orthogonal B-scan images. Both orthogonal image planes could be considered the X-Z plane and Y-Z planes, while P1 and P2 could be expressed as (x, 0, z) and (0, y, z), respectively, in coordinates. The values x, y, and z were the values projected of P1 and P2 onto different axes X, Y, and Z. P1 (x, 0, z) and P2 (0, y, z) were planar projections of P (x, y, z), which is the stereotaxic estimate of the offset central foveal. Based on the Pythagorean theorem, HD and TD could be obtained as follow: HD = and TD = . Images were reviewed by two independent readers (L.S. and J.M.), who were blinded to the clinical information. The average of both measurements was used for analysis; moreover, in case of between-observer differences exceeding 5%, the observers discussed and repeated measurements.
Figure 2
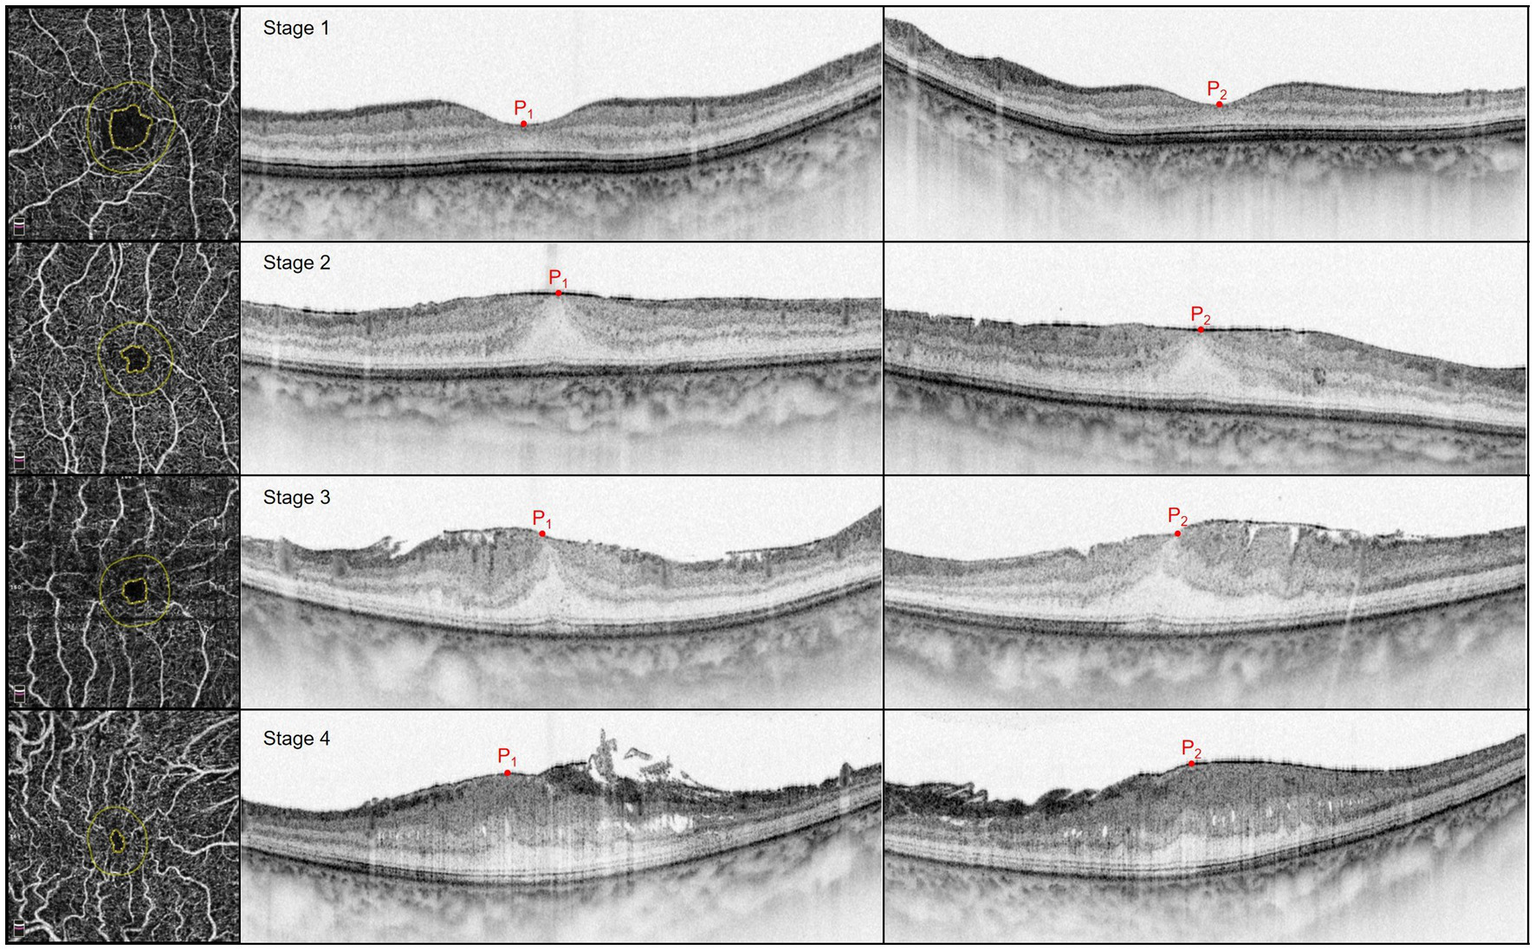
OCTA (left), vertical and horizontal axis OCT (middle and right) scans of epiretinal membranes; from top to bottom are Stages 1–4. P1 and P2 represented the foveal deviation endpoint on the vertical and horizontal axis scans, respectively. Stage 1: Mild with negligible morphologic or anatomic disruption, HD is 88 μm and TD is 213 μm. Stage 2: Loss of foveal depression without EIFL, HD is 100 μm and TD is 356 μm. Stage 3: Presence of continuous EIFL across the central fovea, HD is 405 μm and TD is 605 μm. Stage 4: Continuous EIFL with anatomic disruption, HD is 446 μm and TD is 714 μm.
The EIFL was observed using SD-OCT. Continuous hyporeflective and hyperreflective bands extended from the INL and inner plexiform layer to the central fovea. Further, iERM was classified into four stages (6). Stage 1 was indicated by mild with negligible morphologic or anatomic disruption. Stage 2 involved loss of foveal depression without EIFL. Stage 3 involved the presence of a continuous EIFL across the central fovea. Stage 4 was indicated by a continuous EIFL and anatomic macular disruption (Figure 2). Additionally, OCT was used to detect CB and microcystic macular edema (MME): CB was indicated by a highly reflective area between the photoreceptor inner segment and the outer segment junction line (18). MME was indicated by a lacunar hyporeflective area with a clear boundary predominantly located in the INL (25). OCT angiography (OCTA; Optovue RTVue XR, Optovue Inc., CA, United States) indicators were obtained at baseline. Further, the following foveal avascular zone (FAZ) parameters were collected: FAZ area, FAZ perimeter, acircularity index (AI), and the foveal vessel density (FD) within a 300-μm region around the FAZ. Best-corrected visual acuity (BCVA) was measured at baseline and postoperative follow-up using the Chinese standard logarithm visual chart, followed by conversion into the log of the minimum angle of resolution (logMAR) unit.
2.4. Statistical analysis
All statistical analyses were performed using SPSS version 23.0 (SPSS, IL, United States). Data are expressed as mean ± standard deviation. Intra- and inter-observer reliabilities were performed using intraclass correlation coefficient. Analysis of variance (ANOVA) was used for among-group comparisons. Categorical data were analyzed using the chi-square test or Fisher exact test. Between-group comparisons were performed using independent-sample and paired-sample t tests. The Kruskal–Wallis nonparametric and Wilcoxon signed-rank tests were used to analyze data with non-normal distribution. Correlations were analyzed through Spearman’s rank correlation. A strong, moderate, and strong correlation was indicated by 0.5 < |r| ≤ 1, 0.3 < |r| ≤ 0.5, and |r| ≤ 0.3, respectively (26). Variables with a value of p < 0.2 in the correlation analysis were included in stepwise multiple linear regression analyses to identify predictive factors for baseline and postoperative visual outcomes. Statistical significance was set at p < 0.05.
3. Results
3.1. Baseline characteristics
We included 160 eyes from 160 patients, and they were all included in the baseline statistical study to avoid selection bias. Stages 1, 2, 3, and 4 of the EIFL were detected in 40, 33, 66, and 21 eyes, respectively. There were no significant among-stage differences in age and sex ratio (p = 0.371, 0.209; Table 1).
Table 1
| All | Stage 1 | Stage 2 | Stage 3 | Stage 4 | F | p | |
|---|---|---|---|---|---|---|---|
| Totality | |||||||
| Number of eyes | 160 | 40 | 33 | 66 | 21 | ||
| Age | 62.56 ± 9.77 | 60.35 ± 10.16 | 63.70 ± 8.81 | 62.80 ± 9.95 | 64.24 ± 9.80 | 1.05 | 0.371† |
| Male sex, n (%) | 54 (33.8) | 19 (47.5) | 10 (30.3) | 19 (28.8) | 6 (28.6) | 0.209+ | |
| Follow-up completed | |||||||
| Number of eyes | 91 | 0 | 23 | 53 | 15 | ||
| Age | 64.10 ± 9.60 | - | 63.82 ± 8.39 | 63.55 ± 9.98 | 66.40 ± 10.49 | 0.52 | 0.597† |
| Male sex, n (%) | 23 (25.3) | - | 8 (34.8) | 13 (24.5) | 2 (13.3) | 0.325+ | |
| Follow-up time (months) | 12.08 ± 0.69 | - | 12.00 ± 0.67 | 12.13 ± 0.74 | 12.00 ± 0.54 | 0.40 | 0.669† |
Characteristics of the included patients with EIFL classification.
One-way ANOVA test.
Chi-square test or Fisher exact test.
We included 91 eyes who underwent 23G PPV with combined cataract surgery and had a follow-up period of ≥11 months. We excluded three cases without cataract surgery, 13 with a short follow-up period, and 51 did not undergo surgical intervention due to minor symptoms or refusal of surgical treatment. Further, 91 eyes were operated on and had a postoperative follow-up period of 12.08 ± 0.69 months. Stages 1, 2, 3, and 4 of the EIFL were detected in 0, 23, 53, and 15 eyes, respectively. There were no significant among-stage differences in age, sex ratio, or follow-up period (p = 0. 597, 0. 325, 0. 669; Table 1).
3.2. Baseline measurements at different stages
The EIFL stage was positively correlated with the CMT, AI, and incidence of MME, as well as negatively correlated with the BCVA, FAZ area and FAZ perimeter values (all < 0.05). The EIFL stage was not correlated with the FD or CB (p = 0.684, 0.099; Table 2).
Table 2
| Stage 1 | Stage 2 | Stage 3 | Stage 4 | F/Z | p | |
|---|---|---|---|---|---|---|
| LogMAR BCVA | 0.10 ± 0.13 | 0.30 ± 0.30 | 0.47 ± 0.27 | 0.74 ± 0.32 | 32.1 | <0.001† |
| MME | 3/40 | 4/33 | 9/66 | 9/21 | 0.002+ | |
| CB | 5/40 | 12/33 | 20/66 | 5/21 | 0.099+ | |
| CMT, μm | 316.9 ± 70.1 | 444.5 ± 89.7 | 506.3 ± 88.5 | 655.6 ± 137.2 | 102.0 | <0.001* |
| HD, μm | 45.1 ± 86.2 | 138.9 ± 159.5 | 232.9 ± 181.0 | 542.1 ± 327.4 | 74.8 | <0.001* |
| TD, μm | 251.7 ± 91.2 | 454.2 ± 140.5 | 547.9 ± 151.3 | 856.4 ± 281.4 | 101.6 | <0.001* |
| FAZ parameters | ||||||
| FAZ area, mm2 | 0.13 ± 0.08 | 0.10 ± 0.04 | 0.06 ± 0.06 | 0.04 ± 0.03 | 74.8 | <0.001* |
| FAZ perimeter, mm | 1.34 ± 0.49 | 1.28 ± 0.30 | 1.03 ± 0.42 | 0.85 ± 0.35 | 26.1 | <0.001* |
| AI | 1.13 ± 0.06 | 1.20 ± 0.10 | 1.23 ± 0.19 | 1.38 ± 0.39 | 9.4 | 0.024* |
| FD, % | 46.53 ± 8.36 | 45.44 ± 4.63 | 45.74 ± 6.05 | 45.86 ± 6.69 | 2.1 | 0.684* |
Preoperative measurements with EIFL classification.
AI, acircularity index; BCVA, best-corrected visual acuity; CB, cotton ball sign; CMT, central macular thickness; FAZ, foveal avascular zone; FD, foveal vessel density in a 300-μm-wide region around the FAZ; HD, horizontal displacement; MME, microcystic macular edema; TD, total distance. LogMAR BCVA was used in all statistical analyses.
One-way ANOVA test.
Kruskal–Wallis nonparametric ANOVA test.
Chi-square test or Fisher exact test value.
In the pairwise comparisons, there were significant between-stage differences in the CMT and BCVA (all p < 0.05), as well as the FAZ area except for between Stage 3 and 4 (p = 0.127). MME was more common in Stage 4 than in the other stages (all p < 0.05). AI was lower in Stage 1 than in Stage 4 (p = 0.015). The FAZ perimeter significantly differed between Stages 2 and 3, Stages 1 and 4, and Stages 2 and 4 (all p < 0.005).
The measurements of HD and TD showed high intra- and inter-observer reliabilities (All ICC ≥ 0.940, Supplementary Table 1). The EIFL stage was significantly positively correlated with HD and TD (all p < 0.001). For pairwise comparisons, there were significant between-stage differences in the HD and TD (all p < 0.05).
When components of both orthogonal planes were compared, there was no significant difference in the HD (p = 0.193) or TD (p = 0.488).
3.3. Correlation analyses of visual impairment and prognosis
The baseline BCVA was negatively correlated with CMT, MME, HD, and TD, as well as positively correlated factors with the FAZ area and perimeter (Table 3). In particular, CMT, FAZ area, HD, and TD were strongly correlated with baseline BCVA. Among all metrics, the highest correlation was observed for TD. TD and MME showed a 45.4% contribution to the baseline BCVA (F = 51.66, p < 0.001); further, they were considered independent predictors (B = 0.539, p < 0.001; B = 0.266, p < 0.001).
Table 3
| r | p | |
|---|---|---|
| MME | 0.416 | <0.001 |
| CB | 0.145 | 0.067 |
| CMT | 0.750 | <0.001 |
| HD | 0.654 | <0.001 |
| TD | 0.766 | <0.001 |
| FAZ parameters | ||
| FAZ area | −0.679 | <0.001 |
| FAZ perimeter | −0.420 | <0.001 |
| AI | 0.170 | 0.059 |
| FD | −0.121 | 0.180 |
Correlation analysis of preoperative indicators with baseline logMAR BCVA.
AI, acircularity index; BCVA, best-corrected visual acuity; CB, cotton ball sign; CMT, central macular thickness; FAZ, foveal avascular zone; FD, foveal vessel density in a 300-μm-wide region around the FAZ; HD, horizontal displacement; TD, total distance; MME, microcystic macular edema. LogMAR BCVA and Spearman rank correlation were used in all statistical analyses.
Preoperative HD and TD were negatively correlated with the postoperative BCVA (Table 4). Moreover, the baseline MME, and CMT were negatively correlated with the last follow-up BCVA. Contrastingly, the baseline BCVA, FAZ area, FAZ perimeter, and FD were negatively correlated with the last follow-up BCVA. The baseline BCVA showed strong correlation; the CMT, HD, and TD showed moderate correlations. Among all structural parameters of the retinal, TD showed the strongest correlation.
Table 4
| r | p | |
|---|---|---|
| Baseline BCVA | 0.574 | <0.001 |
| MME | 0.286 | 0.006 |
| CB | −0.110 | 0.299 |
| CMT | 0.340 | 0.001 |
| HD | 0.362 | <0.001 |
| TD | 0.406 | <0.001 |
| FAZ parameters | ||
| FAZ area | −0.260 | 0.012 |
| FAZ perimeter | −0.234 | 0.025 |
| AI | 0.116 | 0.272 |
| FD | −0.255 | 0.015 |
Correlation analysis of preoperative indicators with last follow-up LogMAR BCVA.
AI, acircularity index; BCVA, best-corrected visual acuity; CB, cotton ball sign; CMT, central macular thickness; FAZ, foveal avascular zone; FD, foveal vessel density in a 300-μm-wide region around the FAZ; HD, horizontal displacement; TD, total distance; MME, microcystic macular edema. LogMAR BCVA and Spearman rank correlation were used in all statistical analyses.
Stepwise multiple linear regression analyses were conducted to identify predictive factors for the last follow-up BCVA among the baseline retinal parameters. We found that the resulting model could explain 24.3% of the variance and could significantly predict the last follow-up BCVA [F (11.04), p < 0.001]. The TD, FD, and MME significantly contributed to the model (B = 0.319, p = 0.002; B = −0.249, p = 0.008; B = 0.214, p = 0.036).
4. Discussion
This study had several principal findings. First, TD was an independent predictor of the baseline and postoperative BCVA in the multiple linear regression analysis. Second, the HD and TD were significantly correlated with the baseline and last follow-up BCVA, with TD showing the highest correlation coefficient among all the retinal parameters. Third, the preoperative HD and TD values significantly increased with advanced EIFL staging. There were no significant differences between the vertical and horizontal components.
Therefore, the HD and TD may accurately reflect the degree of iERM stereo traction and may be predictive factors for the degree of preoperative visual impairment and postoperative visual prognoses.
The formation of iERM shares similar characteristics as fibrosis. Specifically, the transdifferentiation of various precursor cells into myofibroblasts and the massive production of extracellular matrix proteins containing extracellular fibrils results in fibrous contraction and distortion of the normal tissue structure (4). Retinal thickening, disorganization, and altered foveal morphology can be caused by the vertical traction and horizontal tangential forces of iERM (11, 27–29). The area and depth of iERM traction were correlated with the foveal alteration and BCVA (30). Therefore, the iERM-generated forces and the resulting macular structure damage can be three-dimensionally considered. Stereo quantitative analysis of the central macular displacement might allow a better description of iERM tractions.
Although previous studies have used fundus autofluorescence imaging to evaluate retinal displacement based on relative changes in the position of blood vessels (31), this is confined to the inner retinal layer. Our study showed that the HD and TD significantly increased with staging, indicating a significant positive correlation between retinal stereo deviations with iERM severity in the whole retina. The lack of significant differences between the horizontal and vertical components of both indexes could be attributed to the indeterminate traction location, which is consistent with the results of Sakai et al. (16).
Sakai et al. (16) reported no significant correlation of the fovea’s horizontal and vertical tangential distortion with BCVA. Hsiao-Fan Tung et al. (32) reported that postoperative horizontal movement of the central fovea was positively correlated with the severity of BCVA worsening; however, this parameter cannot be preoperatively obtained. We found that both HD and TD were significantly associated with baseline BCVA, with TD showing the highest correlation index. Moreover, TD was an independent predictor of preoperative BCVA.
Ichikawa et al. (33) reported that the ratio of baseline to postoperative measurements of the distances between the intersections of retinal vessels on near-infrared spectroscopy images was correlated with the postoperative M-score. Another recent study reported that the postoperative change in the projection distance relative to the PRE layer at the vascular bifurcation was associated with BCVA at 6 postoperative months (34). However, both aforementioned parameters only reflected changes in the horizontal plane.
In our study, the last follow-up BCVA was significantly correlated with the baseline HD and TD, with TD having the highest correlation coefficient. Moreover, TD was a significant predictor of the last follow-up BCVA. Thus, serious stereo heterotopia of the retina was an adverse factor for visual prognosis. Furthermore, it is important to consider the TD when determining the timing of surgery.
The FAZ area, perimeter, and AI significantly correlated with staging. Previous studies have reported that FAZ-related parameters differed significantly compared with healthy controls (28), and changed significantly with disease severity (29, 35, 36). The FAZ area and perimeter were significantly correlated with the baseline and postoperative BCVA. The correlation between FAZ area and baseline BCVA was also proven in previous studies (28, 35, 37–39) and BCVA recovery (28, 37, 40, 41). Due to the differences in sample size, follow-up time, scanning depth range of different OCTA devices, and software vascular detection algorithm, many studies have controversial results on the correlation between FAZ-related indicators and visual acuity before (29, 35, 42, 43) and after surgery (35, 38, 43, 44). Although FD was not significantly correlated with the baseline staging, it was significantly associated with and was an independent predictor of postoperative visual acuity. Consistent with our findings, Kim et al. (41) reported that the parafoveal capillary density was significantly associated with postoperative visual acuity. This suggested that vessel displacement could alter the related tissue supply, with independent prognostic implications. Previous studies on FD-300 reported that the recovery at 6 months postoperatively did not reach statistical significance. The absence of a correlation with postoperative visual acuity was probably attributed to the limited sample size and insufficient follow-up period (8). CB was not significantly correlated with visual function, which is consistent with previous reports (22). The incidence of MME was positively correlated with EIFL staging progression; further, it was an independent predictor of the baseline and postoperative BCVA. Consistent with our findings, previous studies (45–47) have shown that MME is a nonnegligible prognostic index.
This study has several limitations. First, estimating the HD and TD through horizontal and vertical B-scan images may involve errors due to its retrospective nature. Theoretically, high-density imaging, with the 360° rotating B-scans centered on the bottom of the central fovea, can simultaneously obtain the image from the start to the endpoint. Accordingly, this may be used to accurately measure the HD and TD; however, future studies are warranted to test this hypothesis. Second, although the dose and exposure time of indocyanine green was minimized and it is relatively safe, its potential retinal toxicity still requires attention (48, 49). Third, the postoperative follow-up period was not exactly 12 months due to patient compliance issues. Forth, this was a small-scale retrospective study.
In conclusion, the baseline HD and TD were positively correlated with EIFL stage progression; moreover, they were predictors of the baseline and postoperative BCVA. TD showed the highest correlation indexes and was an independent predictor of baseline and postoperative visual acuity. FD-300 and MME, which are markers related to microvascular changes and microstructural damage, also showed significant predictive utility for postoperative visual acuity. Therefore, the HD and TD may accurately reflect the degree of iERM stereo traction and allow prediction of baseline and postoperative visual acuity.
Funding
The Zhejiang Medical Health Science and Technology Project (2023KY490) and the Natural Science Foundation of Zhejiang Province (LTGY23H120005) supported this study. Nonetheless, funding bodies were not involved in the design of the study and collection, analysis, and interpretation of data and in writing the manuscript.
Publisher’s note
All claims expressed in this article are solely those of the authors and do not necessarily represent those of their affiliated organizations, or those of the publisher, the editors and the reviewers. Any product that may be evaluated in this article, or claim that may be made by its manufacturer, is not guaranteed or endorsed by the publisher.
Statements
Data availability statement
The raw data supporting the conclusions of this article will be made available by the authors, without undue reservation.
Ethics statement
The studies involving human participants were reviewed and approved by 2019168K160. Written informed consent for participation was not required for this study in accordance with the national legislation and the institutional requirements.
Author contributions
LS, JM, and ZZ contributed to the conception of the study. LS, JM, ZZ, JL, NC, XD, and YijC performed the experiment. ZZ, JL, and YijC contributed significantly to analysis and manuscript preparation. ZZ, JT, and YiqC performed the data analyses and wrote the manuscript. ZZ and JM helped perform the analysis with constructive discussions. All authors contributed to the article and approved the submitted version.
Conflict of interest
The authors declare that the research was conducted in the absence of any commercial or financial relationships that could be construed as a potential conflict of interest.
Supplementary material
The Supplementary material for this article can be found online at: https://www.frontiersin.org/articles/10.3389/fmed.2023.1109471/full#supplementary-material
References
1.
Mitchell P Smith W Chey T Wang JJ Chang A . Prevalence and associations of epiretinal membranes. The Blue Mountains eye study, Australia. Ophthalmology. (1997) 104:1033–40. doi: 10.1016/S0161-6420(97)30190-0
2.
Xiao W Chen X Yan W Zhu Z He M . Prevalence and risk factors of epiretinal membranes: a systematic review and meta-analysis of population-based studies. BMJ Open. (2017) 7:e014644. doi: 10.1136/bmjopen-2016-014644
3.
Ouyang Y Heussen FM Keane PA Sadda SR Walsh AC . The retinal disease screening study: prospective comparison of nonmydriatic fundus photography and optical coherence tomography for detection of retinal irregularities. Invest Ophthalmol Vis Sci. (2013) 54:1460–8. doi: 10.1167/iovs.12-10727
4.
Bu SC Kuijer R Li XR Hooymans JM Los LI . Idiopathic epiretinal membrane. Retina. (2014) 34:2317–35. doi: 10.1097/IAE.0000000000000349
5.
Kauffmann Y Ramel JC Lefebvre A Isaico R De Lazzer A Bonnabel A et al . Preoperative prognostic factors and predictive score in patients operated on for combined cataract and idiopathic Epiretinal membrane. Am J Ophthalmol. (2015) 160:185–92.e5. doi: 10.1016/j.ajo.2015.03.027
6.
Govetto A Lalane RA 3rd Sarraf D Figueroa MS Hubschman JP . Insights into Epiretinal membranes: presence of ectopic inner Foveal Layers and a new optical coherence tomography staging scheme. Am J Ophthalmol. (2017) 175:99–113. doi: 10.1016/j.ajo.2016.12.006
7.
Bae K Choi JH Kim KT Kang SW . EN-FACE OPTICAL COHERENCE TOMOGRAPHY IN PATIENTS WITH EPIRETINAL MEMBRANE: intuitive method for predicting functional outcomes. Retina. (2020) 40:1972–9. doi: 10.1097/IAE.0000000000002686
8.
Govetto A Virgili G Rodriguez FJ Figueroa MS Sarraf D Hubschman JP . Functional And Anatomical Significance Of The Ectopic Inner Foveal Layers In Eyes With Idiopathic Epiretinal Membranes: surgical results at 12 months. Retina. (2019) 39:347–57. doi: 10.1097/IAE.0000000000001940
9.
Kim JY Kim DY Kim KT Song J Chae JB Kim JG . Visual prognostic factors of Epiretinal membrane surgery in patients with Pseudophakia. Ophthalmol J international d'ophtalmologie International journal of ophthalmology Zeitschrift fur Augenheilkunde. (2020) 243:43–50. doi: 10.1159/000502748
10.
Karasavvidou EM Panos GD Koronis S Kozobolis VP Tranos PG . Optical coherence tomography biomarkers for visual acuity in patients with idiopathic epiretinal membrane. Eur J Ophthalmol. (2021) 31:3203–13. doi: 10.1177/1120672120980951
11.
Ozdek S Ozdemir Zeydanli E Karabas L Teke MY Yilmaz G Citirik M et al . Relation of anatomy with function following the surgical treatment of idiopathic epiretinal membrane: a multicenter retrospective study. Graefe's Arch Clin Exp Ophthalmol = Albrecht von Graefes Archiv fur klinische und experimentelle Ophthalmologie. (2021) 259:891–904. doi: 10.1007/s00417-020-05002-1
12.
Yoon YS Woo JM Woo JE Min JK . Superficial foveal avascular zone area changes before and after idiopathic epiretinal membrane surgery. Int J Ophthalmol. (2018) 11:1711–5. doi: 10.18240/ijo.2018.10.21
13.
Franze K Grosche J Skatchkov SN Schinkinger S Foja C Schild D et al . Muller cells are living optical fibers in the vertebrate retina. Proc Natl Acad Sci U S A. (2007) 104:8287–92. doi: 10.1073/pnas.0611180104
14.
Reichenbach A Bringmann A . New functions of Müller cells. Glia. (2013) 61:651–78. doi: 10.1002/glia.22477
15.
Colakoglu A Balci Akar S . Potential role of Müller cells in the pathogenesis of macropsia associated with epiretinal membrane: a hypothesis revisited. Int J Ophthalmol. (2017) 10:1759–67. doi: 10.18240/ijo.2017.11.19
16.
Sakai D Takagi S Hirami Y Nakamura M Kurimoto Y . Correlation between tangential distortion of the outer retinal layer and metamorphopsia in patients with epiretinal membrane. Graefes Arch Clin Exp Ophthalmol. (2021) 259:1751–8. doi: 10.1007/s00417-021-05077-4
17.
Freund KB Laud K Lima LH Spaide RF Zweifel S Yannuzzi LA . Acquired Vitelliform lesions: correlation of clinical findings and multiple imaging analyses. Retina. (2011) 31:13–25. doi: 10.1097/IAE.0b013e3181ea48ba
18.
Tsunoda K Watanabe K Akiyama K Usui T Noda T . Highly reflective foveal region in optical coherence tomography in eyes with vitreomacular traction or epiretinal membrane. Ophthalmology. (2012) 119:581–7. doi: 10.1016/j.ophtha.2011.08.026
19.
Watanabe K Tsunoda K Mizuno Y Akiyama K Noda T . Outer retinal morphology and visual function in patients with idiopathic epiretinal membrane. JAMA Ophthalmol. (2013) 131:172–7. doi: 10.1001/jamaophthalmol.2013.686
20.
Hasegawa T Ueda T Okamoto M Ogata N . Presence of foveal bulge in optical coherence tomographic images in eyes with macular edema associated with branch retinal vein occlusion. Am J Ophthalmol. (2014) 157:390–396.e1. doi: 10.1016/j.ajo.2013.10.007
21.
Hasegawa T Ueda T Okamoto M Ogata N . Relationship between presence of foveal bulge in optical coherence tomographic images and visual acuity after rhegmatogenous retinal detachment repair. Retina. (2014) 34:1848–53. doi: 10.1097/IAE.0000000000000160
22.
Pison A Dupas B Couturier A Rothschild PR Tadayoni R . Evolution of Subfoveal detachments secondary to idiopathic Epiretinal membranes after surgery. Ophthalmology. (2016) 123:583–9. doi: 10.1016/j.ophtha.2015.10.020
23.
Govetto A Bhavsar KV Virgili G Gerber MJ Freund KB Curcio CA et al . Tractional abnormalities of the central Foveal Bouquet in Epiretinal membranes: clinical Spectrum and pathophysiological perspectives. Am J Ophthalmol. (2017) 184:167–80. doi: 10.1016/j.ajo.2017.10.011
24.
Hasegawa T Kawaguchi A Arakawa H Maruko I Iida T . Misalignment between CENTER of FOVEAL avascular zone and CENTER of FOVEAL photoreceptors in eyes with idiopathic EPIRETINAL membrane. Retina. (2021) 41:1635–43. doi: 10.1097/IAE.0000000000003064
25.
Dysli M Rückert R Munk MR . Differentiation of underlying pathologies of macular edema using spectral domain optical coherence tomography (SD-OCT). Ocul Immunol Inflamm. (2019) 27:474–83. doi: 10.1080/09273948.2019.1603313
26.
Cohen J . Statistical power analysis for the behavioral sciences. 2nd edn. New York: Routledge (2013).
27.
Alkabes M Fogagnolo P Vujosevic S Rossetti L Casini G De Cillà S . Correlation between new OCT parameters and metamorphopsia in advanced stages of epiretinal membranes. Acta Ophthalmol. (2020) 98:780–6. doi: 10.1111/aos.14336
28.
Mao J Lao J Liu C Zhang C Chen Y Tao J et al . A study analyzing macular microvasculature features after vitrectomy using OCT angiography in patients with idiopathic macular epiretinal membrane. BMC Ophthalmol. (2020) 20:165. doi: 10.1186/s12886-020-01429-6
29.
Shiihara H Terasaki H Sonoda S Kakiuchi N Yamaji H Yamaoka S et al . Association of foveal avascular zone with the metamorphopsia in epiretinal membrane. Sci Rep. (2020) 10:17092. doi: 10.1038/s41598-020-74190-x
30.
Romano MR Cennamo G Amoroso F Montorio D Castellani C Reibaldi M et al . Intraretinal changes in the presence of epiretinal traction. Graefe's archive for clinical and experimental ophthalmology =. Albrecht Von Graefes Arch Klin Exp Ophthalmol. (2017) 255:31–8. doi: 10.1007/s00417-016-3413-z
31.
Dell'omo R Cifariello F Dell'omo E De Lena A Di Iorio R Filippelli M et al . Influence of retinal vessel printings on metamorphopsia and retinal architectural abnormalities in eyes with idiopathic macular epiretinal membrane. Invest Ophthalmol Vis Sci. (2013) 54:7803–11. doi: 10.1167/iovs.13-12817
32.
Tung HF Chen YL Tung HY Tung HW Chen SN . FOVEAL displacement in eyes with EPIRETINAL membrane after VITRECTOMY and membrane peeling. Retina. (2021) 41:2246–52. doi: 10.1097/IAE.0000000000003200
33.
Ichikawa Y Imamura Y Ishida M . METAMORPHOPSIA and tangential retinal displacement after EPIRETINAL membrane surgery. Retina. (2017) 37:673–9. doi: 10.1097/IAE.0000000000001232
34.
Allegrini D Montesano G Marconi S Rosso N Ometto G Raimondi R et al . A novel quantitative analysis method for idiopathic epiretinal membrane. PLoS One. (2021) 16:e0247192. doi: 10.1371/journal.pone.0247192
35.
Mao J Xu Z Lao J Chen Y Xu X Wu S et al . Assessment of macular microvasculature features before and after vitrectomy in the idiopathic macular epiretinal membrane using a grading system: an optical coherence tomography angiography study. Acta Ophthalmol. (2021) 99:e1168–75. doi: 10.1111/aos.14753
36.
Mavi Yildiz A Avci R Yilmaz S . The predictive value of ectopic inner retinal layer staging scheme for idiopathic epiretinal membrane: surgical results at 12 months. Eye. (2021) 35:2164–72. doi: 10.1038/s41433-021-01429-w
37.
Yuce B Cinar E Aslan F Kucukerdonmez C . Evaluation of retinal vascular structure after epiretinal membrane surgery by optical coherence tomography angiography. Int Ophthalmol. (2021) 41:621–7. doi: 10.1007/s10792-020-01617-9
38.
Bae BJ Ryoo NK . Effect of Foveal pit restoration in Foveal avascular zone after surgery for idiopathic Epiretinal membrane. Korean J Ophthalmol. (2022) 36:44–53. doi: 10.3341/kjo.2021.0114
39.
Chen H Chi W Cai X Deng Y Jiang X Wei Y et al . Macular microvasculature features before and after vitrectomy in idiopathic macular epiretinal membrane: an OCT angiography analysis. Eye. (2019) 33:619–28. doi: 10.1038/s41433-018-0272-3
40.
Liao X Keyal K Li H Wang F . One-year outcomes of 27G core-pars plana vitrectomy of idiopathic epiretinal membrane. Exp Ther Med. (2020) 20:2721–9. doi: 10.3892/etm.2020.8995
41.
Kim YJ Kim S Lee JY Kim JG Yoon YH . Macular capillary plexuses after epiretinal membrane surgery: an optical coherence tomography angiography study. Br J Ophthalmol. (2018) 102:1086–91. doi: 10.1136/bjophthalmol-2017-311188
42.
Yoshida H Terashima H Ueda E Hasebe H Matsuoka N Nakano H et al . Relationship between morphological changes in the foveal avascular zone of the epiretinal membrane and postoperative visual function. BMJ Open Ophthalmol. (2020) 5:e000636. doi: 10.1136/bmjophth-2020-000636
43.
Ersoz MG Hocaoglu M Sayman Muslubas I Arf S Karacorlu M . Quantitative ASSESSMENT of the FOVEAL avascular zone using optical coherence tomography angiography before and after surgery for idiopathic EPIRETINAL membrane. Retina. (2021) 41:54–9. doi: 10.1097/IAE.0000000000002794
44.
Isik-Ericek P Sizmaz S Esen E Demircan N . The effect of epiretinal membrane surgery on macular microvasculature: an optical coherence tomography angiography study. Int Ophthalmol. (2021) 41:777–86. doi: 10.1007/s10792-020-01630-y
45.
Hsieh MH Chou YB Huang YM Hwang DK Tsai FY Chen SJ . Inner nuclear layer microcyst configuration, distribution, and visual prognosis in patients with Epiretinal membrane after Vitrectomy and membrane peeling. Sci Rep. (2019) 9:11570. doi: 10.1038/s41598-019-48097-1
46.
Lee DH Park SE Lee CS . MICROCYSTIC macular edema and cystoid macular edema before and after EPIRETINAL membrane surgery. Retina. (2021) 41:1652–9. doi: 10.1097/IAE.0000000000003087
47.
Cicinelli MV Post M Brambati M Rabiolo A Pignatelli F Szaflik JP et al . Associated Factors And Surgical Outcomes Of Microcystoid Macular Edema And Cone Bouquet Abnormalities In Eyes With Epiretinal Membrane. Retina. (2022) 42:1455–64. doi: 10.1097/IAE.0000000000003492
48.
Bracha P Ciulla TA Baumal CR . Vital dyes in Vitreomacular surgery. Ophthalmic Surg Lasers Imaging Retina. (2018) 49:788–98. doi: 10.3928/23258160-20181002-07
49.
Romano MR Ilardi G Ferrara M Cennamo G Parolini B Mariotti C et al . Macular peeling-induced retinal damage: clinical and histopathological evaluation after using different dyes. Graefe's Arch Clin Experi Ophthalmol. (2018) 256:1573–80. doi: 10.1007/s00417-018-4029-2
Summary
Keywords
idiopathic epiretinal membrane, retina, optical coherence tomography, optical coherence tomography angiography, epiretinal membrane
Citation
Zhang Z, Mao J, Lao J, Chen N, Deng X, Chen Y, Tao J, Chen Y and Shen L (2023) Total and horizontal distances of the foveal stereotaxic displacement can be prognostic indicators for patients with idiopathic epiretinal membrane. Front. Med. 10:1109471. doi: 10.3389/fmed.2023.1109471
Received
27 November 2022
Accepted
09 March 2023
Published
27 March 2023
Volume
10 - 2023
Edited by
Shida Chen, Zhongshan Ophthalmic Center, Sun Yat-sen University, China
Reviewed by
M. Giray Ersoz, Biruni University Hospital, Türkiye; Ting Zhang, Fudan University, China
Updates
Copyright
© 2023 Zhang, Mao, Lao, Chen, Deng, Chen, Tao, Chen and Shen.
This is an open-access article distributed under the terms of the Creative Commons Attribution License (CC BY). The use, distribution or reproduction in other forums is permitted, provided the original author(s) and the copyright owner(s) are credited and that the original publication in this journal is cited, in accordance with accepted academic practice. No use, distribution or reproduction is permitted which does not comply with these terms.
*Correspondence: Lijun Shen, slj@mail.eye.ac.cn
†These authors have contributed equally to this work and share first authorship
This article was submitted to Ophthalmology, a section of the journal Frontiers in Medicine
Disclaimer
All claims expressed in this article are solely those of the authors and do not necessarily represent those of their affiliated organizations, or those of the publisher, the editors and the reviewers. Any product that may be evaluated in this article or claim that may be made by its manufacturer is not guaranteed or endorsed by the publisher.