Abstract
Cholesterol homeostasis disorder and hypertriglyceridemia, as common metabolic conditions, have rarely been reported to affect the immune responses to the hepatitis B vaccine. Our study found that higher high-density lipoprotein (HDL) level showed a significant relationship with positive anti-HBs results (cOR = 1.479, 95% CI: 1.150, 1.901, p = 0.002; aOR = 1.304, 95% CI: 1.006, 1.691, p = 0.045), especially in individuals aged 18- to 40-year-old, female, smoking more than 100 cigarettes in life, and drinking more than 12 times every year. Lower low-density lipoprotein (LDL) level was associated with a negative anti-HBs result among participants aged 18- to 40-year-old, and participants who were obese. Higher level of HDL and lower level of LDL may be protective factors of better immune effect of hepatitis B vaccine. More research should be conducted to investigate the influence of the cholesterol level on the immune responses to the hepatitis B vaccine, and more in-depth research should be performed to uncover the mechanism.
1. Introduction
Hepatitis B, caused by the hepatitis B virus (HBV), is a group of systemic infectious diseases that may lead to chronic liver diseases, including cirrhosis, liver necrosis, and liver cancer. HBV infection is an important worldwide public health problem and is the crucial cause of hepatocellular carcinoma (HCC), which causes significant morbidity and mortality worldwide. Globally, an estimated 887,220 people died from HBV infection, including acute hepatitis, cirrhosis and HCC, in 2015 according to the World Health Organization (WHO). Clearly, HBV infection poses an enormous economic and social burden.
Undoubtedly, compared to other interventions, vaccines are the most cost-effective and safe defense against infectious diseases. Likewise, the best defense against HBV infection, both in terms of benefit–cost ratios and cost-effectiveness, is hepatitis B immunization (1). Mathematical modeling has shown that an estimated 210 million new HBV infections globally have been prevented since the implementation of worldwide hepatitis B vaccination programs (2). HBV carrier rates and chronic complications of HBV infection have markedly declined in countries that have adopted vaccine programs based on WHO recommendations (3, 4).
People without effective immunity are susceptible to HBV infection. Studies have shown that many factors influence the seroprotective response to hepatitis B vaccination. Age is an important factor; notably, the older the age of the patient (more than 40 years old) is, the lower the immune response to the hepatitis B vaccine (5). In addition, smoking, male sex, chronic disease, and infectious diseases such as HIV infection also cause a lower response. Furthermore, the role of genetic factors, as well as epigenetic factors, in vaccine response cannot be ignored. In addition, evidence suggests that obese individuals are less likely to achieve a seroprotective response to hepatitis B vaccination, but they have higher susceptibility to bacterial, viral and fungal infections (6–9). Triglyceride (TG) and cholesterol are important lipid molecules in mammals. Hypertriglyceridemia, with a parallel prevalence of mild-to-moderate to obesity, is a common clinical health problem (10). It has been established that hypertriglyceridemia is a crucial contributor to pancreatitis as well as atherosclerotic cardiovascular disease (ASCVD). Cholesterol is an essential structural component of eukaryotic cell membranes and determines the physiological properties of cell membranes. Its metabolic disorders, both excess and deficiency, are associated with cardiovascular and cerebrovascular diseases, diabetes, cancers and other diseases (11, 12). Besides, cholesterol plays a key role in regulating immune function, which is demonstrated to be very sensitive to the variations of this macronutrient concentration (13). High-density lipoprotein (HDL) may play critical roles both in innate and adaptive immunity, which supported by the ability to regulate cholesterol utilization in immune cells (14). However, the impact of TG and cholesterol levels on the immune effect of the hepatitis B vaccine has not been reported. Therefore, we discuss the potential impact of TG and cholesterol levels on the immune responses to the hepatitis B vaccine in this study.
2. Materials and methods
2.1. Study population
Guided by the National Center for Health Statistics (NCHS) of the Centers for Disease Control and Prevention (CDC), the National Health and Nutrition Examination Survey (NHANES) program investigates the health and nutritional status of people in the United States. NHANES data collection involves questionnaire surveys, laboratory analyses, and physical examinations. For this study, NHANES data collected between 1999 and 2018 were used. The samples were screened for the following inclusion criteria (to eliminate ineligible individuals): (I) individuals with full immunization with three doses of the hepatitis B vaccine, (II) individuals with hepatitis B virus surface antibody (anti-HBs) data, (III) individuals with total cholesterol (TC) values, triglyceride (TG) values, high-density lipoprotein (HDL) values, and low-density lipoprotein (LDL) values, and (IV) individuals aged ≥18 years. Overall, 4,959 individuals were included as shown in Figure 1.
Figure 1
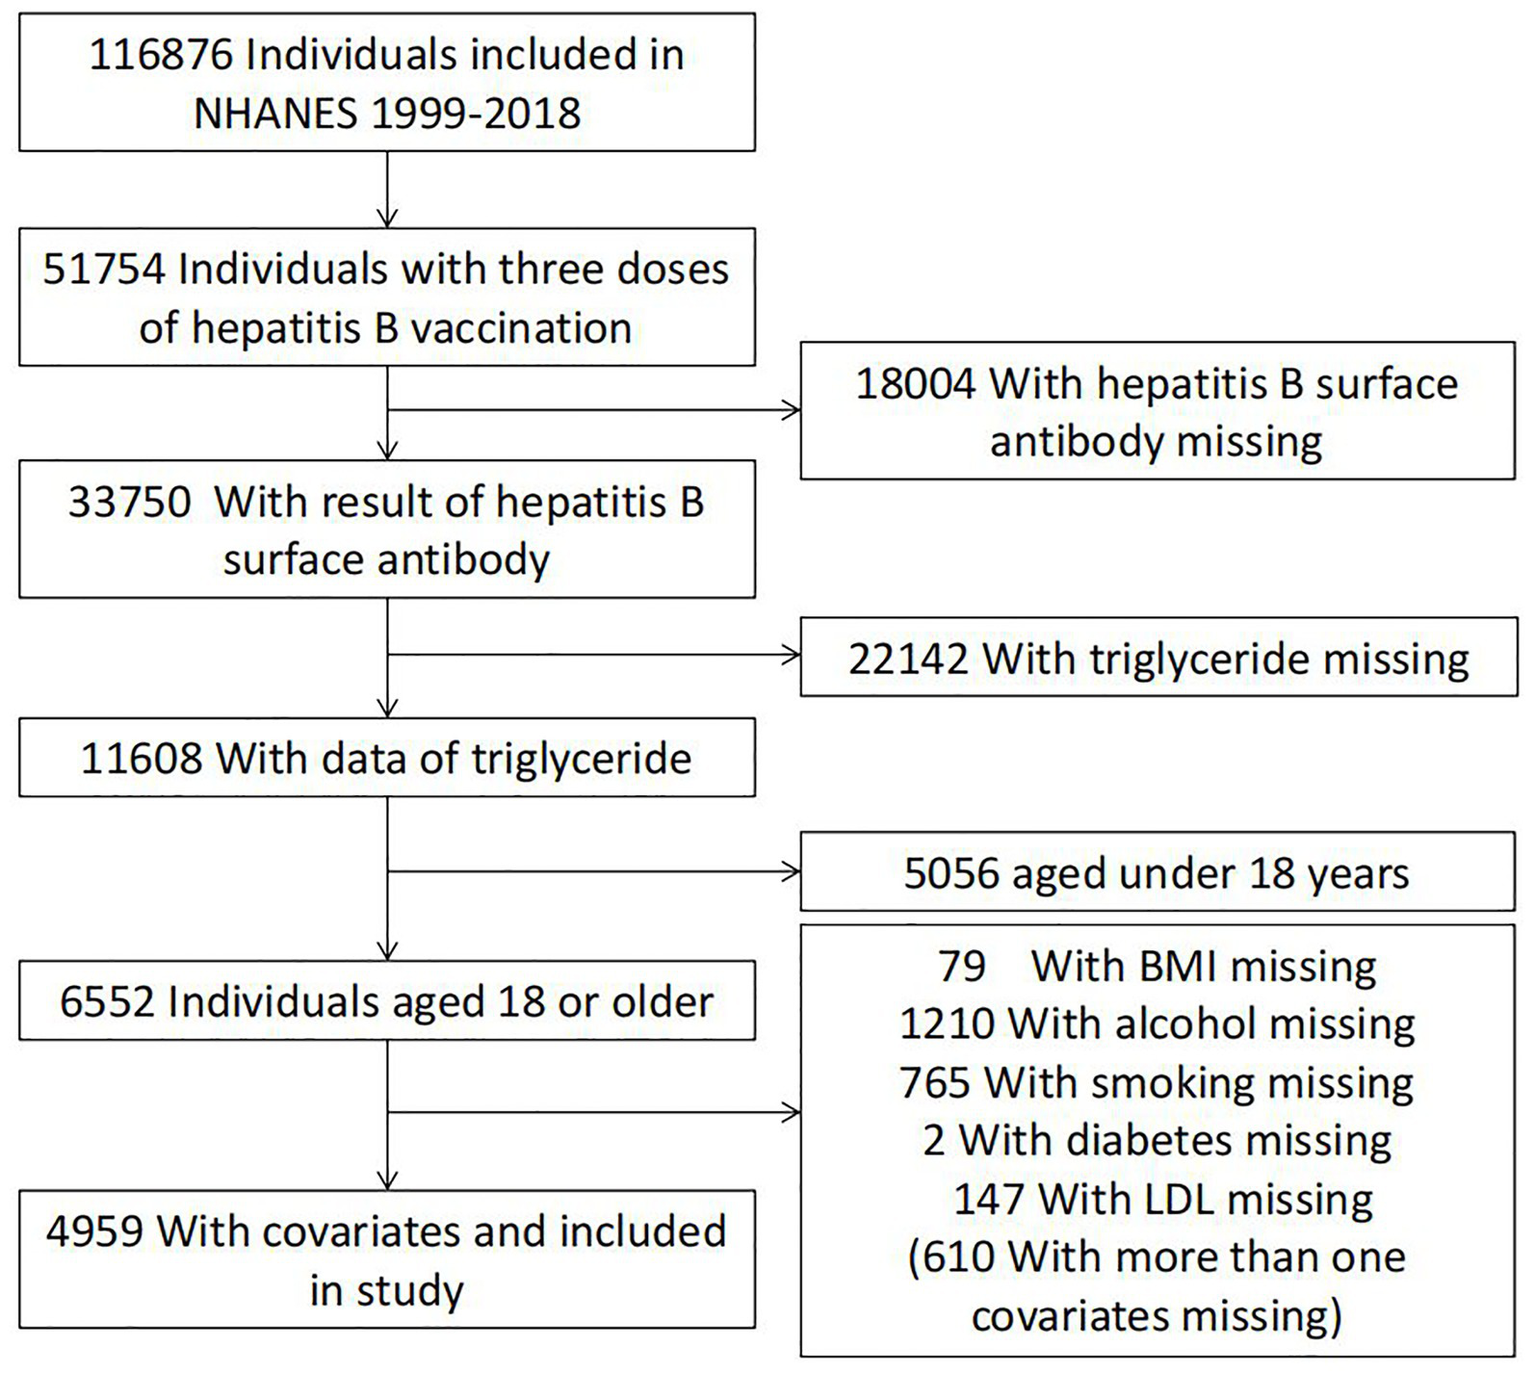
Flow chart of the population included in the final analysis of our study.
2.2. Measurement of anti-HBs
Between 1999 and 2006, the levels of anti-HBs in the serum or plasma of individuals recruited for the NHANES program were detected with the AUSAB EIA kit with a solid-phase enzyme-linked immunoassay technique. The anti-HBs concentration was determined by comparison to a standard curve generated from repeated runs of standard measurements using the AUSAB EIA kit. After 2006, the concentration of anti-HBs was measured with an immunometric technique through the VITROS anti-HBs quantitative assay. The unit of anti-HBs was milli-international units per mL (mIU/mL). Laboratory protocols were obtained from the official NHANES website.1
2.3. Measurement of TG
From 1999 to 2006, TG were detected enzymatically using a series of coupled reactions. First, TGs were hydrolyzed to glycerol. Then, glycerol was oxidized to H2O2 by glycerol oxidase. After that, peroxidase was used to convert H2O2 to a phenazone. Finally, TG levels were determined by measuring the absorbance of phenazone at 500 nm. Between 2007 and 2012, a two-reagent, endpoint reaction was used to determine the TG concentration. First, a background absorbance value was obtained after a series of enzymatic reactions (free glycerol to glycerol-3-phosphate by glycerol kinase, then to hydrogen peroxide by glycerol phosphate oxidase, and then combined with 4-chlorophenol to an oxidation product by peroxidase) with reagent 1 (glycerol blanking). Then, driven by the reagents above, lipase was added to reagent 2 to convert TG to glycerol, and 4-aminophenzone was added to react with the hydrogen peroxide produced in the last reaction. The reaction was measured at 505 nm (secondary wavelength = 700 nm). After 2012, TG were hydrolyzed to glycerol using lipoprotein lipase from microorganisms and then oxidized to dihydroxyacetone phosphate and hydrogen peroxide. The hydrogen peroxide reacted with 4-aminobenzophenone and 4-chlorophenol under the catalysis of peroxidase to form a red dyestuff (Trinder endpoint reaction). The color intensity of the red dyestuff was proportional to the TG concentration and was measured photometrically. No adjustment of values was necessary to account for the change. Laboratory protocols were obtained from the official NHANES website.
2.4. Measurement of cholesterol
2.4.1. Total cholesterol
From 1999 to 2006, total cholesterol was measured in serum or plasma using enzymes in a series of coupled reactions that hydrolyze cholesteryl esters and oxidize the 3-OH group of cholesterol. After 2007, Roche Modular P chemistry analyzer was used to detected total cholesterol level. No adjustment of values was necessary to account for the change. Detailed instructions showed in the official NHANES website.
2.4.2. High-density lipoprotein cholesterol
The HDL level was using direct immunoassay method in serum. A detailed description of the laboratory method used can be found in Laboratory Procedures Manuals on the NHANES web site.
2.4.3. Low-density lipoprotein cholesterol
The LDL concentration was estimated from total cholesterol value minus HDL and one fifth of the triglyceride value. The official NHANES website provides detailed instructions for the experiment.
2.5. Covariates
Based on the literature, some potential confounders have been confirmed to be related to the immune effect of the hepatitis B vaccine, including age, sex, race, body mass index (BMI), smoking status, drinking, and diabetes, which were controlled in this study. Age was categorized into three groups: 18–40 years old, 40–60 years old, and older than 60 years. Sex contains two types: males, females. Race was divided into five groups: Mexican American, other Hispanic, non-Hispanic white, non-Hispanic black, and other race (including multiracial). BMI was categorized as underweight (<18.5), normal weight (18.5–25), overweight (25–30), and obese (≥30) based on WHO classification criteria. Smoking status divided into two groups: never smoker (<100 cigarettes in life), smoker (>100 cigarettes in life). Drinking status divided into two groups: never drinker (<12 alcohol drinks every year), drinker (≥12 alcohol drinks every year). Diabetes status divided into two groups according to doctor’s diagnosis.
2.6. Statistical analysis
We performed statistical analysis by using the Solutions Statistical Package for the Social Sciences (IBM SPSS Statistics Premium V25.0). Continuous variables are shown as the means ±standard deviations (SDs), while categorical variables are shown as numbers and percentages (%) [N (%)]. The concentrations of TC, TG, HDL, and LDL were divided into the following groups, respectively: normal (≤5.69 mmol/l) and hyper (>5.69 mmol/l), normal (≤1.7 mmol/l) and hyper (>1.7 mmol/l), normal (≥0.90 mmol/l) and hypo (<0.90 mmol/l), and normal (≤3.36 mmol/l) and hyper (>3.36 mmol/l). For the baseline characteristics, if continuous variables conformed to a normal distribution or could be adjusted to a normal distribution after processing, such as via logarithmic transformation, Student’s t-test was used for comparisons between two groups; otherwise, the nonparametric test (Mann–Whitney U test) was performed (Supplementary materials showed detailed distribution). Categorical variables were compared between two groups using the chi-square test. We used two logistic regression models (crude model and adjusted model) to evaluate the relationship between the triglyceride and cholesterol and anti-HBs levels. Only TC, TG, HDL, and LDL were included in the crude model, while age, sex, race, BMI smoking status, drinking status, and diabetes status were adjusted in the adjusted model. Simultaneously, we conducted stratified analyses by age (18–40, 40–60, and >60 years), sex (male and female), BMI (<18.5, 18.5–25, 25–30, and ≥30), race (Mexican American, other Hispanic, non-Hispanic white, non-Hispanic black, and other races, including multiracial), smoking status (smoker and never smoker), drinking status (drinker and never drinker), and diabetes status (yes and no).
To diminish the selection bias among subgroups for age, sex, and race, the samples were weighted in the NHANES survey. Therefore, we chose the unweighted data in this study because the adjusted model included the variables used to count sample weights, as recommended previously (15, 16).
In this study, we used a two-tailed test of significance, with a p-value of <0.05 being considered statistically significant.
3. Results
3.1. Participant characteristics
The study included NHANES data collected from a total of 4,959 individuals between 1999 and 2018. The demographic characteristics are shown in Table 1, including age, sex, race, BMI, and TG concentration. A total of 2,304 subjects were positive for anti-HBs, while 2,655 subjects were negative. The average patient age was 39.19 ± 15.84 years. Significant differences in age, sex, race, BMI, smoking status, drinking status, TG, and HDL levels were discovered in the study population stratified by positivity for anti-HBs or not.
Table 1
| Characteristics | Hepatitis B surface antibody is positive (N = 2,304) | Hepatitis B surface antibody is negative (N = 2,655) | p-value |
|---|---|---|---|
| Age (years) | 37.51 ± 15.10 | 40.64 ± 16.32 | <0.001*,a |
| 18–40 years | 1,423 (28.7%) | 1,401 (28.3%) | <0.001* |
| 40–60 years | 606 (12.2%) | 817 (16.5%) | |
| >60 years | 275 (5.5%) | 437 (8.8%) | |
| Sex | <0.001* | ||
| Males | 870 (17.5%) | 1,221 (24.6%) | |
| Females | 1,434 (28.9%) | 1,434 (28.9%) | |
| Race | <0.001* | ||
| Mexican American | 236 (4.8%) | 436 (8.8%) | |
| Other Hispanic | 184 (3.7%) | 252 (5.1%) | |
| Non-Hispanic white | 1,044 (21.1%) | 1,047 (21.1%) | |
| Non-Hispanic black | 479 (9.7%) | 660 (13.3%) | |
| Other race including multiracial | 361 (7.3%) | 260 (5.2%) | |
| BMI | <0.001* | ||
| Underweight | 53 (1.1%) | 47 (0.9%) | |
| Normal weight | 864 (17.4%) | 738 (14.9%) | |
| Overweight | 697 (14.1%) | 806 (16.3%) | |
| Obese | 690 (13.9%) | 1,064 (21.5%) | |
| Smoking status | <0.001* | ||
| Smoker | 811 (16.4%) | 1,086 (21.9%) | |
| Never smoker | 1,493 (30.1%) | 1,569 (31.6%) | |
| Drinking status | 0.029* | ||
| Drinker | 1,601 (32.3%) | 1768 (35.7%) | |
| Never drinker | 703 (14.2%) | 887 (17.9%) | |
| Having diabetes or not | <0.001* | ||
| Yes | 142 (2.9%) | 305 (6.2%) | |
| No | 2,162 (43.6%) | 2,350 (47.4%) | |
| TC (mmol/L) | 4.86 ± 1.04 | 4.85 ± 1.04 | 0.607a |
| Normal | 1875 (37.8%) | 2,156 (43.5%) | 0.875 |
| Hyper | 429 (8.7%) | 499 (10.1%) | |
| TG (mmol/L) | 1.22 ± 0.75 | 1.33 ± 0.77 | <0.001*,a |
| Normal | 1853 (37.4%) | 2020 (40.7%) | <0.001* |
| Hyper | 451 (9.1%) | 635 (12.8%) | |
| HDL (mmol/L) | 1.45 ± 0.42 | 1.37 ± 0.39 | <0.001*,a |
| Normal | 2,198 (44.3%) | 2,462 (49.6%) | <0.001* |
| Hypo | 106 (2.1%) | 193 (3.9%) | |
| LDL (mmol/L) | 2.85 ± 0.90 | 2.87 ± 0.91 | 0.470a |
| Normal | 1732 (34.9%) | 1937 (39.1%) | 0.076 |
| Hyper | 572 (11.5%) | 718 (14.5%) |
Characteristics of 4,959 participants in NHANES data, 1999–2018.
PIR: family poverty income ratio. BMI: body mass index. TC: total cholesterol. TG: triglyceride. HDL: high-density lipoprotein. LDL: low-density lipoprotein. The data were presented as the means ± standard deviations (age, TC, TG, HDL, LDL) or N (%) (other indicators). *The p-value is less than 0.05. aCalculated using Mann–Whitney U test.
3.2. Logistic regression model to assess the association between the triglyceride and cholesterol levels and anti-HBs results
We performed a logistic regression model to evaluate the effect of the triglyceride and cholesterol levels on the anti-HBs results. As shown in Table 2, regardless of the crude model or the adjusted model, higher HDL level showed a significant relationship with positive anti-HBs results (cOR = 1.479, 95% CI: 1.150, 1.901, p = 0.002; aOR = 1.304, 95% CI: 1.006, 1.691, p = 0.045). TG and LDL showed significant relationships in the crude model (cOR = 1.244, 95% CI: 1.077, 1.437, p = 0.003; cOR = 1.231, 95% CI: 1.029, 1.473, p = 0.023, respectively), while the adjusted model showed negative results.
Table 2
| Crude model | Adjusted model | |||
|---|---|---|---|---|
| cOR (95% CI) | P-value | aOR (95% CI) | P-value | |
| TC | 0.062 | 0.305 | ||
| Normal | Ref | Ref | ||
| Hyper | 0.822 (0.669, 1.010) | 0.895 (0.724, 1.106) | ||
| TG | 0.003 | 0.474 | ||
| Normal | Ref | Ref | ||
| Hyper | 1.244 (1.077, 1.437) | 1.058 (0.907, 1.233) | ||
| HDL | 0.002 | |||
| Normal | Ref | Ref | 0.045 | |
| Hypo | 1.479 (1.150, 1.901) | 1.304 (1.006, 1.691) | ||
| LDL | 0.023 | 0.317 | ||
| Normal | Ref | Ref | ||
| Hyper | 1.231 (1.029, 1.473) | 1.099 (0.913, 1.324) |
Odds ratios for associations between triglyceride and cholesterol levels and anti-HBs results.
The crude model only included total cholesterol, triglyceride, high-density lipoprotein, and low-density lipoprotein; the adjusted model comprised the following covariates: age, sex, race, BMI, smoking status, drinking status, and diabetes.
3.3. Logistic regression model to assess the association between the triglyceride and cholesterol levels and anti-HBs results stratified by age, sex, race, BMI, smoking status, drinking status, and diabetes
Several factors were very different between positive and negative anti-HBs results according to Table 1. To assess the effect of the results, we performed group analyses of these factors separately. The relationships between the triglyceride and cholesterol levels and anti-HBs results stratified by age, sex, race, BMI, smoking status, drinking status, and diabetes are shown in Tables 3–9, respectively.
Table 3
| Age | TC (Hyper) | TG (Hyper) | ||||||
|---|---|---|---|---|---|---|---|---|
| Crude model | Adjusted model | Crude model | Adjusted model | |||||
| cOR (95% CI) | P-value | aOR (95% CI) | P-value | cOR (95% CI) | P-value | aOR (95% CI) | P-value | |
| 18–40 years | 0.163 | 0.403 | 0.456 | 0.862 | ||||
| Normal | Ref | Ref | Ref | Ref | ||||
| Hyper/Hypo | 0.807 (0.597, 1.090) | 0.877 (0.644, 1.194) | 1.083 (0.879, 1.334) | 0.981 (0.788, 1.221) | ||||
| 40–60 years | 0.235 | 0.597 | 0.005 | 0.240 | ||||
| Normal | Ref | Ref | Ref | Ref | ||||
| Hyper/Hypo | 0.814 (0.581, 1.143) | 0.910 (0.641, 1.292) | 1.435 (1.113, 1.850) | 1.177 (0.896, 1.547) | ||||
| >60 years | 0.616 | 0.772 | 0.745 | 0.843 | ||||
| Normal | Ref | Ref | Ref | Ref | ||||
| Hyper/Hypo | 0.871 (0.508, 1.495) | 1.086 (0.621, 1.899) | 1.060 (0.748, 1.502) | 0.964 (0.668, 1.390) | ||||
| Age | HDL (Hypo) | LDL (Hyper) | ||||||
| Crude model | Adjusted model | Crude model | Adjusted model | |||||
| cOR (95% CI) | P-value | aOR (95% CI) | P-value | cOR (95% CI) | P-value | aOR (95% CI) | P-value | |
| 18–40 years | 0.002 | 0.024 | 0.005 | 0.022 | ||||
| Normal | Ref | Ref | Ref | Ref | ||||
| Hyper/Hypo | 1.643 (1.198, 2.253) | 1.455 (1.050, 2.017) | 1.421 (1.109, 1.820) | 1.347 (1.043, 1.740) | ||||
| 40–60 years | 0.681 | 0.606 | 0.933 | 0.456 | ||||
| Normal | Ref | Ref | Ref | Ref | ||||
| Hyper/Hypo | 1.107 (0.682, 1.798) | 0.876 (0.529, 1.450) | 0.987 (0.723, 1.346) | 0.884 (0.639, 1.223) | ||||
| >60 years | 0.044 | 0.078 | 0.846 | 0.601 | ||||
| Normal | Ref | Ref | Ref | Ref | ||||
| Hyper/Hypo | 2.572 (1.027, 6.441) | 2.312 (0.909, 5.881) | 0.952 (0.579, 1.565) | 0.872 (0.522, 1.457) |
Odds ratios for associations between triglyceride and cholesterol levels and anti-HBs results stratified by age.
The crude model only included total cholesterol, triglyceride, high-density lipoprotein, and low-density lipoprotein; the adjusted model comprised the following covariates: sex, race, BMI, smoking status, drinking status, and diabetes status.
Table 4
| Sex | TC (Hyper) | TG (Hyper) | ||||||
|---|---|---|---|---|---|---|---|---|
| Crude model | Adjusted model | Crude model | Adjusted model | |||||
| cOR (95% CI) | P-value | aOR (95% CI) | P-value | cOR (95% CI) | P-value | aOR (95% CI) | P-value | |
| Male | 0.562 | 0.414 | 0.373 | 0.824 | ||||
| Normal | Ref | Ref | Ref | Ref | ||||
| Hyper/Hypo | 0.909 (0.659, 1.254) | 0.872 (0.627, 1.212) | 1.101 (0.891, 1.361) | 1.026 (0.820, 1.282) | ||||
| Female | 0.182 | 0.552 | 0.006 | 0.489 | ||||
| Normal | Ref | Ref | Ref | Ref | ||||
| Hyper/Hypo | 0.831 (0.633, 1.091) | 0.919 (0.694, 1.215) | 1.319 (1.082, 1.608) | 1.078 (0.872, 1.332) | ||||
| Sex | HDL (Hypo) | LDL (Hyper) | ||||||
| Crude model | Adjusted model | Crude model | Adjusted model | |||||
| cOR (95% CI) | P-value | aOR (95% CI) | P-value | cOR (95% CI) | P-value | aOR (95% CI) | P-value | |
| Male | 0.177 | 0.133 | 0.492 | 0.568 | ||||
| Normal | Ref | Ref | Ref | Ref | ||||
| Hyper/Hypo | 1.231 (0.911, 1.663) | 1.269 (0.930, 1.732) | 1.097 (0.843, 1.426) | 1.082 (0.825, 1.419) | ||||
| Female | 0.013 | 0.045 | 0.069 | 0.445 | ||||
| Normal | Ref | Ref | Ref | Ref | ||||
| Hyper/Hypo | 1.832 (1.137, 2.950) | 1.646 (1.011, 2.678) | 1.259 (0.982, 1.613) | 1.105 (0.855, 1.430) |
Odds ratios for associations between triglyceride and cholesterol levels and anti-HBs results stratified by sex.
The crude model only included total cholesterol, triglyceride, high-density lipoprotein, and low-density lipoprotein; the adjusted model comprised the following covariates: age, race, BMI, smoking status, drinking status, and diabetes status.
Table 5
| Race | TC (Hyper) | TG (Hyper) | ||||||
|---|---|---|---|---|---|---|---|---|
| Crude model | Adjusted model | Crude model | Adjusted model | |||||
| cOR (95% CI) | P-value | aOR (95% CI) | P-value | cOR (95% CI) | P-value | aOR (95% CI) | P-value | |
| Mexican American | 0.380 | 0.153 | 0.830 | 0.223 | ||||
| Normal | Ref | Ref | Ref | Ref | ||||
| Hyper/Hypo | 1.296 (0.726, 2.313) | 1.546 (0.850, 2.813) | 1.041 (0.721, 1.503) | 0.781 (0.524, 1.163) | ||||
| Other Hispanic | 0.879 | 0.977 | 0.505 | 0.336 | ||||
| Normal | Ref | Ref | Ref | Ref | ||||
| Hyper/Hypo | 0.947 (0.470, 1.909) | 0.989 (0.478, 2.049) | 0.846 (0.518, 1.383) | 0.776 (0.463, 1.301) | ||||
| Non-Hispanic white | 0.002 | 0.012 | < 0.001 | 0.101 | ||||
| Normal | Ref | Ref | Ref | Ref | ||||
| Hyper/Hypo | 0.611 (0.445, 0.839) | 0.658 (0.475, 0.911) | 1.490 (1.205, 1.842) | 1.206 (0.964, 1.509) | ||||
| Non-Hispanic black | 0.641 | 0.796 | 0.661 | 0.774 | ||||
| Normal | Ref | Ref | Ref | Ref | ||||
| Hyper/Hypo | 0.897 (0.568, 1.416) | 0.940 (0.590, 1.499) | 1.097 (0.726, 1.656) | 0.940 (0.616, 1.435) | ||||
| Other race including multiracial | 0.198 | 0.162 | 0.101 | 0.393 | ||||
| Normal | Ref | Ref | Ref | Ref | ||||
| Hyper/Hypo | 1.460 (0.820, 2.600) | 1.526 (0.844, 2.758) | 1.400 (0.936, 2.094) | 1.203 (0.788, 1.837) | ||||
| Race | HDL (Hypo) | LDL (Hyper) | ||||||
| Crude model | Adjusted model | Crude model | Adjusted model | |||||
| cOR (95% CI) | P-value | aOR (95% CI) | P-value | cOR (95% CI) | P-value | aOR (95% CI) | P-value | |
| Mexican American | 0.071 | 0.159 | 0.944 | 0.366 | ||||
| Normal | Ref | Ref | Ref | Ref | ||||
| Hyper/Hypo | 1.877 (0.947, 3.718) | 1.674 (0.817, 3.428) | 1.018 (0.621, 1.668) | 0.786 (0.467, 1.324) | ||||
| Other Hispanic | 0.110 | 0.195 | 0.172 | 0.646 | ||||
| Normal | Ref | Ref | Ref | Ref | ||||
| Hyper/Hypo | 1.979 (0.856, 4.576) | 1.764 (0.748, 4.162) | 1.515 (0.835, 2.748) | 1.157 (0.620, 2.161) | ||||
| Non-Hispanic white | 0.027 | 0.140 | 0.108 | 0.308 | ||||
| Normal | Ref | Ref | Ref | Ref | ||||
| Hyper/Hypo | 1.487 (1.046, 2.115) | 1.316 (0.913, 1.896) | 1.262 (0.951, 1.675) | 1.164 (0.869, 1.559) | ||||
| Non-Hispanic black | 0.246 | 0.515 | 0.149 | 0.293 | ||||
| Normal | Ref | Ref | Ref | Ref | ||||
| Hyper/Hypo | 1.537 (0.743, 3.181) | 1.279 (0.610, 2.681) | 1.326 (0.904, 1.945) | 1.235 (0.833, 1.832) | ||||
| Other race including multiracial | 0.602 | 0.451 | 0.741 | 0.538 | ||||
| Normal | Ref | Ref | Ref | Ref | ||||
| Hyper/Hypo | 0.810 (0.366, 1.790) | 0.730 (0.322, 1.654) | 0.918 (0.551, 1.529) | 0.847 (0.500, 1.435) |
Odds ratios for associations between triglyceride and cholesterol levels and anti-HBs results stratified by race.
The crude model only included total cholesterol, triglyceride, high-density lipoprotein, and low-density lipoprotein; the adjusted model comprised the following covariates: age, sex, BMI, smoking status, drinking status, and diabetes status.
Table 6
| BMI | TC (Hyper) | TG (Hyper) | ||||||
|---|---|---|---|---|---|---|---|---|
| Crude model | Adjusted model | Crude model | Adjusted model | |||||
| cOR (95% CI) | P-value | aOR (95% CI) | P-value | cOR (95% CI) | P-value | aOR (95% CI) | P-value | |
| Underweight | 0.804 | 0.859 | 0.422 | 0.376 | ||||
| Normal | Ref | Ref | Ref | Ref | ||||
| Hyper/Hypo | 1.545 (0.050, 47.521) | 1.431 (0.027, 75.413) | 3.336 (0.176, 63.369) | 4.215 (0.174, 102.082) | ||||
| Normal weight | 0.477 | 0.957 | 0.007 | 0.062 | ||||
| Normal | Ref | Ref | Ref | Ref | ||||
| Hyper/Hypo | 0.862 (0.573, 1.297) | 1.012 (0.661, 1.549) | 1.566 (1.129, 2.173) | 1.385 (0.984, 1.950) | ||||
| Overweight | 0.713 | 0.776 | 0.416 | 0.645 | ||||
| Normal | Ref | Ref | Ref | Ref | ||||
| Hyper/Hypo | 1.069 (0.751, 1.521) | 1.05 (0.733, 1.515) | 1.107 (0.866, 1.416) | 1.062 (0.822, 1.372) | ||||
| Obese | 0.031 | 0.073 | 0.989 | 0.470 | ||||
| Normal | Ref | Ref | Ref | Ref | ||||
| Hyper/Hypo | 0.693 (0.497, 0.966) | 0.733 (0.522, 1.030) | 1.002 (0.802, 1.251) | 0.917 (0.724, 1.160) | ||||
| BMI | HDL (Hypo) | LDL (Hyper) | ||||||
| Crude model | Adjusted model | Crude model | Adjusted model | |||||
| cOR (95% CI) | P-value | aOR (95% CI) | P-value | cOR (95% CI) | P-value | aOR (95% CI) | P-value | |
| Underweight | 0.833 | 0.956 | 0.995 | 0.882 | ||||
| Normal | Ref | Ref | Ref | Ref | ||||
| Hyper/Hypo | 0.659 (0.014, 31.757) | 0.895 (0.018, 44.839) | 1.010 (0.045, 22.896) | 1.294 (0.043, 39.018) | ||||
| Normal weight | 0.247 | 0.780 | 0.617 | 0.888 | ||||
| Normal | Ref | Ref | Ref | Ref | ||||
| Hyper/Hypo | 1.511 (0.751, 3.040) | 1.108 (0.541, 2.269) | 1.098 (0.761, 1.584) | 0.973 (0.666, 1.421) | ||||
| Overweight | 0.200 | 0.186 | 0.653 | 0.676 | ||||
| Normal | Ref | Ref | Ref | Ref | ||||
| Hyper/Hypo | 1.326 (0.861, 2.042) | 1.349 (0.865, 2.103) | 0.931 (0.681, 1.272) | 0.934 (0.678, 1.287) | ||||
| Obese | 0.055 | 0.055 | 0.032 | 0.040 | ||||
| Normal | Ref | Ref | Ref | Ref | ||||
| Hyper/Hypo | 1.413 (0.993, 2.012) | 1.432 (0.992, 2.068) | 1.371 (1.027, 1.829) | 1.364 (1.014, 1.833) |
Odds ratios for associations between triglyceride and cholesterol levels and anti-HBs results stratified by BMI.
The crude model only included total cholesterol, triglyceride, high-density lipoprotein, and low-density lipoprotein; the adjusted model comprised the following covariates: age, sex, race, smoking status, drinking status, and diabetes status.
Table 7
| Smoking | TC (Hyper) | TG (Hyper) | ||||||
|---|---|---|---|---|---|---|---|---|
| Crude model | Adjusted model | Crude model | Adjusted model | |||||
| cOR (95% CI) | P-value | aOR (95% CI) | P-value | cOR (95% CI) | P-value | aOR (95% CI) | P-value | |
| Smoker | 0.529 | 0.738 | 0.231 | 0.416 | ||||
| Normal | Ref | Ref | Ref | Ref | ||||
| Hyper/Hypo | 0.900 (0.649,1.249) | 0.944 (0.675, 1.320) | 1.141 (0.919, 1.416) | 1.098 (0.876, 1.377) | ||||
| Never smoker | 0.042 | 0.351 | 0.013 | 0.726 | ||||
| Normal | Ref | Ref | Ref | Ref | ||||
| Hyper/Hypo | 0.759 (0.582, 0.990) | 0.877 (0.665, 1.156) | 1.282 (1.054, 1.559) | 1.038 (0.842, 1.281) | ||||
| Smoking | HDL (Hypo) | LDL (Hyper) | ||||||
| Crude model | Adjusted model | Crude model | Adjusted model | |||||
| cOR (95% CI) | P-value | aOR (95% CI) | P-value | cOR (95% CI) | P-value | aOR (95% CI) | P-value | |
| Smoker | 0.005 | 0.012 | 0.170 | 0.396 | ||||
| Normal | Ref | Ref | Ref | Ref | ||||
| Hyper/Hypo | 1.671 (1.164, 2.400) | 1.608 (1.111, 2.327) | 1.228 (0.915, 1.648) | 1.140 (0.843, 1.541) | ||||
| Never smoker | 0.216 | 0.866 | 0.061 | 0.702 | ||||
| Normal | Ref | Ref | Ref | Ref | ||||
| Hyper/Hypo | 1.250 (0.878, 1.780) | 1.033 (0.712, 1.498) | 1.243 (0.990, 1.560) | 1.048 (0.825, 1.330) |
Odds ratios for associations between triglyceride and cholesterol levels and anti-HBs results stratified by smoking status.
The crude model only included total cholesterol, triglyceride, high-density lipoprotein, and low-density lipoprotein; the adjusted model comprised the following covariates: age, sex, race, BMI, drinking status, and diabetes status.
Table 8
| Drinking status | TC (Hyper) | TG (Hyper) | ||||||
|---|---|---|---|---|---|---|---|---|
| Crude model | Adjusted model | Crude model | Adjusted model | |||||
| cOR (95% CI) | P-value | aOR (95% CI) | P-value | cOR (95% CI) | P-value | aOR (95% CI) | P-value | |
| Drinker | 0.031 | 0.148 | 0.015 | 0.584 | ||||
| Normal | Ref | Ref | Ref | Ref | ||||
| Hyper/Hypo | 0.764 (0.598, 0.976) | 0.829 (0.643, 1.069) | 1.242 (1.043, 1.479) | 1.053 (0.875, 1.267) | ||||
| Never drinker | 0.964 | 0.769 | 0.103 | 0.819 | ||||
| Normal | Ref | Ref | Ref | Ref | ||||
| Hyper/Hypo | 0.991 (0.678, 1.450) | 1.060 (0.718, 1.566) | 1.238 (0.958, 1.600) | 1.033 (0.785, 1.359) | ||||
| Drinking | HDL (Hypo) | LDL (Hyper) | ||||||
| Crude model | Adjusted model | Crude model | Adjusted model | |||||
| cOR (95% CI) | P-value | aOR (95% CI) | P-value | cOR (95% CI) | P-value | aOR (95% CI) | P-value | |
| Drinker | 0.003 | 0.045 | 0.002 | 0.055 | ||||
| Normal | Ref | Ref | Ref | Ref | ||||
| Hyper/Hypo | 1.560 (1.162, 2.096) | 1.367 (1.007, 1.855) | 1.414 (1.141, 1.754) | 1.245 (0.995, 1.558) | ||||
| Never drinker | 0.288 | 0.617 | 0.517 | 0.238 | ||||
| Normal | Ref | Ref | Ref | Ref | ||||
| Hyper/Hypo | 1.297 (0.803, 2.095) | 1.136 (0.690, 1.869) | 0.897 (0.646, 1.246) | 0.815 (0.581, 1.144) |
Odds ratios for associations between triglyceride and cholesterol levels and anti-HBs results stratified by drinking status.
The crude model only included total cholesterol, triglyceride, high-density lipoprotein, and low-density lipoprotein; the adjusted model comprised the following covariates: age, sex, race, BMI, smoking status, and diabetes status.
Table 9
| Diabetes status | TC (Hyper) | TG (Hyper) | ||||||
|---|---|---|---|---|---|---|---|---|
| Crude model | Adjusted model | Crude model | Adjusted model | |||||
| cOR (95% CI) | P-value | aOR (95% CI) | P-value | cOR (95% CI) | P-value | aOR (95% CI) | P-value | |
| Yes | 0.619 | 0.714 | 0.848 | 0.375 | ||||
| Normal | Ref | Ref | Ref | Ref | ||||
| Hyper/Hypo | 0.791 (0.315, 1.990) | 0.838 (0.324, 2.164) | 0.959 (0.623, 1.476) | 0.808 (0.504, 1.295) | ||||
| No | 0.072 | 0.289 | 0.014 | 0.385 | ||||
| Normal | Ref | Ref | Ref | Ref | ||||
| Hyper/Hypo | 0.823 (0.666, 1.017) | 0.889 (0.715, 1.105) | 1.213 (1.039, 1.417) | 1.075 (0.913, 1.265) | ||||
| Diabetes | HDL (Hypo) | LDL (Hyper) | ||||||
| Crude model | Adjusted model | Crude model | Adjusted model | |||||
| cOR (95% CI) | P- value | aOR (95% CI) | P-value | cOR (95% CI) | P-value | aOR (95% CI) | P-value | |
| Yes | 0.098 | 0.155 | 0.315 | 0.336 | ||||
| Normal | Ref | Ref | Ref | Ref | ||||
| Hyper/Hypo | 2.192 (0.865, 5.554) | 2.015 (0.767, 5.292) | 1.543 (0.662, 3.596) | 1.540 (0.639, 3.712) | ||||
| No | 0.006 | 0.084 | 0.022 | 0.413 | ||||
| Normal | Ref | Ref | Ref | Ref | ||||
| Hyper/Hypo | 1.446 (1.112, 1.881) | 1.270 (0.968, 1.666) | 1.239 (1.031, 1.490) | 1.083 (0.895, 1.311) |
Odds ratios for associations between triglyceride and cholesterol levels and anti-HBs results stratified by diabetes status.
The crude model only included total cholesterol, triglyceride, high-density lipoprotein, and low-density lipoprotein; the adjusted model comprised the following covariates: age, sex, race, BMI, smoking status, and drinking status.
As shown in Table 3, the association between hypo-HDL and hyper-LDL and negative anti-HBs results was significant among the 18- to 40-year-old group in the crude model (cOR = 1.643, 95% CI: 1.198, 2.253, p = 0.002; cOR = 1.421, 95% CI: 1.109, 1.820, p = 0.005, respectively), while after further adjustment for other covariates, the result was still statistically significant (aOR = 1.455, 95% CI: 1.050, 2.017, p = 0.024; aOR = 1.347, 95% CI: 1.043, 1.740, p = 0.022, respectively). We discovered no relationship between TC and TG and negative anti-HBs results among all age groups, as well as HDL and LDL in 40- to 60- year-old group and the older than 60 years group.
The relationships between the triglyceride and cholesterol levels and negative anti-HBs results stratified by sex are displayed in Table 4. We found a significant relationship between the TG and negative anti-HBs results in females (cOR = 1.319, 95% CI: 1.082, 1.608, p = 0.006) in the crude model, while after adjusting for all covariates, the difference was no longer statistically significant. HDL showed a positive relationship with negative anti-HBs results both in the crude model and adjusted model (cOR = 1.832, 95% CI: 1.137, 2.950, p = 0.013; aOR = 1.646, 95% CI: 1.011, 2.678, p = 0.045).
The results stratified by race are shown in Table 5. In the non-Hispanic white group, TC were positively associated with a negative anti-HBs result (cOR = 0.611, 95% CI: 0.445, 0.839, p = 0.002; aOR = 0.658, 95% CI: 0.475, 0.911, p = 0.012, respectively). Positive relationships about TG and HDL and anti-HBs result also appeared in the non-Hispanic white group in the crude model (cOR = 1.490, 95% CI: 1.205, 1.842, p < 0.001; cOR = 1.487, 95% CI: 1.046, 2.115, p = 0.027), while the results showed negative in the adjusted model.
We performed the results stratified by BMI in Table 6. In the obese group, whether in the crude model or in the adjusted model, the hyper-LDL level was a risk factor for a negative anti-HBs result (cOR = 1.371, 95% CI: 1.027, 1.829, p = 0.032; aOR = 1.364, 95% CI: 1.014, 1.833, p = 0.040). TC only showed significant result in the obese group in the crude model rather than the adjusted model. In the underweight group, the normal-weight group, and the overweight group, however, the results showed no statistical significance.
Table 7 showed the results stratified by smoking status. In the never smoking group, TC and TG showed a positive relationship with anti-HBs results only in the crude model. At the same time, we found a significant relationship between the HDL and negative anti-HBs results in the smoker group both in the crude model and in the adjusted model (cOR = 1.671, 95% CI: 1.164, 2.400, p = 0.005; aOR = 1.608, 95% CI: 1.111, 2.327, p = 0.012).
The results classified by drinking status are shown in Table 8. In the crude model, the TC, TG, HDL, and LDL were all positively associated with a negative anti-HBs result in the drinker group. However, after adjusting for all covariates, the difference was only existed in the relationship between the HDL level and anti-HBs result (aOR = 1.367, 95% CI: 1.007, 1.855, p = 0.012). In the never drinker group, the results showed no statistical significance.
At last, we performed subgroup analyses divided by diabetes status (Table 9). In the no diabetes group, the results discovered the TG, HDL, and LDL all had positive relation with a negative anti-HBs result, while the adjusted model showed negative results.
4. Discussion
This was a cross-sectional study to assess the relationship between the TG and cholesterol levels and negative anti-HBs result among 4,959 individuals aged 18 years and older in the United States. Our results demonstrated that higher TC level was showed a positive relationship with a positive anti-HBs result among participants who were Non-Hispanic white; HDL level was associated with a negative anti-HBs result among participants aged 18- to 40-year-old, participants who were female, participants who were smoking more than 100 cigarettes in life, and drinking more than 12 times every year; LDL level was associated with a negative anti-HBs result among participants aged 18- to 40-year-old, and participants who were obese. Generally, we found that the cholesterol level was related to a negative anti-HBs result, rather than hypertriglyceridemia. High level of HDL and low level of LDL may be protective factors of better immune effect of hepatitis B vaccine.
Recognized as the most effective and affordable tool to prevent HBV infection, the hepatitis B vaccine has been widely used since its launch in 1982, resulting in dramatic reductions in the HBV carrier rate as well as hepatitis B-related morbidity and mortality (3, 17). Despite great achievements, there are still some challenges associated with hepatitis B immunization. One of the crucial challenges is nonresponse or low response to the hepatitis B vaccine. This may be due to the types of vaccines, doses, procedures and other attributes of vaccination but may also be due to certain recipient factors. Studies have shown that older age, obesity, genetic factors, etc., can affect the immune effect of the hepatitis B vaccine (18, 19). To date, there have been few related reports on the influence of TG or cholesterol levels. Our study found that the cholesterol level may affect individuals aged 18–40 years rather than elderly individuals. A systematic review of 30 years of experience by Ende C and colleagues indicated that people aged 60 years and older are less likely to exhibit a seroprotective response to the hepatitis B vaccine (5). Hence, other effects of old age, such as degeneration of immune function, are more prominent in elderly individuals, while the effect of the cholesterol level is more pronounced in relatively young recipients. Liu et al. discovered that people with BMI more than 25 kg/m2 compared to less than 25 kg/m2 were less prone to respond to the hepatitis B vaccine, and the risk of non-responsiveness among obese people increased with BMI (20). Our study showed that the LDL level was more conspicuous in obese subjects than in normal-weight subjects. We expected that the effect of obesity would be more pronounced than that of LDL. Interestingly, we found higher TC level was showed a positive relationship with a positive anti-HBs result among participants who were Non-Hispanic white. Differences in different ethnic groups may also be caused by the confounding of genetic factors. According to previous studies, smoking and drinking may be potential adverse factors in the immune effect of hepatitis B vaccine. Our results showed that the protective effect of HDL was more pronounced in the smoking and drinking groups.
At present, there is basically no published research on the immune responses of TG and cholesterol on the hepatitis B vaccine. Previous studies have focused more on the effect of obesity (20, 21). They found that obesity was significantly related to a nonresponse to the hepatitis B vaccine, potentially due to mechanisms such as leptin-induced systemic and B-cell intrinsic inflammation (22, 23), impaired T-cell responses (24), oxidative stress, and chronic low-grade inflammation (25, 26). High blood cholesterol and triglyceride are common comorbidities in obesity (27). The prevalence of hypertriglyceridemia in adults is approximately 10 % with considerable geographical differences (28–31). The effect of TG and cholesterol on vaccine immune responses has not yet been reported. As metabolic diseases, such as obesity, with some similar pathogenic mechanisms, the relationship between hypertriglyceridemia and cholesterol disorder and the immune responses to the hepatitis B vaccine was to be explored. Cholesterol homeostasis is critical for the maintenance of cellular and body activities, and is controlled by a series of rigorous regulatory mechanisms (32). Besides, the cholesterol signal pathway plays a role in the immune response through sterol response element-binding protein (SREBP) (13). HDL cholesterol, traditionally been considered the “good cholesterol” as high plasma levels are strongly associated with a lower risk of atherosclerotic cardiovascular disease (ASCVD) (33), may also play an important role in innate and adaptive immunity supported by the ability to regulate the availability of cholesterol in immune cells. We speculate that these underlying mechanisms may play a role in the process of cholesterol affecting the immune effect of hepatitis B vaccine, of course, this needs to be verified by more and more in-depth studies in the future.
Our research had several limitations. First, the limitation of a cross-sectional study prevented us from definitively identifying causal relationships. In addition, although we adjusted for some potential confounding factors, limited by the source of the original data, we were unable to obtain data on factors such as vaccine variety and dose, familial hypercholesterolemia and hypertriglyceridemia, etc., which may be important unadjusted confounding factors that could affect the results of this study. Moreover, the time interval between anti-HBs assessment and hepatitis B vaccination was unknown. Because anti-HBs concentrations gradually decline over time, this suggests that the two groups of individuals included are not so comparable, which may affect the results to some extent. More research should be conducted to investigate the influence of the cholesterol level on the immune responses to the hepatitis B vaccine, and more in-depth research should be performed to uncover the mechanism.
Funding
This work was supported by the Chinese Foundation for Hepatitis Prevention and Control, No. YGFK20190041.
Publisher’s note
All claims expressed in this article are solely those of the authors and do not necessarily represent those of their affiliated organizations, or those of the publisher, the editors and the reviewers. Any product that may be evaluated in this article, or claim that may be made by its manufacturer, is not guaranteed or endorsed by the publisher.
Statements
Data availability statement
The original contributions presented in the study are included in the article/Supplementary material, further inquiries can be directed to the corresponding author.
Ethics statement
The studies involving human participants were reviewed and approved by the Ethics Committee of the Affiliated Jiangning Hospital of Nanjing Medical University. The patients/participants provided their written informed consent to participate in this study. Written informed consent was obtained from the individual(s) for the publication of any potentially identifiable images or data included in this article.
Author contributions
DG formulated the idea for this study and wrote the first draft of the manuscript. DG, JD, and RJ performed the analyses. QZ, NW, CW, HT, HJ, CZ, JM, and JX participated in sample collection and critically reviewed the manuscript. All authors contributed to the article and approved the submitted version.
Conflict of interest
The authors declare that the research was conducted in the absence of any commercial or financial relationships that could be construed as a potential conflict of interest.
Supplementary material
The Supplementary material for this article can be found online at: https://www.frontiersin.org/articles/10.3389/fmed.2023.1131373/full#supplementary-material
References
1.
Rémy V Largeron N Quilici S Carroll S . The economic value of vaccination: why prevention is wealth. J Mark Access Health Policy. (2015) 3:3. doi: 10.3402/jmahp.v3.29284
2.
Nayagam S Thursz M Sicuri E Conteh L Wiktor S Low-Beer D et al . Requirements for global elimination of hepatitis B: a modelling study. Lancet Infect Dis. (2016) 16:1399–408. doi: 10.1016/s1473-3099(16)30204-3
3.
Wiesen E Diorditsa S Li X . Progress towards hepatitis B prevention through vaccination in the Western Pacific, 1990-2014. Vaccine. (2016) 34:2855–62. doi: 10.1016/j.vaccine.2016.03.060
4.
Ni YH Chang MH Jan CF Hsu HY Chen HL Wu JF et al . Continuing decrease in hepatitis B virus infection 30 years after initiation of infant vaccination program in Taiwan. Clin Gastroenterol Hepatol. (2016) 14:1324–30. doi: 10.1016/j.cgh.2016.04.030
5.
Van Den Ende C Marano C Van Ahee A Bunge EM De Moerlooze L . The immunogenicity and safety of GSK's recombinant hepatitis B vaccine in adults: a systematic review of 30 years of experience. Expert Rev Vaccines. (2017) 16:811–32. doi: 10.1080/14760584.2017.1338568
6.
Tagliabue C Principi N Giavoli C Esposito S . Obesity: impact of infections and response to vaccines. Eur J Clin Microbiol Infect Dis. (2016) 35:325–31. doi: 10.1007/s10096-015-2558-8
7.
Andersen CJ Murphy KE Fernandez ML . Impact of obesity and metabolic syndrome on immunity. Adv Nutr. (2016) 7:66–75. doi: 10.3945/an.115.010207
8.
Karlsson EA Beck MA . The burden of obesity on infectious disease. Exp Biol Med (Maywood). (2010) 235:1412–24. doi: 10.1258/ebm.2010.010227
9.
Painter SD Ovsyannikova IG Poland GA . The weight of obesity on the human immune response to vaccination. Vaccine. (2015) 33:4422–9. doi: 10.1016/j.vaccine.2015.06.101
10.
Laufs U Parhofer KG Ginsberg HN Hegele RA . Clinical review on triglycerides. Eur Heart J. (2020) 41:99–109c. doi: 10.1093/eurheartj/ehz785
11.
Brown MS Radhakrishnan A Goldstein JL . Retrospective on cholesterol homeostasis: the central role of Scap. Annu Rev Biochem. (2018) 87:783–807. doi: 10.1146/annurev-biochem-062917-011852
12.
Zhou T Zhan J Fang W Zhao Y Yang Y Hou X et al . Serum low-density lipoprotein and low-density lipoprotein expression level at diagnosis are favorable prognostic factors in patients with small-cell lung cancer (SCLC). BMC Cancer. (2017) 17:269. doi: 10.1186/s12885-017-3239-z
13.
Munteanu C Schwartz B . The relationship between nutrition and the immune system. Front Nutr. (2022) 9:1082500. doi: 10.3389/fnut.2022.1082500
14.
Catapano AL Pirillo A Bonacina F Norata GD . HDL in innate and adaptive immunity. Cardiovasc Res. (2014) 103:372–83. doi: 10.1093/cvr/cvu150
15.
Zhang Y Dong T Hu W Wang X Xu B Lin Z et al . Association between exposure to a mixture of phenols, pesticides, and phthalates and obesity: comparison of three statistical models. Environ Int. (2019) 123:325–36. doi: 10.1016/j.envint.2018.11.076
16.
Kim S Kim S Won S Choi K . Considering common sources of exposure in association studies - urinary benzophenone-3 and DEHP metabolites are associated with altered thyroid hormone balance in the NHANES 2007-2008. Environ Int. (2017) 107:25–32. doi: 10.1016/j.envint.2017.06.013
17.
Anderson CL Remschmidt C Drobnitzky FP Falkenhorst G Zimmermann R Wichmann O et al . Hepatitis B immune status in adolescents vaccinated during infancy: a retrospective cohort study from a pediatric practice in Germany. Hum Vaccin Immunother. (2016) 12:779–84. doi: 10.1080/21645515.2015.1105414
18.
Young KM Gray CM Bekker LG . Is obesity a risk factor for vaccine non-responsiveness?PLoS One. (2013) 8:e82779. doi: 10.1371/journal.pone.0082779
19.
Yang S Tian G Cui Y Ding C Deng M Yu C et al . Factors influencing immunologic response to hepatitis B vaccine in adults. Sci Rep. (2016) 6:27251. doi: 10.1038/srep27251
20.
Liu F Guo Z Dong C . Influences of obesity on the immunogenicity of hepatitis B vaccine. Hum Vaccin Immunother. (2017) 13:1014–7. doi: 10.1080/21645515.2016.1274475
21.
Fan W Chen XF Shen C Guo ZR Dong C . Hepatitis B vaccine response in obesity: a meta-analysis. Vaccine. (2016) 34:4835–41. doi: 10.1016/j.vaccine.2016.08.027
22.
Frasca D Diaz A Romero M Mendez NV Landin AM Ryan JG et al . Young and elderly patients with type 2 diabetes have optimal B cell responses to the seasonal influenza vaccine. Vaccine. (2013) 31:3603–10. doi: 10.1016/j.vaccine.2013.05.003
23.
Papathanassoglou E El-Haschimi K Li XC Matarese G Strom T Mantzoros C . Leptin receptor expression and signaling in lymphocytes: kinetics during lymphocyte activation, role in lymphocyte survival, and response to high fat diet in mice. J Immunol. (2006) 176:7745–52. doi: 10.4049/jimmunol.176.12.7745
24.
Park HL Shim SH Lee EY Cho W Park S Jeon HJ et al . Obesity-induced chronic inflammation is associated with the reduced efficacy of influenza vaccine. Hum Vaccin Immunother. (2014) 10:1181–6. doi: 10.4161/hv.28332
25.
Njajou OT Cawthon RM Blackburn EH Harris TB Li R Sanders JL et al . Shorter telomeres are associated with obesity and weight gain in the elderly. Int J Obes. (2012) 36:1176–9. doi: 10.1038/ijo.2011.196
26.
Duong MT Sahin E . RAP1: protector of telomeres, defender against obesity. Cell Rep. (2013) 3:1757–8. doi: 10.1016/j.celrep.2013.06.011
27.
Must A Spadano J Coakley EH Field AE Colditz G Dietz WH . The disease burden associated with overweight and obesity. JAMA. (1999) 282:1523–9. doi: 10.1001/jama.282.16.1523
28.
Dron JS Wang J Cao H McIntyre AD Iacocca MA Menard JR et al . Severe hypertriglyceridemia is primarily polygenic. J Clin Lipidol. (2019) 13:80–8. doi: 10.1016/j.jacl.2018.10.006
29.
Hegele RA Ginsberg HN Chapman MJ Nordestgaard BG Kuivenhoven JA Averna M et al . The polygenic nature of hypertriglyceridaemia: implications for definition, diagnosis, and management. Lancet Diabetes Endocrinol. (2014) 2:655–66. doi: 10.1016/s2213-8587(13)70191-8
30.
Retterstøl K Narverud I Selmer R Berge KE Osnes IV Ulven SM et al . Severe hypertriglyceridemia in Norway: prevalence, clinical and genetic characteristics. Lipids Health Dis. (2017) 16:115. doi: 10.1186/s12944-017-0511-9
31.
Truthmann J Schienkiewitz A Busch MA Mensink GB Du Y Bosy-Westphal A et al . Changes in mean serum lipids among adults in Germany: results from National Health Surveys 1997-99 and 2008-11. BMC Public Health. (2016) 16:240. doi: 10.1186/s12889-016-2826-2
32.
Luo J Yang H Song BL . Mechanisms and regulation of cholesterol homeostasis. Nat Rev Mol Cell Biol. (2020) 21:225–45. doi: 10.1038/s41580-019-0190-7
33.
Di Angelantonio E Sarwar N Perry P Kaptoge S Ray KK Thompson A et al . Major lipids, apolipoproteins, and risk of vascular disease. JAMA. (2009) 302:1993–2000. doi: 10.1001/jama.2009.1619
Summary
Keywords
hepatitis B vaccine, triglyceride (TG), cholesterol, high-density lipoprotein (HDL), low-density lipoprotein (LDL), immune response
Citation
Guo D, Dai J, Ju R, Zhou Q, Wang N, Wu C, Tao H, Jing H, Zhu C, Mao J and Xu J (2023) The relationship between triglyceride, cholesterol and lipoprotein levels, and immune responses to hepatitis B vaccine. Front. Med. 10:1131373. doi: 10.3389/fmed.2023.1131373
Received
25 December 2022
Accepted
13 March 2023
Published
30 March 2023
Volume
10 - 2023
Edited by
Zhimin Tao, Jiangsu University, China
Reviewed by
Ekaterina Kolesanova, Russian Academy of Medical Sciences (RAMS), Russia; Guoxin Liang, China Medical University, China
Updates
Copyright
© 2023 Guo, Dai, Ju, Zhou, Wang, Wu, Tao, Jing, Zhu, Mao and Xu.
This is an open-access article distributed under the terms of the Creative Commons Attribution License (CC BY). The use, distribution or reproduction in other forums is permitted, provided the original author(s) and the copyright owner(s) are credited and that the original publication in this journal is cited, in accordance with accepted academic practice. No use, distribution or reproduction is permitted which does not comply with these terms.
*Correspondence: Dan Guo, 15251761625@163.com
†These authors have contributed equally to this work and share first authorship
This article was submitted to Infectious Diseases: Pathogenesis and Therapy, a section of the journal Frontiers in Medicine
Disclaimer
All claims expressed in this article are solely those of the authors and do not necessarily represent those of their affiliated organizations, or those of the publisher, the editors and the reviewers. Any product that may be evaluated in this article or claim that may be made by its manufacturer is not guaranteed or endorsed by the publisher.