 Jian Huang
 Ying Gui1
- 1Clinical Laboratory Center, The First Affiliated Hospital of Guangxi Medical University, Nanning, China
- 2Department of Anesthesiology, The First Affiliated Hospital of Guangxi Medical University, Nanning, China
- 3Guangxi Key Laboratory of Enhanced Recovery After Surgery for Gastrointestinal Cancer, The First Affiliated Hospital of Guangxi Medical University, Nanning, China
Background: The relationship between socioeconomic status and frailty has been extensively investigated in the literature, but it remains unclear whether a causal relationship exists. Our goal is to evaluate the causal relationship between six socioeconomic traits and the frailty index using summary-level data for single nucleotide polymorphisms from large genome-wide association studies with individuals of European ancestry.
Methods: A two-sample MR was performed. We applied the inverse variance weighted (IVW) method for the primary estimate, with sensitivity analyses conducted using alternative MR methods to evaluate the robustness of the findings. A subsequent multivariable MR was undertaken to adjust for the effects of body mass index (BMI). Finally, the MR Steiger directionality test was performed to confirm the causal direction.
Results: The IVW MR analysis revealed significant associations between various socioeconomic factors and the frailty index. Specifically, genetically predicated age completed full time education (β = −0.477, 95% confidence interval [CI]: −0.634 to −0.319) and average total household income before tax (β = −0.321, 95% CI: −0.410 to −0.232) were negatively associated with the frailty index. On the other hand, genetically predicted job involves heavy manual or physical work (β = 0.298, 95% CI: 0.113 to 0.484), job involves mainly walking or standing (β = 0.179, 95% CI: 0.013 to 0.345), Townsend deprivation index at recruitment (β = 0.535, 95% CI: 0.285 to 0.785), and social isolation/loneliness (β = 1.344, 95% CI: 0.834 to 1.853) were positively associated with the frailty index. Sensitivity analysis using other MR methods and multivariable MR analysis adjusting for BMI yielded stable results. The MR Steiger directionality test confirmed the causal direction.
Conclusion: Our findings highlight the importance of socioeconomic factors in affecting frailty risk. Future research should focus on unraveling the pathways through which these socioeconomic factors exert their effects on frailty, with the ultimate goal of developing targeted strategies to mitigate the risk of frailty.
Introduction
Frailty is a significant indicator of aging, characterized by a decrease in functional capacity and heightened susceptibility to illness (1). It is estimated that the prevalence of frailty in the general population is around 14% (2). Due to the aging population, its incidence continues to rise. Frailty is strongly associated with various unfavorable health outcomes, including depression, dementia, physical disability, hospitalization, reduced quality of life, and increased mortality (1, 3, 4). It is widely acknowledged that frailty is one of the gravest public health concerns of the 21st century. Therefore, knowledge of the factors that contribute to frailty is vital to determine the specific population groups who may benefit from interventions aimed at preventing frailty.
Over the past two decades, a number of epidemiological studies have evaluated the association between socioeconomic status and frailty. Aspects related to socioeconomic status in this context include education, job, income, and social activity. Many researchers have reported that educational attainment, job-related characteristics, economic status, and social isolation are associated with frailty (5–10). In their study based on nationally representative samples of adults aged 50 years and older, Harttgen and colleagues observed that individuals with lower levels of education and income displayed a higher incidence of frailty (5). Using a cross-sectional study design, de Amorim and coworkers found that the prevalence of frailty was significantly higher among elderly individuals with low levels of education, who worked in unhealthy/dangerous environments and whose job primarily involved physical labor (6). Moreover, the study by Tatoli et al. (10) reported that socioeconomic status may impact health outcomes among the elderly population by influencing their diet and eating habits. A recent systematic review summarized 21 studies covering a wide range of geographic population and emphasize on the importance of socioeconomic status on frailty development (11). However, different results were also reported. The study by Delbari et al. (12), which focused on a random sample of adults aged 60 years and above from five Southwest cities in Iran, did not demonstrate any significant link between education attainment, income, and frailty. Goodyer et al. also did not find an association between socioeconomic position and frailty among elderly people seen by the specialty frailty service (13). It should be noted that inconsistent findings were evident in the literature. In addition, although some authors suggested a link between socioeconomic status and frailty, causality could not be inferred in their studies due to the limitations of conventional epidemiological methods. These limitations primarily stemmed from the inability to control for possible confounding variables and the potential for bias in study design or data collection. Additionally, the lack of randomization in observational studies introduced the possibility of unmeasured or residual confounding, further complicating the interpretation of findings.
Mendelian randomization (MR) is a powerful causal inference technique for probing the causal association between modifiable exposures and economic, social, and health outcomes (14). When specific assumptions are satisfied, the utilization of genetic variants as instrumental variables can help mitigate concerns regarding reverse causation and confounding biases, thereby strengthening inferences drawn from observational studies. The aim of this study was to use MR analyses to estimate the causal effects of socioeconomic traits, including genetically predicted age completed full time education, job involves heavy manual or physical work, job involves mainly walking or standing, average total household income before tax, Townsend deprivation index at recruitment, and social isolation/loneliness on frailty.
Methods
Ethical approval
This MR study was exempt from Institutional Review Board ethical approval due to the utilization of publicly accessible de-identified summary statistics.
Study design
Utilizing summary-level genetic data from large-sample genomewide association studies (GWASs), we implemented a two sample MR study design in the present study (Figure 1). There exist three essential assumptions that need to be fulfilled in order to guarantee the validity of an MR study, namely: (a) the genetic variants used as instruments ought to exhibit a strong correlation with the targeted risk factor; (b) confounding variables do not affect the relationship between the genetic variants and the outcome; and (c) the genetic variants only affect the outcome through the risk factor.
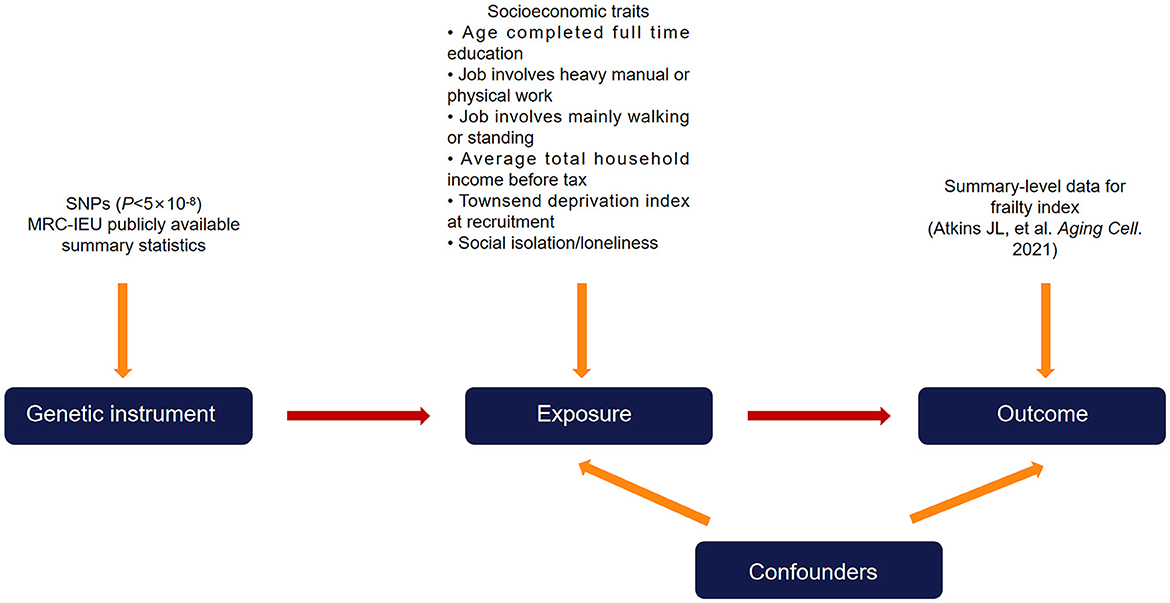
Figure 1. Diagram of the two-sample Mendelian randomization study design. Single nucleotide polymorphisms that are significantly associated with the exposure (socioeconomic traits) from publicly available summary-level data were used as instrumental variables. The instrumental variables affect the outcome (frailty index) exclusively through the exposure and not through other pathways.
Genetic data on exposures
Single nucleotide polymorphisms (SNPs) were extracted from summary-level statistics for age completed full time education (N = 307,897), job involves heavy manual or physical work (N = 263,615), job involves mainly walking or standing (N = 263,556), average total household income before tax (N = 397,751), townsend deprivation index at recruitment (N = 462,464), and social isolation/loneliness (N = 455,364) from the Medical Research Council Integrative Epidemiology Unit (MRC-IEU) OpenGWAS data infrastructure (15). The GWASs on these exposures were performed in UK Biobank participants. Within the UK Biobank cohort, more than 500,000 individuals were recruited across Scotland, England, and Wales from 2006 to 2010, ranging in age from 40 to 69 years. To mitigate any potential influence from population stratification, we exclusively selected individuals of European ancestry for inclusion in the exposure datasets. For each exposure, the threshold for instrumental SNP extraction was set at P < 5 × 10⁻⁸ (genome-wide significance). The estimation of linkage disequilibrium between these SNPs was conducted utilizing the European subset of 1,000 Genomes (16). We did not consider SNPs with an estimated linkage disequilibrium greater than an r2 value of 0.001. Palindromic SNPs were not included in the MR analyses. The F-statistics for instrument strength were calculated in our study as previously described (17); generally, a value >10 for this statistic indicates adequate strength. Table 1 shows the details on the summary statistics used for MR analyses. Supplementary Table 1 presents detailed information on the six socioeconomic traits.
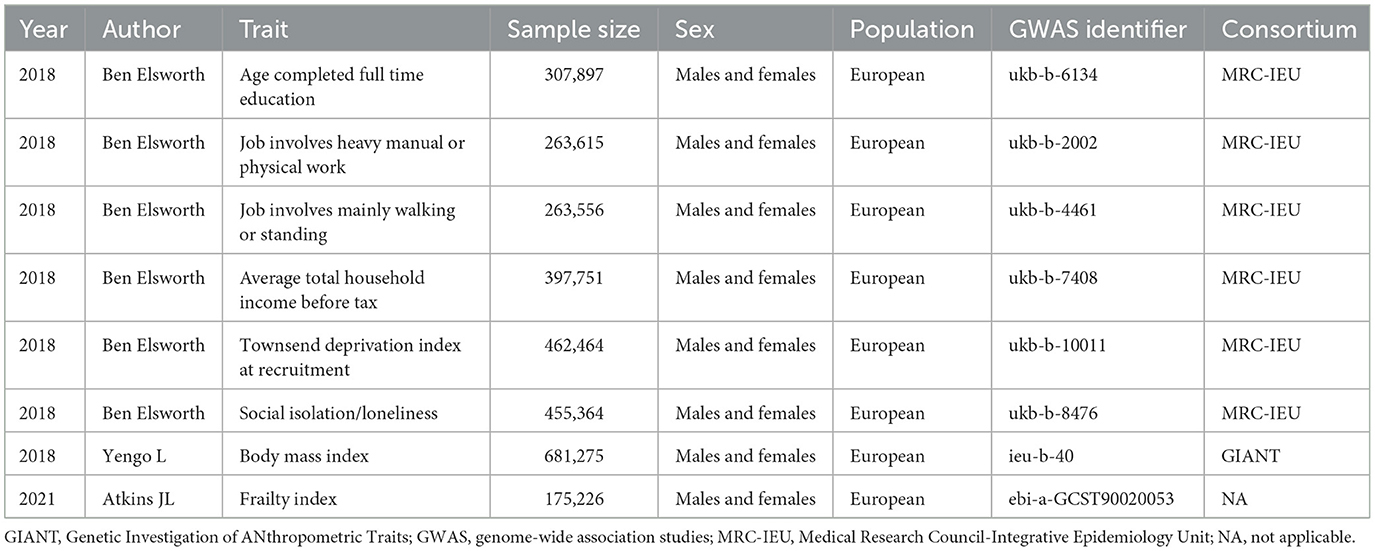
Table 1. The GWAS datasets used in the present Mendelian randomization study.
Genetic data on frailty
A recent meta-analysis of genome-wide association studies conducted in the UK Biobank and Swedish TwinGene (18), involving 175,226 participants of European descent, yielded summary statistics for frailty measured using the frailty index. In the UK Biobank study, the samples had an age range of 60 to 70 years, with a mean age of 64.1 years and a standard deviation (SD) of 2.8. The participants in the Swedish TwinGene study, on the other hand, were aged between 41 and 87 years, with a mean age of 58.3 years and a SD of 7.9. The frailty index, well-validated in the literature, is widely utilized as a measure of frailty in clinical practice (19). In order to calculate the frailty index, the researchers utilized self-reported data on symptoms, disabilities, and diagnosed diseases. This was done using 49 items for UK Biobank and 44 items for TwinGene (18). More detailed information can be referred to the original study (18).
Statistical analyses
The primary analysis focused on evaluating the association between frailty and socioeconomic traits through the use of an inverse variance weighted (IVW) two-sample MR technique (20). For each exposure, the contribution of each instrumental SNP to the risk of frailty was evaluated through a weighting process, considering its effect on the exposure using the Wald ratio method (21). By employing a random effect inverse-variance meta-analysis, these individual estimates obtained from MR were pooled together. Despite the IVW method's ability to provide the most accurate causal estimations, it can be affected by pleiotropy and outlying SNPs (21). Therefore, by employing alternative MR approaches, we were able to generate unbiased estimates, even when dealing with potentially invalid genetic instruments. We considered four alternative MR techniques, including MR-Egger, weighted median, maximum likelihood, and MR-pleiotropy residual sum and outlier (MR-PRESSO). Moreover, by implementing leave-one-out analysis, each SNP was sequentially omitted to observe the individual influences on the causal association determined by the IVW method. To evaluate the existence of horizontal pleiotropy, we relied on the P-value obtained from the intercept test in MR-Egger regression (22). The Cochran's Q test was employed to evaluate the heterogeneity among MR estimates generated by different SNPs (23). The application of Steiger directionality test allowed us to evaluate the direction of causality (24). By comparing the connection of the instrumental variables with both the exposure and the outcome, the Steiger directionality test evaluates the phenotypic variance accounted for by instrumental SNPs to verify the correctness of the assumed causal direction (24). Previous observational studies and MR investigations revealed that BMI may be an important risk factor for frailty (25–28). The MR study by Zhang et al. (27) found that genetically predicted one-SD increase in BMI was associated with higher risk of frailty (β = 0.118. 95% CI: 0.079 to 0.158, P = 4.4 × 10⁻⁹). Another MR study by Gu and colleagues also demonstrated that an increase in BMI by one SD lead to an increased probability of frailty (28). Thus, besides univariable MR, multivariable MR was conducted controlling for BMI (GWAS identifier: ieu-b-40) (Table 1).
The “TwoSampleMR” and “MR-PRESSO” packages were employed for all the analyses in R version 4.1.0. These packages facilitates data formatting, harmonization, and utilization of MR techniques in a partially automated way (15, 24).
Results
The number of instrument SNPs predicting age completed full time education, job involves heavy manual or physical work, job involves mainly walking or standing, average total household income before tax, Townsend deprivation index at recruitment, and social isolation/loneliness were 37, 24, 15, 42, 17, and 16, respectively. The characteristic features of the instrument SNPs for each exposure, including beta values, standard error, effect allele, other allele, rsID, F-statistics, etc., are represented in Supplementary Tables 2–7. Each of the instrumental variables displayed an F-statistic of greater than or equal to 16, surpassing the standard cutoff of >10, thereby suggesting a strong instrumental strength.
Results from the MR analyses are visualized in Figure 2, while Table 2 presents the corresponding data. In univariable IVW MR analysis, genetically predicated age completed full time education (β = −0.477, 95% confidence interval [CI]: −0.634 to −0.319, P = 2.995 × 10⁻¹¹) and average total household income before tax (β = −0.321, 95% CI: −0.410 to −0.232, P = 2.810 × 10⁻¹²) were negatively associated with the frailty index, while genetically predicted job involves heavy manual or physical work (β = 0.298, 95% CI: 0.113 to 0.484, P = 1.490 × 10⁻³), job involves mainly walking or standing (β = 0.179, 95% CI: 0.013 to 0.345, P = 3.452 × 10⁻²), Townsend deprivation index at recruitment (β = 0.535, 95% CI: 0.285 to 0.785, P = 2.715 × 10⁻⁵), and social isolation/loneliness (β = 1.344, 95% CI: 0.834 to 1.853, P = 2.367 × 10⁻⁷) were positively associated with the frailty index. Across a range of sensitivity analyses, including those utilizing weighted median, maximum likelihood, and MR-PRESSO methods, the MR estimates observed remained largely consistent (Table 2). There was no evidence of possible pleiotropy based on the intercept in the MR-Egger regression except for the analysis of Townsend deprivation index at recruitment (Table 3). However, MR-PRESSO did not detect any outlying SNPs for Townsend deprivation index at recruitment. Heterogeneity was observed in the analyses for all exposures (Table 3).
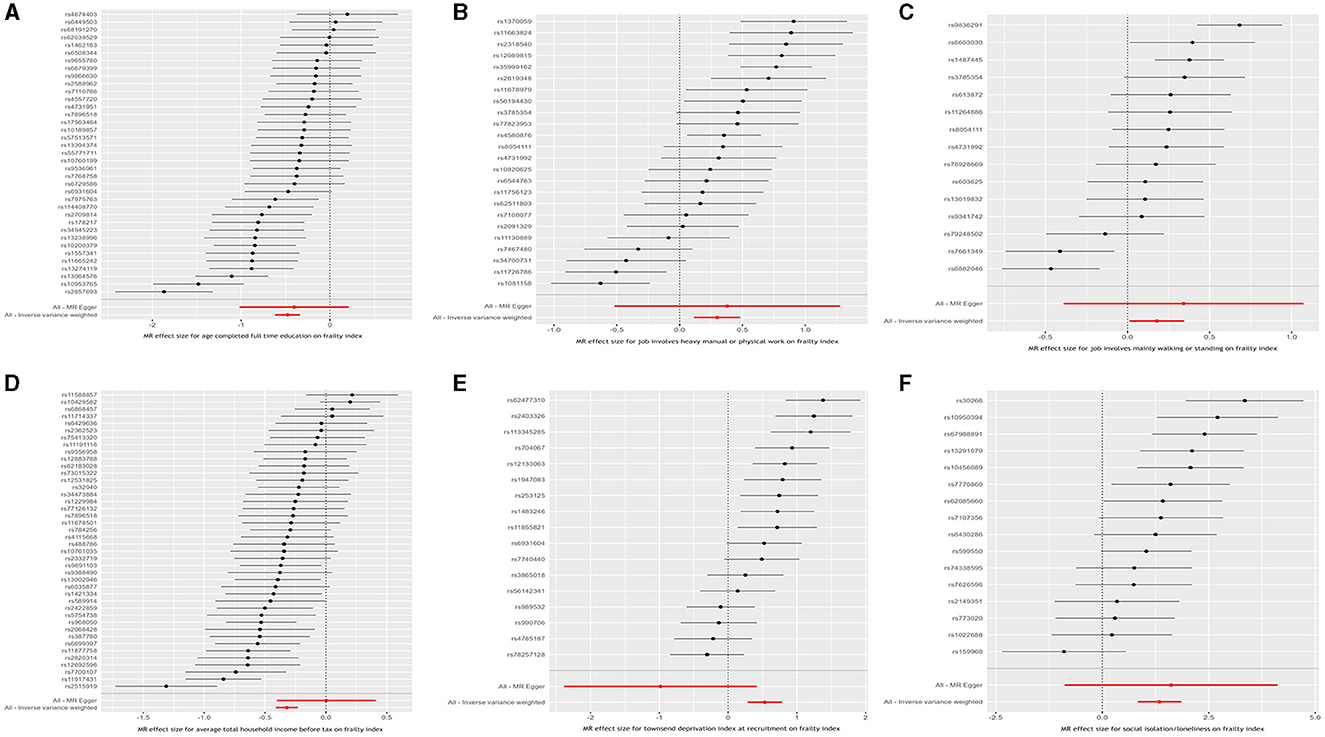
Figure 2. Inverse variance weighted Mendelian randomization estimates for the causal relationship between six socioeconomic traits and the frailty index. (A) Age completed full time education; (B) Job involves heavy manual or physical work; (C) Job involves mainly walking or standing; (D) Average total household income before tax; (E) Townsend deprivation index at recruitment; and (F) Social isolation/loneliness.
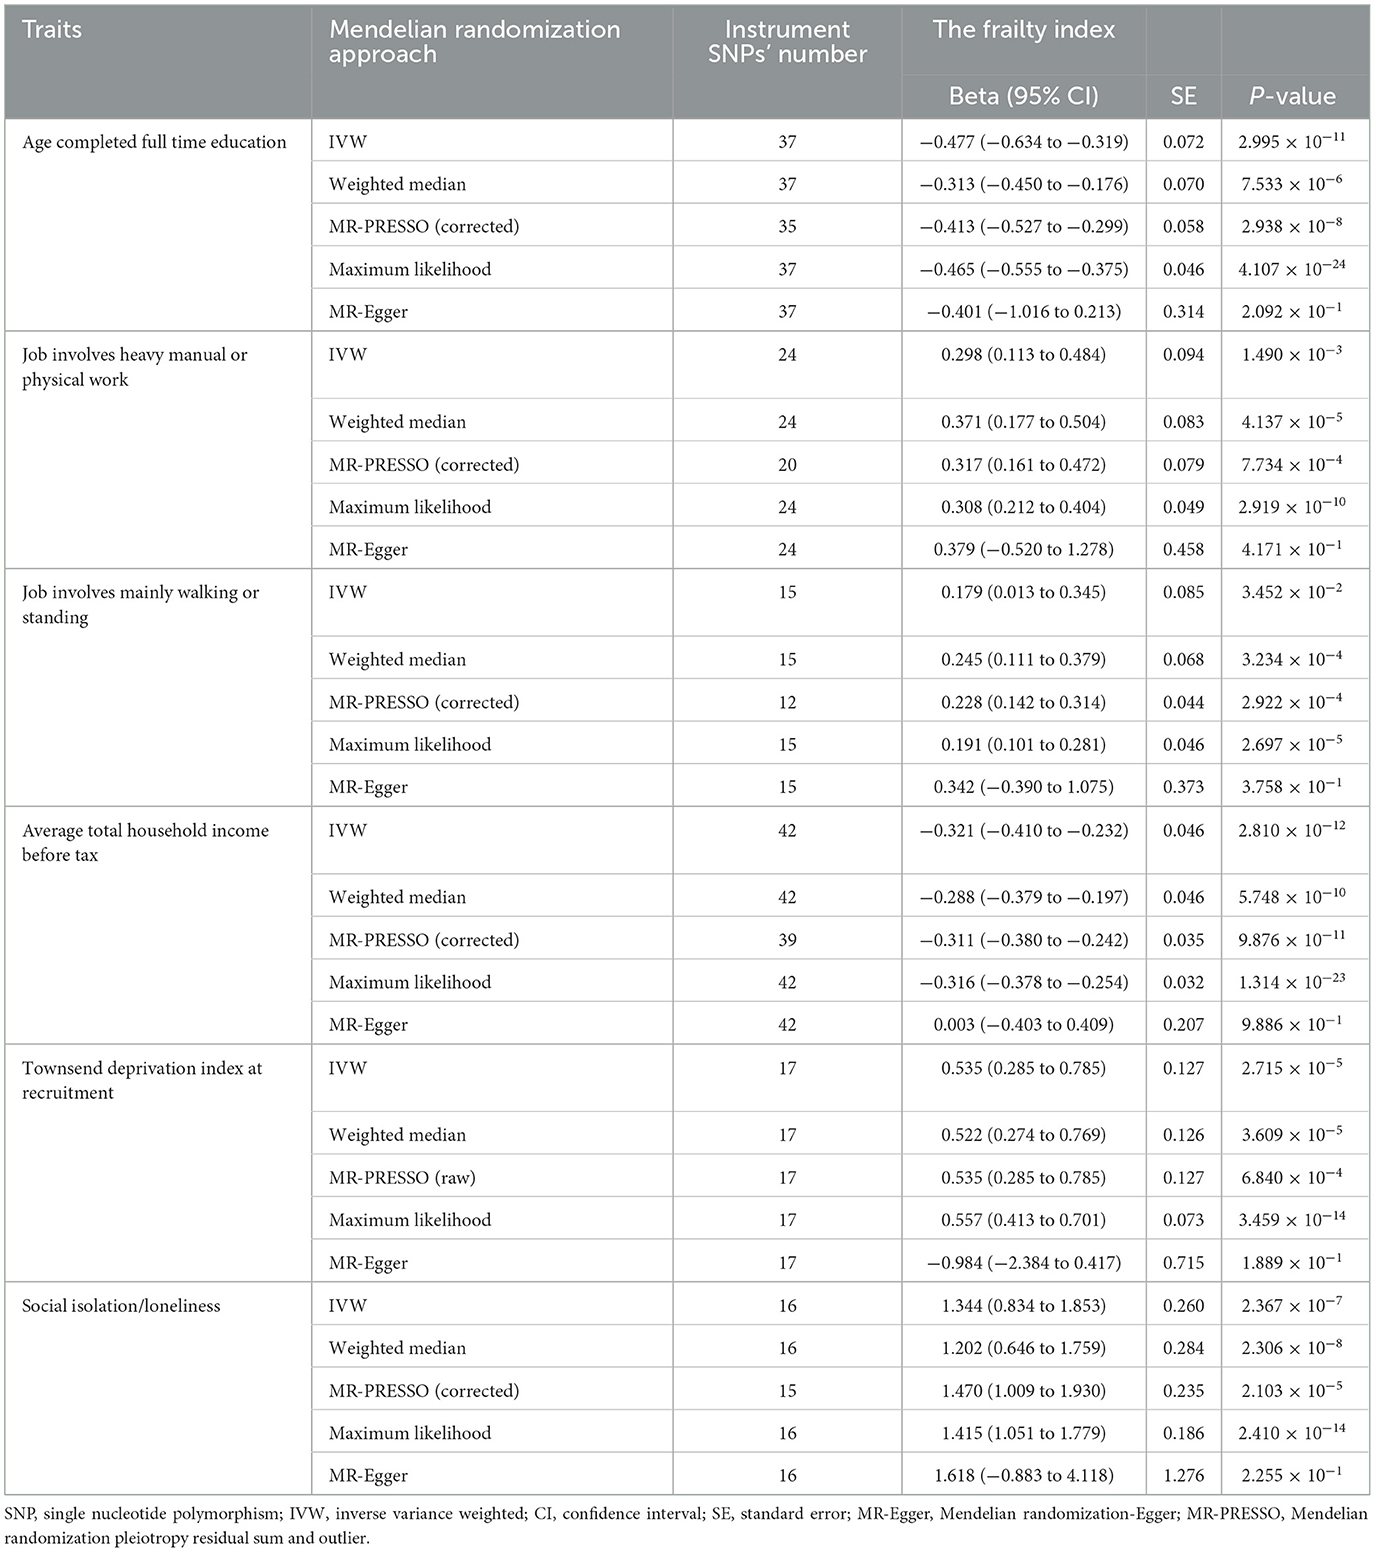
Table 2. Results of Mendelian randomization analysis for the causal effects of socioeconomic traits on the frailty index.
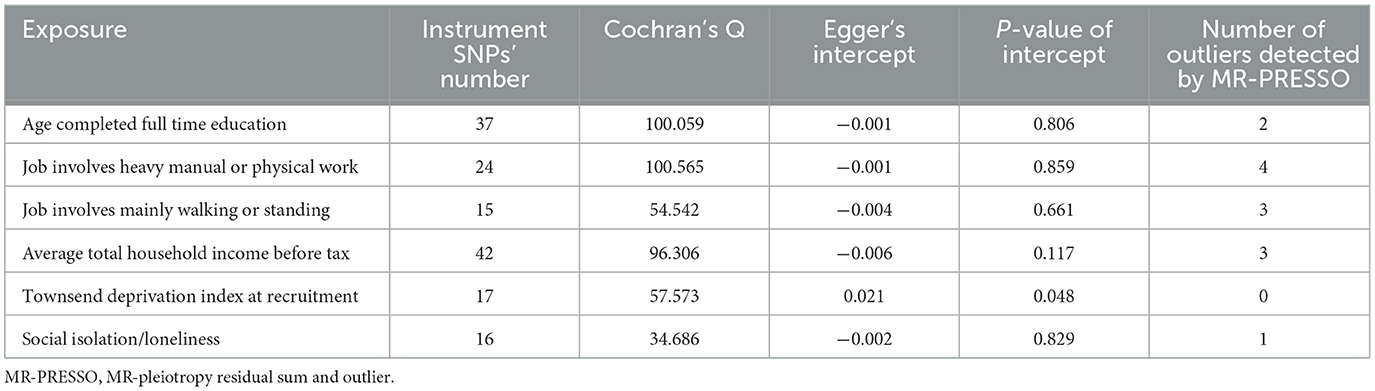
Table 3. Evaluation of heterogeneity and pleiotropy of the Mendelian randomization analyses.
In multivariable MR analysis adjusting for genetically predicted BMI, the negative associations of genetically predicted age completed full time education (β = −0.374, 95% CI: −0.493 to −0.255, P = 5.379 × 10⁻¹⁰; 5 SNPs) and average total household income before tax (β = −0.258, 95% CI: −0.343 to −0.173, P = 3.018 × 10⁻⁹, 11 SNPs) with the frailty index and the positive associations of genetically predicted job involves heavy manual or physical work (β = 0.310, 95% CI: 0.207 to 0.413, P = 4.375 × 10⁻⁹, 4 SNPs), job involves mainly walking or standing (β = 0.202, 95% CI: 0.125 to 0.279, P = 3.410 × 10⁻⁷, 4 SNPs), Townsend deprivation index at recruitment (β = 0.360, 95% CI: 0.228 to 0.491, P = 8.335 × 10⁻⁸, 2 SNPs), and social isolation/loneliness (β = 1.615, 95% CI: 1.292 to 1.938, P = 1.230 × 10⁻²², 2 SNPs) with the frailty index remained.
Finally, to ensure the direction of causality, we performed the MR Steiger directionality test (24). Table 4 shows the results. The direction of the socioeconomic traits' causal effects was confirmed. Finally, consistency in MR estimates was observed across the leave-one-out analyses (Figure 3).
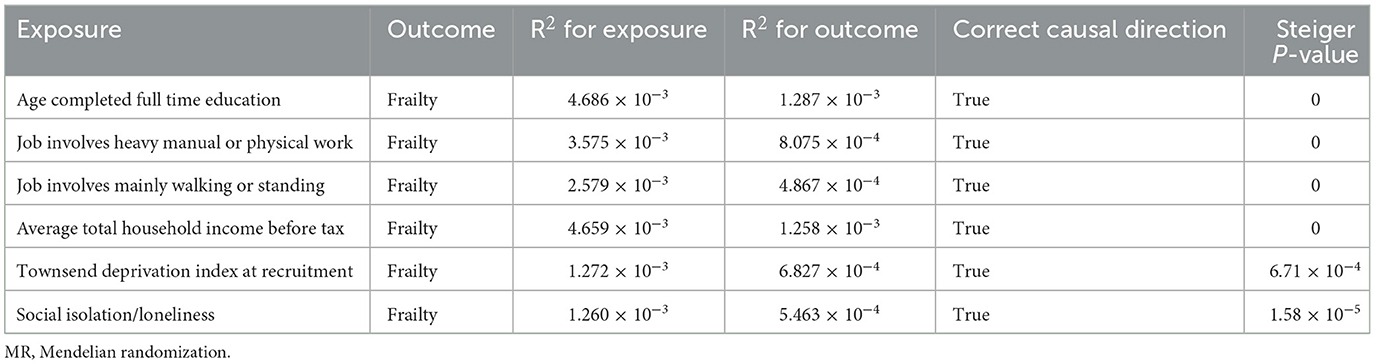
Table 4. Results of the MR Steiger directionality test checking causality direction.
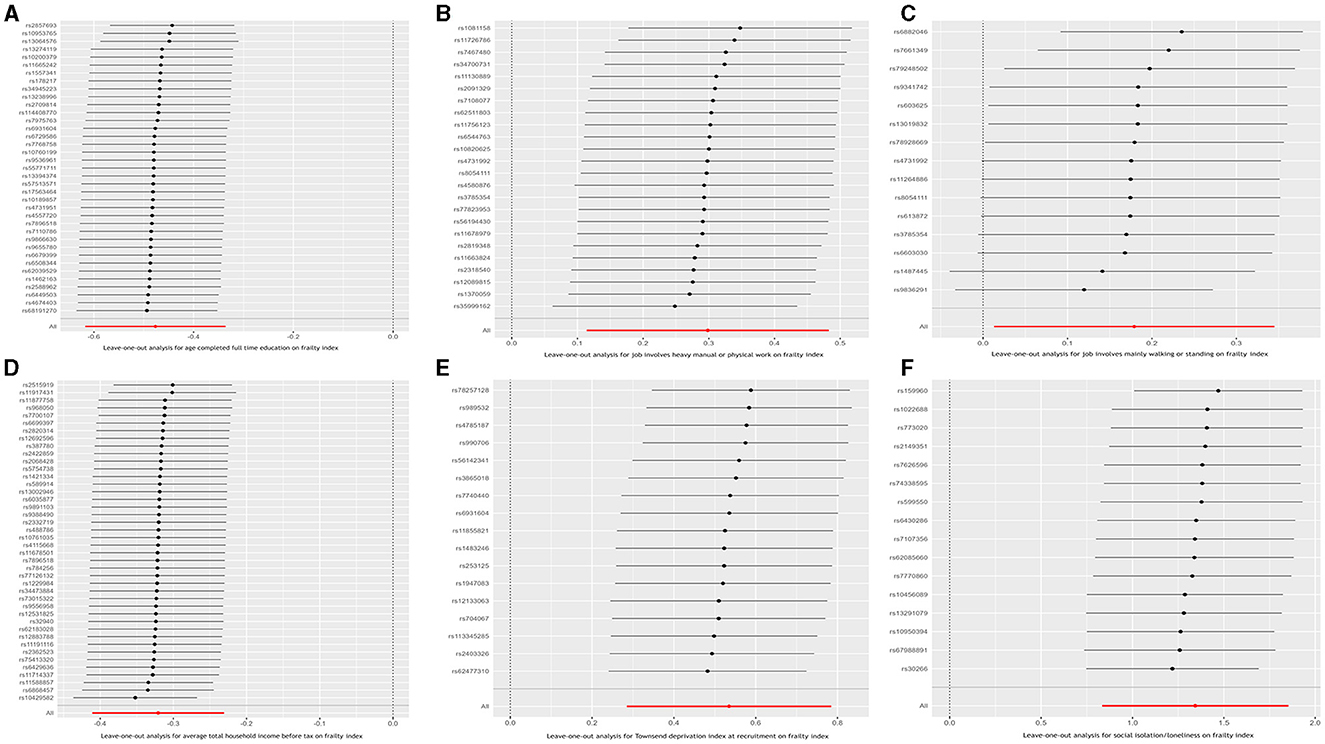
Figure 3. Leave-one-out analysis for the causal relationship between six socioeconomic traits and the frailty index. (A) Age completed full time education; (B) Job involves heavy manual or physical work; (C) Job involves mainly walking or standing; (D) Average total household income before tax; (E) Townsend deprivation index at recruitment; and (F) Social isolation/loneliness.
Discussion
The causal associations between six socioeconomic traits and frailty risk were examined in this study using a MR framework. Our findings indicated that genetically predicted age completed full time education (educational attainment) and average total household income before tax were inversely associated with the frailty index, whereas genetically predicted job involves heavy manual or physical work, job involves mainly walking or standing, Townsend deprivation index at recruitment, and loneliness were positively associated with the frailty index. Furthermore, these causal associations remained significant in multivariable MR analyses accounting for BMI. The work provided evidence supporting a potential critical role of socioeconomic characteristics in the development of frailty.
Our findings are in concurrence with the results obtained from a recent MR study (18). Utilizing genetic risk scores for specific exposures and conducting sensitivity analyses to mitigate potential pleiotropy-related bias, Atkins et al. (18) unveiled compelling findings that implied a negative association between educational attainment and the frailty index among UK Biobank participants of European ancestry aged 60–70 years. However, their study only focused on educational attainment; other socioeconomic characteristics such as economic conditions and work status were not taken into account. On the other hand, observational and clinical trial evidence continues to mount, pointing to an association between income, occupational factors, and social isolation/loneliness and the risk of frailty. An observational study (29), using data from four waves of interviews conducted as part of the Chinese Longitudinal Healthy Longevity Survey between 2008 and 2018, recruited a total of 3,327 participants (mean age: 81.2; SD: 10.3). The study authors observed an overall frailty incidence of 37.5%. Additionally, they identified a significant association between higher household income and a reduced risk of frailty (P < 0.05). In another cross-sectional investigation comprising 301 European individuals aged 65 years or greater, findings revealed that elderly individuals with a yearly personal income above 4,500 euros had a lower likelihood of experiencing frailty (OR = 0.45, 95% CI: 0.25 to 0.83, P = 0.011) in comparison to those with an income below this threshold (30). The strong association between economic conditions and frailty was reaffirmed in a longitudinal investigation, which utilized data from the Survey on Health, Aging and Retirement in Europe (SHARE) and involved 12,002 participants aged 65 years and above (7). The study revealed that individuals who experienced deteriorating economic conditions, as indicated by reduced wealth and increased subjective deprivation, were at a heightened risk of developing frailty (7). In agreement with these studies, our MR analyses revealed that genetically predicted average total household income before tax had a protective impact on frailty, while genetically predicted townsend deprivation index at recruitment increased the risk of frailty. The Townsend deprivation index is a tool utilized to assess the degree of material deprivation in a population, taking into account factors such as unemployment, lack of car and home ownership, and household overcrowding (29). It is commonly employed in research studies to evaluate the level of poverty among participants. Our analyses contributed essential evidence that strengthened the assertion of a causal connection between economic conditions and frailty.
The relationship between occupational factors and frailty has also been a focal point in previous literature. In a cross-national survey of elderly individuals residing in five major cities in Latin America, Alvarado and colleagues identified a notable association between non-white-collar jobs and increased likelihood of frailty in both genders (31). Similarly, an American cohort including 1,857 non-institutionalized individuals aged 60 years and above revealed an elevated frailty risk in individuals with a job involving manual labor (adjusted OR = 2.24, 95% CI: 1.41 to 3.56) (32). Moreover, an observational study including 258 elderly workers ≥ 60 years reported that frailty was significantly associated with the workers whose job was predominantly physical (6). This positive association was confirmed in a recent complex analysis of the SHARE study including up to 8,411 adults whose average age was 72.4 years (SD 8.0), which observed that a physically demanding main lifetime occupation promoted the risk of frailty (P < 0.001) (33). However, there were also some studies that did not support an association between occupational factors and frailty (34). In accordance with the majority of studies, our analyses revealed strong MR associations of genetically predicted job involves heavy manual or physical work and job involves mainly walking or standing with frailty. These observed associations may be attributed to physical strain and chronic inflammation as potential underlying mechanisms. Jobs that involve strenuous manual labor or extended periods of walking/standing can place strain on the body through repetitive actions and excessive physical exertion. As time goes by, this can result in musculoskeletal injuries, joint degeneration, and the deterioration of physical health, thereby augmenting the vulnerability to frailty (35, 36). In addition, intense physical work and prolonged standing/walking may contribute to chronic inflammation in the body (37, 38). Persistent inflammation has been associated with a range of adverse health outcomes, including frailty. The body's inflammatory response to physical stressors could potentially accelerate the aging process and increase the risk of frailty.
Social isolation/loneliness has recently gained significant attention from researchers as a potential risk factor for frailty. Based on the data collected from the English Longitudinal Study of Aging (ELSA) spanning from 2004 to 2017 and involving over 9,000 participants aged 50 years and above, Davies et al. (9) conducted a longitudinal study revealing a significant association between heightened levels of social isolation or loneliness and an elevated frailty index score (beta = 0.006, 95% CI: 0.006 to 0.007, P < 0.0001). This positive association was also observed in cross-sectional or cohort studies performed in other countries, including Italy, Singapore, China, and Turkey (8, 39–41). Using a MR design, our analysis supported the causal effects of social isolation/loneliness on frailty. Social isolation/loneliness may impact frailty in several aspects. For example, social isolation or loneliness often results in a lack of social connections and reduced social support. This can further exacerbate an individual's susceptibility to physical and mental health issues associated with frailty (42). In addition, individuals lacking social interaction may be more prone to unhealthy dietary habits, lack of exercise, and inadequate sleep (43–45). The presence of these unhealthy lifestyle factors can contribute to the development of obesity, a decline in physical function, and the onset of chronic diseases, ultimately heightening the risk of frailty (46, 47). Given the detrimental influence of social isolation/loneliness, social support may be essential in preventing frailty among elderly individuals.
The implementation of a MR framework in our study represented a significant methodological strength, as it allowed us to draw causal inferences about the relationship between various socioeconomic traits and frailty. By incorporating six socioeconomic traits which reflected different aspects of socioeconomic status including education, income, occupation, and social activities, our analysis provided a comprehensive assessment of how socioeconomic status causally influenced the risk of frailty. Our findings underscored the importance of addressing socioeconomic inequalities to improve health outcomes such as frailty. For instance, our results suggested that higher educational attainment and income may protect against frailty, pointing to the potential benefits of investment in education and efforts to reduce income disparities. Moreover, the significance of social activities in preventing frailty highlighted the value of fostering strong community ties and supportive social networks. Overall, the causal insights gained from our MR study would have wide-ranging implications for public health policy, clinical practice, and individual decision-making. They emphasized the need for multidimensional strategies that considered the complex interplay of social and economic factors influencing frailty. By understanding these causal associations more deeply, we may develop targeted interventions and policies aimed at reducing the risk of frailty in individuals belonging to a low socioeconomic background. There is also a particular need to raise public awareness regarding the significant implications of socioeconomic status on frailty.
Another strength of our study is the utilization of both univariable and multivariable MR analyses and the consistency of results from them. Considering BMI as a covariate, we accounted for its effect using multivariable MR. We found that the associations of the socioeconomic traits with frailty remained significant in multivariable MR, indicating that their causal influence at frailty may be through pathways independent of BMI. Furthermore, the inclusion of only individuals of European ancestry in our analysis helped mitigate any bias arising from population stratification. After discussing the strengths of our study, it is important to acknowledge that there are several limitations. Firstly, while MR is a valuable statistical method for studying causality, it cannot fully replace high-quality randomized controlled trials (RCTs) in providing robust evidence of causal effects. Therefore, to elucidate the relationship between socioeconomic traits and frailty, high-quality RCTs are still necessary. Secondly, it is important to note that the study sample from the UK Biobank, which was the primary source for genetic association assessments in our analyses, may not accurately reflect broader populations, particularly those outside of European ancestry. Thirdly, the presence of pleiotropy poses a major threat to MR studies, implying that the instrumental variables affect outcome risk through alternative mechanisms unrelated to the exposure; but our MR estimates were unlikely to be biased by pleiotropy. Among the six socioeconomic traits we evaluated, MR-Egger intercept only indicated possible horizontal pleiotropy for Townsend deprivation index at recruitment. However, the MR-PRESSO analysis found no outliers for Townsend deprivation index at recruitment. Fourthly, the IVW method, as well as the supporting MR-PRESSO, weighted median, and maximum likelihood methods, indicated causal effects of socioeconomic traits on frailty, but the MR-Egger method yielded a non-significant estimate. It is worth noting that the MR-Egger method may yield different estimates due to its ability to adjust for potential pleiotropic effects. This adjustment can lead to wider confidence intervals, making the MR-Egger estimate more conservative and potentially explaining the discrepancy from other methods. While we acknowledged the inconsistency between the MR-Egger results and those obtained from other MR methods, it is worth noting that multiple complementary analyses supported causal effects of the socioeconomic traits on frailty. In addition, our multivariable MR analysis yielded stable results following adjustment for BMI.
In summary, our MR study yielded evidence indicating that genetically predicted age completed full time education and average total household income before tax conferred a protective effect against frailty. On the other hand, genetically predicted job involves heavy manual or physical work, job involves mainly walking or standing, Townsend deprivation index at recruitment, and social isolation/loneliness increased the risk of frailty. These findings underscore the importance of socioeconomic factors in causally influencing frailty risk and highlight potential avenues for intervention. Future studies should focus on unraveling the intricate mechanisms by which these socioeconomic factors impact frailty, aiming to ultimately develop targeted strategies to mitigate the risk of frailty across diverse populations.
Data availability statement
In this Mendelian randomization study, we performed analyses using public datasets, which are accessible at this address: https://gwas.mrcieu.ac.uk/.
Author contributions
JH: Conceptualization, Data curation, Formal analysis, Investigation, Methodology, Project administration, Resources, Software, Validation, Visualization, Writing—original draft, Writing—review & editing. YG: Investigation, Validation, Writing—review & editing. JW: Investigation, Validation, Writing—review & editing. YX: Funding acquisition, Supervision, Writing—review & editing.
Funding
The author(s) declare that financial support was received for the research, authorship, and/or publication of this article. This work was supported in part by Guangxi Key Research and Development Program (No. AB24010066), Guangxi Clinical Research Center for Anesthesiology (No. GK AD22035214), and the Special Fund of Neurotoxicity of General Anesthetics and Its Prevention and Treatment Innovation Team of the First Affiliated Hospital of Guangxi Medical University (No. YYZS2022001). The funding sources had no role in study design; in the collection, analysis, and interpretation of data; in the writing of the report; or in the decision to submit the article for publication.
Acknowledgments
We express our gratitude to the authors of the original genome-wide association studies for sharing their summary statistics of the exposures and outcome.
Conflict of interest
The authors declare that the research was conducted in the absence of any commercial or financial relationships that could be construed as a potential conflict of interest.
Publisher's note
All claims expressed in this article are solely those of the authors and do not necessarily represent those of their affiliated organizations, or those of the publisher, the editors and the reviewers. Any product that may be evaluated in this article, or claim that may be made by its manufacturer, is not guaranteed or endorsed by the publisher.
Supplementary material
The Supplementary Material for this article can be found online at: https://www.frontiersin.org/articles/10.3389/fmed.2024.1344217/full#supplementary-material
References
1. Dent E, Martin FC, Bergman H, Woo J, Romero-Ortuno R, Walston JD. Management of frailty: opportunities, challenges, and future directions. Lancet. (2019) 394:1376–86. doi: 10.1016/S0140-6736(19)31785-4
2. Gale CR, Cooper C, Sayer AA. Prevalence of frailty and disability: findings from the English Longitudinal Study of Ageing. Age Ageing. (2015) 44:162–5. doi: 10.1093/ageing/afu148
3. Castellana F, Lampignano L, Bortone I, Zupo R, Lozupone M, Griseta C, et al. Physical frailty, multimorbidity, and all-cause mortality in an older population from Southern Italy: results from the Salus in Apulia study. J Am Med Dir Assoc. (2021) 22:598–605. doi: 10.1016/j.jamda.2020.12.026
4. Panza F, Solfrizzi V, Sardone R, Dibello V, Castellana F, Zupo R, et al. Depressive and biopsychosocial frailty phenotypes: impact on late-life cognitive disorders. J Alzheimers Dis. (2023) 94:879–98. doi: 10.3233/JAD-230312
5. Harttgen K, Kowal P, Strulik H, Chatterji S, Vollmer S. Patterns of frailty in older adults: comparing results from higher and lower income countries using the Survey of Health, Ageing and Retirement in Europe (SHARE) and the Study on Global AGEing and Adult Health (SAGE). PLoS ONE. (2013) 8:e75847. doi: 10.1371/journal.pone.0075847
6. de Amorim JSC, da Silva SLA, Ude Viana J, Trelha CS. Factors associated with the prevalence of sarcopenia and frailty syndrome in elderly university workers. Arch Gerontol Geriatr. (2019) 82:172–8. doi: 10.1016/j.archger.2019.02.002
7. Sirven N, Dumontet M, Rapp T. The dynamics of frailty and change in socio-economic conditions: evidence for the 65+ in Europe. Eur J Public Health. (2020) 30:715–9. doi: 10.1093/eurpub/ckaa068
8. Jarach CM, Tettamanti M, Nobili A, D'avanzo B. Social isolation and loneliness as related to progression and reversion of frailty in the Survey of Health Aging Retirement in Europe (SHARE). Age Ageing. (2021) 50:258–62. doi: 10.1093/ageing/afaa168
9. Davies K, Maharani A, Chandola T, Todd C, Pendleton N. The longitudinal relationship between loneliness, social isolation, and frailty in older adults in England: a prospective analysis. Lancet Healthy Longev. (2021) 2:e70–7. doi: 10.1016/S2666-7568(20)30038-6
10. Tatoli R, Lampignano L, Donghia R, Castellana F, Zupo R, Bortone I, et al. Dietary customs and social deprivation in an aging population from Southern Italy: a machine learning approach. Front Nutr. (2022) 9:811076. doi: 10.3389/fnut.2022.811076
11. Wang J, Hulme C. Frailty and socioeconomic status: a systematic review. J Public Health Res. (2021) 10:2036. doi: 10.4081/jphr.2021.2036
12. Delbari A, Zanjari N, Momtaz YA, Rahim F, Saeidimehr S. Prevalence of frailty and associated socio-demographic factors among community-dwelling older people in southwestern Iran: a cross-sectional study. J Diabetes Metab Disord. (2021) 20:601–10. doi: 10.1007/s40200-021-00787-2
13. Goodyer E, Mah JC, Rangan A, Chitalu P, Andrew MK, Searle SD, et al. The relative impact of socioeconomic position and frailty varies by population setting. Aging Med (Milton). (2022) 5:10–6. doi: 10.1002/agm2.12200
14. Richmond RC, Davey Smith G. Mendelian randomization: concepts and scope. Cold Spring Harb Perspect Med. (2022) 12:a040501. doi: 10.1101/cshperspect.a040501
15. Hemani G, Zheng J, Elsworth B, Wade KH, Haberland V, Baird D, et al. The MR-Base platform supports systematic causal inference across the human phenome. Elife. (2018) 7:e34408. doi: 10.7554/eLife.34408.012
16. 1000 Genomes Project Consortium, Auton A, Brooks LD, Durbin RM, Garrison EP, Kang HM, et al. A global reference for human genetic variation. Nature. (2015) 526:68–74. doi: 10.1038/nature15393
17. Li X, van Geffen J, van Weele M, Zhang X, He Y, Meng X, et al. An observational and Mendelian randomisation study on vitamin D and COVID-19 risk in UK Biobank. Sci Rep. (2021) 11:18262. doi: 10.1038/s41598-021-97679-5
18. Atkins JL, Jylhävä J, Pedersen NL, Magnusson PK, Lu Y, Wang Y, et al. A genome-wide association study of the frailty index highlights brain pathways in ageing. Aging Cell. (2021) 20:e13459. doi: 10.1111/acel.13459
19. Rohrmann S. Epidemiology of frailty in older people. Adv Exp Med Biol. (2020) 1216:21–7. doi: 10.1007/978-3-030-33330-0_3
20. Burgess S, Butterworth A, Thompson SG. Mendelian randomization analysis with multiple genetic variants using summarized data. Genet Epidemiol. (2013) 37:658–65. doi: 10.1002/gepi.21758
21. Boehm FJ, Zhou X. Statistical methods for Mendelian randomization in genome-wide association studies: a review. Comput Struct Biotechnol J. (2022) 20:2338–51. doi: 10.1016/j.csbj.2022.05.015
22. Bowden J, Davey Smith G, Burgess S. Mendelian randomization with invalid instruments: effect estimation and bias detection through Egger regression. Int J Epidemiol. (2015) 44:512–25. doi: 10.1093/ije/dyv080
23. Gill D. Heterogeneity between genetic variants as a proxy for pleiotropy in Mendelian randomization. JAMA Cardiol. (2020) 5:107–8. doi: 10.1001/jamacardio.2019.4281
24. Hemani G, Tilling K, Davey Smith G. Orienting the causal relationship between imprecisely measured traits using GWAS summary data. PLoS Genet. (2017) 13:e1007081. doi: 10.1371/journal.pgen.1007081
25. Tavares DM, Colamego CG, Pegorari MS, Ferreira PC, Dias FA, Bolina AF. Cardiovascular risk factors associated with frailty syndrome among hospitalized elderly people: a cross-sectional study. São Paulo Med J. (2016) 134:393–9. doi: 10.1590/1516-3180.2016.0028010616
26. Doi T, Makizako H, Tsutsumimoto K, Nakakubo S, Kim MJ, Kurita S, et al. Transitional status and modifiable risk of frailty in Japanese older adults: a prospective cohort study. Geriatr Gerontol Int. (2018) 18:1562–6. doi: 10.1111/ggi.13525
27. Zhang N, Jia Z, Gu T, Zheng Y, Zhang Y, Song W, et al. Associations between modifiable risk factors and frailty: a Mendelian randomisation study. J Epidemiol Community Health. (2023) 77:782–90. doi: 10.1136/jech-2023-220882
28. Gu Y, Li Z, Dang A, Zhang W, Liu J, Han X, et al. Obesity, birth weight, and lifestyle factors for frailty: a Mendelian randomization study. Aging (Albany NY). (2023) 15:14066–85. doi: 10.18632/aging.205290
29. Wang HY, Zhang M, Sun X. Sex-specific association between socioeconomic status, lifestyle, and the risk of frailty among the elderly in China. Front Med. (2021) 8:775518. doi: 10.3389/fmed.2021.775518
30. Aravantinou-Karlatou A, Kavasileiadou S, Panagiotakis S, Tziraki C, Almegewly W, Androulakis E, et al. The impact of socioeconomic factors and geriatric syndromes on frailty among elderly people receiving home-based healthcare: a cross-sectional study. Healthcare. (2022) 10:2079. doi: 10.3390/healthcare10102079
31. Alvarado BE, Zunzunegui MV, Béland F, Bamvita JM. Life course social and health conditions linked to frailty in Latin American older men and women. J Gerontol A Biol Sci Med Sci. (2008) 63:1399–406. doi: 10.1093/gerona/63.12.1399
32. Soler-Vila H, García-Esquinas E, León-Muñoz LM, López-García E, Banegas JR, Rodríguez-Artalejo F. Contribution of health behaviours and clinical factors to socioeconomic differences in frailty among older adults. J Epidemiol Community Health. (2016) 70:354–60. doi: 10.1136/jech-2015-206406
33. van der Valk AM, Theou O, Wallace LMK, Andrew MK, Godin J. Physical demands at work and physical activity are associated with frailty in retirement. Work. (2022) 73:695–705. doi: 10.3233/WOR-210859
34. Yong SJ, Gwini SM, Tembo MC, Ng BL, Low CH, Malon RG, et al. Frailty associations with socioeconomic status, healthcare utilisation and quality of life among older women residing in regional Australia. J Frailty Sarcopenia Falls. (2021) 6:209–17. doi: 10.22540/JFSF-06-209
35. Punnett L. Musculoskeletal disorders and occupational exposures: how should we judge the evidence concerning the causal association? Scand J Public Health. (2014) 42:49–58. doi: 10.1177/1403494813517324
36. Unverzagt S, Bolm-Audorff U, Frese T, Hechtl J, Liebers F, Moser K, et al. Influence of physically demanding occupations on the development of osteoarthritis of the hip: a systematic review. J Occup Med Toxicol. (2022) 17:18. doi: 10.1186/s12995-022-00358-y
37. Zelzer S, Tatzber F, Herrmann M, Wonisch W, Rinnerhofer S, Kundi M, et al. Work intensity, low-grade inflammation, and oxidative status: a comparison between office and slaughterhouse workers. Oxid Med Cell Longev. (2018) 2018:2737563. doi: 10.1155/2018/2737563
38. Tatzber F, Zelzer S, Obermayer-Pietsch B, Rinnerhofer S, Kundi M, Cvirn G, et al. Occupational health aspects with special focus on physiological differences between office and metalworkers. Antioxidants. (2022) 11:633. doi: 10.3390/antiox11040633
39. Ge L, Yap CW, Heng BH. Associations of social isolation, social participation, and loneliness with frailty in older adults in Singapore: a panel data analysis. BMC Geriatr. (2022) 22:26. doi: 10.1186/s12877-021-02745-2
40. Sha S, Pan Y, Xu Y, Chen L. Associations between loneliness and frailty among older adults: evidence from the China Health and Retirement Longitudinal Study. BMC Geriatr. (2022) 22:537. doi: 10.1186/s12877-022-03044-0
41. Altintas HK, Coban SA, Cantekin I. Relationship between frailty and loneliness among community-dwelling Turkish older people. Psychogeriatrics. (2023) 23:243–51. doi: 10.1111/psyg.12926
42. Pearce E, Birken M, Pais S, Tamworth M, Ng Y, Wang J, et al. Associations between constructs related to social relationships and mental health conditions and symptoms: an umbrella review. BMC Psychiatry. (2023) 23:652. doi: 10.1186/s12888-023-05069-0
43. Ferrante G, Camussi E, Piccinelli C, Senore C, Armaroli P, Ortale A, et al. Did social isolation during the SARS-CoV-2 epidemic have an impact on the lifestyles of citizens? Epidemiol Prev. (2020) 44:353–362. doi: 10.19191/EP20.5-6.S2.137
44. Delerue Matos A, Barbosa F, Cunha C, Voss G, Correia F. Social isolation, physical inactivity and inadequate diet among European middle-aged and older adults. BMC Public Health. (2021) 21:924. doi: 10.1186/s12889-021-10956-w
45. Qi X, Malone SK, Pei Y, Zhu Z, Wu B. Associations of social isolation and loneliness with the onset of insomnia symptoms among middle-aged and older adults in the United States: a population-based cohort study. Psychiatry Res. (2023) 325:115266. doi: 10.1016/j.psychres.2023.115266
46. García-Esquinas E, Graciani A, Guallar-Castillón P, López-García E, Rodríguez-Mañas L, Rodríguez-Artalejo F. Diabetes and risk of frailty and its potential mechanisms: a prospective cohort study of older adults. J Am Med Dir Assoc. (2015) 16:748–54. doi: 10.1016/j.jamda.2015.04.008
Keywords: Mendelian randomization, socioeconomic status, frailty, summary statistics, causal relationship
Citation: Huang J, Gui Y, Wu J and Xie Y (2024) Causal effects of socioeconomic traits on frailty: a Mendelian randomization study. Front. Med. 11:1344217. doi: 10.3389/fmed.2024.1344217
Received: 25 November 2023; Accepted: 18 June 2024;
Published: 12 July 2024.
Edited by:
Alessandro Gialluisi, Università Lum Jean Monnet, ItalyReviewed by:
Mack Shelley, Iowa State University, United StatesLuca Soraci, IRCCS INRCA, Italy
Roberta Zupo, University of Bari Aldo Moro, Italy
Copyright © 2024 Huang, Gui, Wu and Xie. This is an open-access article distributed under the terms of the Creative Commons Attribution License (CC BY). The use, distribution or reproduction in other forums is permitted, provided the original author(s) and the copyright owner(s) are credited and that the original publication in this journal is cited, in accordance with accepted academic practice. No use, distribution or reproduction is permitted which does not comply with these terms.
*Correspondence: Yubo Xie, MTE1NzgxNzc5MUBxcS5jb20=