Abstract
Introduction:
Rheumatoid arthritis (RA) is commonly characterized by joint space narrowing. High-resolution peripheral quantitative computed tomography (HR-pQCT) provides unparalleled in vivo visualization and quantification of joint space in extremity joints commonly affected by RA, such as the 2nd and 3rd metacarpophalangeal joints. However, age, sex, and obesity can also influence joint space narrowing. Thus, this study aimed to determine whether HR-pQCT joint space metrics could distinguish between RA patients and controls, and determine the effects of age, sex and body mass index (BMI) on these joint space metrics.
Methods:
HR-pQCT joint space metrics (volume, width, standard deviation of width, maximum/minimum width, and asymmetry) were acquired from RA patients and age-and sex-matched healthy control participants 2nd and 3rd MCP joints. Joint health and functionality were assessed with ultrasound (i.e., effusion and inflammation), hand function tests, and questionnaires.
Results:
HR-pQCT-derived 3D joint space metrics were not significantly different between RA and control groups (p > 0.05), despite significant differences in inflammation and joint function (p < 0.05). Joint space volume, mean joint space width (JSW), maximum JSW, minimum JSW were larger in males than females (p < 0.05), while maximum JSW decreased with age. No significant association between joint space metrics and BMI were found.
Conclusion:
HR-pQCT did not detect group level differences between RA and age-and sex-matched controls. Further research is necessary to determine whether this is due to a true lack of group level differences due to well-controlled RA, or the inability of HR-pQCT to detect a difference.
1 Introduction
Rheumatoid arthritis (RA) is a disease characterized by inflammation-associated deterioration of joint surfaces that can include a loss of cartilage, a reduction in joint space, and eventual bone-on-bone contact. Symptomatically, this can result in loss of gross (e.g., walking, sitting, standing, etc.) and fine (e.g., writing, grabbing objects, etc.) motor skills, leading to an overall decrease in quality-of-life (QOL) (1–3). For RA, the most affected joints are those within the hands, specifically, the metacarpophalangeal (4) joints (MCP). However, apart from rheumatic diseases, decreases in MCP joint functionality may also be attributed to naturally occurring factors.
Age, sex, and obesity have been shown to negatively impact joint space narrowing and disease progression in hand osteoarthritis (OA). The continual wear and tear of cartilage with increasing age can contribute to a cartilage thinning, resulting in joint space narrowing (5–7). In addition to known sex-based joint size differences (8–10), the inverse relationship between obesity and immune response is known to affect OA disease progression (11, 12). While different hand joints are typically affected in RA (MCP joints) compared with OA (distal interphalangeal and proximal interphalangeal joints), MCP joint changes may be influenced by age, sex, and obesity. However, visualizing and quantifying joint changes within small joints with standard X-ray methods can be challenging.
High-resolution peripheral quantitative computed tomography (HR-pQCT) is an X-ray based imaging technique that can provide unparalleled 3D in vivo images of the MCP joints, allowing for accurate and precise quantitative 3D derived joint space metrics. Recently, the Study group for x-trEme Computed Tomography in Rheumatoid Arthritis (13) proposed a consensus method to characterize joint space including metrics to assess mean width, maximum width, minimum width, standard deviation of width, asymmetry and volume (13). This fully automated method provided accurate scan-rescan reproducibility, with reported scan-rescan precision errors ranging from 2.3% (mean width) to 13.3% (asymmetry) (13). Several studies have utilized these metrics to assess disease course and treatment effects in RA (14, 15). However, limited sample sizes (16) have restricted the exploration of whether HR-pQCT joint space metrics differ with age, sex, and obesity.
In this study, we aimed to determine the sensitivity of HR-pQCT-derived joint space metrics for the differentiation between the 2nd and 3rd MCP joints of RA and controls, as a function of age, sex, and obesity. Furthermore, joint health and functionality were evaluated via ultrasound (i.e., effusion and inflammation) and physical tasks (i.e., Jebsen Taylor Hand Function Test), respectively – facilitating the comparison of (a) joint space metrics with function of functional outcomes, and (b) joint function and inflammation between groups.
2 Materials and methods
2.1 Participants
Eighty (80) participants (N = 40 RA and N = 40 controls) were recruited for this study, which was approved by the Conjoint Health Research Ethics Board at the University of Calgary (REB19-0387). All participants were > 18 years of age, free of cognitive and physical impairments, and were not pregnant nor planning a pregnancy. RA participants were recruited from the Rheum4U database, an ongoing study that is exploring the quality of care in rheumatoid arthritis patients within Calgary, AB, Canada (17). Through this database, RA participants were identified and recruited if (1) they met the American College of Rheumatology/European League Against Rheumatism 2010 classification criteria for RA (18) and (2) had a disease duration ≥6 months. RA participants were excluded if they had any history of a prior MCP injury, replacement, or complete joint space loss in both hands. For the age- (± 2 years) and sex-matched controls, these participants were recruited via word-of-mouth. Control participants were included if they had no diagnosis of any hand joint problems or inflammatory arthritis, no current pain or swelling within the hands, and had not sought medical attention for any hand injuries within the past 12 months. After providing written informed consent, physical characteristics (sex, age, height, and weight), patient reported outcomes (questionnaires), and imaging data were collected.
2.2 HR-pQCT acquisition and processing
High-resolution peripheral quantitative computed tomography (HR-pQCT, XtremeCT II, Scanco Medical, Brüttisellen, Switzerland) scans of the most affected hand were acquired with three 1 cm stacks, with 25% overlap, to encompass the 2nd and 3rd MCP joints (MCP2 and MCP3, respectively) (19). Each stack was acquired at 68 keV, 1,470 𝜇A, 43 ms dwell time, and with an isotropic 60.7 𝜇m voxel size. Images were scored for motion (20), and were omitted from further analysis if motion scores >3.
Joint space width analysis was performed using the consensus-based algorithm previously published by (13) using the manufacturer’s software (IPL v5.42, Scanco Medical) (13). From the automatically generated contours of the metacarpal and phalanx bones, joint space volume (JSV), mean width (JSW), standard deviation of width (JSWSD), maximum joint space width (JSWMAX), minimum joint space width (JSWMIN), and width asymmetry (JSWAS = JSWMAX/JSWMIN) were calculated (13, 16).
2.3 Disease severity and functional outcome acquisition
2.3.1 Questionnaire and hand function test
Participants completed a Health Assessment Questionnaire (HAQ) (21) and the Disabilities of Arm, Shoulder, and Hand (DASH) (22). Following the questionnaires, participants were administered the Jebsen-Taylor Hand Function Test (JTHFT) (23), which consists of seven tasks meant to evaluate hand functionality when performing day-to-day routine tasks (e.g., writing, lifting light and heavy weights, etc.)
2.3.2 Ultrasound acquisition and processing
Ultrasound scans (Logiq S8, software version R2.2, GE HealthCare, Chicago, IL, United States) were performed by an ultrasound-trained rheumatologist (CP > 10 years). Both MCP2 and MCP3 joints of the dominant and non-dominant hand were evaluated for effusion/synovial hypertrophy and inflammation using power doppler. Based on these assessments, the rheumatologist chose the most affected hand to be used for the following HR-pQCT imaging analysis – to note, this chosen hand may not always be the participant’s dominant hand. Additionally, the MCP2 – MCP5 joints from the most affected hand were further evaluated for the presence of erosions. Effusion and synovial hypertrophy and inflammation grades were presented as the interquartile range (IQR) on a 0–3 grading scale. Grading was performed by two trained assessors (CP > 10 years and AI >3 years of experience).
2.4 Statistical analysis
Two-way ANOVAs for each MCP joint (MCP2 and MCP3) and for each joint space metric with diagnosis (RA, control) and sex (male, female) as between-subject factors were performed. Multiple linear regression analyses were performed to compare joint space parameters as a function of age, BMI, and JTHFT test times. To compare JTHFT (continuous variable) against ordinal ultrasound scores (i.e., effusion/synovial hypertrophy and power doppler), a Kendall rank correlation was utilized. Non-parametric, paired t-tests (Wilcoxon) were performed to compare clinical and demographic variables between RA and controls. Specifically, we compared matched hands between groups (i.e., dominant and non-dominant hands for JTHFT times).
While criteria for ultrasound grading (effusion/synovial hypertrophy and power doppler) have been developed they are dependent on the subjective assessment of the observed ultrasound signal. Thus, an intraclass correlation coefficient (ICC) between the two raters was performed. Specifically, we utilized a two-way random effects, single rater, absolute agreement exam (RStudio v2022.12.0 + 353). Classification of ICC values were as follows: < 0.05 = poor reliability, 0.5–0.75 = moderate reliability, 0.75–0.9 = good reliability, and > 0.9 = excellent reliability (24).
All statistical analysis were performed in Prism (v9.4.1, GraphPad, San Diego, CA, United States) unless otherwise noted. Statistical significance was noted if p < 0.05.
3 Results
3.1 Characteristics of the cohorts
From the initial 80 participants, N = 5 RA participants and their N = 5 matched controls were excluded from all analyses. The five RA participants were excluded due to a joint replacement (N = 1), presence of gout (N = 1), missed study appointment (N = 1), and asked for their data to be withdrawn from the study (N = 2). The demographic and clinical characteristics of the 35 RA patients and their 35 controls are shown in Table 1.
Table 1
| Control (N = 35) | RA (N = 35) | p-value | |
|---|---|---|---|
| Age | 57.0 ± 15.0 | 57.4 ± 14.7 | 0.90 |
| Female : Male (Female %) | 27 : 8 (77%) | 27 : 8 (77%) | N/A |
| Height (m) | 1.57 ± 0.39 | 1.57 ± 0.39 | 0.97 |
| Weight (kg) | 72.4 ± 17.6 | 85.5 ± 21.8 | 0.008* |
| BMI (kg/m2) | 26.2 ± 5.7 | 30.9 ± 6.7 | 0.003* |
| Clinical parameters | |||
| Disease duration (years) (N = 33) | N/A | 15.0 ± 10.1 | N/A |
| 28 Swollen joint count (N = 33) | N/A | 1.7 ± 2.8 | N/A |
| 28 Tender joint count (N = 33) | N/A | 3.0 ± 4.1 | N/A |
| HAQ (0–3) (N = 35) | 0.03 ± 0.1 | 0.86 ± 0.65 | <0.001* |
| Patient global score (0–100) (N = 35) | 1.8 ± 8.7 | 25.3 ± 30.5 | <0.001* |
| AM stiffness (min) (N = 35) | 1.1 ± 3.2 | 57.0 ± 153.4 | 0.04* |
| DAS28CRP (N = 33) | N/A | 3.1 ± 1.3 | N/A |
| DAS28ESR (N = 33) | N/A | 3.1 ± 1.5 | N/A |
| CDAI (N = 33) Low CDAI (> 2.8 and ≤ 10) Mid CDAI (> 10 and ≤ 22) High CDAI (> 22) |
N/A N/A N/A N/A |
10.3 ± 8.4 24 (73%) 4 (12%) 5 (15%) |
N/A N/A N/A N/A |
| Medications Corticosteroids DMARDs Biologic DMARD NSAIDs |
N/A N/A N/A N/A |
2 (6%) 14 (42%) 19 (58%) 3 (9%) |
N/A N/A N/A N/A |
| Jebsen-Taylor hand function test times (s) | |||
| Most affected hand | 46.3 ± 8.4 | 65.5 ± 25.5 | < 0.001* |
| Contralateral hand | 67.3 ± 14.0 | 66.1 ± 17.2 | 0.75 |
| Disabilities of the arm, shoulder, and hand (DASH) | |||
| Score | 27.6 ± 5.7 | 56.0 ± 19.1 | < 0.001* |
| Serological parameters | |||
| RF (+: -) (N = 30) | N/A | 23: 7 | N/A |
| ACPA (+: -) (N = 14) | N/A | 10: 4 | N/A |
| ESR (N = 33) | N/A | 14.9 ± 14.0 | N/A |
| CRP (N = 33) | N/A | 6.2 ± 7.7 | N/A |
Demographics of the healthy control (N = 35) and RA (N = 35) participants.
Multiple parameters for the control were marked as N/A, as the data were not collected or relevant for healthy controls. All values are representative of N = 35 for each group of participants, unless noted otherwise, and are presented as mean ± standard deviation. p-values reflect results of a paired, non-parametric, t-test (Wilcoxon) comparing RA and control participants. Serological parameters were not available for all participants.
For the RA participants, the swollen and tender joint count, CDAI, and current medications were collected at their last visit to a rheumatologist, 18 ± 56 days relative to the imaging day. As blood work (ESR and CRP, contributing to DAS28 scores) was performed less frequently, these results were acquired 138 ± 236 days relative to the imaging day. Two RA participants were not registered within the Rheum4U database; thus, some of their metrics were not recorded (i.e., disease duration, swollen and tender joint count, blood work, and current medications). While some of the clinical and serological parameters were marked as N/A for the control participants, part of the inclusion criteria of the control participants required no hand injuries and no diagnosed conditions involving the hand. Thus, swollen and tender joint counts, disease duration, disease severity criteria (i.e., DAS28CRP/ESR and CDAI), medications, and serological parameters were not assessed for these participants.
Functional tests, questionnaires, and ultrasound grading revealed significant group-level differences between RA and controls. The RA group had greater pain and disability than their age-and sex-matched controls, resulting in significant differences between groups in patient global score (p < 0.001), morning stiffness (p < 0.001) and DASH scores (22) (p < 0.001). These self-reported metrics were also reflected in functional tests examining gross and fine motor skills, whereby Jebsen-Taylor hand function test (JTHFT) scores (23) were significantly poorer (p < 0.05) in the most affected hand for RA patients than the controls. With regards to ultrasound grading, scores for effusion/synovial hypertrophy and inflammation (i.e., positive power doppler signal) were significantly higher in the RA participants when compared to their age-and sex-matched controls in MCP2 and MCP3 of both hands (Table 2). The number of erosions present on ultrasound exam in MCP2 - MCP5 joints of the most affected hand was higher in RA than control participants (Table 2). The results of ICC revealed poor (effusion/synovial hypertrophy) to excellent (power doppler) reliability (Supplementary Table S1) with a higher consistency in the MCP2 joint, compared to MCP3.
Table 2
| Ultrasound scores | Ultrasound scores vs. JTHFT | ||||
|---|---|---|---|---|---|
| p-value | |||||
| Control | RA | p-value | Control | RA | |
| Effusion / synovial hypertrophy (0–3) | |||||
| Most affected hand (MCP2) Contralateral hand (MCP2) Most affected hand (MCP3) Contralateral hand (MCP3) |
1 [IQR 1–1] 1 [IQR 1–1] 1 [IQR 1–1] 1 [IQR 1–1] |
1 [IQR 1–2.5] 1 [IQR 1–1.5] 1 [IQR 1–1] 1 [IQR 1–1] |
< 0.001*
0.005* 0.02* 0.13 |
0.38 0.75 N/A 0.55 |
0.52 0.23 0.40 0.81 |
| Power doppler (0–3) | |||||
| Most affected hand (MCP2) Contralateral hand (MCP2) Most affected hand (MCP3) Contralateral hand (MCP3) |
1 [IQR 1–1] 1 [IQR 1–1] 1 [IQR 1–1] 1 [IQR 1–1] |
1 [IQR 1–1] 1 [IQR 1–1] 1 [IQR 1–1.5] 1 [IQR 1–1] |
0.008*
0.03* 0.004* 0.008* |
0.39 0.34 N/A 0.55 |
0.98 0.97 0.11 0.83 |
| Erosions | |||||
| MCP2 {# of People with Erosions} MCP3 {# of People with Erosions} MCP4 {# of People with Erosions} MCP5 {# of People with Erosions} |
0 [IQR 0–0] {0} 0 [IQR 0–0] {1} 0 [IQR 0–0] {0} 0 [IQR 0–0] {0} |
0 [IQR 0–1] {15} 0 [IQR 0–0] {7} 0 [IQR 0–0] {0} 0 [IQR 0–0] {3} |
|||
Results of ultrasound scores (effusion/synovial hypertrophy, power doppler, erosions) and comparisons between hand JTHFT times against ultrasound scores for both control and RA participants.
For ultrasound scores, results are reported as the interquartile range, while p values of rank correlations were used for hand function vs. ultrasound scores. A significant correlation is noted if the p < 0.05. p values with a reported N/A were due to zero standard deviation amongst measurements. Significant values were bolded for emphasis.
3.2 Effects of diagnosis and sex on 3D JSW
We observed no significant differences in joint space metrics as a function of diagnosis (i.e., RA or control) and no interactions between sex and diagnosis were noted (Figure 1). When examining the relationship between joint space changes as a function of disease duration and CDAI, as a longer disease duration did not imply worsening disease (i.e., CDAI), the sole significant association was found between disease duration and JSWMAX (p = 0.04). No other correlations were noted for the remaining 3D joint space metrics. For sex, we found that females had significantly smaller JSV (MCP2, p < 0.001 and MCP3, p < 0.001); JSW (MCP2, p = 0.02 and MCP3, p = 0.02); JSWMAX (MCP3, p = 0.006); and JSWMIN (MCP3, p = 0.01) than males (Figure 1).
Figure 1
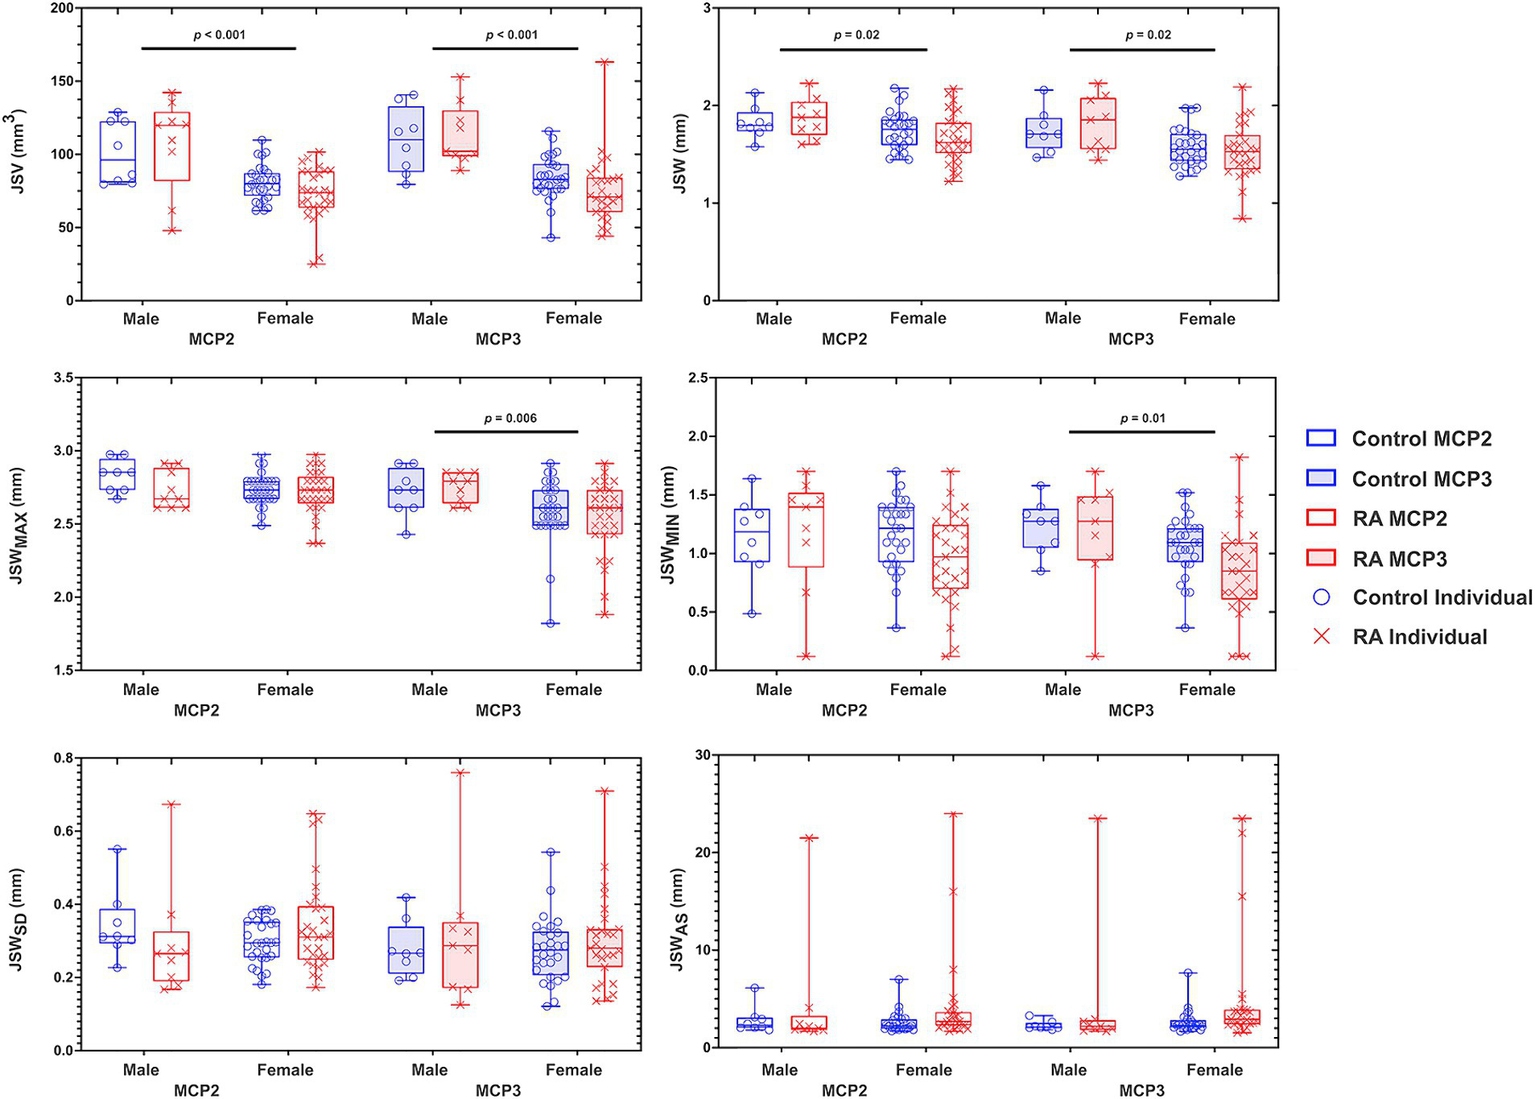
Graphs depicting the results of a two-way ANOVA comparing the effects of sex (male and female) and diagnosis (RA and control) on 3D joint space in the MCP2 and MCP3. Each individual data point for RA (X) and control (O) are presented within a bounding box, displaying the max and min value and mean (bar). Analyzed joint space metrics included the joint space volume (JSV), width (JSW), standard deviation (JSWSD), maximum width (JSWMAX), minimum width (JSWMIN), and joint space width asymmetry (JSWAS). To note, because JSWAS is JSWMAX/JSWMIN, individuals with significant joint space narrowing can result in large JSWAS – demonstrating the large amount of individual variability within this metric. N = 70.
3.3 Age, BMI, and hand function test
There was a significant negative association between age and JSWMAX in both MCP2 and MCP3 (p = 0.03). This association was affected by diagnosis (significant interaction between age and diagnosis; p = 0.001 and p = 0.04 for MCP2 and MCP3, respectively). For the remaining 3D joint space metrics (i.e., JSV, JSW, JSWSD, JSWMAX, JSWMIN, and JSWAS) we observed no significant association with age, diagnosis, nor an interaction effect. Additionally, we observed no significant associations with BMI and JTHFT for any of the 3D joint space metrics (Table 3).
Table 3
| Age | BMI | JTHFT | ||||||||||
|---|---|---|---|---|---|---|---|---|---|---|---|---|
| MCP2 | MCP3 | MCP2 | MCP3 | MCP3 | MCP3 | |||||||
| R 2 | p-value | R 2 | p-value | R 2 | p-value | R 2 | p-value | R 2 | p-value | R 2 | p-value | |
| JSV | 0.08 | 0.14 | 0.04 | 0.24 | 0.01 | 0.82 | 0.02 | 0.60 | 0.03 | 0.54 | 0.03 | 0.90 |
| JSW | 0.01 | 0.65 | 0.03 | 0.44 | 0.05 | 0.15 | 0.07 | 0.05 | 0.02 | 0.64 | 0.06 | 0.59 |
| JSWSD | 0.03 | 0.29 | 0.06 | 0.08 | 0.03 | 0.76 | 0.04 | 0.80 | 0.02 | 0.58 | 0.02 | 0.71 |
| JSWMAX | 0.12 | 0.03* | 0.08 | 0.03* | 0.08 | 0.15 | 0.12 | 0.09 | 0.06 | 0.81 | 0.09 | 0.84 |
| JSWMIN | 0.06 | 0.37 | 0.09 | 0.53 | 0.04 | 0.51 | 0.08 | 0.40 | 0.05 | 0.58 | 0.10 | 0.66 |
| JSWAS | 0.06 | 0.77 | 0.07 | 0.72 | 0.08 | 0.89 | 0.08 | 0.98 | 0.06 | 0.79 | 0.10 | 0.94 |
Results of multiple linear regression analyses of 3D joint space metrics as a function of age, BMI, and JTHFT for both MCP2 and MCP3 joints.
Displayed are the R2 values with their associated p values. *A significant correlation was noted if p < 0.05. Significant values were bolded for emphasis.
4 Discussion
The results of our study demonstrated that HR-pQCT-derived 3D JSW metrics did not differ between RA patients and an age-and sex-matched control group despite differences in disease severity and functional outcomes. As expected, there was a significant association between some metrics, in particular JSWMAX, with age and sex. Only the association between JSWMAX and age depended on diagnosis.
Larger JSV, JSW, and JSWMAX in males than females were consistent with previous findings, and the observation that these metrics are related to overall joint size more than joint degeneration (15). The finding that minimum JSW (JSWMIN) was smaller in females than males in MCP3 requires further investigation as this was not consistent with results in previous studies using only RA patients, and may reflect the relatively small sample of males in the current study.
The absence of significant associations between JSW metrics and age, with the exception of JSWMAX, suggests that MCP2 and MCP3 are not significantly affected by age-related degeneration. Hand osteoarthritis can cause joint space narrowing, however the distal interphalangeal, proximal interphalangeal and first carpometacarpal joints are more commonly affected than the MCP joints (25). Nonetheless, as cortical bone interruptions, indicative of erosive damage, increase with age (26) we recommend considering age as an important variable in HR-pQCT studies in RA.
Obesity can cause systemic inflammation, which is known to be associated with an increased incidence of RA (27, 28). Despite its association with RA, some studies have shown a negative correlation between joint space and obesity (29), while other studies have shown a protective effect (30, 31). In our study, HR-pQCT acquired 3D joint space metrics were not associated with BMI, thus (a) higher BMI may have had a protective role or (b) our metrics were not sensitive enough to detect the small changes that may be associated with BMI.
Overall, our findings suggest that HR-pQCT-derived 3D JSW metrics cannot identify significant group-level differences in 3D JSW metrics between RA patients and age-and sex-matched controls. Further research may be required to determine whether this finding reflects the absence of a true difference between groups or an inability to detect true differences with HR-pQCT. Lack of group-level differences may be attributed in part overall well-controlled disease activity within this group of RA participants (Supplementary Figure S1). In the future, with a larger sample size, age-, and sex-, dependent MCP Z-scores could be calculated. Similar work has been previously shown in the proximal interphalangeal joint – which have shown age-and sex-dependent joint space decreases (32, 33). Nonetheless, our measures of disease activity and function did demonstrate that, on average, the control group had healthier joints. Further research should investigate whether HR-pQCT assessed JSW metrics can be used for the purposes of clinical trials to sensitively detect changes over time.
Statements
Data availability statement
The raw data supporting the conclusions of this article will be made available by the authors, without undue reservation.
Ethics statement
The studies involving humans were approved by the Conjoint Health Research Ethics Board (CHREB), University of Calgary. The studies were conducted in accordance with the local legislation and institutional requirements. The participants provided their written informed consent to participate in this study.
Author contributions
JT: Data curation, Formal analysis, Investigation, Methodology, Project administration, Visualization,Writing – original draft, Writing – review & editing. DC: Data curation, Writing – review & editing. PS: Data curation, Investigation, Methodology, Writing – review & editing. CEHB: Investigation, Methodology, Resources, Writing – review & editing. GH: Investigation, Methodology, Resources, Writing – review & editing. ChB: Conceptualization, Writing – review & editing. CP: Data curation, Investigation, Methodology, Writing – review & editing. AI: Data curation, Investigation, Methodology, Writing – review & editing. DM: Conceptualization, Writing – review & editing. SM: Funding acquisition, Methodology, Project administration, Supervision, Writing – original draft.
Funding
The author(s) declare that financial support was received for the research, authorship, and/or publication of this article. This project was supported by the Arthritis Society Stars Career Development Award (Manske, STAR-18-0189). JT was supported by a CIHR Post-Doctoral Fellowship. CEHB was funded through the Arthritis Stars Career Development Award (STAR-19-0611) and from the Canadian Institutes of Health Research-Institute of Musculoskeletal Health and Arthritis (CIHR SI2-169745).
Acknowledgments
Dianne Mosher, Deborah Marshall, Claire Barber, Susanne Benseler, Marinka Twilt, and Paul MacMullan established the Rheum4U Program. Dianne Mosher, Deborah Marshall, and Susanne Benseler act as the Research Operations Committee for the Rheum4U Program. Inelda Gjata, Martina Stevenson and Namneet Sandhu provided project support, helped with data collection, recruitment, and chart reviews. We would like to thank participating physicians and patients who contributed data to the cohort, as well as clinic staff, allied health professionals and registered nurses at the Richmond Road Diagnostic and Treatment Center and South Health Campus Hospital. The Rheum4U Program is supported by unrestricted educational grants from the following pharmaceutical companies: AbbVie; Amgen; Bristol-Myers Squibb (BMS); Celgene; Janssen; Novartis; Organon; Pfizer; Roche; Sanofi; Sandoz; Swedish Orphan Biovitrum AB (publ) (4); and Union Chimique Belge (UCB).
Conflict of interest
The authors declare that the research was conducted in the absence of any commercial or financial relationships that could be construed as a potential conflict of interest.
Publisher’s note
All claims expressed in this article are solely those of the authors and do not necessarily represent those of their affiliated organizations, or those of the publisher, the editors and the reviewers. Any product that may be evaluated in this article, or claim that may be made by its manufacturer, is not guaranteed or endorsed by the publisher.
Supplementary material
The Supplementary material for this article can be found online at: https://www.frontiersin.org/articles/10.3389/fmed.2024.1387532/full#supplementary-material
References
1.
Matcham F Scott IC Rayner L Hotopf M Kingsley GH Norton S et al . The impact of rheumatoid arthritis on quality-of-life assessed using the SF-36: a systematic review and meta-analysis. Semin Arthritis Rheum. (2014) 44:123–30. doi: 10.1016/j.semarthrit.2014.05.001
2.
Liphardt AM Manger E Liehr S Bieniek L Kleyer A Simon D et al . Similar impact of psoriatic arthritis and rheumatoid arthritis on objective and subjective parameters of hand function. ACR Open Rheumatol. (2020) 2:734–40. doi: 10.1002/acr2.11196
3.
Sparks JA . Rheumatoid arthritis. Ann Intern Med. (2019) 170:ITC1-ITC16. doi: 10.7326/AITC201901010
4.
McPherson C In: SmallJDFoxJG, editors. The mouse in biomedical research: Academic Press (1983). xi–xii.
5.
Pfeil A Böttcher J Seidl BE Heyne J-P Petrovitch A Eidner T et al . Computer-aided joint space analysis of the metacarpal-phalangeal and proximal-interphalangeal finger joint: normative age-related and gender-specific data. Skeletal Radiol. (2007) 36:853–64. doi: 10.1007/s00256-007-0304-8
6.
Pfeil A Hansch A Lehmann G Eidner T Schäfer ML Oelzner P et al . Impact of sex, age, body mass index and handedness on finger joint space width in patients with prolonged rheumatoid arthritis using computer-aided joint space analysis. Rheumatol Int. (2009) 29:517–24. doi: 10.1007/s00296-008-0728-z
7.
Loeser RF Shakoor N . Aging or osteoarthritis: which is the problem?Rheum Dis Clin. (2003) 29:653–73. doi: 10.1016/S0889-857X(03)00062-0
8.
Khosla S Riggs BL Atkinson EJ Oberg AL McDaniel LJ Holets M et al . Effects of sex and age on bone microstructure at the ultradistal radius: a population-based noninvasive in vivo assessment. J Bone Miner Res. (2006) 21:124–31. doi: 10.1359/JBMR.050916
9.
Pfeil A Böttcher J Schäfer ML Seidl BE Schmidt M Petrovitch A et al . Normative reference values of joint space width estimated by computer-aided joint space analysis (CAJSA): the distal interphalangeal joint. J Digit Imaging. (2008) 21:104–12. doi: 10.1007/s10278-007-9031-x
10.
Kwok WY Bijsterbosch J Malm SH Biermasz NR Huetink K Nelissen RG et al . Validity of joint space width measurements in hand osteoarthritis. Osteoarthr Cartil. (2011) 19:1349–55. doi: 10.1016/j.joca.2011.08.011
11.
Cao JJ . Effects of obesity on bone metabolism. J Orthop Surg Res. (2011) 6:30. doi: 10.1186/1749-799X-6-30
12.
Moroni L Farina N Dagna L . Obesity and its role in the management of rheumatoid and psoriatic arthritis. Clin Rheumatol. (2020) 39:1039–47. doi: 10.1007/s10067-020-04963-2
13.
for the SPECTRA Collaboration Stok KS Burghardt AJ Boutroy S Peters MPH Manske SL et al . Consensus approach for 3D joint space width of metacarpophalangeal joints of rheumatoid arthritis patients using high-resolution peripheral quantitative computed tomography. Quant Imaging Med Surg. (2020) 10:314–25. doi: 10.21037/qims.2019.12.11
14.
Brunet SC Tse JJ Kuczynski MT Engelke K Boyd SK Barnabe C et al . Heterogenous bone response to biologic DMARD therapies in rheumatoid arthritis patients and their relationship to functional indices. Scand J Rheumatol. (2021) 50:417–26. doi: 10.1080/03009742.2020.1869303
15.
Brunet SC Finzel S Engelke K Boyd SK Barnabe C Manske SL . Bone changes in early inflammatory arthritis assessed with high-resolution peripheral quantitative computed tomography (HR-pQCT): a 12-month cohort study. Joint Bone Spine. (2021) 88:105065. doi: 10.1016/j.jbspin.2020.07.014
16.
Burghardt AJ Lee CH Kuo D Majumdar S Imboden JB Link TM et al . Quantitative in vivo HR-pQCT imaging of 3D wrist and metacarpophalangeal joint space width in rheumatoid arthritis. Ann Biomed Eng. (2013) 41:2553–64. doi: 10.1007/s10439-013-0871-x
17.
Barber CEH Sandhu N Rankin JA MacMullan P Marshall DA Barnabe C et al . Rheum4U: development and testing of a web-based tool for improving the quality of care for patients with rheumatoid arthritis. Clin Exp Rheumatol. (2018) 37:385–92. PMID:
18.
Aletaha D Neogi T Silman AJ Funovits J Felson DT Bingham CO 3rd et al . 2010 rheumatoid arthritis classification criteria: an American College of Rheumatology/European league against rheumatism collaborative initiative. Arthritis Rheum. (2010) 62:2569–81. doi: 10.1002/art.27584
19.
Brunet SC Kuczynski MT Bhatla JL Lemay S Pauchard Y Salat P et al . The utility of multi-stack alignment and 3D longitudinal image registration to assess bone remodeling in rheumatoid arthritis patients from second generation HR-pQCT scans. BMC Med Imaging. (2020) 20:36–6. doi: 10.1186/s12880-020-00437-8
20.
Pauchard Y Liphardt A-M Macdonald HM Hanley DA Boyd SK . Quality control for bone quality parameters affected by subject motion in high-resolution peripheral quantitative computed tomography. Bone. (2012) 50:1304–10. doi: 10.1016/j.bone.2012.03.003
21.
Bruce B Fries JF . The health assessment questionnaire (HAQ). Clin Exp Rheumatol. (2005) 23:S14–8. PMID:
22.
Gummesson C Atroshi I Ekdahl C . The disabilities of the arm, shoulder and hand (DASH) outcome questionnaire: longitudinal construct validity and measuring self-rated health change after surgery. BMC Musculoskelet Disord. (2003) 4:11. doi: 10.1186/1471-2474-4-11
23.
Jebsen RH Taylor N Trieschmann RB Trotter MJ Howard LA . An objective and standardized test of hand function. Arch Phys Med Rehabil. (1969) 50:311–9. PMID:
24.
Koo TK Li MY . A guideline of selecting and reporting Intraclass correlation coefficients for reliability research. J Chiropr Med. (2016) 15:155–63. doi: 10.1016/j.jcm.2016.02.012
25.
Kloppenburg M Kwok W-Y . Hand osteoarthritis—a heterogeneous disorder. Nat Rev Rheumatol. (2012) 8:22–31. doi: 10.1038/nrrheum.2011.170
26.
Peters M van Tubergen A Scharmga A Driessen A van Rietbergen B Loeffen D et al . Assessment of cortical interruptions in the finger joints of patients with rheumatoid arthritis using HR-pQCT, radiography, and MRI. J Bone Miner Res. (2018) 33:1676–85. doi: 10.1002/jbmr.3466
27.
Crowson CS Matteson EL Davis JM III Gabriel SE . Contribution of obesity to the rise in incidence of rheumatoid arthritis. Arthritis Care Res. (2013) 65:71–7. doi: 10.1002/acr.21660
28.
Gioia C Lucchino B Tarsitano MG Iannuccelli C Di Franco M . Dietary habits and nutrition in rheumatoid arthritis: can diet influence disease development and clinical manifestations?Nutrients. (2020) 12:1456. doi: 10.3390/nu12051456
29.
Çimen ÖB Incel NA Yapici Y Apaydin D Erdoğan C . Obesity related measurements and joint space width in patients with knee osteoarthritis. Ups J Med Sci. (2004) 109:159–64. doi: 10.3109/2000-1967-105
30.
van der Helm-van Mil AHM van der Kooij SM Allaart CF Toes REM Huizinga TWJ . A high body mass index has a protective effect on the amount of joint destruction in small joints in early rheumatoid arthritis. Ann Rheum Dis. (2008) 67:769–74. doi: 10.1136/ard.2007.078832
31.
Kaufmann J Kielstein V Kilian S Stein G Hein G . Relation between body mass index and radiological progression in patients with rheumatoid arthritis. J Rheumatol. (2003) 30:2350–5. PMID:
32.
Pfeil A Böttcher J Seidl BE Schäfer ML Hansch A Heyne J-P et al . Computer-aided joint space analysis (CAJSA) of the proximal-interphalangeal joint—normative age-related and gender specific data. Acad Radiol. (2007) 14:594–602. doi: 10.1016/j.acra.2007.01.032
33.
Pfeil A Renz DM Hansch A Kainberger F Lehmann G Malich A et al . The usefulness of computer-aided joint space analysis in the assessment of rheumatoid arthritis. Joint Bone Spine. (2013) 80:380–5. doi: 10.1016/j.jbspin.2012.10.022
Summary
Keywords
rheumatoid arthritis, high resolution peripheral quantitative computed tomography, joint space narrowing, metacarpophalangeal joints, joint space metrics
Citation
Tse JJ, Contreras D, Salat P, Barber CEH, Hazlewood GS, Barnabe C, Penney C, Ibrahem A, Mosher D and Manske SL (2024) Evaluating high-resolution computed tomography derived 3-D joint space metrics of the metacarpophalangeal joints between rheumatoid arthritis and age- and sex-matched control participants. Front. Med. 11:1387532. doi: 10.3389/fmed.2024.1387532
Received
17 February 2024
Accepted
16 April 2024
Published
09 May 2024
Volume
11 - 2024
Edited by
Alexander Pfeil, University Hospital Jena, Germany
Reviewed by
Paula Hoff, MVZ Endokrinologikum Berlin am Gendarmenmarkt, Germany
Tobias Hoffmann, University Hospital Jena, Germany
Updates
Copyright
© 2024 Tse, Contreras, Salat, Barber, Hazlewood, Barnabe, Penney, Ibrahem, Mosher and Manske.
This is an open-access article distributed under the terms of the Creative Commons Attribution License (CC BY). The use, distribution or reproduction in other forums is permitted, provided the original author(s) and the copyright owner(s) are credited and that the original publication in this journal is cited, in accordance with accepted academic practice. No use, distribution or reproduction is permitted which does not comply with these terms.
*Correspondence: Sarah L. Manske, smanske@ucalgary.ca
Disclaimer
All claims expressed in this article are solely those of the authors and do not necessarily represent those of their affiliated organizations, or those of the publisher, the editors and the reviewers. Any product that may be evaluated in this article or claim that may be made by its manufacturer is not guaranteed or endorsed by the publisher.