 Dongmei Han1†
 Tianbao Sun
 Han Li
- 1The Rehabilitation Department of Nephrology, The First Rehabilitation Hospital of Shanghai, School of Medicine, Tongji University, Shanghai, China
- 2Yulong County Naxi Autonomous County People's Hospital, Lijiang, Yunnan, China
Objective: The study aimed to explore the risk factors for hyperuricemia (HUA) in the Naxi ethnic population residing in high-altitude areas of Yunnan, China, and assess the clinical value of the triglyceride/high-density lipoprotein cholesterol (TG/HDL-c) ratio as a diagnostic marker.
Methods: In this cross-sectional study, clinical data were collected from the health checkup population in the People's Hospital of Yulong Naxi Autonomous County, Yunnan Province, from January 2021 to January 2023. Participants were divided into quartiles based on the TG/HDL-c ratio (Q1, Q2, Q3, and Q4) for group analysis using chi-square tests, t-tests, and rank sum tests. Logistic regression analysis and linear regression models were employed to further investigate the correlation between the prevalence of hyperuricemia and TG/HDL-c ratio in this high-altitude Naxi population.
Results: A total of 714 participants from the health checkup population were included in the study, of whom 61.5% were male participants and 38.5% were female participants, and the average age was 41.21 ± 11.69 years. The mean uric acid level was 388.51 ± 99.24. After correcting for confounding factors, TG/HDL-c, serum creatinine (Scr), blood urea nitrogen (BUN), triglyceride (TG), high-density lipoprotein cholesterol (HDL-c), red blood cells (RBCs), and hemoglobin (Hb) showed a positive correlation with blood uric acid. Further analysis involved categorizing the TG/HDL-c ratio from a continuous variable to a categorical variable using quartiles. The fully adjusted model showed results that were consistent with the trend observed in the continuous variable analysis when considering the TG/HDL-c ratio as a categorical variable. In addition, in all unadjusted and adjusted models, the serum uric acid (SUA) levels in the high TG/HDL-c ratio group were significantly higher than those in the low TG/HDL-c ratio group (trend p < 0.001). Further linear relationship analysis indicated that after adjusting for covariates, there was an approximate linear relationship between the TG/HDL-c and SUA levels, with a coefficient (β) of 5.421.
Conclusion: The prevalence of hyperuricemia is greater in high-altitude areas of Yunnan, showing a nearly linear positive correlation with the TG/HDL-c ratio. Monitoring TG/HDL-c levels may benefit patients with hyperuricemia.
Introduction
Hyperuricemia (HUA), a common metabolic disorder characterized by elevated levels of uric acid (UA) in the blood, is caused by disturbances in purine metabolism (1). According to the 2023 Consensus of Multidisciplinary Experts on Hyperuricemia-related Diseases in China, the overall prevalence of HUA among adult residents in China from 2018 to 2019 was 14%. The prevalence was higher in male residents at 24.4% and lower in female residents at 3.6% (2). HUA prevalence varies across regions and ethnicities. Reports indicate that in the eastern and coastal regions of China, the prevalence of HUA among the population ranges from 18.78% to 44.31% in the male population and from 6.26% to 25.89% in the female population (3). In high-altitude areas, such as Qinghai and Yunnan (25.91%), the prevalence of HUA is greater than that in other regions (4). This may be attributed to the dietary patterns, socioeconomic conditions, and genetics associated with these regions or ethnic groups (5–8). However, previous studies in China have focused primarily on the Han ethnic group and regions at moderate-to-low altitudes, with research on the prevalence and risk factors for the development of HUA among minority ethnic groups in high-altitude areas, such as the Naxi ethnic group, being limited. If HUA is not effectively managed and prevented, it can lead to various complications. Relevant studies have shown that HUA status is an independent risk factor for chronic kidney disease, cardiovascular diseases, hypertension, and metabolic syndrome (9–13). The presence of HUA not only increases healthcare costs but also severely impacts the quality of life of affected individuals. Therefore, it is crucial to pay more attention to the prevalence of HUA among local minority ethnic groups and identify the risk factors associated with the development of HUA. Early and effective interventions can improve prognosis, reduce healthcare costs, and increase the overall wellbeing of the population (14).
Abnormal blood lipid concentrations are independent risk factors for the development of HUA, with hypertriglyceridemia and mixed hyperlipidemia status showing a positive correlation with HUA occurrence (15). The triglyceride-to-high-density lipoprotein cholesterol (TG/HDL-c) ratio is an emerging marker of lipid abnormalities, providing a reliable indicator for insulin resistance and metabolic syndrome (5, 6, 13). The TG/HDL-c ratio has also been demonstrated to have considerable clinical value in predicting the onset of metabolic syndrome, cardiovascular events, and chronic kidney failure (16). However, the association between the TG/HDL-c ratio and the risk of developing HUA remains unclear. In this study, we aimed to analyze the health examination data of the Naxi ethnic group residing in high-altitude areas of Yunnan Province. The objective of this study was to explore the risk factors for the development of HUA among this high-altitude minority ethnic group and investigate the correlation between the TG/HDL-c ratio and HUA occurrence. These findings provide valuable insights for the auxiliary diagnosis and prevention of HUA in the local population.
Clinical and biochemical measurements
General information and laboratory test results were collected from the participants, including sex, age, fasting blood glucose (GLU), serum uric acid (SUA), blood creatinine (serum creatinine, Scr), blood urea nitrogen (BUN), triglyceride (TG), cholesterol (TC), high-density lipoprotein (HDL-c), low-density lipoprotein (LDL-c), white blood cells (WBCs), red blood cells (RBCs), hemoglobin (Hb), and platelets (PLTs). All participants were uniformly made to fast at 22:00 h. Blood was collected the next morning for the analysis.
The TG/HDL-c ratio was calculated by dividing the TG level by the HDL-c level, and the TG/HDL-c ratio was grouped according to the interquartile range (IQR), which converted TG/HDL-c from a continuous variable to a categorical variable (Q1, Q2, Q3, and Q4). The diagnostic criterion for hyperuricemia (HUA) was an SUA level above 420 μmol/L, regardless of gender.
Statistical analysis
All analyses were performed using SPSS 14.0 statistical software. Measurement information with normal distribution was expressed as mean ± standard deviation. Comparisons between the two groups were made using an independent samples t-test, and comparisons between multiple groups were made using one-way ANOVA. Measurement information with non-normal distribution was expressed as median (lower quartile and upper quartile), and comparisons between the groups were made using the rank-sum test. Count data were expressed as the number of cases (percentage), and comparisons between the groups were made using the chi-square test. We used univariate and multivariate logistic regression analyses and univariate and multivariate linear regression models to analyze the relationship between the TG/HDL-c ratio and serum uric acid levels; a p-value of < 0.05 was considered statistically significant.
Results
Baseline characteristics of participants
The study enrolled a total of 714 participants, of whom 61.5% were male participants and 38.5% were female participants. The average age was 41.21 ± 11.69 years, with a mean serum uric acid (SUA) level of 388.51 ± 99.24 umol/L. The overall prevalence of hyperuricemia (HUA) was found to be 41.3%. Participants were categorized into four groups based on the values of the TG/HDL-c ratio (refer to Table 1). The statistical analysis revealed significant differences in UA, triglycerides (TG), and high-density lipoprotein cholesterol (HDL-C) levels among the four groups. Specifically, the UA and TG levels exhibited a significant increase with higher TG/HDL-c ratios, while the high-density lipoprotein cholesterol (HDL-C) levels showed a significant decrease (p < 0.001). Further analysis demonstrated a positive association between the prevalence of HUA and increasing TG/HDL-c ratios (Figure 1). Moreover, a significant positive correlation (p < 0.001) was observed between the proportion of male participants, the proportion of smokers, age, and the TG/HDL-c ratio. However, no statistically significant difference was observed in blood urea nitrogen (BUN) across different TG/HDL-c groups.

Table 1. Baseline characteristics of the participants in Yunnan.
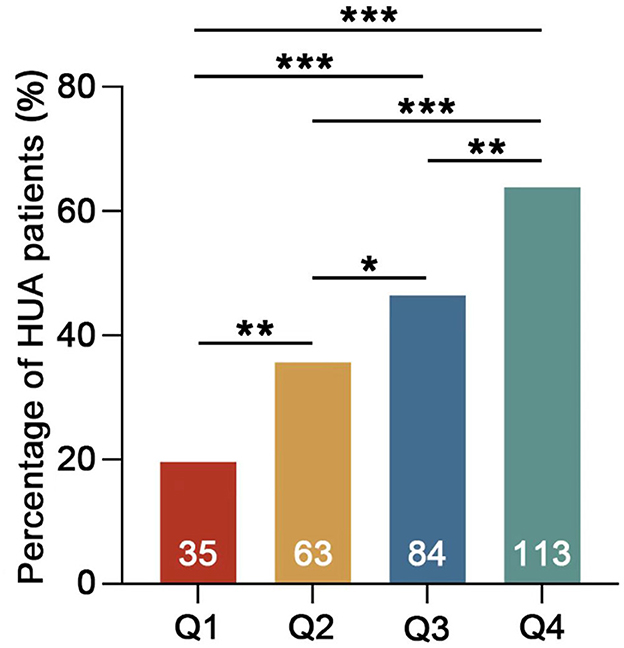
Figure 1. Percentage of HUA patients in different groups. Q1 TG/HDL-c <0.7 mmol/L, Q2 TG/HDL-c 0.7–1.19 mmol/L, Q3 TG/HDL-c 1.2–2.05 mmol/L, and Q4 TG/HDL-c >2.05 mmol/L. The numbers on the columns represent the number of HUA patients in each group (*p < 0.05; **p < 0.01; ***p < 0.001).
Correlation between the TG/HDL-c ratio and HUA
The univariate logistics analysis, as shown in Table 2, reported that higher levels of the TG/HDL-c ratio were positively correlated with the presence of HUA [odds ratio (OR) = 1.135, 95% confidence interval (CI) 1.176–1.471, p < 0.001, Table 2]. In addition, male, smoking, and high levels of Scr, BUN, TG, HDL-c, RBC, and Hb were also risk factors for HUA (p < 0.001, Table 2), while factors including age, Glu, TC, and PLT, did not show any significant relationship with the development of HUA.
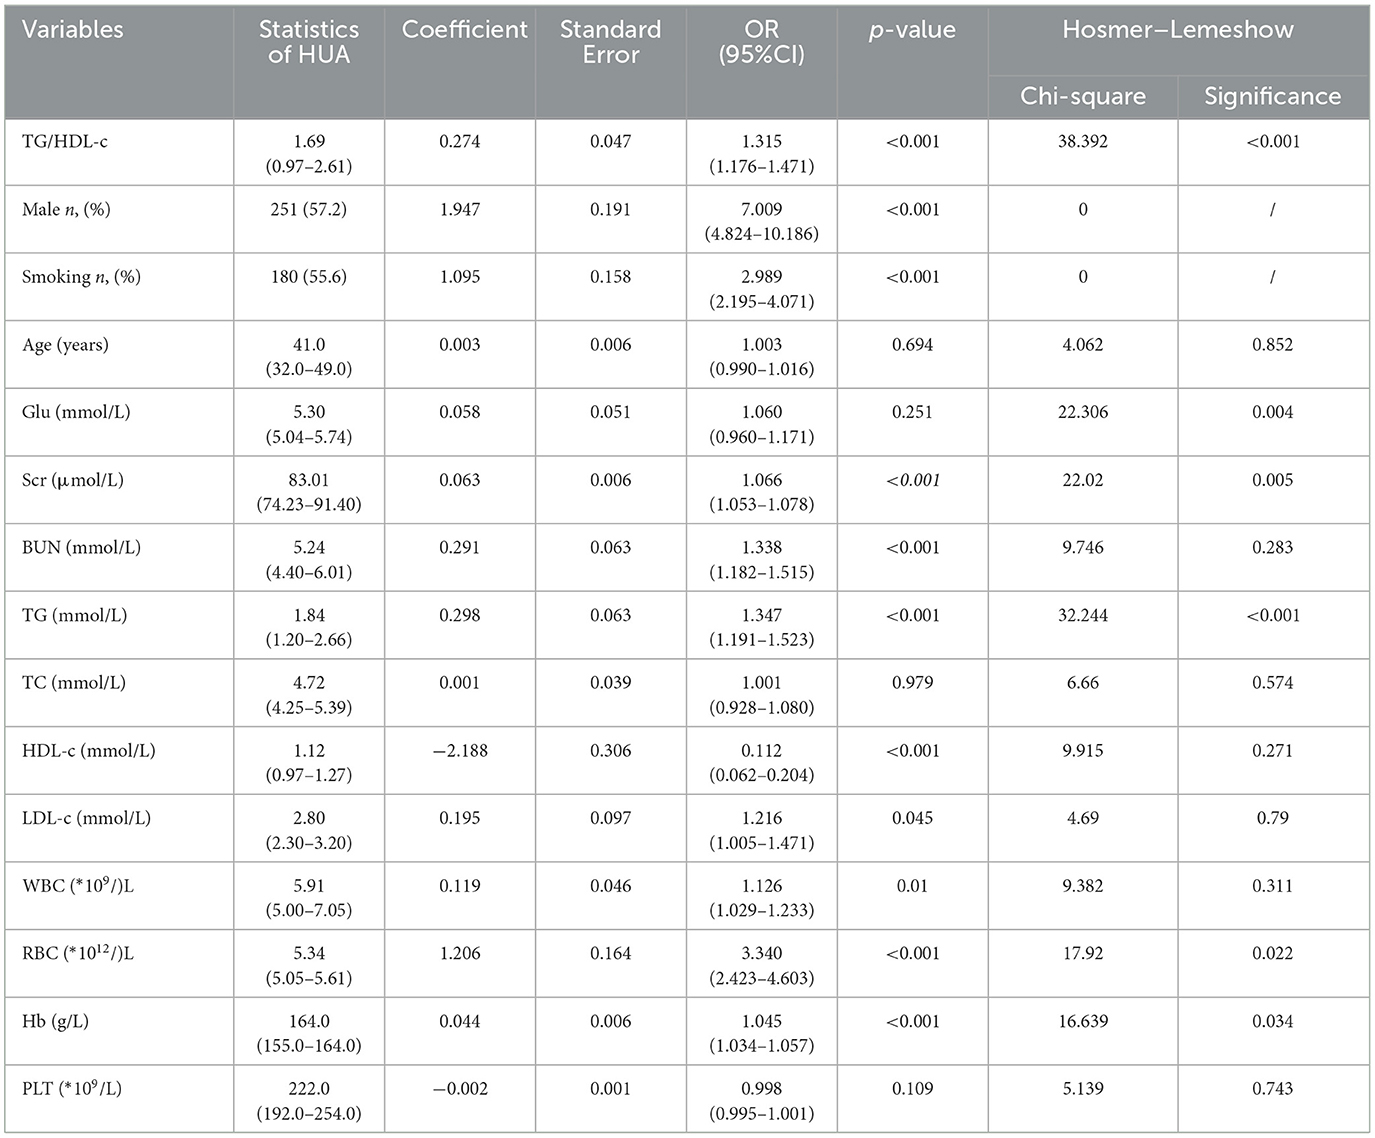
Table 2. Univariate logistics regression analysis of HUA in the Yunnan region.
Linear relationship between TG/HDL-c and serum uric acid
The linear relationship analysis performed revealed that there was an approximate linear relationship between the TG/HDL-c and serum UA levels, after controlling for sex, smoking status, SCr, BUN, LDL-c, WBC, and RBC [β = 5.421, 95% confidence interval (CI) 3.368–7.473, p < 0.001]. It is important to note that there was only a slight presence of multicollinearity between the TG/HDL-c and serum UA levels (VIF = 1.08; Table 3).

Table 3. Linear model analysis.
Incidence of HUA according to TG/HDL-c
We conducted logistic regression analysis using both unadjusted and adjusted models to further demonstrate that the TG/HDL-c ratio is an independent predictor of elevated serum UA levels (Table 4). In the unadjusted model, the TG/HDL-c ratio was positively correlated with the incidence of HUA [OR = 1.315, 95% confidence interval (CI): 1.176–1.471, p < 0.001]. In the fully adjusted model (adjusting for sex, smoking status, SCr, BUN, LDL-c, WBC, and RBC), a higher TG/HDL-c ratio was still positively correlated with the prevalence of HUA (OR=1.199, 95% CI: 1.077–1.334, p < 0.001). The model showed a high level of fitting p = 0.697.
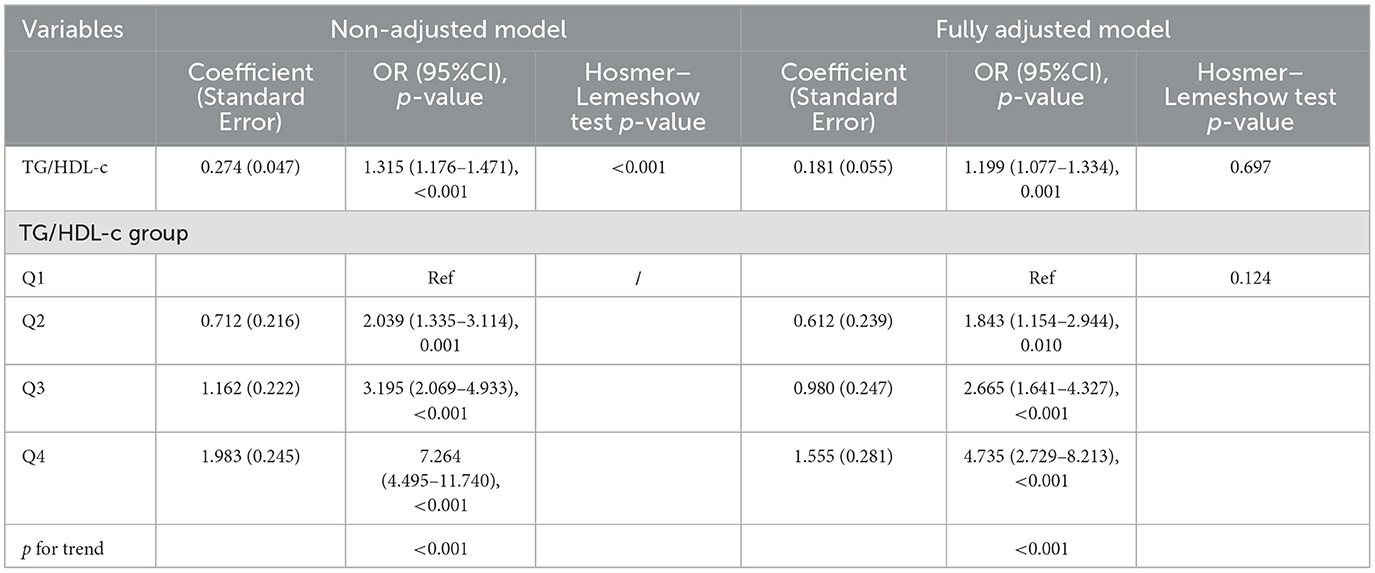
Table 4. The relationship between the TG/HDL-c ratio and HUA in different models.
We also converted the TG/HDL-c ratio from a continuous variable to a categorical variable (quartiles), the p-value for the trend of the categorized TG/HDL-c ratio in the fully adjusted model matched with the result when the TG/HDL-c ratio was a continuous variable. We found significantly higher serum UA levels in the middle and high TG/HDL-c ratio (Q2-Q4) groups compared with the low TG/HDL-c ratio (Q1) group among all the unadjusted and adjusted models (the p-value for the trend was < 0.001). The model showed a high level of fitting (p = 0.124). This suggested a linear relationship between the levels of the TG/HDL-c ratio and HUA.
Discussion
HUA is considered a common and prevalent condition in high-altitude regions, and previous studies have shown a greater incidence of HUA in high-altitude areas than in plains areas (3). Monosodium urate (MSU) deposition in the joints of patients can lead to gouty arthritis and joint deformity. If urate salts are deposited in the kidneys, it may result in UA nephropathy and urolithiasis, eventually leading to renal failure. Urate salts stimulating vascular walls can contribute to the development of atherosclerosis, exacerbating the risk of developing hypertension and coronary heart disease. The present study revealed the total prevalence of HUA to be 41.31% in the Naxi ethnic group in Yunnan, China. The HUA prevalence was 57.17% in male residents and 16% in female residents, which was significantly higher than the 14% prevalence of HUA reported in domestic studies. The higher incidence of HUA in high-altitude regions can be attributed to various factors. Previous studies have demonstrated that in the hypoxic environment of high-altitude areas, the reduced degradation of hypoxanthine leads to the accumulation of xanthine intermediates (17, 18). This, in turn, increases the formation of purine metabolites. In addition, in a hypoxic environment, increased concentrations of lactate in the body exert an inhibitory effect on UA excretion (19, 20). Furthermore, hypoxia induces an increase in the production of RBCs and accelerates the synthesis and breakdown of hemoglobin, resulting in elevated levels of purine metabolites and endogenous cellular breakdown products, thereby further contributing to the elevation of serum UA (SUA) levels (21).
Currently, increasing evidence indicates the significant impact of smoking status on SUA levels worldwide (22–25), a phenomenon that was also observed in our study. Epidemiological studies have suggested a negative correlation between smoking status and SUA levels, which can be attributed to oxidative stress resulting from long-term exposure to smoking (26–28). In addition, SUA levels may be influenced by genetic factors, occupational factors, and unhealthy lifestyle habits (29, 30). Notably, the identification of specific genes associated with rare monogenic disorders that lead to markedly elevated UA levels provides insights into the etiology of HUA. For example, familial juvenile hyperuricemia nephropathy is caused by deficiencies in hypoxanthine-guanine phosphoribosyltransferase or the overactivity of phosphoribosyl pyrophosphate synthetase-1 (31, 32). Moreover, the prevalence of HUA is closely associated with local temperature, barometric pressure, and air humidity. The Lijiang region in Yunnan is a high-altitude area characterized by high barometric pressure and low air density. Under these conditions, urate salts in the joint cavities of individuals with HUA are more prone to form deposits. Diet plays a significant role in HUA, as an increased intake of purine-rich foods can lead to elevated UA production (33, 34). Previous studies have indicated that a plant-based diet, a Mediterranean diet, and a low-sodium diet are associated with a decreased risk of developing HUA (35, 36). Furthermore, previous studies have shown that the consumption of meat and poultry can increase UA levels (37). Conversely, the consumption of dietary antioxidants, such as dietary fiber, zinc, magnesium, and vitamin D, has been shown to inhibit the development of HUA (38–41). Further analysis of the dietary patterns of the Naxi ethnic group in the Lijiang region of Yunnan revealed that the majority of the population consists of ethnic minorities who consume a high-sodium diet. They tend to consume beef, mutton, barley, and butter tea, and they prefer cured meats, such as cured pork ribs, three-line meat, and sausages, as well as ham. There is also a higher prevalence of alcohol and tobacco consumption among the population. These findings provide valuable insights for further research on the associations between dietary patterns, lifestyle habits, and the incidence of HUA. These findings also enable the local healthcare system to implement and improve health screenings in the region and develop interventions in terms of nutrition education and lifestyle modifications (42).
The correlations of the TG/HDL-c ratio and the concentrations of SCr, BUN, TG, HDL-c, RBC, and Hb with the UA levels were assessed. In the fully adjusted model presented in Table 3, we further considered the influence of variables, such as sex, smoking status, the concentrations of SCr, BUN, LDL-c, and the WBC and RBC counts. The results shown in Table 3 indicate that, in the adjusted model, the TG/HDL-c ratio remained positively associated with the SUA levels. Specifically, there was an approximately linear relationship with a coefficient of 5.421 [95% confidence interval (CI): 3.368–7.473, p < 0.001]. For each one-unit increase in the TG/HDL-c ratio value, the average SUA level increased by 5.421 μmol/L. This finding indicates that the TG/HDL-c ratio is an independent factor influencing the risk of developing HUA and is not influenced by other potential factors. The TG/HDL-c ratio reflects the disruption of lipid metabolism and abnormal metabolism of cholesterol and TGs, which can lead to abnormal production and excretion of UA. As a result, UA accumulates, thereby increasing the risk of developing HUA and the risk of its progression. The mechanism behind this may be that when the body produces more lipids than it can metabolize, lipids accumulate in organs, such as the kidneys. Excessive lipid deposition can trigger various signaling pathways, including inflammation, oxidative stress, and autophagy, leading to the development of various diseases. In addition, lipid deposition can promote the proliferation of glomerular basement membrane cells, exacerbate glomerulosclerosis, damage the renal tubular interstitium, and reduce the excretion of UA (43, 44), significantly increasing the risk of developing HUA. Therefore, the TG/HDL-c ratio may also reflect the extent of chronic inflammation, which, in turn, affects the metabolism and excretion of UA (45–48), leading to the occurrence and progression of HUA. Therefore, the determination of the TG/HDL-c ratio is not only useful for evaluating an individual's lipid status and degree of UA metabolism disorder but also has reference value for early screening of HUA in high-altitude areas (49). This finding is consistent with our research, indicating that the TG/HDL-c ratio has significant implications for the diagnosis and treatment of HUA in high-altitude regions.
Several previous studies (50–54) have shown a positive correlation between C-reactive protein (CRP) and the prevalence of HUA or high UA levels. However, another study demonstrated that elevated UA levels were not associated with CRP concentrations. Additionally, a previous study by Nigerian researchers revealed no associations between the SUA concentration and the erythrocyte sedimentation rate (ESR), CRP concentration, or WBC count. Furthermore, a study conducted in China also indicated no association between the SUA concentration and the CRP concentration or WBC count (55). We believe that an elevated UA concentration in patients with gouty arthritis may increase the WBC count, the concentrations of inflammatory markers, the ESR, and the CRP concentration. However, the participants in our study were individuals from a healthy population undergoing routine medical checkups, and their UA concentrations had not reached levels that would induce elevation of inflammatory markers or increased WBC counts. They did not exhibit any signs of acute inflammation, such as an elevated WBC count, ESR, or hs-CRP concentration. This finding provides a good direction for further investigations into the relationships of HUA status with the risk of developing gout, the WBC count, the ESR, and hs-CRP concentrations.
Although the results of this study provide valuable insights, there are still several limitations. First, owing to the cross-sectional design of the study, causal relationships could not be determined. Therefore, long-term longitudinal studies are needed to validate the impact of the TG/HDL-c ratio on the risk of developing HUA and the predictive value of the TG/HDL-c ratio. Second, the study sample included only middle-aged and elderly individuals from high-altitude areas in Yunnan, and it was a single-center study. In the future, we will increase the sample size, use a multicenter design, and improve follow-up to confirm these research findings. Finally, in this study, we did not consider other important potential confounding factors, such as dietary habits, lifestyle factors, genetic factors, body mass index, and physical activity levels. These factors may influence the relationship between the TG/HDL-c ratio and SUA levels.
Overall, our research results support the correlation between the TG/HDL-c ratio and the risk of developing HUA in high-altitude areas among the Naxi ethnic group. An increased TG/HDL-c ratio may be associated with an increased risk of developing HUA, providing a reliable biomarker for the prevention, diagnosis, and treatment of HUA.
Conclusion
The TG/HDL-C ratio was significantly and positively correlated with SUA.
Data availability statement
The original contributions presented in the study are included in the article/supplementary material, further inquiries can be directed to the corresponding authors.
Ethics statement
The studies involving humans were approved by the Ethics Committee of Shanghai First Rehabilitation Hospital. The studies were conducted in accordance with the local legislation and institutional requirements. The participants provided their written informed consent to participate in this study.
Author contributions
DH: Writing – original draft, Writing – review & editing, Data curation, Formal analysis, Investigation. YY: Writing – original draft, Writing – review & editing. FW: Writing – review & editing, Investigation. WH: Writing – review & editing, Data curation. TS: Supervision, Writing – review & editing. HL: Funding acquisition, Writing – original draft, Writing – review & editing.
Funding
The author(s) declare financial support was received for the research, authorship, and/or publication of this article. This work was supported by the National Natural Science Foundation of China (Grant No. 62375207).
Acknowledgments
We sincerely thank Ruian People's Hospital and the GWAS website for providing the research conditions and data resources.
Conflict of interest
The authors declare that the research was conducted in the absence of any commercial or financial relationships that could be construed as a potential conflict of interest.
Publisher's note
All claims expressed in this article are solely those of the authors and do not necessarily represent those of their affiliated organizations, or those of the publisher, the editors and the reviewers. Any product that may be evaluated in this article, or claim that may be made by its manufacturer, is not guaranteed or endorsed by the publisher.
References
1. Zhang Y, Yu H, Chai S, Chai X, Wang L, Geng WC, et al. Noninvasive and individual-centered monitoring of uric acid for precaution of hyperuricemia via optical supramolecular sensing. Adv Sci. (2022) 9:e2104463. doi: 10.1002/advs.202104463
2. Diseases CMBoCNHAM-dEGoDaToHaR. China multi-disciplinary expert consensus on diagnosis and treatment of hyperuricemia and related diseases (2023 edition). Chin J Pract Internal Med. (2023) 43:461–80.
3. Lu YX SY, Zhu Y, Liu JP, Sun YE, Ren YL, Tong ZW. Study on the prevalence of hyperuricemia and its relationship with chronic kidney disease in ther urvan residents of Yunnan plateau area. Chin J Nephrol. (2017) 33:589–94.
4. Huang J, Ma ZF, Zhang Y, Wan Z, Li Y, Zhou H, et al. Geographical distribution of hyperuricemia in mainland China: a comprehensive systematic review and meta-analysis. Glob Health Res Policy. (2020) 5:52. doi: 10.1186/s41256-020-00178-9
5. Kuo CF, Grainge MJ, Zhang W, Doherty M. Global epidemiology of gout: prevalence, incidence and risk factors. Nat Rev Rheumatol. (2015) 11:649–62. doi: 10.1038/nrrheum.2015.91
6. Lu X, Li X, Zhao Y, Zheng Z, Guan S, Chan P. Contemporary epidemiology of gout and hyperuricemia in community elderly in Beijing. Int J Rheum Dis. (2014) 17:400–7. doi: 10.1111/1756-185X.12156
7. Singh JA. Racial and gender disparities among patients with gout. Curr Rheumatol Rep. (2013) 15:307. doi: 10.1007/s11926-012-0307-x
8. Li Y, Shen Z, Zhu B, Zhang H, Zhang X, Ding X. Demographic, regional and temporal trends of hyperuricemia epidemics in mainland China from 2000 to 2019: a systematic review and meta-analysis. Glob Health Action. (2021) 14:1874652. doi: 10.1080/16549716.2021.1874652
9. Chinese Society of Endocrinology CMA. Guideline for the diagnosis and management of hyperuricemia and gout in China (2019). Chin J Endocrinol Metab. (2020) 36:1–13.
10. Liu P, Jiang Y, Meng J. Relationship between serum uric acid, metabolic syndrome and resting heart rate in Chinese elderly. Obes Res Clin Pract. (2016) 10:159–68. doi: 10.1016/j.orcp.2015.04.007
11. Kinosian B, Glick H, Garland G. Cholesterol and coronary heart disease: predicting risks by levels and ratios. Ann Intern Med. (1994) 121:641–7. doi: 10.7326/0003-4819-121-9-199411010-00002
12. Barzi F, Patel A, Woodward M, Lawes CM, Ohkubo T, Gu D, et al. A comparison of lipid variables as predictors of cardiovascular disease in the Asia Pacific region. Ann Epidemiol. (2005) 15:405–13. doi: 10.1016/j.annepidem.2005.01.005
13. Zhang Y, Wei F, Chen C, Cai C, Zhang K, Sun N, et al. Higher triglyceride level predicts hyperuricemia: a prospective study of 6-year follow-up. J Clin Lipidol. (2018) 12:185–92. doi: 10.1016/j.jacl.2017.10.009
14. Bolnick HJ, Bui AL, Bulchis A, Chen C, Chapin A, Lomsadze L, et al. Health-care spending attributable to modifiable risk factors in the USA: an economic attribution analysis. Lancet Public Health. (2020) 5:e525–e35. doi: 10.1016/S2468-2667(20)30203-6
15. Fang Y, Mei W, Wang C, Ren X, Hu J, Su F, et al. Dyslipidemia and hyperuricemia: a cross-sectional study of residents in Wuhu, China. BMC Endocr Disord. (2024) 24:2. doi: 10.1186/s12902-023-01528-7
16. Sato F, Nakamura Y, Kayaba K, Ishikawa S. TG/HDL-C ratio as a predictor of stroke in the population with healthy BMI: the jichi medical school cohort study. Nutr Metab Cardiovasc Dis. (2022) 32:1872–9. doi: 10.1016/j.numecd.2022.05.002
17. Chu WY, Allegaert K, Dorlo TPC, Huitema ADR. Semi-mechanistic modeling of hypoxanthine, xanthine, and uric acid metabolism in asphyxiated neonates. Clin Pharmacokinet. (2022) 61:1545–58. doi: 10.1007/s40262-022-01164-9
18. Ren XW, Chen K, Wu J, Yang ZL Ji T, Zhang QH. Distinctive biochemistry profiles associated with hyperuricemia between Tibetans and Hans in China. Front Endocrinol (Lausanne). (2023) 14:1229659. doi: 10.3389/fendo.2023.1229659
19. Saito Y, Tanaka A, Node K, Kobayashi Y. Uric acid and cardiovascular disease: a clinical review. J Cardiol. (2021) 78:51–7. doi: 10.1016/j.jjcc.2020.12.013
20. Du Y, Qi M, Wang W, Chen B. Effect of high-altitude hypoxia environment on uric acid excretion, desmin protein level in podocytes, and Na+-K+- ATPase activity. Cell Mol Biol (Noisy-le-grand). (2022) 68:84–91. doi: 10.14715/cmb/2022.68.6.14
21. Lin J, Zhang S. Analysis of the prevalence situation and related diseases of hyperuricemia in physical examination population in Puer city. Chin J General Practit. (2017) 33:114–5.
22. Kim SK, Choe JY. Association between smoking and serum uric acid in Korean population: Data from the seventh Korea national health and nutrition examination survey 2016. Medicine. (2019) 98:e14507. doi: 10.1097/MD.0000000000014507
23. Fukuhara A, Saito J, Sato S, Saito K, Fukuhara N, Tanino Y, et al. The association between risk of airflow limitation and serum uric acid measured at medical health check-ups. Int J Chron Obstruct Pulmon Dis. (2017) 12:1213–9. doi: 10.2147/COPD.S126249
24. Moon J, Lee H, Kong M, Kim H, Oh Y. Association Between Electronic Cigarette Use and Levels of High-Sensitivity C-Reactive Protein and Uric Acid. Asia Pac J Public Health. (2020) 32:35–41. doi: 10.1177/1010539519899777
25. Golli NE, Jrad-Lamine A, Neffati H, Dkhili H, Rahali D, Dallagi Y, et al. Impact of e-cigarette refill liquid exposure on rat kidney. Regul Toxicol Pharmacol. (2016) 77:109–16. doi: 10.1016/j.yrtph.2016.02.012
26. Haj Mouhamed D, Ezzaher A, Neffati F, Douki W, Gaha L, Najjar MF. Effect of cigarette smoking on plasma uric acid concentrations. Environ Health Prev Med. (2011) 16:307–12. doi: 10.1007/s12199-010-0198-2
27. Wang W, Krishnan E. Cigarette smoking is associated with a reduction in the risk of incident gout: results from the Framingham Heart Study original cohort. Rheumatology. (2015) 54:91–5. doi: 10.1093/rheumatology/keu304
28. Gee Teng G, Pan A, Yuan JM, Koh WP. Cigarette smoking and the risk of incident gout in a prospective cohort study. Arthritis Care Res. (2016) 68:1135–42. doi: 10.1002/acr.22821
29. Kakutani-Hatayama M, Kadoya M, Okazaki H, Kurajoh M, Shoji T, Koyama H, et al. Nonpharmacological management of gout and hyperuricemia: hints for better lifestyle. Am J Lifestyle Med. (2017) 11:321–9. doi: 10.1177/1559827615601973
30. Ko YL. Genetics of hyperuricemia and gout: Insights from recent genome-wide association studies and Mendelian randomization studies. Tzu Chi Med J. (2022) 34:261–9. doi: 10.4103/tcmj.tcmj_117_21
31. Choi HK, Zhu Y, Mount DB. Genetics of gout. Curr Opin Rheumatol. (2010) 22:144–51. doi: 10.1097/BOR.0b013e32833645e8
32. Major TJ, Topless RK, Dalbeth N, Merriman TR. Evaluation of the diet wide contribution to serum urate levels: meta-analysis of population based cohorts. BMJ. (2018) 363:k3951. doi: 10.1136/bmj.k3951
33. Liu F, You F, Yang L, Du X, Li C, Chen G, et al. Nonlinear relationship between oxidative balance score and hyperuricemia: analyses of NHANES 2007-2018. Nutr J. (2024) 23:48. doi: 10.1186/s12937-024-00953-1
34. Choi HK, McCormick N, Lu N, Rai SK, Yokose C, Zhang Y. Population impact attributable to modifiable risk factors for hyperuricemia. Arthritis Rheumatol. (2020) 72:157–65. doi: 10.1002/art.41067
35. Rai SK, Fung TT, Lu N, Keller SF, Curhan GC, Choi HK. The dietary approaches to stop hypertension (DASH) diet, Western diet, and risk of gout in men: prospective cohort study. BMJ. (2017) 357:j1794. doi: 10.1136/bmj.j1794
36. Song P, Wang H, Xia W, Chang X, Wang M, An L. Prevalence and correlates of hyperuricemia in the middle-aged and older adults in China. Sci Rep. (2018) 8:4314. doi: 10.1038/s41598-018-22570-9
37. Sun X, Wen J, Guan B, Li J, Luo J, Li J, et al. Folic acid and zinc improve hyperuricemia by altering the gut microbiota of rats with high-purine diet-induced hyperuricemia. Front Microbiol. (2022) 13:907952. doi: 10.3389/fmicb.2022.907952
38. Zhang Y, Qiu H. Dietary magnesium intake and hyperuricemia among US adults. Nutrients. (2018) 10:296. doi: 10.3390/nu10030296
39. Gong R, Xu Z, Wei X. The association between vitamin D3 and diabetes in both hyperuricemia and non-hyperuricemia populations. Endocrine. (2021) 74:90–9. doi: 10.1007/s12020-021-02778-y
40. Li H, Liu X, Lee MH Li H. Vitamin C alleviates hyperuricemia nephropathy by reducing inflammation and fibrosis. J Food Sci. (2021) 86:3265–76. doi: 10.1111/1750-3841.15803
41. Wang HR, Shen ZY, Huan HM, Jin M, Sun X. Survey of hyperuricemia and related factors among elderly in a community of Shanghai. Chin J Gen Pract. (2022) 21:430–6.
42. Russo G, Piscitelli P, Giandalia A, Viazzi F, Pontremoli R, Fioretto P, et al. Atherogenic dyslipidemia and diabetic nephropathy. J Nephrol. (2020) 33:1001–8. doi: 10.1007/s40620-020-00739-8
43. Saland JM, Kupferman JC, Pierce CB, Flynn JT, Mitsnefes MM, Warady BA, et al. Change in dyslipidemia with declining glomerular filtration rate and increasing proteinuria in children with CKD. Clin J Am Soc Nephrol. (2019) 14:1711–8. doi: 10.2215/CJN.03110319
44. Engel B, Hoffmann F, Freitag MH, Jacobs H. Should we be more aware of gender aspects in hyperuricemia? Analysis of the population-based German health interview and examination survey for adults (DEGS1). Maturitas. (2021) 153:33–40. doi: 10.1016/j.maturitas.2021.08.002
45. Topolyanskaya SV, Vakulenko ON, Semashkova AE, Kupina LM, Dvoretskiy LI. Hyperuricemia and cardiovascular diseases in very elderly patients with coronary artery disease. SN Compr Clin Med. (2020) 2:173–80. doi: 10.1007/s42399-019-00203-0
46. Xu Y, Lyu J, Chen X. Metabolic evaluation in stone formation with hyperuricemia. Chin Med J (Engl). (2014) 127:1582–4. doi: 10.3760/cma.j.issn.0366-6999.20131562
47. Liu XY, Wu QY, Chen ZH, Yan GY, Lu Y, Dai HJ, et al. Elevated triglyceride to high-density lipoprotein cholesterol (TG/HDL-C) ratio increased risk of hyperuricemia: a 4-year cohort study in China. Endocrine. (2020) 68:71–80. doi: 10.1007/s12020-019-02176-5
48. Yang T, Ding X, Wang YL, Zeng C, Wei J, Li H, et al. Association between high-sensitivity C-reactive protein and hyperuricemia. Rheumatol Int. (2016) 36:561–6. doi: 10.1007/s00296-016-3429-z
49. Ho WJ, Tsai WP, Yu KH, Tsay PK, Wang CL, Hsu TS, et al. Association between endothelial dysfunction and hyperuricaemia. Rheumatology (Oxford). (2010) 49:1929–34. doi: 10.1093/rheumatology/keq184
50. Drivelegka P, Forsblad-d'Elia H, Angerås O, Bergström G, Schmidt C, Jacobsson LTH, et al. Association between serum level of urate and subclinical atherosclerosis: results from the SCAPIS Pilot. Arthritis Res Ther. (2020) 22:37. doi: 10.1186/s13075-020-2119-0
51. Ziv-Baran T, Wasserman A, Goldiner I, Stark M, Shenhar-Tsarfaty S, Shapira I, et al. The association between C-reactive protein and common blood tests in apparently healthy individuals undergoing a routine health examination. Clin Chim Acta. (2020) 501:33–41. doi: 10.1016/j.cca.2019.12.002
52. Spiga R, Marini MA, Mancuso E, Di Fatta C, Fuoco A, Perticone F, et al. Uric acid is associated with inflammatory biomarkers and induces inflammation via activating the NF-κB signaling pathway in HepG2 cells. Arterioscler Thromb Vasc Biol. (2017) 37:1241–9. doi: 10.1161/ATVBAHA.117.309128
53. Wasserman A, Shnell M, Boursi B, Guzner-Gur H. Prognostic significance of serum uric acid in patients admitted to the department of medicine. Am J Med Sci. (2010) 339:15–21. doi: 10.1097/MAJ.0b013e3181bbb647
54. Ghamri RA, Galai TA, Ismail RA, Aljuhani JM, Alotaibi DS, Aljahdali MA. Prevalence of hyperuricemia and the relationship between serum uric acid concentrations and lipid parameters among King Abdulaziz University Hospital patients. Niger J Clin Pract. (2022) 25:439–47. doi: 10.4103/njcp.njcp_1549_21
Keywords: high altitude, hyperuricemia, triglycerides, high-density lipoprotein cholesterol, serum uric
Citation: Han D, Yao Y, Wang F, He W, Sun T and Li H (2024) A study on the correlation between hyperuricemia and TG/HDL-c ratio in the Naxi ethnic group at high-altitude regions of Yunnan. Front. Med. 11:1416021. doi: 10.3389/fmed.2024.1416021
Received: 11 April 2024; Accepted: 24 July 2024;
Published: 12 August 2024.
Edited by:
Giuseppe Castaldo, University of Naples Federico II, ItalyReviewed by:
Giuseppe Terrazzano, Università degli Studi della Basilicata, ItalyGaetano Corso, University of Foggia, Italy
Copyright © 2024 Han, Yao, Wang, He, Sun and Li. This is an open-access article distributed under the terms of the Creative Commons Attribution License (CC BY). The use, distribution or reproduction in other forums is permitted, provided the original author(s) and the copyright owner(s) are credited and that the original publication in this journal is cited, in accordance with accepted academic practice. No use, distribution or reproduction is permitted which does not comply with these terms.
*Correspondence: Tianbao Sun, c3RiODQ5OUAxMjYuY29t; Han Li, MTgwNTE2M0B0b25namkuZWR1LmNu
†These authors have contributed equally to this work and share first authorship