Abstract
Purpose:
This meta-analysis evaluates the comparative diagnostic efficacy of 68Ga-prostate-specific membrane antigen-11 PET (68Ga-PSMA-11 PET) and multiparametric MRI (mpMRI) for the initial lymph node staging of prostate cancer.
Methods:
We searched PubMed and Embase databases through October 2023 for studies that provide a head-to-head comparison of 68Ga-PSMA-11 PET and mpMRI, using pelvic lymph node dissection as the gold standard. We assessed sensitivity and specificity using the DerSimonian and Laird method, with variance stabilization via the Freeman-Tukey double inverse sine transformation. The quality of included studies was evaluated using the Quality Assessment of Diagnostic Performance Studies (QUADAS-2) tool.
Results:
The meta-analysis incorporated 13 articles, involving a total of 1,527 patients. 68Ga-PSMA-11 PET demonstrated an overall sensitivity of 0.73 (95% CI: 0.51–0.91) and a specificity of 0.94 (95% CI: 0.88–0.99). In comparison, mpMRI showed a sensitivity of 0.49 (95% CI: 0.30–0.68) and a specificity of 0.94 (95% CI: 0.88–0.99). Although 68Ga-PSMA-11 PET appeared to be more sensitive than mpMRI, the differences in sensitivity (p = 0.11) and specificity (p = 0.47) were not statistically significant.
Conclusion:
Our findings indicated that 68Ga-PSMA-11 PET and mpMRI exhibit similar sensitivity and specificity in the diagnosis of initial lymph node staging of prostate cancer. However, given that most included studies were retrospective, further prospective studies with larger sample sizes are essential to validate these results.
Systematic Review Registration:
PROSPERO code is CRD42023495266.
1 Introduction
The 2020 World Cancer Report data indicates that prostate cancer ranks as the 6th most common malignancy in terms of incidence and the 9th in terms of mortality among males (1). In the realm of prostate cancer diagnostics and therapeutics, the evaluation for lymph node metastasis is imperative, given its critical role as a prognostic determinant (2). The identification of cancer metastasis to lymph nodes aids physicians in gauging the disease’s severity, devising more targeted treatment strategies, and estimating patient survival rates and quality of life, thereby underscoring its significance in comprehensive prostate cancer management (3). Given the limitations of pelvic lymph node dissection (PLND) in terms of increased risk of complications and longer hospital stays, there has been a focus on alternative approaches to improve diagnostic accuracy while minimizing adverse effects (3, 4). Conventional imaging techniques such as computed tomography (CT) and magnetic resonance imaging (MRI) have been widely used to assess pelvic lymph nodes. However, their effectiveness is hindered by limitations in sensitivity, specificity, and spatial resolution (5, 6).
In recent years, 68Ga-prostate-specific membrane antigen-11 PET (68Ga-PSMA-11 PET) and multiparametric MRI (mpMRI) have emerged as promising technologies in enhancing the accuracy of initial lymph node staging in prostate cancer (7). These methods have garnered attention for their improved diagnostic precision, yet debates and research continue regarding their relative efficacy, reliability, and accessibility. Several studies present conflicting views on the comparative efficacy of 68Ga-PSMA-11 PET and mpMRI in prostate cancer staging. While some studies highlight the superior sensitivity of 68Ga-PSMA-11 PET, others report comparable diagnostic performance between the two modalities (8–20).
In light of these discrepancies, this meta-analysis aims to systematically evaluate and amalgamate existing research concerning the diagnostic accuracy of 68Ga-PSMA-11 PET and mpMRI in the initial lymph node staging of prostate cancer. To ensure consistency and reduce variability between studies, only those investigations where both modalities were utilized in the same patient cohort have been included.
2 Method
The methodology adhered to the Preferred Reporting Items for a Systematic Review and Meta-analysis of Diagnostic Test Accuracy (PRISMA-DTA) guidelines, ensuring comprehensive and transparent reporting (21). Furthermore, the protocol for this meta-analysis has been registered with PROSPERO (CRD42023495266).
2.1 Search strategy
To gather relevant literature, an extensive search was conducted across databases including PubMed and Embase, covering publications up to October 2023. The search strategy incorporated key terms such as “Positron-Emission Tomography,” “Multiparametric Magnetic Resonance Imaging,” and “Prostatic Neoplasms,” ensuring a focused approach to identifying pertinent studies. For more detailed information regarding the search strategy, refer to Supplementary Table S1.
Additionally, the reference lists of all included studies were manually scrutinized, aiming to uncover any additional relevant articles that may have been missed during the initial database search.
2.2 Inclusion and exclusion criteria
For inclusion in this meta-analysis, studies had to meet specific criteria: population (P): patients undergoing pelvic lymph node staging before radical prostatectomy for prostate cancer; intervention (I): 68Ga-PSMA-11 PET imaging; comparison (C): mpMRI imaging; outcome (O): sensitivity and specificity of each imaging modality in staging pelvic lymph nodes; study design (S): retrospective or prospective design.
Exclusion criteria were applied to maintain study quality and relevance: (1) duplicated articles, abstracts without full texts, editorial comments, letters, case reports, reviews, meta-analyses, irrelevant titles and abstracts, (2) non-English full-text articles were excluded; (3) studies lacking complete or clear data necessary for calculating sensitivity or specificity of the studied imaging modality; (4) patients less than 10; (5) without employing histopathology confirmation from PLND as the reference standard.
The screening process involved two researchers independently evaluating titles and abstracts of retrieved articles. Subsequently, full-text versions of remaining articles were assessed to determine their eligibility for inclusion. Any disagreements between the researchers were resolved through consensus.
2.3 Quality assessment
Two researchers independently assessed the quality and clinical applicability of included studies using the Quality Assessment of Diagnostic Performance Studies (QUADAS-2) tool, which encompasses four critical domains: patient selection, index test, reference standard, and flow and timing. Within each domain, the risk of bias and concerns regarding clinical applicability were categorized as “high risk,” “low risk,” or “unclear risk.” This systematic approach ensured a rigorous evaluation of study quality and provided insights into the practical relevance and applicability of the findings in clinical settings.
2.4 Data extraction
Two researchers independently conducted data extraction from the included articles, covering a range of essential information. This included details about the author, publication year, and the specific imaging test employed in the study. Additionally, data encompassed various study features such as country, design, analysis methods, and duration. Patient characteristics, such as the number of patients or lesions, PSA levels, mean or median age, and Gleason scores, were also extracted. Technical aspects such as scanner modality, ligand dosage, and image analysis techniques were included as well. In instances where discrepancies arose, the researchers engaged in discussions until a consensus was achieved, ensuring the accuracy and reliability of the extracted data.
2.5 Statistical analysis
The DerSimonian and Laird method was employed to assess sensitivity and specificity, which were then transformed using the Freeman–Tukey double inverse sine transformation. To determine the precision of these values, the Jackson method was used to calculate confidence intervals.
Heterogeneity within and between groups was evaluated using the Cochrane Q and I2 statistics. Significantly differing heterogeneity (p < 0.10 or I2 > 50%) prompted further investigation through meta-regression and sensitivity analysis to identify potential sources.
Publication bias was assessed using both funnel plot analysis and Egger’s test, ensuring the examination of potential reporting biases. Statistical significance was set at p < 0.05 for all tests conducted. All statistical analyses were performed using R software version 4.3.2.
3 Results
3.1 Study selection
The preliminary search identified 1,473 publications, of which 855 were duplicates and 602 did not meet the eligibility criteria, leading to their exclusion. Subsequently, a comprehensive review of the full texts of the remaining 16 articles was conducted. Among these, three articles were deemed ineligible due to missing data, resulting in their exclusion from the study. Ultimately, 13 articles that evaluated the diagnostic efficacy of 68Ga-PSMA-11 PET and mpMRI met all criteria and were included in the meta-analysis (8–20). The process of article selection of the PRISMA flow diagram was illustrated in Figure 1.
Figure 1

PRISMA flow diagram illustrating the study selection process.
3.2 Study description and quality assessment
The 13 eligible studies encompassed a total of 1,527 breast cancer patients, with the sample size ranging from 10 to 780 across the studies. Among these, 12 articles adopted a retrospective study design, while 1 article employed a prospective approach. Regarding the analysis methods, 12 studies utilized patient-based analysis, while 1 study employed lesion-based analysis. Detailed characteristics of these studies are summarized in Tables 1, 2, providing an overview of the study and technique specifics related to 68Ga-PSMA-11 PET and mpMRI.
Table 1
| Author | Year | Study characteristics | Number of patients (lesion) | Patient characteristics | ||||||
|---|---|---|---|---|---|---|---|---|---|---|
| Country | Study design | Analysis | Period | PSA level (ng/mL) | Age (year) | Gleason score | Reference standard | |||
| Hotker et al. | 2023 | Switzerland | Retro | PB | 2016–2019 | 41 | NA | Median: 65 | Gleason = 7 (36.6%) Gleason ≥8 (63.4%) | PLND |
| Arslan et al. | 2022 | Turkey | Retro | LB | 2015–2020 | 780 | Median: 5.6 | Mean: 62.47 | Gleason = 7 (84.6%) Gleason ≥8 (15.4%) | ePLND |
| Skawran et al. | 2022 | Switzerland | Retro | PB | 2016–2019 | 35 | Median: 18.3 | Mean: 66 | Gleason = 7 (26.5%) Gleason ≥8 (73.5%) | PLND |
| Szigeti et al. | 2022 | Austria | Pro | PB | 2017–2020 | 81 | Mean: 15.4 | Mean: 64.5 | Gleason ≤6 (1.9%) Gleason = 7 (59.3%) Gleason ≥8 (38.8%) | ePLND |
| Damme et al. | 2021 | Belgium | Retro | PB | 2016–2019 | 81 | Median: 12.29 | Median: 67 | NA | PLND |
| Celen et al. | 2020 | Turkey | Retro | PB | NA | 22 | Mean: 9.49 | Mean: 65.07 | Gleason ≤6 (23.3%) Gleason = 7 (40.0%) Gleason ≥8 (36.7%) | PLND |
| Kulkarni et al. | 2020 | India | Retro | PB | 2016–2018 | 51 | Mean: 39.4 | Mean: 66 | Gleason ≤7 (51.0%) Gleason >7 (49.0%) | PLND |
| Frumer et al. | 2020 | Israel | Retro | PB | 2016–2019 | 89 | Median: 8.5 | Median: 66.9 | Gleason ≤7 (79.8%) Gleason >7 (20.2%) | PLND |
| Franklin et al. | 2020 | Australia | Retro | PB | 2014–2019 | 233 | Mean: 7.4 | Mean: 68 | NA | PLND |
| Yilmaz et al. | 2019 | Turkey | Retro | PB | 2016–2018 | 10 | NA | NA | NA | rPLND |
| Berger et al. | 2018 | Australia | Retro | PB | 2015–2017 | 50 | Mean: 10.6 | Mean: 64.9 | Gleason ≤6 (2%) Gleason = 7 (66%) Gleason ≥8 (32%) | ePLND |
| Gupta et al. | 2017 | India | Retro | PB | 2014–2015 | 12 | Median: 24.3 | Mean: 61.75 | Gleason ≤6 (8.3%) Gleason = 7 (16.7%) Gleason ≥8 (75%) | ePLND |
| Zhang et al. | 2017 | China | Retro | PB | 2017 | 42 | Mean: 52.31 | Mean: 68.86 | Gleason = 7 (42.9%) Gleason ≥8 (57.1%) | PLND |
Study and patient characteristics of the included studies.
Pro, prospective; Retro, retrospective; PB, patient-based; LB, lesion-based; ePLND, extended lymph node dissection; rPLND, retroperitoneal lymph node dissection; PLND, lymph node dissection; NA, not available.
Table 2
| Author | Year | Types of imaging tests | Scanner modality for PET | Scanner modality for mpMRI | Ligand dose | Image analysis | TP, FP, FN, TN (PET/CT) | TP, FP, FN, TN (mpMRI) |
|---|---|---|---|---|---|---|---|---|
| Hotker et al. | 2023 | [68Ga]Ga-PSMA PET vs. mpMRI | SIGNA PET/MR, GE Healthcare, Waukesha, United States; or Discovery MI PET/CT, GE Healthcare, Waukesha, WI, United States | MAGNETOM Skyra, Siemens Healthineers, Erlangen, Germany | 2 MBq/kg | Visual and semiquantitative | TP: 7, FP: 0, FN: 4, TN: 30 | TP: 9, FP: 15, FN: 2, TN: 15 |
| Arslan et al. | 2022 | [68Ga]Ga-PSMA PET vs. mpMRI | GE Discovery 710 (General Electric, Milwaukee WI), GE Discovery IQ (General Electric, Milwaukee WI), or Siemens (Siemens, Erlangen, Germany) Biograph 20 mCT | 3.0 T MR Siemens Healthineers, Magnetom Skyra, Erlangen, Germany |
NA | Visual | TP: 2, FP: 4, FN: 9, TN: 765 | TP: 4, FP: 3, FN: 7, TN: 766 |
| Skawran et al. | 2022 | [68Ga]Ga-PSMA PET vs. mpMRI | SIGNA PET/MR; GE Healthcare, Waukesha, USA | MAGNETOM Skyra, Siemens Healthineers, Erlangen, Germany | 134 ± 18.8 MBq | Visual and semiquantitative | TP: 5, FP: 0, FN: 4, TN: 26 | TP: 9, FP: 3, FN: 5, TN: 6 |
| Szigeti et al. | 2022 | [68Ga]Ga-PSMA PET vs. mpMRI | Philips Ingenuity TF, Amsterdam/the Netherlands, and Siemens Biograph mCT, Erlangen/Germany | Achieva, Philips Medical Systems, Best/The Netherlands | 2.15 MBq/kg | Visual and semiquantitative | TP: 6, FP: 4, FN: 4, TN: 34 | TP: 5, FP: 1, FN: 5, TN: 37 |
| Damme et al. | 2021 | [68Ga]Ga-PSMA PET vs. mpMRI | PSMA-HBED-11 labelling kits provided by ABX, Germany; 68Ge/68Ga Galli Ad generator, IRE Elite, Fleurus, Belgium | Ingenia, Philips Medical Systems, The Netherlands | 110 MBq | Visual and semiquantitative | TP: 31, FP: 2, FN: 0, TN: 48 | TP: 18, FP: 0, FN: 9, TN: 54 |
| Celen et al. | 2020 | [68Ga]Ga-PSMA PET vs. mpMRI | Gemini TF TOF PET-CT; Philips, Cleve-land, OH, United States | Ingenia, Philips Medical Systems, The Netherlands | 125–317 MBq | Visual and semiquantitative | TP: 1, FP: 11, FN: 0, TN: 10 | TP: 1, FP: 0, FN: 9, TN: 12 |
| Kulkarni et al. | 2020 | [68Ga]Ga-PSMA PET vs. mpMRI | General Electric Medical Systems with eight slice helical CT scanner, Chicago, Illinois, United States | GE Discovery MR 750 W, Illinois, United States | 111–166 MBq | Visual and semiquantitative | TP: 13, FP: 3, FN: 3, TN: 16 | TP: 7, FP: 9, FN: 4, TN: 15 |
| Frumer et al. | 2020 | [68Ga]Ga-PSMA PET vs. mpMRI | NA | 3.0-T MR scanner or a 1.5-T scanner with a trans-rectal coil | 112–187 MBq | Visual and semiquantitative | TP: 3, FP: 4, FN: 9, TN: 73 | TP: 1, FP: 2, FN: 8, TN: 71 |
| Franklin et al. | 2020 | [68Ga]Ga-PSMA PET vs. mpMRI | Philips Healthcare, Best, The Nederlands | Skyra; Siemens healthcare, Erlingen, Germany | 200 MBq | Visual and semiquantitative | TP: 28, FP: 14, FN: 30, TN: 161 | TP: 13, FP: 9, FN: 45, TN: 166 |
| Yilmaz et al. | 2019 | [68Ga]Ga-PSMA PET vs. mpMRI | NA | Verio; Siemens Medical Solutions, Erlangen, Germany | 175 MBq | Visual and semiquantitative | TP: 2, FP: 0, FN: 0, TN: 8 | TP: 2, FP: 5, FN: 0, TN: 3 |
| Berger et al. | 2018 | [68Ga]Ga-PSMA PET vs. mpMRI | Philips Gemini TF 64 PET/CT | 3 Tesla machines | NA | Visual and semiquantitative | TP: 1, FP: 4, FN: 1, TN: 44 | TP: 0, FP: 2, FN: 1, TN: 47 |
| Gupta et al. | 2017 | [68Ga]Ga-PSMA PET vs. mpMRI | Biograph TruePoint40 with LSO crystal from Siemens Healthcare | NA | 2 MBq/kg | Visual and semiquantitative | TP: 7, FP: 1, FN: 0, TN: 4 | TP: 4, FP: 1, FN: 3, TN: 4 |
| Zhang et al. | 2017 | [68Ga]Ga-PSMA PET vs. mpMRI | United Imaging Healthcare (UIH), Shanghai, China | Achieva 3.0 T TX, Philips Medical Systems, The Netherlands | 130.6–177.6 MBq | Visual and semiquantitative | TP: 14, FP: 1, FN: 1, TN: 26 | TP: 14, FP: 2, FN: 1, TN: 25 |
Technical aspects of included studies.
TP, true positive; TN, true negative; FP, false positive; FN, false positive; NA, not available.
The risk of bias assessment, conducted using the QUADAS-2 tool, is visually represented in Figure 2. Specifically, 5 studies were identified as having a “high risk” in terms of the index test bias due to undetermined cut-off values. Additionally, 3 studies were categorized as “high risk” in terms of the reference standard bias as the final diagnosis lacked independent confirmation by multiple physicians. Moreover, 4 studies were graded as “high risk” in the flow and timing domain due to participant exclusion from data analyses. Overall, despite these specific biases identified, the overall quality assessment did not raise major concerns regarding the quality of the included studies.
Figure 2

Risk of bias and applicability concerns of the included studies using the Quality Assessment of Diagnostic Performance Studies QUADAS-2 tool.
3.3 Comparing the sensitivity of 68Ga-PSMA-11 PET and mpMRI for diagnosis of initial lymph node staging of prostate cancer
The analysis included a total of 13 studies. The pooled sensitivity of 68Ga-PSMA-11 PET for diagnosing initial lymph node staging of prostate cancer was 0.73 (95% CI: 0.51–0.91), while mpMRI showed an overall sensitivity of 0.49 (95% CI: 0.30–0.68), as depicted in Figure 3. Interestingly, there was no significant difference in sensitivity between 68Ga-PSMA-11 PET and mpMRI (p = 0.11), as indicated by Figure 3.
Figure 3

Forest plot showing the head-to-head comparison of pooled sensitivities of 68Ga-PSMA-11 PET and mpMRI in pelvic lymph node metastases of prostate cancer patients. The plot displays individual study estimates (squares) with corresponding 95% confidence intervals (horizontal lines) and the pooled sensitivity estimate (diamond) for both modalities. The size of the squares represents the relative weight of each study in the meta-analysis.
In terms of heterogeneity, the I2 values for the pooled overall sensitivity were 84% for 68Ga-PSMA-11 PET and 79% for mpMRI, highlighting substantial heterogeneity (Figure 3). Despite this, meta-regression and sensitivity analysis did not identify any potential sources of heterogeneity, as illustrated in Figures 4, 5 and Table 3. Notably, the results from the sensitivity analysis remained stable, with only minor variations observed (ranging from 0.66 to 0.78 for 68Ga-PSMA-11 PET and from 0.43 to 0.53 for mpMRI), as shown in Figures 4, 5.
Figure 4

Forest plot showing the pooled sensitivity of 68Ga-PSMA-11 PET in pelvic lymph node metastases of prostate cancer patients. The plot displays individual study estimates (squares) with corresponding 95% confidence intervals (horizontal lines) and the pooled sensitivity estimate (diamond). The size of the squares represents the relative weight of each study in the meta-analysis.
Figure 5
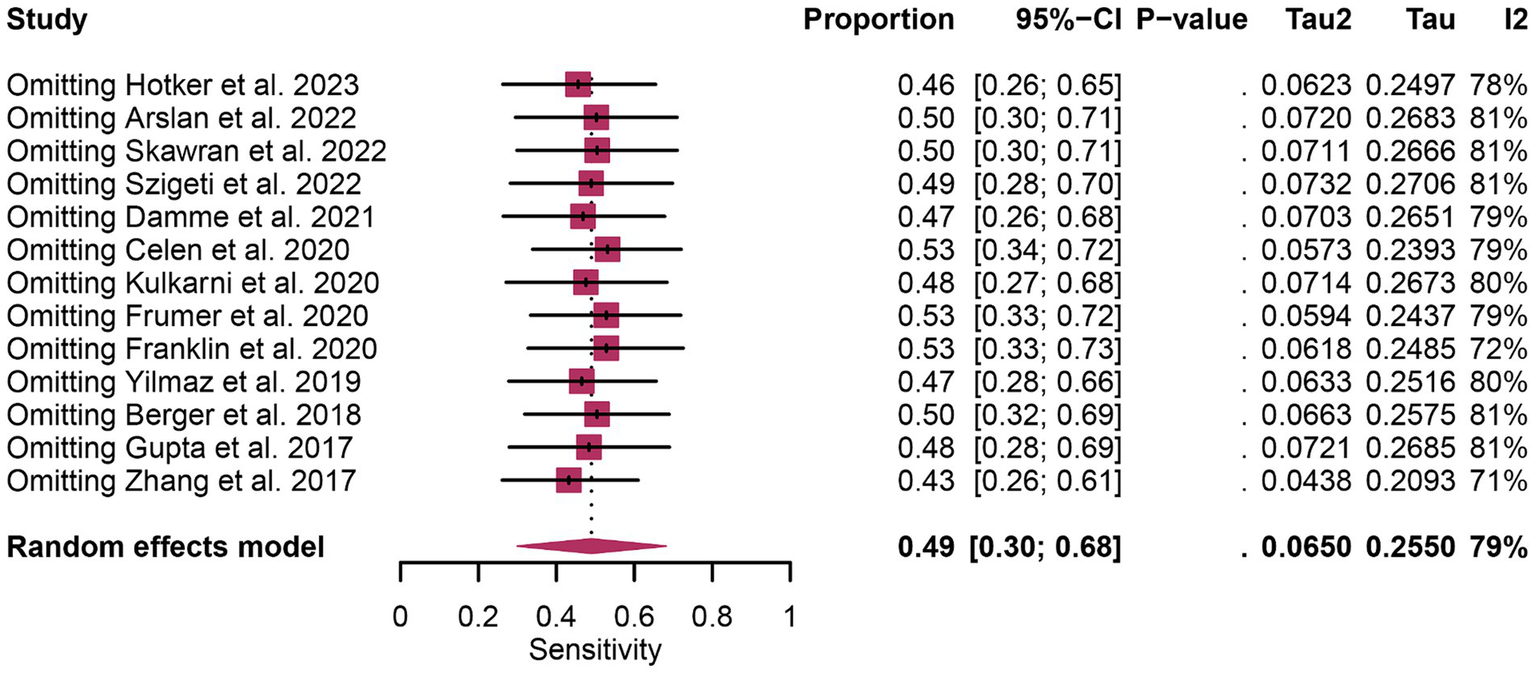
Forest plot showing the pooled sensitivity of mpMRI in pelvic lymph node metastases of prostate cancer patients. The plot displays individual study estimates (squares) with corresponding 95% confidence intervals (horizontal lines) and the pooled sensitivity estimate (diamond). The size of the squares represents the relative weight of each study in the meta-analysis.
Table 3
| Covariate | Studies | Sensitivity for 68Ga-PSMA-11 PET (95% CI) | p-value | Sensitivity for mpMRI (95% CI) | p-value |
|---|---|---|---|---|---|
| Region | 0.42 | 0.16 | |||
| Oceania | 2 | 0.48 [0.33; 0.63] | 0.12 [0.02; 0.27] | ||
| Asia | 7 | 0.76 [0.40; 1.00] | 0.51 [0.22; 0.80] | ||
| Europe | 4 | 0.77 [0.43; 0.99] | 0.61 [0.42; 0.78] | ||
| Number of patients included | 0.33 | 0.35 | |||
| >50 | 6 | 0.60 [0.29; 0.88] | 0.41 [0.22; 0.61] | ||
| ≤50 | 7 | 0.87 [0.64; 1.00] | 0.59 [0.25; 0.90] | ||
| Reference standard | 0.99 | 0.58 | |||
| PLND | 8 | 0.75 [0.49; 0.95] | 0.48 [0.24; 0.72] | ||
| ePLND | 4 | 0.61 [0.16; 0.98] | 0.43 [0.22; 0.66] | ||
| rPLND | 1 | 1.00 [0.16; 1.00] | 1.00 [0.16; 1.00] | ||
| Image analysis | 0.11 | 0.69 | |||
| Visual and semiquantitative | 12 | 0.78 [0.57; 0.94] | 0.50 [0.30; 0.71] | ||
| Visual | 1 | 0.18 [0.02; 0.52] | 0.36 [0.11; 0.69] | ||
| Study design | 0.77 | 0.97 | |||
| Prospective | 1 | 0.60 [0.26; 0.88] | 0.50 [0.19; 0.81] | ||
| Retrospective | 12 | 0.74 [0.50; 0.93] | 0.49 [0.28; 0.70] |
Meta-regression analysis for sensitivity of 68Ga-PSMA-11 PET and mpMRI.
3.4 Comparing the specificity of 68Ga-PSMA-11 PET and mpMRI for diagnosis of initial lymph node staging of prostate cancer
The analysis comprised 13 studies. The pooled specificity of 68Ga-PSMA-11 PET for diagnosing initial lymph node staging of prostate cancer was 0.94 (95% CI: 0.88–0.99), while mpMRI demonstrated an overall specificity of 0.90 (95% CI: 0.79–0.98), as illustrated in Figure 6. Notably, there was no significant difference in the overall specificity between 68Ga-PSMA-11 PET and mpMRI (p = 0.47), as shown in Figure 6.
Figure 6

Forest plot showing the head-to-head comparison of pooled specificities for 68Ga-PSMA-11 PET and mpMRI in pelvic lymph node metastases of prostate cancer patients. The plot displays individual study estimates (squares) with corresponding 95% confidence intervals (horizontal lines) and the pooled specificity estimate (diamond) for both modalities. The size of the squares represents the relative weight of each study in the meta-analysis.
In terms of heterogeneity, the pooled overall specificity exhibited I2 values of 87% for 68Ga-PSMA-11 PET and 91% for mpMRI, indicating substantial heterogeneity (Figures 7, 8). Interestingly, further analysis revealed that the number of patients included in the mpMRI analysis (>50 vs. ≤50, p = 0.02) may be the source of this heterogeneity, as detailed in Table 4. However, sensitivity analysis did not identify any potential sources of heterogeneity and the results remained stable, with only minor variations observed (ranging from 0.93 to 0.97 for 68Ga-PSMA-11 PET and from 0.89 to 0.93 for mpMRI), as depicted in Figures 7, 8.
Figure 7

Forest plot showing the pooled specificity of 68Ga-PSMA-11 PET in pelvic lymph node metastases of prostate cancer patients. The plot displays individual study estimates (squares) with corresponding 95% confidence intervals (horizontal lines) and the pooled specificity estimate (diamond) for both modalities. The size of the squares represents the relative weight of each study in the meta-analysis.
Figure 8

Forest plot showing the pooled specificity of mpMRI in pelvic lymph node metastases of prostate cancer patients. The plot displays individual study estimates (squares) with corresponding 95% confidence intervals (horizontal lines) and the pooled specificity estimate (diamond) for both modalities. The size of the squares represents the relative weight of each study in the meta-analysis.
Table 4
| Covariate | Studies | Specificity for 68Ga-PSMA-11 PET (95% CI) | p-value | Specificity for mpMRI (95%CI) | p-value |
|---|---|---|---|---|---|
| Region | 0.38 | 0.51 | |||
| Oceania | 2 | 0.92 [0.88; 0.95] | 0.95 [0.92; 0.98] | ||
| Asia | 7 | 0.91 [0.76; 1.00] | 0.89 [0.70; 1.00] | ||
| Europe | 4 | 0.97 [0.92; 1.00] | 0.88 [0.60; 1.00] | ||
| Number of patients included | 0.64 | 0.02 | |||
| >50 | 6 | 0.95 [0.89; 0.99] | 0.96 [0.87; 1.00] | ||
| ≤50 | 7 | 0.93 [0.78; 1.00] | 0.82 [0.62; 0.96] | ||
| Reference standard | 0.62 | 0.53 | |||
| PLND | 8 | 0.93 [0.82; 0.99] | 0.89 [0.75; 0.98] | ||
| ePLND | 4 | 0.96 [0.84; 1.00] | 0.99 [0.94; 1.00] | ||
| rPLND | 1 | 1.00 [0.63; 1.00] | 0.38 [0.09; 0.76] | ||
| Image analysis | 0.09 | 0.15 | |||
| Visual and semiquantitative | 12 | 0.93 [0.86; 0.98] | 0.89 [0.77; 0.97] | ||
| Visual | 1 | 0.99 [0.99; 1.00] | 1.00 [0.99; 1.00] | ||
| Study design | 0.69 | 0.49 | |||
| Prospective | 1 | 0.89 [0.75; 0.97] | 0.97 [0.86; 1.00] | ||
| Retrospective | 12 | 0.95 [0.87; 0.99] | 0.89 [0.77; 0.98] |
Meta-regression analysis for specificity of 68Ga-PSMA-11 PET and mpMRI.
3.5 Publication bias of 68Ga-PSMA-11 PET and mpMRI for diagnosis of initial lymph node staging of prostate cancer
Funnel plot asymmetry test showed that there was a significant publication bias for specificity of 68Ga-PSMA-11 PET and mpMRI (Egger’s test: p = 0.01 and p = 0.00), and no significant publication bias was observed for sensitivity of 68Ga-PSMA-11 PET and mpMRI (Egger’s test: p = 0.89 and p = 0.41) (Supplementary Figures S1–S4).
4 Discussion
In the realm of diagnosing initial lymph node staging in prostate cancer, there exists considerable uncertainty and debate regarding the comparative diagnostic effectiveness of 68Ga-PSMA-11 PET and mpMRI. In 2022, Arslan et al. (20) stated that the sensitivity of both PSMA-PET/CT and mpMRI in the detection of metastatic lymph nodes was low. Berger et al. (19) highlighted the superior lesion detection capabilities of PSMA-PET/CT, particularly in terms of sensitivity, as compared to mpMRI. Conversely, Zhang et al. (8) found no significant difference in the detection of lymph node metastases (LNMs), particularly with respect to the diameter of the LNMs, between these two modalities. This discrepancy in findings underscores the ongoing debate and the need for comprehensive meta-analyses to clarify these differences. To mitigate the impact of bias and enhance the internal validity and reliability, this study using histopathology as the reference, presents a head-to-head comparison of 68Ga-PSMA-11 PET and mpMRI.
In our meta-analysis, the pooled sensitivity of 68Ga-PSMA-11 PET in the initial lymph node staging of prostate cancer was found to be 0.73 (95% CI: 0.51–0.91), while mpMRI demonstrated a sensitivity of 0.49 (95% CI: 0.30–0.68). It can be observed that 68Ga-PSMA-11 PET demonstrates higher sensitivity in detecting early lymph node metastasis in prostate cancer. However, no significant difference was observed. Wang et al. (22) evaluated the diagnostic performance of 68Ga-PSMA-11 PET in comparison to mpMRI for prostate cancer lymph node staging. Their article suggests that 68Ga-PSMA-11 PET/CT exhibits a higher sensitivity (71% vs. 40%). However, statistical tests for differences in sensitivity and specificity between the two diagnostic tools were not performed in their article. Our study conducted statistical tests for differences to determine if there are significant difference in performance between these two methods, rather than merely observing a trend.
Furthermore, the specificity was 0.94 (95% CI: 0.88–0.99) for 68Ga-PSMA-11 PET and 0.90 (95% CI: 0.79–0.98) for mpMRI in our study. Wang’s study suggested noting comparable specificity (92% vs. 92%) between the two methods. However, this contrasts with the findings of Chow et al. (23). The direct comparison in the study revealed a significant specificity advantage of 15.0 percentage points for PSMA-PET (95% CI 6.7–23.2; p < 0.001). This may be related to this study’s use of various tracers in PSMA-PET imaging, such as 68Ga-PSMA-11, 18F-DCFPyL, 18F-PSMA-1007, leading to higher heterogeneity in the articles. In cases of high heterogeneity, their study did not employ techniques such as meta-regression or sensitivity analysis to explore the source of heterogeneity. Therefore, in our study, we conducted meta-regression and sensitivity analysis specifically for one imaging tracer, 68Ga-PSMA-11, and incorporated the latest studies.
In addition, our study find substantial heterogeneity was identified in the sensitivity and specificity of 68Ga-PSMA-11 PET and mpMRI, as evidenced by high I2 values (84 and 79% for sensitivity, 87 and 91% for specificity, respectively). Hence, in response to this high level of heterogeneity, we utilized meta-regression and sensitivity analysis to explore potential sources of this heterogeneity. Through meta-regression analysis, only patient numbers emerged as a statistically significant factor for the specificity of mpMRI (p < 0.05). This finding suggests the influence of sample size on heterogeneity, yet the limited identification of sources indicates the complexity of factors affecting diagnostic tool performance. The complexity of this outcome may stem from multiple factors. Firstly, the diversity in study samples, encompassing variations in geography, ethnicity, and age among populations, might not have been fully addressed in the analysis. Secondly, the differences in the application of diagnostic tool models and the subjective assessment criteria across various studies may obscure the true sources of heterogeneity. Additionally, although factors such as region, number of patients included, reference standard, image analysis, and study design were incorporated in the meta-analysis, pinpointing specific sources of heterogeneity remains a formidable challenge.
The current meta-analysis indicates that 68Ga-PSMA-11 PET exhibits similar sensitivity to mpMRI in detecting initial lymph node staging in prostate cancer patients. However, it’s crucial to consider the availability of 68Ga-PSMA-11 PET, which may not be uniformly accessible across medical centers and can be influenced by location and resources. Moreover, one of the main limitations of 68Ga-PSMA-11 PET is the potential exposure to ionizing radiation, particularly concerning for younger patients or those requiring repeated imaging exams. On the other hand, mpMRI combines multiple imaging modalities, providing detailed anatomical and functional information about tumors. Its lower economic cost compared to 68Ga-PSMA-11 PET contributes to its widespread use in clinical practice. The choice between the two modalities will depend on factors such as the clinical scenario, accessibility of the imaging technique, and physician preferences.
Our study has several limitations that need to be acknowledged. Firstly, despite employing rigorous statistical methods, we were unable to identify specific sources of heterogeneity for sensitivity and specificity. This suggests that there may be underlying complexities, highlighting the need for further research to pinpoint these sources of heterogeneity. Secondly, due to the limited number of included studies, we were unable to divide our analysis into patient-based and lesion-based analyses. Future head-to-head comparison studies focusing on these distinct analysis methods may provide more precise and accurate conclusions. Thirdly, it’s important to note that the majority of studies included in our meta-analysis were retrospective (only one out of 13 was prospective), which could potentially introduce bias into our findings.
5 Conclusion
Our findings indicated that 68Ga-PSMA-11 PET and mpMRI exhibit similar sensitivity and specificity in the diagnosis of initial lymph node staging of prostate cancer. However, given that most included studies were retrospective, further prospective studies with larger sample sizes are essential to validate these results.
Statements
Data availability statement
The original contributions presented in the study are included in the article/Supplementary material, further inquiries can be directed to the corresponding author.
Author contributions
YW: Data curation, Formal analysis, Methodology, Software, Writing – original draft. RJ: Data curation, Software, Writing – original draft. HW: Formal analysis, Methodology, Writing – original draft. QZ: Conceptualization, Supervision, Validation, Visualization, Writing – review & editing.
Funding
The author(s) declare that no financial support was received for the research, authorship, and/or publication of this article.
Conflict of interest
The authors declare that the research was conducted in the absence of any commercial or financial relationships that could be construed as a potential conflict of interest.
Publisher’s note
All claims expressed in this article are solely those of the authors and do not necessarily represent those of their affiliated organizations, or those of the publisher, the editors and the reviewers. Any product that may be evaluated in this article, or claim that may be made by its manufacturer, is not guaranteed or endorsed by the publisher.
Supplementary material
The Supplementary material for this article can be found online at: https://www.frontiersin.org/articles/10.3389/fmed.2024.1425134/full#supplementary-material
References
1.
Cancer Research for Cancer Prevention World Health Organization . (Accessed June 20, 2020). Available at: https://publications.iarc.fr/Non-Series-Publications/World-Cancer-Reports/World-Cancer-Report-Cancer-Research-For-Cancer-Prevention-2020
2.
Wilczak W Wittmer C Clauditz T Minner S Steurer S Büscheck F et al . Marked prognostic impact of minimal lymphatic tumor spread in prostate cancer. Eur Urol. (2018) 74:376–86. doi: 10.1016/j.eururo.2018.05.034
3.
Mottet N van den Bergh RCN Briers E Van den Broeck T Cumberbatch MG De Santis M et al . EAU-EANM-ESTRO-ESUR-SIOG guidelines on prostate cancer-2020 update. Part 1: screening, diagnosis, and local treatment with curative intent. Eur Urol. (2021) 79:243–62. doi: 10.1016/j.eururo.2020.09.042
4.
Briganti A Chun FK Salonia A Suardi N Gallina A Da Pozzo LF et al . Complications and other surgical outcomes associated with extended pelvic lymphadenectomy in men with localized prostate cancer. Eur Urol. (2006) 50:1006–13. doi: 10.1016/j.eururo.2006.08.015
5.
von Below C Daouacher G Wassberg C Grzegorek R Gestblom C Sörensen J et al . Validation of 3 T MRI including diffusion-weighted imaging for nodal staging of newly diagnosed intermediate- and high-risk prostate cancer. Clin Radiol. (2016) 71:328–34. doi: 10.1016/j.crad.2015.12.001
6.
Hövels AM Heesakkers RA Adang EM Jager GJ Strum S Hoogeveen YL et al . The diagnostic accuracy of CT and MRI in the staging of pelvic lymph nodes in patients with prostate cancer: a meta-analysis. Clin Radiol. (2008) 63:387–95. doi: 10.1016/j.crad.2007.05.022
7.
de Kouchkovsky I Aggarwal R Hope TA . Prostate-specific membrane antigen (PSMA)-based imaging in localized and advanced prostate cancer: a narrative review. Transl Androl Urol. (2021) 10:3130–43. doi: 10.21037/tau-20-1047
8.
Zhang Q Zang S Zhang C Fu Y Lv X Zhang Q et al . Comparison of 68Ga-PSMA-11 PET-CT with mpMRI for preoperative lymph node staging in patients with intermediate to high-risk prostate cancer. J Transl Med. (2017) 15:230. doi: 10.1186/s12967-017-1333-2
9.
Yilmaz B Turkay R Colakoglu Y Baytekin HF Ergul N Sahin S et al . Comparison of preoperative locoregional Ga-68 PSMA-11 PET-CT and mp-MRI results with postoperative histopathology of prostate cancer. Prostate. (2019) 79:1007–17. doi: 10.1002/pros.23812
10.
Van Damme J Tombal B Collette L Van Nieuwenhove S Pasoglou V Gérard T et al . Comparison of 68Ga-prostate specific membrane antigen (PSMA) positron emission tomography computed tomography (PET-CT) and whole-body magnetic resonance imaging (WB-MRI) with diffusion sequences (DWI) in the staging of advanced prostate cancer. Cancers. (2021) 13:5286. doi: 10.3390/cancers13215286
11.
Szigeti F Schweighofer-Zwink G Meissnitzer M Hauser-Kronberger C Hitzl W Kunit T et al . Incremental impact of [68Ga]Ga-PSMA-11 PET/CT in primary N and M staging of prostate cancer prior to curative-intent surgery: a prospective clinical trial in comparison with mpMRI. Mol Imaging Biol. (2022) 24:50–9. doi: 10.1007/s11307-021-01650-9
12.
Skawran SM Sanchez V Ghafoor S Hötker AM Burger IA Huellner MW et al . Primary staging in patients with intermediate- and high-risk prostate cancer: multiparametric MRI and 68Ga-PSMA-PET/MRI—what is the value of quantitative data from multiparametric MRI alone or in conjunction with clinical information?Eur J Radiol. (2022) 146:110044. doi: 10.1016/j.ejrad.2021.110044
13.
Kulkarni SC Sundaram PS Padma S . In primary lymph nodal staging of patients with high-risk and intermediate-risk prostate cancer, how critical is the role of Gallium-68 prostate-specific membrane antigen positron emission tomography-computed tomography?Nucl Med Commun. (2020) 41:139–46. doi: 10.1097/mnm.0000000000001110
14.
Hötker AM Mühlematter U Beintner-Skawran S Ghafoor S Burger I Huellner M et al . Prediction of pelvic lymph node metastases and PSMA PET positive pelvic lymph nodes with multiparametric MRI and clinical information in primary staging of prostate cancer. Eur J Radiol Open. (2023) 10:100487. doi: 10.1016/j.ejro.2023.100487
15.
Gupta M Choudhury PS Hazarika D Rawal S . A comparative study of 68Gallium-prostate specific membrane antigen positron emission tomography-computed tomography and magnetic resonance imaging for lymph node staging in high risk prostate cancer patients: an initial experience. World J Nucl Med. (2017) 16:186–91. doi: 10.4103/1450-1147.207272
16.
Frumer M Milk N Rinott Mizrahi G Bistritzky S Sternberg I Leibovitch I et al . A comparison between 68Ga-labeled prostate-specific membrane antigen-PET/CT and multiparametric MRI for excluding regional metastases prior to radical prostatectomy. Abdom Radiol. (2020) 45:4194–201. doi: 10.1007/s00261-020-02640-1
17.
Franklin A Yaxley WJ Raveenthiran S Coughlin G Gianduzzo T Kua B et al . Histological comparison between predictive value of preoperative 3-T multiparametric MRI and 68Ga-PSMA PET/CT scan for pathological outcomes at radical prostatectomy and pelvic lymph node dissection for prostate cancer. BJU Int. (2021) 127:71–9. doi: 10.1111/bju.15134
18.
Çelen S Gültekin A Özlülerden Y Mete A Sağtaş E Ufuk F et al . Comparison of 68Ga-PSMA-I/T PET-CT and multiparametric MRI for Locoregional staging of prostate cancer patients: a pilot study. Urol Int. (2020) 104:684–91. doi: 10.1159/000509974
19.
Berger I Annabattula C Lewis J Shetty DV Kam J Maclean F et al . 68Ga-PSMA PET/CT vs. mpMRI for locoregional prostate cancer staging: correlation with final histopathology. Prostate Cancer Prostatic Dis. (2018) 21:204–11. doi: 10.1038/s41391-018-0048-7
20.
Arslan A Karaarslan E Güner AL Sağlıcan Y Tuna MB Kural AR . Comparing the diagnostic performance of multiparametric prostate MRI versus 68Ga-PSMA PET-CT in the evaluation lymph node involvement and extraprostatic extension. Acad Radiol. (2022) 29:698–704. doi: 10.1016/j.acra.2020.07.011
21.
McInnes MDF Moher D Thombs BD McGrath TA Bossuyt PM Clifford T et al . Preferred reporting items for a systematic review and meta-analysis of diagnostic test accuracy studies: the PRISMA-DTA statement. JAMA. (2018) 319:388–96. doi: 10.1001/jama.2017.19163
22.
Wang X Wen Q Zhang H Ji B . Head-to-head comparison of 68Ga-PSMA-11 PET/CT and multiparametric MRI for pelvic lymph node staging prior to radical prostatectomy in patients with intermediate to high-risk prostate cancer: a meta-analysis. Front Oncol. (2021) 11:737989. doi: 10.3389/fonc.2021.737989
23.
Chow KM So WZ Lee HJ Lee A Yap DWT Takwoingi Y et al . Head-to-head comparison of the diagnostic accuracy of prostate-specific membrane antigen positron emission tomography and conventional imaging modalities for initial staging of intermediate- to high-risk prostate cancer: a systematic review and meta-analysis. Eur Urol. (2023) 84:36–48. doi: 10.1016/j.eururo.2023.03.001
Summary
Keywords
68Ga-PSMA-PET, mpMRI, lymph node metastases, prostate cancer, meta-analysis
Citation
Wang Y, Jing R, Wang H and Zhao Q (2024) 68Ga-PSMA-11 PET and mpMRI in the diagnosis of initial lymph node staging of prostate cancer: a head-to-head comparative meta-analysis. Front. Med. 11:1425134. doi: 10.3389/fmed.2024.1425134
Received
29 April 2024
Accepted
12 June 2024
Published
20 June 2024
Volume
11 - 2024
Edited by
Francesco Dondi, Universitàdegli Studi di Brescia, Italy
Reviewed by
Edel Noriega-Álvarez, University Hospital of Guadalajara, Spain
Alfred Otoe Ankrah, Korle Bu Teaching Hospital, Ghana
Updates
Copyright
© 2024 Wang, Jing, Wang and Zhao.
This is an open-access article distributed under the terms of the Creative Commons Attribution License (CC BY). The use, distribution or reproduction in other forums is permitted, provided the original author(s) and the copyright owner(s) are credited and that the original publication in this journal is cited, in accordance with accepted academic practice. No use, distribution or reproduction is permitted which does not comply with these terms.
*Correspondence: Yuanrong Wang, 343392994@qq.com
Disclaimer
All claims expressed in this article are solely those of the authors and do not necessarily represent those of their affiliated organizations, or those of the publisher, the editors and the reviewers. Any product that may be evaluated in this article or claim that may be made by its manufacturer is not guaranteed or endorsed by the publisher.