Abstract
Background:
Heart failure (HF) is a life-threatening condition with a high mortality rate. The precise relationship between the heart rate and temperature (HR/T) ratio and mortality in patients with HF remains unclear. This study aimed to investigate the relationship between the HR/T ratio and 28-day intensive care unit (ICU) mortality rates in patients with HF.
Methods:
This retrospective cohort study analyzed the data of 3,790 patients with congestive heart failure in a large electronic database. Patients were divided into quartiles based on their HR/T ratio: Q1 (1.28–1.76), Q2 (2.44–2.72), Q3 (2.88–3.14), and Q4 (3.29–4.13). Multivariable logistic regression analysis was performed to examine the association between HR/T ratio and 28-day ICU mortality.
Results:
Patients with higher HR/T ratios had greater disease severity and higher mortality rates. In the fully adjusted regression model, a significant association was observed between HR/T ratio and 28-day ICU mortality risk, with mortality increasing as HR/T ratio rose (OR = 1.55, 95% CI: 1.17–2.04). An E-value analysis indicated that unmeasured confounders had a minimal impact on the results, confirming the robustness of the study.
Conclusion:
Among ICU-admitted patients with HF, we identified a significant association between HR/T ratio and 28-day ICU mortality. As the HR/T ratio increased, the 28-day ICU mortality showed an upward trend.
1 Introduction
Heart failure (HF) is a complex clinical syndrome defined by structural or functional abnormalities of the heart that result in elevated intracardiac pressure and insufficient cardiac output at rest or during physical activity (1). Globally, approximately 64.3 million individuals are affected by HF, and the prevalence of chronic HF is steadily increasing (2). In developed countries, the prevalence of HF in adults is approximately 1–2%, and is projected to increase to 3% by 2030 (3). Despite advancements in medical care, HF remains associated with high mortality rates, particularly in patients admitted to the intensive care unit (ICUs) (4). Therefore, an early evaluation of the clinical characteristics of patients with HF admitted to ICU is critical.
Excessive activation of the sympathetic nervous system is common in patients with HF and is one of the risk factors for mortality in these patients (5). As suggested earlier, the heart rate to temperature ratio (HR/T) can be used to assess sympathetic nervous system overactivation (6). The HR/T ratio, based on the heart rate and body temperature, is easy to measure in clinical practice and is an essential clinical indicator. Bistrovic et al. found that HR/T, an indicator of sympathetic overactivation, is associated with mortality in patients with coronavirus disease 2019 (COVID-19) (7). Additionally, the HR/T ratio correlates with ICU mortality in patients with sepsis (8). However, to the best of our knowledge, no previous studies have reported a relationship between the HR/T ratio and mortality in patients with HF admitted to ICU. Therefore, this study aimed to investigate the relationship between HR/T and 28-day ICU mortality in patients with HF admitted to ICU, using a publicly available large-scale eICU database.
2 Methods
2.1 Data source
This retrospective observational cohort study was based on the eICU Collaborative Research Database (eICU-CRD), an online international database in the United States (9). The eICU-CRD is a public database created through collaborative efforts between the MIT Laboratory for Computational Physiology and the eICU Institute (9). It contains high-resolution data of over 200,000 ICU admissions monitored across the United States as part of the eICU program from 2014 to 2015 (9). In accordance with the data use agreement of the PhysioNet review committee, the requisite examinations were completed and certification was obtained to enable access to the database (record ID: 40859994). In accordance with the Safe Harbor provision of the U.S. Health Insurance Portability and Accountability Act (HIPAA), the database utilized in this study was de-identified, and all protected health information was removed to ensure the safeguarding of institutional and patient privacy. This retrospective study did not involve direct patient intervention and was exempted from the safety protocol of the PhysioNet review committee. In light of the aforementioned reasons, the requirement for informed consent was not applicable. All methods used in this study were conducted in accordance with the tenets of the Declaration of Helsinki (10).
2.2 Study population
The study population included all patients diagnosed with congestive heart failure (CHF) upon ICU admission. Specifically, patients were identified using the International Classification of Diseases, 9th Revision (ICD-9) code 428.0, as recorded in the database admission table (11). Study subjects were selected using the following exclusion criteria: (1) patients not on their first ICU admission, (2) patients with an ICU stay of less than 24 h, (3) patients under the age of 18 years, (4) patients lacking data monitoring during ICU treatment, and (5) patients with data having systematic errors or missing HR/T ratio after ICU admission. A flowchart of the inclusion and exclusion criteria is shown in Figure 1.
Figure 1

Flow chart of study population. ICU, intensive care unit.
2.3 Main study variables
A Structured Query Language (SQL) was employed to extract data from the eICU-CRD. The extracted data included vital signs, such as heart rate, body temperature, respiratory rate (RR), and mean arterial pressure (MAP), which were recorded as the worst initial measurements within the first 24 h of ICU admission. The definition of the “worst” vital signs refers to the values that are furthest from the midpoint defined by Acute Physiology and Chronic Health Evaluation (APACHE; temperature = 38°C, heart rate = 75 beats per minute, RR = 19 breaths per minute, MAP = 90 mmHg) (9). The baseline characteristics of the patients, including sex, age, race, and body mass index (BMI), were collected from the patient and the patient result tables. Laboratory data, including alanine aminotransferase (ALT), aspartate aminotransferase (AST), Blood urea nitrogen levels (BUN), red blood cell count, hematocrit (Hct), and hemoglobin levels, were collected from the corresponding laboratory tables. The presence of comorbidities, including chronic obstructive pulmonary disease (COPD), acute myocardial infarction (AMI), liver failure, leukemia, and immunosuppression, was determined based on the APACHE IV scores. Treatment given at baseline included intubation, mechanical ventilation, dialysis, and β-blockers. The initial recorded value within the first 24 h of ICU admission was set as the baseline for analysis, using the measurement time as a reference point. The severity of the patients’ conditions upon admission was evaluated using several standardized scoring systems, including the Acute Physiology Score III, APACHE IV score, Glasgow Coma Scale (GCS) score, and Sequential Organ Failure Assessment (SOFA) score. The HR/T ratio was calculated by dividing the heart rate (beats per minute) by body temperature (°C). Patients were divided into quartiles based on their HR/T ratio: Q1 (1.28–1.76), Q2 (2.44–2.72), Q3 (2.88–3.14), and Q4 (3.29–4.13).
2.4 Outcomes
The primary outcome measure was 28-day mortality after ICU admission.
2.5 Statistical analyses
Statistical analyses were conducted using the software packages R (version 4.2.0, R Foundation for Statistical Computing, Vienna, Austria) and EmpowerStats (X&Y Solutions Inc., Boston, MA, United States).1 Descriptive statistics were used to summarize baseline patient characteristics. Continuous variables are presented as mean ± standard deviation (SD) or median with interquartile range (IQR). One-way analysis of variance (ANOVA) was used to ascertain discrepancies among the quartiles of the HR/T ratio in continuous variables. The Kruskal–Wallis test was used to evaluate differences in non-normally distributed continuous variables across groups. Categorical variables are expressed as absolute values and percentages, and differences were compared using the Chi-Square test or Fisher’s exact test, as appropriate.
To address potential confounding factors, three distinct adjustment models were constructed to assess the relationship between HR/T and 28-day mortality. The adjustment for covariates was based on the clinical significance of confounders (12) and a change of at least 10% in the matched odds ratio (OR) (13). The results are presented as OR with 95% confidence intervals (95% CI). The HR/T ratio was analyzed as a categorical variable based on quartiles (Q1-Q4), with the lowest quartile serving as the reference category. The p values for the trends across the HR/T ratio quartiles were calculated for all three models. Additionally, generalized additive models (GAM) were employed to illustrate the correlation between the HR/T ratio and mortality, with the findings presented through smoothed curve-fitting plots. We calculated the E-value to determine the potential influence of unmeasured confounders on the association between HR/T and 28-day ICU mortality (14). The E-value quantifies the extent to which unmeasured confounders potentially nullify the observed association between HR/T and 28-day ICU mortality. For all analyses, statistical significance was set at p < 0.05.
3 Results
3.1 Baseline characteristics of patients with HF in ICU
A total of 3,790 patients were categorized by HR/T ratio quartiles and comparison of demographic characteristics, vital signs, laboratory test results, disease severity, and comorbidities across different quartiles is presented in Table 1. Compared with patients in the lowest HR/T ratio quartile, those in Q4 were generally younger and exhibited a lower BMI, while sex and racial distributions were relatively balanced. Significant intergroup differences were observed in laboratory parameters, including AST, ALT, hemoglobin, and Hct, across the different HR/T ratio groups (p < 0.05).
Table 1
| HR/T quartile | |||||
|---|---|---|---|---|---|
| Q1 | Q2 | Q3 | Q4 | ||
| (1.28–1.76) | (2.44–2.72) | (2.88–3.14) | (3.29–4.13) | ||
| Parameters | N = 948 | N = 947 | N = 947 | N = 948 | p-value |
| Demographics | |||||
| Age (years) | 72.73 ± 12.07 | 69.41 ± 13.57 | 69.64 ± 13.61 | 69.17 ± 15.05 | <0.001 |
| Gender (N, %) | 0.807 | ||||
| Male | 465 (49.05) | 470 (49.74) | 458 (48.36) | 479 (50.53) | |
| Female | 483 (50.95) | 475 (50.26) | 489 (51.64) | 469 (49.47) | |
| Ethnicity (N, %) | 0.094 | ||||
| Caucasian | 678 (72.20) | 662 (70.58) | 668 (71.29) | 717 (76.11) | |
| African American | 143 (15.23) | 156 (16.63) | 154 (16.44) | 141 (14.97) | |
| Hispanic | 63 (6.71) | 48 (5.12) | 45 (4.80) | 30 (3.18) | |
| Asian | 41 (4.37) | 57 (6.08) | 53 (5.66) | 38 (4.03) | |
| Native American | 6 (0.64) | 4 (0.43) | 5 (0.53) | 4 (0.42) | |
| Other/Unknown | 8 (0.85) | 11 (1.17) | 12 (1.28) | 12 (1.27) | |
| BMI (kg/m2) | 32.41 ± 10.57 | 32.52 ± 11.25 | 31.41 ± 9.93 | 30.71 ± 9.90 | <0.001 |
| Vital signs | |||||
| Heart rate (/min) | 55.29 ± 8.71 | 93.92 ± 5.40 | 109.62 ± 5.14 | 135.12 ± 15.19 | <0.001 |
| Temperature | 36.34 ± 0.55 | 36.47 ± 0.57 | 36.43 ± 0.61 | 36.38 ± 0.74 | <0.001 |
| HR/T (bpm/°C) | 1.52 ± 0.24 | 2.58 ± 0.14 | 3.01 ± 0.13 | 3.71 ± 0.42 | <0.001 |
| Respiratory rate (bpm) | 26.78 ± 14.61 | 28.94 ± 14.09 | 31.45 ± 14.13 | 33.65 ± 13.26 | <0.001 |
| MAP (mmHg) | 63.00 (53.00–122.00) | 64.00 (53.00–124.00) | 66.00 (54.00–125.00) | 65.00 (51.00–132.00) | 0.003* |
| Laboratory data | |||||
| AST (U/L) | 23.00 (16.00–37.00) | 26.00 (19.00–46.50) | 26.00 (18.00–46.75) | 31.00 (21.00–54.00) | <0.001* |
| ALT (U/L) | 20.00 (13.75–35.25) | 25.00 (17.00–42.00) | 24.00 (15.00–42.00) | 24.00 (15.00–46.00) | <0.001* |
| Blood urea nitrogen (mg/dL) | 33.00 (22.00–53.00) | 31.00 (21.00–48.00) | 29.00 (20.00–46.00) | 30.00 (20.00–45.00) | <0.001* |
| Albumin (g/dL) | 3.03 ± 0.53 | 3.01 ± 0.54 | 3.03 ± 0.57 | 3.03 ± 0.59 | 0.961 |
| troponin – I (ng/mL) | 0.12 (0.05–0.47) | 0.18 (0.05–0.98) | 0.15 (0.06–0.59) | 0.17 (0.06–1.03) | 0.009* |
| LDH (Units/L) | 254.00 (228.50–318.50) | 236.50 (194.00–308.50) | 244.00 (188.00–314.00) | 257.00 (217.00–302.00) | 0.610* |
| Platelets (cells × 109/L) | 193.00 (150.00–245.00) | 196.00 (151.00–249.00) | 198.00 (151.00–254.00) | 198.00 (152.00–255.00) | 0.122* |
| RBC (M/mcl) | 3.64 ± 0.73 | 3.71 ± 0.79 | 3.73 ± 0.79 | 3.82 ± 0.77 | <0.001 |
| Hemoglobin (g/dL) | 10.52 ± 2.04 | 10.72 ± 2.19 | 10.86 ± 2.27 | 11.05 ± 2.22 | <0.001 |
| Hct (%) | 32.69 ± 6.30 | 33.34 ± 6.75 | 33.61 ± 6.87 | 34.16 ± 6.63 | <0.001 |
| BNP (pg/mL) | 970.00 (503.00–2411.95) | 1165.70 (583.00–2926.60) | 1017.00 (464.75–2765.60) | 1215.00 (629.00–3104.00) | 0.316* |
| myoglobin(ng/mL) | 101.00 (82.97–118.00) | 254.50 (84.03–397.70) | 84.50 (75.50–94.20) | 130.30 (123.75–400.40) | 0.125* |
| Hospital admit source (N, %) | 0.383 | ||||
| Emergency Department | 467 (64.33) | 421 (62.00) | 391 (58.27) | 389 (57.29) | |
| Operating Room | 109 (15.01) | 128 (18.85) | 130 (19.37) | 146 (21.50) | |
| Floor | 59 (8.13) | 54 (7.95) | 72 (10.73) | 64 (9.43) | |
| Direct Admit | 4 (0.55) | 7 (1.03) | 4 (0.60) | 3 (0.44) | |
| Other Hospital | 2 (0.28) | 1 (0.15) | 0 (0.00) | 4 (0.59) | |
| Other ICU | 18 (2.48) | 12 (1.77) | 18 (2.68) | 19 (2.80) | |
| ICU to SDU | 33 (4.55) | 29 (4.27) | 33 (4.92) | 26 (3.83) | |
| Chest Pain Center | 30 (4.13) | 24 (3.53) | 22 (3.28) | 22 (3.24) | |
| Unit admit source (N, %) | 0.337 | ||||
| Emergency Department | 619 (65.36) | 590 (62.37) | 561 (59.24) | 555 (58.61) | |
| Operating Room | 159 (16.79) | 194 (20.51) | 192 (20.27) | 213 (22.49) | |
| ICU to SDU | 66 (6.97) | 72 (7.61) | 93 (9.82) | 78 (8.24) | |
| Floor | 1 (0.11) | 2 (0.21) | 1 (0.11) | 1 (0.11) | |
| Other Hospital | 2 (0.21) | 1 (0.11) | 0 (0.00) | 2 (0.21) | |
| Step-Down Unit (SDU) | 41 (4.33) | 32 (3.38) | 37 (3.91) | 31 (3.27) | |
| Chest Pain Center | 25 (2.64) | 21 (2.22) | 32 (3.38) | 32 (3.38) | |
| Recovery Room | 30 (3.17) | 31 (3.28) | 30 (3.17) | 28 (2.96) | |
| Treatment | |||||
| Intubated (N, %) | 0.215 | ||||
| No | 833 (87.87%) | 843 (89.02%) | 831 (87.75%) | 814 (85.86%) | |
| Yes | 115 (12.13%) | 104 (10.98%) | 116 (12.25%) | 134 (14.14%) | |
| Mechanical ventilation use (N, %) | 0.283 | ||||
| No | 567 (59.81%) | 569 (60.08%) | 577 (60.93%) | 604 (63.71%) | |
| Yes | 381 (40.19%) | 378 (39.92%) | 370 (39.07%) | 344 (36.29%) | |
| Dialysis (N, %) | 0.746 | ||||
| No | 883 (93.14%) | 870 (91.87%) | 878 (92.71%) | 875 (92.30%) | |
| Yes | 65 (6.86%) | 77 (8.13%) | 69 (7.29%) | 73 (7.70%) | |
| β-blocker use (N, %) | <0.001 | ||||
| No | 643(67.83) | 688(72.65) | 669(70.64) | 611 (64.45) | |
| Yes | 305(32.17) | 259(27.35) | 278(29.36) | 337(35.55) | |
| Severity of illness | |||||
| Acute Physiology Score III (N, %) | <0.001 | ||||
| Low (0.0–34.0) | 326 (37.60) | 369 (42.12) | 313 (36.02) | 142 (16.53) | |
| Middle (35.0–47.0) | 270 (31.14) | 283 (32.31) | 294 (33.83) | 260 (30.27) | |
| High (48.0–163.0) | 271 (31.26) | 224 (25.57) | 262 (30.15) | 457 (53.20) | |
| Apache IV score (N, %) | <0.001 | ||||
| Low (12.0–48.0) | 295 (34.03) | 363 (41.44) | 304 (34.98) | 164 (19.09) | |
| Middle (49.0–64.0) | 302 (34.83) | 305 (34.82) | 306 (35.21) | 269 (31.32) | |
| High (65.0–176.0) | 270 (31.14) | 208 (23.74) | 259 (29.80) | 426 (49.59) | |
| GCS score (N, %) | 0.023 | ||||
| Low (3.0–13.0) | 226 (24.02) | 192 (20.51) | 187 (20.00) | 223 (23.88) | |
| Middle (14.0–14.0) | 133 (14.13) | 131 (14.00) | 103 (11.02) | 114 (12.21) | |
| High (15.0–15.0) | 582 (61.85) | 613 (65.49) | 645 (68.98) | 597 (63.92) | |
| SOFA score (N, %) | <0.001 | ||||
| Low (0.0–1.0) | 260 (27.43) | 299 (31.57) | 360 (38.01) | 330 (34.81) | |
| Middle (2.0–3.0) | 332 (35.02) | 329 (34.74) | 281 (29.67) | 266 (28.06) | |
| High (4.0–16.0) | 356 (37.55) | 319 (33.69) | 306 (32.31) | 352 (37.13) | |
| Comorbidities (N, %) | |||||
| Hepatic failure | 0.113 | ||||
| No | 940 (99.16) | 942 (99.47) | 933 (98.52) | 942 (99.37) | |
| Yes | 8 (0.84) | 5 (0.53) | 14 (1.48) | 6 (0.63) | |
| Metastatic cancer | 0.007 | ||||
| No | 945 (99.68) | 936 (98.84) | 937 (98.94) | 929 (98.00) | |
| Yes | 3 (0.32) | 11 (1.16) | 10 (1.06) | 19 (2.00) | |
| Leukemia | 0.045 | ||||
| No | 941 (99.26) | 946 (99.89) | 938 (99.05) | 937 (98.84) | |
| Yes | 7 (0.74) | 1 (0.11) | 9 (0.95) | 11 (1.16) | |
| Immunosuppression | <0.001 | ||||
| No | 941 (99.26) | 930 (98.20) | 930 (98.20) | 913 (96.31) | |
| Yes | 7 (0.74) | 17 (1.80) | 17 (1.80) | 35 (3.69) | |
| Cirrhosis | 0.379 | ||||
| No | 935 (98.63) | 936 (98.84) | 939 (99.16) | 942 (99.37) | |
| Yes | 13 (1.37) | 11 (1.16) | 8 (0.84) | 6 (0.63) | |
| Diabetes | <0.001 | ||||
| No | 575 (60.65) | 587 (61.99) | 633 (66.84) | 679 (71.62) | |
| Yes | 373 (39.35) | 360 (38.01) | 314 (33.16) | 269 (28.38) | |
| COPD | 0.347 | ||||
| No | 816 (86.08) | 808 (85.32) | 788 (83.21) | 807 (85.13) | |
| Yes | 132 (13.92) | 139 (14.68) | 159 (16.79) | 141 (14.87) | |
| CHF | 0.545 | ||||
| No | 153 (16.14) | 154 (16.26) | 146 (15.42) | 169 (17.83) | |
| Yes | 795 (83.86) | 793 (83.74) | 801 (84.58) | 779 (82.17) | |
| AMI | 0.023 | ||||
| No | 915 (96.52) | 888 (93.77) | 897 (94.72) | 889 (93.78) | |
| Yes | 33 (3.48) | 59 (6.23) | 50 (5.28) | 59 (6.22) | |
| Pneumonia | 0.165 | ||||
| No | 857 (90.40) | 852 (89.97) | 842 (88.91) | 829 (87.45) | |
| Yes | 91 (9.60) | 95 (10.03) | 105 (11.09) | 119 (12.55) | |
| Rhythm | <0.001 | ||||
| No | 945 (99.68) | 943 (99.58) | 943 (99.58) | 943 (99.47) | |
| Yes | 3 (0.32) | 4 (0.42) | 4 (0.42) | 5 (0.53) | |
| ICU 28 day mortality (N, %) | <0.001 | ||||
| No | 913 (96.31) | 911 (96.20) | 899 (94.93) | 877 (92.51) | |
| Yes | 35 (3.69) | 36 (3.80) | 48 (5.07) | 71 (7.49) | |
Baseline characteristics and 28-day mortality according to the quartiles of the HR/T ratio (n = 3,790).
Data were expressed as the mean ± SD or median (interquartile range) for continuous variables and number (%) for categorical variables. P*: Kruskal Wallis test was used to compare non-normally distributed continuous variables between groups. BMI, body mass index; HR/T, heart rate/temperature; MAP, mean arterial pressure; AST, aspartate transaminase; ALT, alanine transaminase; LDH, lactate dehydrogenase; RBC, red blood cell; Hct, hematocrit; BNP, B-type natriuretic peptide; ICU, intensive care unit; SDU, Step-Down Unit; GCS, Glasgow Coma Scale; SOFA, Sequential Organ Failure Assessment; COPD, chronic obstructive pulmonary disease; CHF, congestive heart failure; AMI, acute myocardial infarction.
Overall, the 28-day ICU mortality rate was 5.01% (190/3790). Notably, the 28-day mortality rate increased significantly with a higher HR/T ratio, from 3.69% in Q1 to 7.49% in Q4 (p < 0.001).
3.2 Association between the HR/T ratio and 28-day ICU mortality
A univariate logistic model was used to demonstrate the unadjusted associations between the baseline variables and 28-day mortality in patients in ICU (Table 2). There was a statistically significant positive correlation between HR/T ratio and mortality risk in patients with HF (p < 0.001). With regard to the source of admission, patients in the operating room exhibited a higher mortality risk than those in the emergency department (p = 0.002). Regarding the assessment of disease severity, the Acute Physiology Score III, APACHE IV, and SOFA scores demonstrated an elevated risk of mortality.
Table 2
| Exposure | Statistics | OR (95%CI) | p-value |
|---|---|---|---|
| Demographics | |||
| Age (years) | 70.24 ± 13.69 | 1.02 (1.01, 1.03) | 0.001 |
| Gender (N, %) | |||
| Male | 1872 (49.42) | Ref. | |
| Female | 1916 (50.58) | 1.04 (0.78, 1.40) | 0.778 |
| Ethnicity (N, %) | |||
| Caucasian | 2,725 (72.55) | Ref. | |
| African American | 594 (15.81) | 0.74 (0.48, 1.14) | 0.170 |
| Hispanic | 186 (4.95) | 0.28 (0.09, 0.87) | 0.028 |
| Asian | 189 (5.03) | 0.55 (0.24, 1.26) | 0.159 |
| Native American | 19 (0.51) | 0.93 (0.12, 7.04) | 0.947 |
| Other/Unknown | 43 (1.14) | 0.40 (0.05, 2.93) | 0.367 |
| BMI (kg/m2) | 31.76 ± 10.45 | 1.01 (0.99, 1.02) | 0.443 |
| Vital signs | |||
| Heart rate (/min) | 98.48 ± 30.49 | 1.01 (1.01, 1.02) | <0.001 |
| Temperature (°C) | 36.41 ± 0.62 | 0.92 (0.73, 1.16) | 0.467 |
| HR/T (bpm/°C) | 2.71 ± 0.84 | 1.45 (1.21, 1.73) | <0.001 |
| Respiratory rate (bpm) | 30.20 ± 14.26 | 1.02 (1.01, 1.03) | 0.002 |
| MAP (mmHg) | 87.10 ± 42.09 | 0.99 (0.99, 1.00) | 0.001 |
| Laboratory data | |||
| AST (U/L) | 119.44 ± 659.76 | 1.00 (1.00, 1.00) | 0.228 |
| ALT (U/L) | 93.64 ± 462.21 | 1.00 (1.00, 1.00) | 0.213 |
| Blood urea nitrogen (mg/dL) | 36.95 ± 22.47 | 1.01 (1.01, 1.02) | <0.001 |
| Albumin(g/dL) | 3.03 ± 0.55 | 0.66 (0.47, 0.94) | 0.012 |
| troponin - I(ng/mL) | 1.78 ± 6.91 | 1.02 (0.99, 1.04) | 0.150 |
| LDH(Units/L) | 313.45 ± 245.90 | 1.00 (1.00, 1.00) | 0.929 |
| Platelets (cells × 109/L) | 208.63 ± 91.70 | 1.00 (1.00, 1.00) | 0.202 |
| RBC (M/mcl) | 3.72 ± 0.77 | 0.97 (0.79, 1.19) | 0.746 |
| Hemoglobin (g/dL) | 10.79 ± 2.19 | 0.99 (0.92, 1.06) | 0.745 |
| Hct (%) | 33.45 ± 6.66 | 1.00 (0.98, 1.02) | 0.973 |
| BNP (pg/mL) | 3455.02 ± 6948.42 | 1.00 (1.00, 1.00) | 0.412 |
| myoglobin(ng/mL) | 382.48 ± 1208.26 | 1.00 (0.99, 1.01) | 0.681 |
| Hospital admit source (N, %) | |||
| Emergency Department | 1,668 (60.54) | Ref. | |
| Operating Room | 513 (18.62) | 1.91 (1.27, 2.88) | 0.002 |
| Floor | 249 (9.04) | 1.64 (0.94, 2.88) | 0.084 |
| Direct Admit | 18 (0.65) | 1.41 (0.18, 10.72) | 0.742 |
| Other Hospital | 7 (0.25) | 3.98 (0.47, 33.55) | 0.204 |
| Other ICU | 67 (2.43) | 1.93 (0.75, 4.95) | 0.173 |
| ICU to SDU | 121 (4.39) | 1.25 (0.53, 2.94) | 0.614 |
| Chest Pain Center | 98 (3.56) | 1.84 (0.82, 4.12) | 0.139 |
| Unit admit source (N, %) | |||
| Emergency Department | 2,325 (61.39) | Ref. | |
| Operating Room | 758 (20.02) | 1.81 (1.27, 2.57) | <0.001 |
| ICU to SDU | 309 (8.16) | 1.79 (1.10, 2.92) | 0.012 |
| Floor | 5 (0.13) | 6.14 (0.68, 55.46) | 0.106 |
| Other Hospital | 5 (0.13) | 6.14 (0.68, 55.46) | 0.106 |
| Step-Down Unit (SDU) | 141 (3.72) | 1.28 (0.58, 2.82) | 0.536 |
| Chest Pain Center | 110 (2.90) | 1.67 (0.75, 3.69) | 0.206 |
| Recovery Room | 119 (3.14) | 2.25 (1.14, 4.45) | 0.019 |
| Treatment | |||
| Intubated (N, %) | |||
| No | 3,321 (87.63) | Ref. | |
| Yes | 469 (12.37) | 2.63 (1.87, 3.70) | <0.001 |
| Mechanical ventilation use (N, %) | |||
| No | 2,317 (61.13) | Ref. | |
| Yes | 1,473 (38.87) | 1.44 (1.08, 1.93) | 0.014 |
| Dialysis (N, %) | |||
| No | 3,506 (92.51) | Ref. | |
| Yes | 284 (7.49) | 0.39 (0.17, 0.89) | 0.025 |
| Severity of illness (N, %) | |||
| Acute Physiology Score III | |||
| Low (0.0–34.0) | 1,150 (33.13) | Ref. | |
| Middle (35.0–47.0) | 1,107 (31.89) | 1.60 (0.98, 2.62) | 0.062 |
| High (48.0–163.0) | 1,214 (34.98) | 4.31 (2.81, 6.61) | <0.001 |
| Apache IV score | |||
| Low (12.0–48.0) | 1,126 (32.44) | Ref. | |
| Middle (49.0–64.0) | 1,182 (34.05) | 2.65 (1.57, 4.45) | <0.001 |
| High (65.0–176.0) | 1,163 (33.51) | 5.66 (3.49, 9.19) | <0.001 |
| GCS score | |||
| Low (3.0–13.0) | 828 (22.10) | Ref. | |
| Middle (14.0–14.0) | 481 (12.84) | 0.54 (0.34, 0.87) | 0.010 |
| High (15.0–15.0) | 2,437 (65.06) | 0.34 (0.25, 0.48) | <0.001 |
| SOFA score | |||
| Low (0.0–1.0) | 1,249 (32.96) | Ref. | |
| Middle (2.0–3.0) | 1,208 (31.87) | 1.61 (1.01, 2.57) | 0.046 |
| High (4.0–16.0) | 1,333 (35.17) | 3.80 (2.52, 5.73) | <0.001 |
| Comorbidities (N, %) | |||
| Hepatic failure | |||
| No | 3,757 (99.13) | Ref. | |
| Yes | 33 (0.87) | 0.59 (0.08, 4.33) | 0.604 |
| Metastatic cancer | |||
| No | 3,747 (98.87) | Ref. | |
| Yes | 43 (1.13) | 2.53 (0.99, 6.51) | 0.054 |
| Leukemia | |||
| No | 3,762 (99.26) | Ref. | |
| Yes | 28 (0.74) | 2.29 (0.69, 7.67) | 0.177 |
| Immunosuppression | |||
| No | 3,714 (97.99) | Ref. | |
| Yes | 76 (2.01) | 1.96 (0.89, 4.32) | 0.096 |
| Cirrhosis | |||
| No | 3,752 (99.00) | Ref. | |
| Yes | 38 (1.00) | 1.05 (0.25, 4.41) | 0.943 |
| Diabetes | |||
| No | 2,474 (65.28) | Ref. | |
| Yes | 1,316 (34.72) | 0.70 (0.50, 0.96) | 0.030 |
| COPD | |||
| No | 3,219 (84.93) | Ref. | |
| Yes | 571 (15.07) | 0.50 (0.30, 0.85) | 0.010 |
| AMI | |||
| No | 3,589 (94.70) | Ref. | |
| Yes | 201 (5.30) | 0.57 (0.25, 1.30) | 0.181 |
| Pneumonia | |||
| No | 3,380 (89.18) | Ref. | |
| Yes | 410 (10.82) | 2.09 (1.44, 3.04) | <0.001 |
| Rhythm | |||
| No | 3,042 (80.26) | Ref. | |
| Yes | 748 (19.74) | 1.40 (1.00, 1.96) | 0.051 |
Effects of factors on the HR/T ratio by univariate analysis.
Data are expressed as the mean ± SD, or number (%). OR, odds ratio; BMI, body mass index; HR/T, heart rate/temperature; MAP, mean arterial pressure; AST, aspartate transaminase; ALT, alanine transaminase; LDH, lactate dehydrogenase; RBC, red blood cell; Hct, hematocrit; BNP, B-type natriuretic peptide; ICU, intensive care unit; SDU, Step-Down Unit; GCS, Glasgow Coma Scale; SOFA, Sequential Organ Failure Assessment; COPD, chronic obstructive pulmonary disease; AMI, acute myocardial infarction; Ref., Reference.
A variety of covariate adjustment strategies were employed, and the results of the multivariate regression model showed an association between the HR/T ratio and 28-day ICU mortality (Table 3). When the HR/T ratio was treated as a continuous variable, the unadjusted model demonstrated a positive correlation between an increasing HR/T ratio and 28-day mortality (OR = 1.45, 95% CI: 1.21–1.73). After adjustment for gender, age, ethnicity, and mechanical ventilation use in Model 2, the results were similar to those of the unadjusted model (OR = 1.49, 95% CI: 1.25–1.79, p < 0.001). Building on adjusted Model 2, after accounting for additional confounding variables, including diabetes, CHF, COPD, MAP, AMI, pneumonia, rhythm, β-blocker use, SOFA score, BUN, Albumin, Hct, ALT, there was an enhanced association between the HR/T ratio and 28-day mortality in patients with HF, which remained statistically significant (OR = 1.55, 95% CI: 1.17–2.04, p = 0.002). Upon analysis of the HR/T ratio by quartile in adjusted Model 3, the highest quartile (Q4, 3.29–4.13) exhibited a markedly elevated mortality risk compared with the lowest quartile (Q1, 1.28–1.76; OR = 2.66, 95% CI: 1.34–5.30).
Table 3
| Model 1 | Model 2 | Model 3 | ||||
|---|---|---|---|---|---|---|
| OR (95% CI) | p-value | OR (95% CI) | p-value | OR (95% CI) | p-value | |
| HR/T (bpm/°C) | 1.45 (1.21, 1.73) | <0.001 | 1.49 (1.25, 1.79) | <0.001 | 1.55 (1.17, 2.04) | 0.002 |
| HR/T quartile | ||||||
| Q1(1.28–1.76) | Ref. | Ref. | Ref. | |||
| Q2(2.44–2.72) | 1.03 (0.64, 1.66) | 0.900 | 1.14 (0.70, 1.84) | 0.596 | 1.71 (0.81, 3.59) | 0.158 |
| Q3(2.88–3.14) | 1.39 (0.89, 2.17) | 0.145 | 1.52 (0.97, 2.39) | 0.068 | 2.01 (0.98, 4.14) | 0.058 |
| Q4(3.29–4.13) | 2.11 (1.39, 3.20) | <0.001 | 2.30 (1.51, 3.51) | <0.001 | 2.66 (1.34, 5.30) | 0.005 |
| P for trend | <0.001 | <0.001 | 0.005 | |||
Associations between the HR/T ratio and 28-day mortality.
Model 1: Non-adjusted model. Model 2 adjust for: Gender, Age, Ethnicity, Mechanical ventilation use. Model 3 adjust for: Gender, Age, Ethnicity, Diabetes, CHF, COPD, MAP, AMI, Pneumonia, Rhythm, Mechanical ventilation use, β-blocker use, SOFA score, BUN, Albumin, Hct, ALT.
Using GAMs and curve fitting, an association between the HR/T ratio and 28-day ICU mortality in patients with HF remained apparent (Figure 2). After adjusting for covariates such as gender, age, ethnicity, diabetes, mechanical ventilation use, CHF, COPD, MAP, AMI, pneumonia, rhythm, β-blocker use, SOFA score, BUN, albumin, Hct, and ALT, a trend of increasing 28-day ICU mortality with rising HR/T ratios was observed. Additionally, the calculated E-value of 2.42 suggests stability and indicates that unmeasured confounders are unlikely to substantially affect the results.
Figure 2
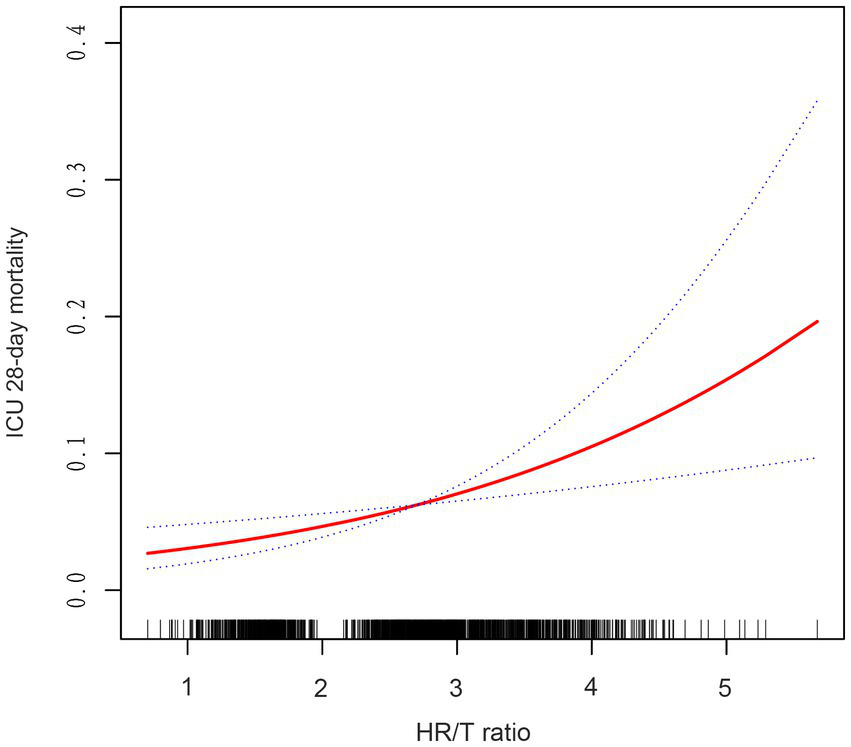
Associations between the HR/T ratio and 28-day mortality in all patients with heart failure. The solid rad line represents the smooth curve fit. The blue dashed line represents the 95% confidence interval. Adjusted for gender, age, ethnicity, diabetes, CHF, COPD, MAP, AMI, pneumonia, rhythm, mechanical ventilation use, β-blocker use, SOFA score, BUN, albumin, hct, ALT. HR/T, heart rate/temperature.
4 Discussion
This study analyzed clinical data from 3,790 HF patients in the eICU database and identified a significant association between HR/T ratio and 28-day ICU mortality risk. Specifically, higher HR/T ratios correlated with an increased risk of 28-day ICU mortality. To the best of our knowledge, this study is the first to report the relationship between HR/T ratio and 28-day mortality in critically ill patients with HF. These findings provide a theoretical basis for the clinical importance of HR/T ratio in cardiovascular diseases and underscore its potential value in assessing the mortality risk for critically ill patients with HF admitted to the ICU.
Among the 3,790 patients with HF included in this study, 190 died, resulting in an overall mortality rate of 5%. The mortality rate in Q1 was relatively low (3.69%), suggesting that the proportion of patients with high disease severity scores in the Q1 group was lower compared to the Q4 group. Specifically, 31.14% of patients in the Q1 group had higher APACHE scores (270/867) than 49.59% in the Q4 group (426/859). Similarly, 31.26% of the patients in the Q1 group had high Acute Physiology Score III (271/867) compared to 53.20% in the Q4 group (457/859).
Research on the correlation between HR/T ratio and mortality is scarce. Prior research has demonstrated that the HR/T ratio is predominantly linked to unfavorable outcomes pertaining to inflammatory processes. Leibovici et al. first identified a significant association between the HR/T ratio and poor clinical outcomes in 3,382 patients with systemic inflammatory response syndrome, suggesting that a high HR/T ratio may serve as an independent risk factor for mortality (6). Similarly, Dmitri Guz et al. investigated the correlation between the HR/T ratio and 30-day mortality in 1,186 patients undergoing β-blocker therapy (15). Using a multivariable logistic regression model, their study found that patients with a higher HR/T ratio exhibited a 75.7% increased risk of all-cause mortality compared to those with a lower HR/T ratio (OR = 1.757, 95% CI: 1.069–2.886, p = 0.03). Bistrovic et al. expanded the clinical implications of the HR/T ratio by demonstrating that a low HR/T ratio in critically ill patients with COVID-19 appears to predict mortality, major bleeding, and the need for mechanical ventilation (7). Lin et al. identified an HR/T ratio threshold of 2.22 through a two-piece-wise linear regression model and recursive algorithm, that closely associated with higher ICU mortality in critically ill patients (8). Unlike previous studies, our research identified a correlation between the HR/T ratio and 28-day ICU mortality in patients with HF, providing a theoretical basis for further research in this area.
Heart rate and body temperature are closely associated with the pathophysiological mechanisms of HF, which involve intricate physiological systems and molecular pathways. HF is generally considered a consequence of compensatory adaptations in cellular, neurohumoral, and structural elements following cardiac injury, which elicit activation of the sympatho-adrenomedullary system (16). This initiates a cascade of compensatory physiological responses, culminating in volume overload, elevated HR, dyspnea, and further deterioration of cellular functions, thereby establishing a vicious cycle (17). The resting HR is determined by the activity of the sinoatrial node, the primary pacemaker of the heart, which is largely influenced by the interplay between sympathetic and vagal nerves (18). Accordingly, an elevated resting HR is indicative of an imbalance between sympathetic overactivity and reduced vagal tone (18). Furthermore, immune responses involving macrophages and other immune-active cells in the inflammatory state play a pivotal role in the pathophysiology of HF (19). In patients with HF, the activation of the sympathetic nervous system results in the desensitization of β2-adrenergic receptors, which in turn alters immune function (20). Moreover, inflammatory cytokines such as interleukin-6 have been linked to the pathophysiology of HF (21, 22). The cascade of these cytokines can stimulate immune cells, including macrophages, T cells, and monocytes, to release IL-17 and TNF-α (23). These cytokines function as signals that facilitate the differentiation of immune cells into proinflammatory and profibrotic subsets. These mechanisms result in an elevated HR during the compensatory phase of HF and a reduced HR during the decompensatory phase, which subsequently alters the HR/T ratio. This may elucidate the correlation between the HR/T ratio and 28-day mortality in patients with HF.
There are four primary limitations of the study. (1) The definition of the HR/T ratio has some issues; the eICU-CRD only provides the worst HR and temperature within the first 24 h of ICU admission, which precludes the use of average values. This may have resulted in discontinuities in the smooth curve analysis. (2) In this study, HR/T was calculated based on the worst initial measurements recorded within the first 24 h of ICU admission. Consequently, the conclusions presented herein are applicable only to the worst values. Nevertheless, further research is required to investigate the mean values and dynamic fluctuations of heart rate and temperature, and additional studies are necessary to provide further evidence. (3) This study could only establish associations rather than determine causation. Meanwhile, given the intrinsic nature of our study design, several immeasurable confounding factors would inevitably arise. Accordingly, we adjusted for a range of confounding variables to ensure consistent results. For instance, the utilization of β-blockers may potentially impact the observed association. However, the results remained consistent after adjusting for this variable as a covariate. We used the E-value to quantify the impact of the unmeasured confounding factors and found that these factors were unlikely to significantly influence the results. (4) The diagnosis of CHF was based on the application of administrative codes. Although the first diagnostic code was used, misclassifications may have resulted in unintended associations.
In conclusion, among patients with HF admitted to the ICU, there was a significant association between HR/T ratio and 28-day ICU mortality. As the HR/T ratio increased, the risk of 28-day ICU mortality increased.
Statements
Data availability statement
The datasets presented in this study can be found in online repositories. The names of the repository/repositories and accession number(s) can be found at: https://physionet.org/content/eicu-crd/2.0/.
Ethics statement
The requirement of ethical approval was waived by Health Insurance Portability and Accountability Act (HIPAA) for the studies involving humans because in accordance with the Safe Harbor provision of the US Health Insurance Portability and Accountability Act (HIPAA), the database utilized in this study has been de-identified, with all protected health information removed to ensure the safeguarding of institutional and patient privacy. This retrospective study did not involve direct patient intervention and was exempted from the safety protocol by the PhysioNet review committee. The studies were conducted in accordance with the local legislation and institutional requirements. The ethics committee/institutional review board also waived the requirement of written informed consent for participation from the participants or the participants’ legal guardians/next of kin.
Author contributions
CF: Conceptualization, Data curation, Investigation, Software, Writing – original draft, Writing – review & editing. WL: Conceptualization, Data curation, Formal analysis, Writing – review & editing. XC: Conceptualization, Data curation, Formal analysis, Project administration, Writing – original draft. WH: Conceptualization, Data curation, Methodology, Writing – original draft. SY: Conceptualization, Data curation, Methodology, Writing – original draft. YL: Data curation, Formal analysis, Funding acquisition, Methodology, Project administration, Resources, Supervision, Validation, Visualization, Writing – original draft, Writing – review & editing.
Funding
The author(s) declare that no financial support was received for the research, authorship, and/or publication of this article.
Acknowledgments
The authors would like to thank the patients for their participation in this study.
Conflict of interest
XC was employed by the company Empower U, X&Y Solutions Inc.
The remaining authors declare that the research was conducted in the absence of any commercial or financial relationships that could be construed as a potential conflict of interest.
Publisher’s note
All claims expressed in this article are solely those of the authors and do not necessarily represent those of their affiliated organizations, or those of the publisher, the editors and the reviewers. Any product that may be evaluated in this article, or claim that may be made by its manufacturer, is not guaranteed or endorsed by the publisher.
Footnotes
References
1.
McDonagh TA Metra M Adamo M Gardner RS Baumbach A Böhm M et al . 2021 ESC guidelines for the diagnosis and treatment of acute and chronic heart failure. Eur Heart J. (2021) 42:3599–726. doi: 10.1093/eurheartj/ehab368
2.
GBD 2017 Disease and Injury Incidence and Prevalence Collaborators . Global, regional, and national incidence, prevalence, and years lived with disability for 354 diseases and injuries for 195 countries and territories, 1990–2017: a systematic analysis for the global burden of disease study 2017. Lancet. (2018) 392:1789–858. doi: 10.1016/S0140-6736(18)32279-7
3.
Virani SS Alonso A Aparicio HJ Benjamin EJ Bittencourt MS Callaway CW et al . Heart disease and stroke Statistics-2021 update: a report from the American Heart Association. Circulation. (2021) 143:e254–743. doi: 10.1161/CIR.0000000000000950
4.
Savarese G Becher PM Lund LH Seferovic P Rosano GMC Coats AJS . Global burden of heart failure: a comprehensive and updated review of epidemiology. Cardiovasc Res. (2023) 118:3272–87. doi: 10.1093/cvr/cvac013
5.
Zucker IH Xiao L Haack KKV . The central renin-angiotensin system and sympathetic nerve activity in chronic heart failure. Clin Sci (Lond). (2014) 126:695–706. doi: 10.1042/CS20130294
6.
Leibovici L Gafter-Gvili A Paul M Almanasreh N Tacconelli E Andreassen S et al . Relative tachycardia in patients with sepsis: an independent risk factor for mortality. QJM Mon J Assoc Phys. (2007) 100:629–34. doi: 10.1093/qjmed/hcm074
7.
Bistrovic P Besic D Cikara T Antolkovic L Bakovic J Radic M et al . Relative bradycardia and tachycardia and their associations with adverse outcomes in hospitalized COVID-19 patients. Rev Cardiovasc Med. (2023) 24:238. doi: 10.31083/j.rcm2408238
8.
Lin Z Lin S . Heart rate/temperature ratio: a practical prognostic indicator for critically ill patients with sepsis. Heliyon. (2024) 10:e24422. doi: 10.1016/j.heliyon.2024.e24422
9.
Pollard TJ Johnson AEW Raffa JD Celi LA Mark RG Badawi O . The eICU collaborative research database, a freely available multi-center database for critical care research. Sci Data. (2018) 5:180178. doi: 10.1038/sdata.2018.178
10.
World Medical Association . World medical association declaration of Helsinki: ethical principles for medical research involving human subjects. JAMA. (2013) 310:2191–4. doi: 10.1001/jama.2013.281053
11.
Li J Liu S Hu Y Zhu L Mao Y Liu J . Predicting mortality in intensive care unit patients with heart failure using an interpretable machine learning model: retrospective cohort study. J Med Internet Res. (2022) 24:e38082. doi: 10.2196/38082
12.
Zhou Y Wang C Che H Cheng L Zhu D Rao C et al . Association between the triglyceride-glucose index and the risk of mortality among patients with chronic heart failure: results from a retrospective cohort study in China. Cardiovasc Diabetol. (2023) 22:171. doi: 10.1186/s12933-023-01895-4
13.
Jaddoe VWV de Jonge LL Hofman A Franco OH Steegers EAP Gaillard R . First trimester fetal growth restriction and cardiovascular risk factors in school age children: population based cohort study. BMJ. (2014) 348:g14. doi: 10.1136/bmj.g14
14.
Haneuse S VanderWeele TJ Arterburn D . Using the E-value to assess the potential effect of unmeasured confounding in observational studies. JAMA. (2019) 321:602–3. doi: 10.1001/jama.2018.21554
15.
Guz D Buchritz S Guz A Ikan A Babich T Daitch V et al . Beta-blockers, tachycardia, and survival following Sepsis: an observational cohort study. Clin Infect Dis. (2021) 73:e921–6. doi: 10.1093/cid/ciab034
16.
Xu B Li H . Brain mechanisms of sympathetic activation in heart failure: roles of the renin-angiotensin system, nitric oxide and pro-inflammatory cytokines [review]. Mol Med Rep. (2015) 12:7823–9. doi: 10.3892/mmr.2015.4434
17.
Schwinger RHG . Pathophysiology of heart failure. Cardiovasc Diagn Ther. (2021) 11:263–76. doi: 10.21037/cdt-20-302
18.
Menown IBA Davies S Gupta S Kalra PR Lang CC Morley C et al . Resting heart rate and outcomes in patients with cardiovascular disease: where do we currently stand?Cardiovasc Ther. (2013) 31:215–23. doi: 10.1111/j.1755-5922.2012.00321.x
19.
Grassi G Mancia G Esler M . Central and peripheral sympathetic activation in heart failure. Cardiovasc Res. (2022) 118:1857–71. doi: 10.1093/cvr/cvab222
20.
Werdan K . The activated immune system in congestive heart failure--from dropsy to the cytokine paradigm. J Intern Med. (1998) 243:87–92. doi: 10.1046/j.1365-2796.1998.00265.x
21.
Dick SA Epelman S . Chronic heart failure and inflammation: what do we really know?Circ Res. (2016) 119:159–76. doi: 10.1161/CIRCRESAHA.116.308030
22.
Gullestad L Ueland T Vinge LE Finsen A Yndestad A Aukrust P . Inflammatory cytokines in heart failure: mediators and markers. Cardiology. (2012) 122:23–35. doi: 10.1159/000338166
23.
Li Z Zhao H Wang J . Metabolism and chronic inflammation: the links between chronic heart failure and comorbidities. Front Cardiovasc Med. (2021) 8:650278. doi: 10.3389/fcvm.2021.650278
Summary
Keywords
heart failure, heart rate, temperature, mortality, intensive care unit
Citation
Fu C, Lin W, Chen X, Hong W, Yan S and Lin Y (2024) Association between the heart rate to temperature ratio and 28-day mortality in patients with heart failure in intensive care unit: a multicenter retrospective cohort study. Front. Med. 11:1497245. doi: 10.3389/fmed.2024.1497245
Received
16 September 2024
Accepted
03 December 2024
Published
13 December 2024
Volume
11 - 2024
Edited by
Ting-Yung Chang, Taipei Veterans General Hospital, Taiwan
Reviewed by
Wenyue Cao, Huazhong University of Science and Technology, China
Ruey-Hsing Chou, Taipei Veterans General Hospital, Taiwan
Updates
Copyright
© 2024 Fu, Lin, Chen, Hong, Yan and Lin.
This is an open-access article distributed under the terms of the Creative Commons Attribution License (CC BY). The use, distribution or reproduction in other forums is permitted, provided the original author(s) and the copyright owner(s) are credited and that the original publication in this journal is cited, in accordance with accepted academic practice. No use, distribution or reproduction is permitted which does not comply with these terms.
*Correspondence: Shaorong Yan, 554346107@qq.comYuzhan Lin, 1016099047@qq.com
Disclaimer
All claims expressed in this article are solely those of the authors and do not necessarily represent those of their affiliated organizations, or those of the publisher, the editors and the reviewers. Any product that may be evaluated in this article or claim that may be made by its manufacturer is not guaranteed or endorsed by the publisher.