Abstract
Background:
Chronic kidney disease (CKD) is a significant global health issue, often linked to diabetes, hypertension, and glomerulonephritis. However, aggregated statistics can obscure heterogeneity across subtypes, age, gender, and regions. This study aimed to analyze global CKD trends from 1990 to 2021, focusing on age, gender, socio-demographic index (SDI), and regional variations.
Methods:
Data were extracted from the Global Burden of Disease (GBD) 2021 database, covering prevalence, incidence, mortality, and disability-adjusted life years (DALYs). These were presented as counts per 100,000 population and age-standardized rates, with uncertainty intervals (UIs) to highlight variability. Joinpoint regression was used to assess trends over the 30-year period.
Results:
In 2021, global CKD prevalence was 359 million, with 11.13 million new cases, 1.53 million deaths, and 44.45 million DALYs—up 92, 156, 176, and 114% since 1990. While prevalence slightly declined, incidence, mortality, and DALYs increased significantly. CKD burden varied by region and age, with notable gender disparities.
Conclusion:
The study highlights a dramatic rise in CKD burden linked to population growth and aging, emphasizing the need for targeted treatment and effective global healthcare policies.
Introduction
Chronic kidney disease (CKD) is characterized by abnormalities in kidney structure or function lasting more than 3 months, with significant health implications (1). CKD can result from a variety of factors, including clinical, sociodemographic, and environmental risks. Common causes include diabetes, hypertension, and glomerulonephritis, as identified in previous studies (2). Its high incidence, prevalence, and mortality rates have made CKD a pressing global public health challenge. Persistent disease burden stems from low awareness, insufficient prevention efforts, and limited treatment access. Moreover, CKD is a major contributor to reduced quality of life, alongside conditions such as cardiovascular diseases, cancer, and diabetes (3).
Recent studies, such as GBD 2019, have expanded our understanding of CKD by analyzing its subgroups (2). However, existing research often falls short in regional representation, longitudinal analyses, and the identification of key inflection points in disease trends—areas critical for effective policy development.
To address these gaps, this study utilizes GBD 2021 data, which offers a broader time frame (from 1990 to 2021) and more comprehensive coverage of CKD subtypes and etiologies. Compared to GBD 2019, the updated dataset provides refined estimates and expanded granularity, enabling deeper insights into global and regional CKD burden trends. To enhance the analysis, this study employs detailed subgroup stratifications by gender, age, and socio-demographic index (SDI). Additionally, Joinpoint regression analysis is applied to identify critical shifts in CKD burden trends over time. These methodological advancements provide a robust foundation for tailored prevention and management strategies.
This study aims to analyze the current status and trends in the burden of CKD and its subtypes from global, regional, and national perspectives, with the goal of increasing understanding of the health impact of CKD worldwide and providing a basis for formulating targeted prevention and treatment strategies.
Materials and methods
Data source and disease definition
The CKD data analyzed in this study were sourced from GBD 2021, which provides the latest epidemiological estimates of health hazards for 371 diseases, injuries, and impairments as well as 88 risk factors across 204 countries and regions from 1990 to 2021 (4). All data were freely accessible via the Global Health Data Exchange (GHDx).1 Compared to GBD 2019, GBD 2021 re-extracted data from the European Renal Association–European Dialysis and Transplant Association for 1998–2017 using global sex-specific coefficients, finer staging of dialysis, and narrower age ranges to enhance the accuracy of the database estimation models. GBD 2021 categorizes causes into four levels, ranging from Level 1 communicable, maternal, neonatal, and nutritional diseases to Level 4 latent tuberculosis infection (4). In GBD 2021, CKD is classified as a Level 3 cause, with five subtypes causing CKD burden categorized as Level 4 causes: type 1 diabetes, type 2 diabetes, glomerulonephritis, hypertension, and other causes (Figure 1). These specific causes were selected based on extensive epidemiological evidence indicating that diabetes, glomerulonephritis, and hypertension are major contributors to CKD globally, and are closely associated with its onset and progression. According to GBD 2021, CKD is defined as a condition with an estimated glomerular filtration rate below 60 mL/min/1.73 m2 or an albumin to creatinine ratio greater than 30 mg/g, encompassing disability and death, as well as those undergoing dialysis or kidney transplantation for end-stage renal disease.2 This study incorporated CKD and its five subtypes, aligning with the International Statistical Classification of Diseases and Related Health Problems, 10th Revision (ICD-10) definition.
Figure 1

The current subtypes of CKD featured in GBD 2021 and the complications that lead to other systemic diseases (created with BioRender.com).
Socio-demographic index
This study also utilizes the Sociodemographic Index (SDI), a quantitative measure of social population development in a region based on income, education, and fertility rates (5). GHDx categorizes 204 countries and regions into five groups based on their SDI values: low SDI (<0.45), low-middle SDI (≥0.45 and <0.61), middle SDI (≥0.61 and <0.69), high-middle SDI (≥0.69 and <0.80), and high SDI (≥0.80) using a scale from 0 to 1. A higher SDI value indicates a higher level of development for a country or region (6).
Joinpoint regression analysis
In this study, Joinpoint software (version 5.2.0) was employed to conduct Joinpoint regression analysis on the temporal trends of age-standardized rates of global CKD and its subtypes from 1990 to 2021. This analysis aimed to assess the global trends in the prevalence, incidence, mortality rates, and Disability-Adjusted Life Years (DALYs) associated with CKD The study calculated the Annual Percent Change (APC) and Average Annual Percent Change (AAPC) with their corresponding 95% confidence intervals (CI) for the entire study period (1990–2021) and different segmented periods. From a statistical perspective, APC or AAPC estimates with a lower bound of the 95% CI exceeding zero indicate an increasing trend within the specified interval. Conversely, a decreasing trend is observed when the upper bound of the 95% CI of the APC or AAPC estimates falls below zero. When the 95% CI of APC or AAPC was zero, a stable trend was suggested. The significance level for testing was set at p < 0.05 (7, 8).
Study variables and statistical analysis
Previous studies have explored the burden of diseases associated with CKD and provided valuable insights into this field (2, 9). In our latest research, we conducted a comprehensive assessment to quantify the global burden of CKD, including case numbers, prevalence, incidence, mortality rates, Disability-Adjusted Life Years (DALYs), age-standardized rates (per 100,000 population), Estimated Annual Percentage Change (EAPC), Average Annual Percentage Changes (AAPCs), and their respective 95% uncertainty intervals (UI) (10). Furthermore, this study delved into the demographic variables of CKD across 21 regions, categorized into five SDI regions, and encompassing 204 countries and territories. CKD types and subtypes were analyzed across different age groups and genders. Differences were considered statistically significant at p < 0.05 (two-tailed).
This study utilized R software (version 4.4.0) for data cleaning, computation, and visualization using the ggplot2 package. Trend graphs were plotted using GraphPad Prism (version 8.0.2), and the final editing was performed using Adobe Illustrator software (version CC2021).
Since data from the GBD database are publicly available, this study did not require informed consent from patients or institutions.
Results
Global level
In 2021, the global number of cases of CKD was 673,722,703 (95% UI: 629,095,119–722,364,096), with an age-standardized prevalence rate (ASPR) of 8,006 per 100,000 population (95% UI: 7,482,12–8,575,62) (Table 1). The global incidence of CKD was 19,935,038 per 100,000 population (95% UI: 18,702,793–21,170,794), with an age-standardized incidence rate (ASIR) of 233.56 per 100,000 population (95% UI: 220.02–247.24) (Table 2). CKD-related death totaled 1,527,639 per 100,000 population worldwide (95% UI: 1,389,377–1,638,914), corresponding to an age-standardized mortality rate (ASMR) of 18.5 per 100,000 population (95% UI: 16.72–19.85) (Table 3). Additionally, the number of CKD DALYs worldwide was 44,453,684 per 100,000 population (95% UI: 40,840,762–48,508,462), with an age-standardized DALY rate (ASDR) of 529.62 per 100,000 population (95% UI, 486.25–577.42) (Table 4).
Table 1
| 1990 | 2021 | 1990–2021 EAPC, No. (95%CI) | |||
|---|---|---|---|---|---|
| Prevalence cases (95%UI) | ASPR (Per 100,000 population) | Prevalence cases (95%UI) | ASPR (Per 100,000 population) | ||
| Sex | |||||
| Female | 188,185,026 (175,770,189–201,580,675) | 8,293.08 (7,778.75–8,870.27) | 358,777,424 (335,684,717–383,643,812) | 8,182.65 (7,653.14–8,764.76) | 0 (−0.04 to 0.03) |
| Male | 162,777,648 (151,189,911–174,916,268) | 7,812.80 (7,301.88–8,356.28) | 314,945,280 (293,385,891–338,118,606) | 7,808.96 (7,288.71–8,366.6) | 0.03 (0–0.05) |
| Global | 350,962,674 (326,973,785–376,155,723) | 8,072.75 (7,560.37–8,634.07) | 673,722,703 (629,095,119–722,364,096) | 8,006 (7,482.12–8,575.62) | 0.01 (−0.02 to 0.04) |
| Region | |||||
| Africa | |||||
| Central Sub-Saharan Africa | 2,633,228 (2,443,845–2,831,336) | 9,221.98 (8,598.75–9,806.74) | 6,811,951 (6,363,747–7,313,187) | 9,165.2 (8,640.85–9,709.73) | −0.08 (−0.09 to −0.06) |
| Eastern Sub-Saharan Africa | 5,981,606 (5,488,507–6,503,182) | 5,677.22 (5,266.15–6,113.13) | 15,017,846 (13,741,759–16,422,384) | 5,821.27 (5,404.49–6,293.6) | 0.11 (0.1–0.12) |
| Western Sub-Saharan Africa | 9,003,658 (8,381,320–9,663,357) | 8,310.65 (7,767.39–8,851.61) | 22,472,497 (20,882,526–24,191,820) | 8,324.27 (7,782.26–8,871.02) | 0.06 (0.04–0.07) |
| Southern Sub-Saharan Africa | 2,945,199 (2,740,170–3,170,275) | 8,946.44 (8,370.42–9,563.71) | 5,972,951 (5,547,456–6,415,524) | 9,037.91 (8,440.6–9,647.06) | 0.03 (0.02–0.04) |
| North Africa and Middle East | 19,739,135 (18,244,354–21,279,746) | 9,119.72 (8,490.94–9,769.64) | 49,668,756 (45,835,433–53,616,786) | 9,180.02 (8,523.53–9,830.12) | 0.03 (0.02–0.04) |
| America | |||||
| Andean Latin America | 1,465,459 (1,365,798–1,575,973) | 5,766.55 (5,377.83–6,181.01) | 3,743,589 (3,478,926–4,028,408) | 5,946.06 (5,524.81–6,371.54) | 0.14 (0.12–0.16) |
| Caribbean | 1,867,236 (1,741,663–2,000,227) | 6,480.16 (6,037.62–6,925.81) | 3,468,705 (3,235,452–3,720,720) | 6,632.98 (6,181.25–7,112.38) | 0.09 (0.08–0.1) |
| Central Latin America | 8,628,113 (8,065,183–9,238,847) | 8,477.01 (7,931.03–9,062.77) | 22,101,801 (20,701,763–23,422,153) | 8,642.9 (8,089.33–9,163.75) | 0.11 (0.09–0.12) |
| High-income North America | 25,125,238 (23,432,071–26,893,288) | 7,401.06 (6,920.42–7,900.28) | 42,488,578 (39,404,535–45,165,702) | 7,434.68 (6,959.33–7,911.44) | 0.17 (0.12–0.22) |
| Southern Latin America | 2,695,843 (2,510,441–2,883,801) | 5,784.4 (5,397.31–6,182.95) | 4,860,631 (4,530,777–5,214,539) | 5,970.43 (5,543.08–6,414.98) | 0.16 (0.14–0.18) |
| Tropical Latin America | 8,408,163 (7,820,461–9,015,639) | 7,763.01 (7,240.67–8,281.35) | 19,295,703 (18,022,781–20,680,042) | 7,576.23 (7,080.97–8,107.55) | −0.07 (−0.09 to −0.05) |
| Asia | |||||
| Central Asia | 5,534,240 (5,182,702–5,905,060) | 10,649.08 (10,005.67–11,309.29) | 9,356,434 (8,704,146–9,969,948) | 10,698.24 (10,022.94–11,348.1) | 0.02 (0.01–0.03) |
| East Asia | 69,797,869 (64,858,255–75,190,145) | 7,083.56 (6,610.07–7,593.48) | 122,849,232 (113,607,491–132,118,615) | 6,258.13 (5,823.13–6,729.82) | −0.19 (−0.32 to −0.05) |
| High-income Asia Pacific | 16,878,162 (15,709,632–18,083,496) | 8,566.14 (7,979.52–9,169.53) | 29,276,226 (27,336,162–31,020,670) | 7,920.71 (7,393.74–8,457.44) | −0.28 (−0.32 to −0.24) |
| South Asia | 72,584,182 (67,087,414–78,502,263) | 9,936.56 (9,252.61–10,645.69) | 158,803,354 (147,190,732–171,556,959) | 9,565.26 (8,903.67–10,265.71) | −0.19 (−0.25 to −0.14) |
| Southeast Asia | 33,768,821 (31,068,003–36,689,892) | 10,225.21 (9,474.04–11,022.1) | 73,561,437 (67,779,796–79,733,436) | 10,474.65 (9,718.92–11,301.72) | 0.1 (0.09–0.11) |
| Europe | |||||
| Central Europe | 8,932,587 (8,363,724–9,525,233) | 6,368.64 (5,978.05–6,771.96) | 11,481,266 (10,766,159–12,145,281) | 6,205.18 (5,841.05–6,596.24) | −0.16 (−0.18 to −0.14) |
| Eastern Europe | 24,173,788 (22,444,048–26,062,971) | 9,327.55 (8,680.03–10,050.13) | 27,312,843 (25,403,078–29,335,270) | 9,266.31 (8,619.37–9,989.49) | −0.02 (−0.03 to −0.02) |
| Western Europe | 29,093,594 (27,230,515–30,911,868) | 5,469.9 (5,132.58–5,799.43) | 41,591,466 (39,070,950–43,910,754) | 5,226.19 (4,924.43–5,544.2) | −0.16 (−0.2 to −0.13) |
| Oceania | |||||
| Australasia | 1,399,739 (1,315,064–1,481,429) | 6,084.38 (5,719.4–6,456.26) | 2,810,777 (2,637,789–2,995,329) | 5,910.04 (5,548.15–6,301.57) | −0.06 (−0.08 to −0.04) |
| Oceania | 306,814 (282,467–332,777) | 7,742.43 (7,231.44–8,304.17) | 776,661 (715,870–846,878) | 7,950.68 (7,408.82–8,567.73) | 0.12 (0.1–0.14) |
| Socio-Demographic index | |||||
| High SDI | 72,796,005 (68,039,542–77,665,594) | 6,883.99 (6,452.03–7,322.72) | 120,879,407 (113,333,443–127,967,827) | 6,733.55 (6,322.09–7,159.65) | −0.03 (−0.07 to 0.01) |
| High-middle SDI | 78,208,075 (72,803,156–84,086,890) | 7,641.21 (7,149.96–8,188.95) | 127,111,061 (118,337,580–136,309,239) | 7,267.74 (6,782.08–7,816.7) | −0.09 (−0.14 to −0.04) |
| Middle SDI | 105,819,342 (98,201,190–113,755,650) | 8,450.59 (7,891.9–9,069.19) | 220,823,054 (205,500,732–237,345,634) | 8,280.06 (7,728.02–8,885.29) | 0.01 (−0.03 to 0.05) |
| Low-middle SDI | 70,588,690 (65,338,440–76,043,937) | 9,292.53 (8,660.54–9,952.48) | 149,861,034 (139,108,422–161,539,154) | 9,171.03 (8,543.99–9,848.15) | −0.07 (−0.1 to −0.05) |
| Low SDI | 23,236,078 (21,506,138–25,034,232) | 8,090.37 (7,566.41–8,624.95) | 54,528,960 (50,362,040–59,039,888) | 7,984.37 (7,449.39–8,549.73) | −0.07 (−0.09 to −0.05) |
Global CKD prevalence by SDI and regions in 1990 and 2021, as well as changes in trends from 1990 to 2021.
ASPR, age-standardized prevalence rate; CI, confidence interval; CKD, chronic kidney disease; EAPC, estimated annual percentage change; SDI, socio-demographic index; UI, uncertainty interval.
Table 2
| Location | 1990 | 2021 | 1990–2021 EAPC, No. (95%CI) | ||
|---|---|---|---|---|---|
| Incidence cases (95%UI) | ASIR (Per 100,000 population) | Incidence cases (95%UI) | ASIR (Per 100,000 population) | ||
| Sex | |||||
| Female | 4,405,633 (4,083,071–4,760,087) | 201.88 (187.73–218.45) | 11,128,691 (10,445,862–11,806,798) | 246.03 (231.84–260.67) | 0.65 (0.64–0.66) |
| Male | 3,385,072 (3,133,504–3,642,480) | 180.89 (167.97–195.41) | 8,806,346 (8,248,899–9,359,371) | 220.11 (207.07–233.07) | 0.64 (0.63–0.66) |
| Global | 7,790,705 (7,226,165–8,402,568) | 192.16 (178.69–207.34) | 19,935,038 (18,702,793–21,170,794) | 233.56 (220.02–247.24) | 0.64 (0.63–0.65) |
| Region | |||||
| Africa | |||||
| Central Sub-Saharan Africa | 28,155 (26,057–30,337) | 94.53 (86.79–103.02) | 88,402 (82,071–94,885) | 130.46 (120.3–142.08) | 0.99 (0.84–1.14) |
| Eastern Sub-Saharan Africa | 94,221 (87,688–101,006) | 94.88 (87.6–102.96) | 244,189 (228,098–260,057) | 118.08 (108.97–127.55) | 0.6 (0.47–0.73) |
| Western Sub-Saharan Africa | 155,997 (145,849–167,785) | 136.02 (125.9–147.1) | 455,812 (426,702–486,021) | 179.77 (165.43–194.2) | 0.89 (0.77–1) |
| Southern Sub-Saharan Africa | 52,502 (48,770–56,528) | 169.07 (156.5–183.9) | 142,811 (132,638–152,029) | 233.6 (216.73–248.74) | 0.96 (0.83–1.1) |
| North Africa and Middle East | 482,950 (445,183–524,328) | 255.33 (235.33–277.99) | 1,988,923 (1,863,403–2,127,840) | 411.19 (385.4–438.45) | 1.5 (1.43–1.57) |
| America | |||||
| Andean Latin America | 36,900 (33,960–40,277) | 161.47 (147.69–177.34) | 177,934 (165,435–192,798) | 298.18 (276.18–322.6) | 2.27 (2.17–2.38) |
| Caribbean | 46,852 (43,426–50,526) | 168.79 (155.99–183.62) | 145,322 (136,425–154,427) | 274.22 (257.52–291.86) | 1.71 (1.61–1.8) |
| Central Latin America | 266,579 (245,613–291,023) | 275.61 (252.21–302.08) | 1,056,443 (1,000,773–1,110,306) | 411.41 (390.17–431.32) | 1.43 (1.36–1.5) |
| High-income North America | 1,050,737 (962,035–1,145,711) | 299.22 (274.55–324.91) | 2,026,546 (1,868,598–2,175,327) | 316.15 (294.31–338.42) | 0.1 (0.02–0.17) |
| Southern Latin America | 97,990 (89,314–107,374) | 212.82 (194.87–232.31) | 244,517 (224,582–263,090) | 281.73 (260.45–302.55) | 1.08 (0.96–1.19) |
| Tropical Latin America | 194,244 (179,335–210,104) | 192.83 (176.83–209.53) | 663,468 (620,124–707,786) | 259.33 (242.85–275.61) | 0.91 (0.86–0.96) |
| Asia | |||||
| Central Asia | 64,439 (59,475–69,705) | 114.2 (105.1–124.85) | 168,442 (154,020–183,300) | 187.28 (173.8–201.56) | 1.75 (1.61–1.9) |
| East Asia | 1,331,855 (1,207,022–1,453,259) | 149.1 (135.79–163.09) | 3,505,756 (3,245,783–3,750,967) | 166.6 (156.01–176.8) | 0.52 (0.46–0.59) |
| High-income Asia Pacific | 538,465 (494,808–584,025) | 269.95 (249.25–291.71) | 1,249,340 (1,151,298–1,346,531) | 274.49 (255.82–293.59) | 0.11 (0.07–0.16) |
| South Asia | 1,016,075 (938,359–1,099,033) | 146.23 (134.74–158.66) | 2,755,183 (2,545,113–2,967,871) | 177.65 (164.06–192.03) | 0.44 (0.36–0.52) |
| Southeast Asia | 466,174 (432,763–502,980) | 156.35 (144.87–169.32) | 1,568,475 (1,457,741–1,685,245) | 231.28 (215.53–247.34) | 1.26 (1.23–1.3) |
| Europe | |||||
| Central Europe | 193,169 (174,647–213,352) | 132.33 (120.8–145.32) | 458,516 (423,618–495,453) | 218.39 (203.44–234.06) | 1.5 (1.38–1.62) |
| Eastern Europe | 277,461 (253,751–306,742) | 108.38 (100.3–117.98) | 548,051 (501,351–595,627) | 180.1 (167.54–193.25) | 1.7 (1.64–1.77) |
| Western Europe | 1,328,467 (1,221,423–1,459,692) | 223.93 (207.15–244.09) | 2,271,237 (2,122,275–2,425,621) | 238.55 (223.94–254.27) | 0.25 (0.21–0.3) |
| Oceania | |||||
| Australasia | 62,421 (59,023–66,438) | 259.18 (245.73–274.3) | 160,661 (146,984–172,346) | 297.3 (274.48–317.56) | 0.45 (0.4–0.51) |
| Oceania | 5,052 (4,665–5,452) | 127.57 (117.55–138.5) | 15,011 (13,905–16,088) | 162.83 (151.06–174.45) | 0.75 (0.68–0.81) |
| Socio-Demographic index | |||||
| High SDI | 2,789,648 (2,576,788–3,024,433) | 252.3 (234.15–272.41) | 5,666,653 (5,273,251–6,033,381) | 277.75 (260.7–295.01) | 0.28 (0.24–0.32) |
| High-middle SDI | 1,574,444 (1,447,925–1,709,190) | 160.44 (148.12–174.09) | 3,917,149 (3,653,537–4,175,391) | 205.9 (194.1–218.61) | 0.92 (0.89–0.95) |
| Middle SDI | 1,963,348 (1,808,277–2,127,370) | 171.16 (157.68–185.82) | 6,251,147 (5,866,964–6,655,539) | 232.96 (219.53–246.12) | 1.06 (1.04–1.08) |
| Low-middle SDI | 1,107,201 (1,026,640–1,198,009) | 153.07 (141.43–166.4) | 3,130,960 (2,912,350–3,362,301) | 204.97 (189.81–220.29) | 0.82 (0.76–0.88) |
| Low SDI | 348,934 (324,143–375,458) | 121.74 (112.82–132.3) | 950,557 (888,494–1,011,543) | 155 (143.4–167.34) | 0.7 (0.62–0.78) |
Global CKD incidence by SDI and regions in 1990 and 2021, as well as changes in trends from 1990 to 2021.
ASIR, age-standardized incidence rate; CI, confidence interval; CKD, chronic kidney disease; EAPC, estimated annual percentage change; SDI, socio-demographic index; UI, uncertainty interval.
Table 3
| Location | 1990 | 2021 | 1990–2021 EAPC, No. (95%CI) | ||
|---|---|---|---|---|---|
| Death cases (95%UI) | ASMR (Per 100,000 population) | Death cases (95%UI) | ASMR (Per 100,000 population) | ||
| Sex | |||||
| Female | 261,007 (237,127–287,997) | 12.64 (11.44–14) | 733,120 (654,830–795,633) | 16.9 (14.22–17.27) | 0.83 (0.75–0.9) |
| Male | 291,666 (259,303–334,444) | 18.13 (16.26–21.03) | 794,519 (719,354–856,326) | 21.91 (19.66–23.60) | 0.74 (0.68–0.8) |
| Global | 552,673 (513,463–607,915) | 14.85 (13.64–16.38) | 1,527,639 (1,389,377–1,638,914) | 18.5 (16.72–19.85) | 0.82 (0.75–0.89) |
| Region | |||||
| Africa | |||||
| Central Sub-Saharan Africa | 8,667 (7,200–10,419) | 42.68 (35.55–51.04) | 21,011 (16,114–27,467) | 43.69 (33.26–56.29) | −0.03 (−0.12 to 0.06) |
| Eastern Sub-Saharan Africa | 30,615 (26,919–35,172) | 42.4 (37.14–50.19) | 60,918 (53,817–69,935) | 40.09 (35.57–46.03) | −0.36 (−0.44 to −0.28) |
| Western Sub-Saharan Africa | 28,294 (24,259–32,687) | 33.65 (28.97–39.19) | 64,796 (53,512–76,124) | 36.4 (31.14–42.75) | 0.2 (0.16–0.24) |
| Southern Sub-Saharan Africa | 5,376 (4,674–6,619) | 20.86 (17.97–26.16) | 17,365 (15,612–19,485) | 34.43 (31.05–38.29) | 1.76 (1.39–2.14) |
| North Africa and Middle East | 45,472 (37,703–66,491) | 31.22 (25.48–47.04) | 144,687 (126,153–162,699) | 37.71 (32.73–42.39) | 0.79 (0.64–0.95) |
| America | |||||
| Andean Latin America | 5,795 (5,288–6,456) | 28.53 (25.87–31.87) | 21,619 (17,903–25,800) | 37.66 (31.27–44.93) | 0.86 (0.54–1.18) |
| Caribbean | 4,754 (4,399–5,437) | 18.73 (17.3–21.32) | 13,888 (12,086–16,193) | 25.78 (22.39–30.07) | 1.48 (1.34–1.63) |
| Central Latin America | 22,182 (21,513–22,820) | 27.94 (26.82–28.83) | 104,444 (94,171–116,461) | 42.35 (38.32–47.03) | 1.81 (1.34–2.28) |
| High-income North America | 29,949 (27,171–31,433) | 8.32 (7.57–8.73) | 143,679 (124,827–154,757) | 20.55 (18.1–22) | 3.4 (3.2–3.6) |
| Southern Latin America | 11,256 (10,698–11,760) | 26 (24.55–27.17) | 21,583 (19,510–22,986) | 23.85 (21.63–25.37) | −0.08 (−0.36 to 0.21) |
| Tropical Latin America | 15,524 (14,832–16,076) | 17.94 (16.85–18.75) | 46,925 (42,508–49,438) | 18.84 (17–19.87) | 0.21 (0.06–0.36) |
| Asia | |||||
| Central Asia | 2,536 (2,250–2,933) | 5.01 (4.38–5.94) | 9,397 (8,278–10,515) | 12.11 (10.72–13.53) | 2.39 (1.91–2.87) |
| East Asia | 107,701 (94,477–126,024) | 14.37 (12.68–16.98) | 217,342 (178,047–259,057) | 11.15 (9.2–13.21) | −0.84 (−0.92 to −0.76) |
| High-income Asia Pacific | 22,233 (20,303–23,333) | 12.61 (11.29–13.32) | 63,459 (50,432–70,953) | 9.74 (8.09–10.68) | −0.92 (−1 to −0.85) |
| South Asia | 79,714 (68,086–89,404) | 13.98 (12.14–15.9) | 226,043 (192,546–264,155) | 16.45 (14.03–19.25) | 0.42 (0.3–0.53) |
| Southeast Asia | 57,881 (52,199–66,490) | 22.86 (20.59–26.7) | 170,033 (148,864–190,537) | 28.47 (24.79–31.87) | 0.71 (0.66–0.76) |
| Europe | |||||
| Central Europe | 14,335 (13,732–14,892) | 10.47 (10–10.92) | 21,635 (19,445–23,977) | 9.39 (8.41–10.47) | −0.29 (−0.45 to −0.14) |
| Eastern Europe | 9,389 (9,183–9,574) | 3.58 (3.5–3.65) | 17,821 (16,126–19,853) | 5.22 (4.73–5.82) | 0.67 (0.32–1.02) |
| Western Europe | 48,662 (44,430–50,877) | 8.26 (7.52–8.66) | 133,481 (109,637–148,166) | 10.66 (8.9–11.81) | 1.35 (1.19–1.51) |
| Oceania | |||||
| Australasia | 1,851 (1,687–1,959) | 8.47 (7.66–8.99) | 5,968 (5,025–6,525) | 9.63 (8.23–10.47) | 1.06 (0.82–1.3) |
| Oceania | 489 (342–661) | 17.22 (12.83–23.08) | 1,546 (1,265–1,892) | 21.56 (17.98–26.37) | 0.64 (0.53–0.75) |
| Socio-Demographic index | |||||
| High SDI | 100,025 (92,113–104,189) | 9.22 (8.45–9.62) | 340,083 (289,016–369,665) | 14.11 (12.3–15.21) | 1.73 (1.61–1.86) |
| High-middle SDI | 99,196 (91,758–110,668) | 11.36 (10.43–12.65) | 226,797 (201,672–252,703) | 12.02 (10.68–13.38) | 0.25 (0.16–0.34) |
| Middle SDI | 177,302 (162,783–198,065) | 19.07 (17.39–21.35) | 513,051 (458,865–556,752) | 20.89 (18.45–22.67) | 0.38 (0.29–0.48) |
| Low-middle SDI | 110,899 (98,721–127,673) | 18.59 (16.43–22.23) | 309,509 (280,315–349,455) | 23.08 (20.97–26.31) | 0.71 (0.66–0.75) |
| Low SDI | 64,656 (57,360–73,648) | 29.72 (26.31–34.62) | 136,797 (118,867–157,579) | 29.43 (26.13–33.79) | −0.08 (−0.2 to 0.03) |
Global CKD morality by SDI and regions in 1990 and 2021, as well as changes in trends from 1990 to 2021.
ASMR, age-standard morality rate; CI, confidence interval; CKD, chronic kidney disease; EAPC, estimated annual percentage change; SDI, socio-demographic index; UI, uncertainty interval.
Table 4
| Location | 1990 | 2021 | 1990–2021 EAPC, No. (95%CI) | ||
|---|---|---|---|---|---|
| DALY cases (95%UI) | ASDR (Per 100,000 population) | DALY cases (95%UI) | ASDR (Per 100,000 population) | ||
| Sex | |||||
| Female | 9,670,407 (8,788,280–10,592,764) | 426.9 (389.12–467.43) | 20,693,932 (18,836,614–22,728,832) | 465.69 (424.02–511.12) | 0.3 (0.25–0.35) |
| Male | 11,069,488 (9,601,627–12,296,840) | 546.41 (476.93–612.62) | 23,759,752 (21,473,235–26,215,374) | 603.4 (546.08–663.35) | 0.39 (0.36–0.43) |
| Global | 20,739,895 (18,843,684–22,588,533) | 479.85 (439.18–523.79) | 44,453,684 (40,840,762–48,508,462) | 529.62 (486.25–577.42) | 0.37 (0.33–0.41) |
| Region | |||||
| Africa | |||||
| Central Sub-Saharan Africa | 349,929 (293,393–410,516) | 1,158.69 (983.37–1,367.04) | 783,700 (622,595–996,532) | 1,124.7 (899.03–1,436.09) | −0.19 (−0.26 to −0.12) |
| Eastern Sub-Saharan Africa | 1,117,669 (975,468–1,248,904) | 1,095.23 (965.94–1,254.96) | 2,047,629 (1,792,019–2,374,164) | 948.36 (838.71–1,090.36) | −0.66 (−0.73 to −0.58) |
| Western Sub-Saharan Africa | 1,112,629 (952,298–1,275,995) | 928.71 (800.33–1,067.12) | 2,437,269 (1,992,652–2,893,649) | 930.73 (788.43–1,081.08) | −0.04 (−0.08 to 0) |
| Southern Sub-Saharan Africa | 202,978 (179,955–234,849) | 623.85 (548.64–742.1) | 551,466 (494,226–622,064) | 895.96 (807.34–996.98) | 1.32 (0.99–1.65) |
| North Africa and Middle East | 1,493,457 (1,272,351–1,963,220) | 759.9 (642.73–1,059.21) | 3,925,988 (3,427,227–4,413,622) | 846.64 (747.17–948.02) | 0.51 (0.41–0.61) |
| America | |||||
| Andean Latin America | 190,986 (174,177–211,377) | 753.97 (688.02–838.66) | 524,246 (434,446–625,013) | 872.44 (723.54–1,037.91) | 0.39 (0.12–0.67) |
| Caribbean | 161,590 (149,056–180,712) | 565.09 (523.55–636.63) | 385,286 (331,558–454,109) | 735.85 (631.01–867.89) | 1.25 (1.13–1.37) |
| Central Latin America | 779,859 (736,752–822,191) | 767.86 (724.18–811.62) | 2,993,750 (2,691,663–3,371,708) | 1,171.14 (1,054.82–1,316.26) | 1.75 (1.32–2.18) |
| High-income North America | 895,097 (798,640–986,360) | 266.63 (238.28–293.17) | 3,120,983 (2,864,207–3,351,576) | 508.81 (467.04–545.39) | 2.45 (2.3–2.6) |
| Southern Latin America | 281,092 (266,405–294,525) | 612.71 (580.9–641.72) | 441,138 (411,345–467,913) | 515.22 (481.75–546.8) | −0.37 (−0.59 to −0.15) |
| Tropical Latin America | 594,892 (560,161–631,009) | 562.72 (527.93–598.67) | 1,311,915 (1,220,675–1,401,164) | 516.97 (480.55–552.11) | −0.31 (−0.43 to −0.18) |
| Asia | |||||
| Central Asia | 176,292 (152,244–202,201) | 326.08 (278.46–378.79) | 427,633 (377,524–490,696) | 493.2 (435.99–565.47) | 1.02 (0.68–1.36) |
| East Asia | 4,372,608 (3,843,678–4,996,867) | 461.27 (406.84–529.07) | 6,486,167 (5,538,060–7,597,380) | 322.36 (275.35–377.34) | −1.18 (−1.27 to −1.1) |
| High-income Asia Pacific | 599,581 (550,356–643,830) | 315.66 (289.04–339.18) | 1,146,613 (990,343–1,268,312) | 235.57 (206.04–259.61) | −0.92 (−0.98 to −0.87) |
| South Asia | 3,674,401 (3,157,460–4,115,106) | 509.78 (449.63–573.28) | 8,443,339 (7,372,315–9,681,828) | 540.57 (473.83–620.42) | 0.13 (0.08–0.17) |
| Southeast Asia | 2,408,834 (2,133,712–2,690,991) | 751.94 (672.31–850.85) | 5,703,263 (5,028,657–6,329,025) | 846.26 (753.05–940.53) | 0.38 (0.35–0.41) |
| Europe | |||||
| Central Europe | 469,644 (436,516–504,841) | 342.78 (318.66–368.53) | 539,982 (472,193–612,672) | 266.92 (233.43–306.23) | −0.74 (−0.84 to −0.64) |
| Eastern Europe | 521,705 (463,250–581,791) | 207.42 (184.74–230.89) | 642,467 (562,943–726,952) | 204.68 (180.4–232.13) | −0.58 (−0.77 to −0.38) |
| Western Europe | 1,267,566 (1,125,408–1,409,086) | 234.12 (206.76–260.11) | 2,361,342 (2,067,098–2,638,163) | 241.72 (209.82–271.06) | 0.38 (0.29–0.47) |
| Oceania | |||||
| Australasia | 46,405 (42,217–50,551) | 211.12 (192.43–229.58) | 113,693 (101,514–125,301) | 216.61 (193.23–239.24) | 0.53 (0.36–0.7) |
| Oceania | 22,680 (16,686–29,125) | 583.66 (445.79–741.99) | 65,815 (55,558–77,796) | 699.04 (597.93–821.29) | 0.52 (0.42–0.62) |
| Socio-Demographic index | |||||
| High SDI | 2,898,450 (2,605,440–3,169,018) | 277.64 (250.03–303.24) | 7,115,740 (6,464,112–7,759,250) | 358.51 (324.74–390.2) | 1.07 (0.99–1.16) |
| High-middle SDI | 3,534,406 (3,184,087–3,954,975) | 360.84 (325.48–401.53) | 5,944,277 (5,372,850–6,623,407) | 324.64 (293.58–360.92) | −0.35 (−0.42 to −0.28) |
| Middle SDI | 7,031,758 (6,325,501–7,794,727) | 585.56 (531.8–652.64) | 15,700,568 (14,206,921–17,147,169) | 596.45 (540.33–650.48) | 0.12 (0.04–0.2) |
| Low-middle SDI | 4,690,095 (4,056,126–5,163,160) | 609.44 (545.07–686.29) | 10,611,260 (9,599,821–11,771,755) | 686.98 (622.5–765.2) | 0.4 (0.38–0.42) |
| Low SDI | 2,564,545 (2,265,146–2,870,454) | 853.94 (760.14–971.76) | 5,042,405 (4,408,653–5,841,516) | 791.8 (704.14–909.1) | −0.34 (−0.42 to −0.25) |
Global CKD DALYs by SDI and regions in 1990 and 2021, as well as changes in trends from 1990 to 2021.
ASDR, age-standard DALYs rate; CI, confidence interval; CKD, chronic kidney disease; DALYs, disability-adjusted life years; EAPC, estimated annual percentage change; SDI, socio-demographic index; UI, uncertainty interval.
A non-significant increasing trend was observed in global ASPR data for CKD from 1990 to 2021, with an estimated annual percentage change (EAPC) of 0.01 per 100,000 population annually (95% CI: −0.02 to 0.04). Nevertheless, over the 30-year period, there was a general decline in prevalence (AAPC = −2.1, 95% CI: −3.9% to −0.2%, p = 0.030) (Tables 5, 6). Conversely, incidence rates, mortality rates, and DALYs rates have increased significantly over the 30 years. The EAPCs for incidence, mortality, and DALYs rates are 0.64 per 100,000 (95% CI: 0.63–0.65), 0.82 per 100,000 (95% CI: 0.75–0.89), and 0.37 per 100,000 (95% CI: 0.33–0.41). The results indicated a positive trend in the AAPCs for all three indices, with the ASIR (AAPC = 63.4, 95% CI: 62.1–64.6%, p < 0.001), ASMR (AAPC = 74.5, 95% CI: 60.3–88.6%, p < 0.001), and ASDR (AAPC = 32.2, 95% CI: 26.2–38.3%, p < 0.001) indices demonstrating increasing trends (Tables 5, 6).
Table 5
| 1990 | 2021 | 1990–2021 EAPC, No. (95%CI) | |||||||||||||
|---|---|---|---|---|---|---|---|---|---|---|---|---|---|---|---|
| Both sexes (95%UI) | Female (95%UI) | Male (95%UI) | Both sexes (95%UI) | Female (95%UI) | Male (95%UI) | Both sexes (95%UI) | Female (95%UI) | Male (95%UI) | |||||||
| Cases | Rate | Cases | Rate | Cases | Rate | Cases | Rate | Cases | Rate | Cases | Rate | ||||
| CKD | |||||||||||||||
| Prevalence | 350,962,674 (326,973,785–376,155,723) | 8,072.75 (7,560.37–8,634.07) | 188,185,026 (175,770,189–201,580,675) | 8,293.08 (7,778.75–8,870.27) | 162,777,648 (151,189,910–174,916,268) | 7,812.8 (7,301.88–8,356.28) | 673,722,703 (629,095,119–722,364,096) | 8,006 (7,482.12–8,575.62) | 358,777,424 (335,684,717–383,643,812) | 8,182.65 (7,653.14–8,764.76) | 314,945,280 (293,385,891–338,118,606) | 7,808.96 (7,288.71–8,366.6) | 0.01 (−0.02 to 0.04) |
0 (−0.04 to 0.03) |
0.03 (0–0.05) |
| Incidence | 7,790,705 (7,226,165–8,402,568) | 192.16 (178.69–207.34) | 4,405,633 (4,083,071–4,760,087) | 201.88 (187.73–218.45) | 3,385,072 (3,133,504–3,642,480) | 180.89 (167.97–195.41) | 19,935,038 (18,702,793–21,170,794) | 233.56 (220.02–247.24) | 11,128,691 (10,445,862–11,806,798) | 246.03 (231.84–260.67) | 8,806,346 (8,248,899–9,359,371) | 220.11 (207.07–233.07) | 0.64 (0.63–0.65) | 0.65 (0.64–0.66) | 0.64 (0.63–0.66) |
| Deaths | 552,673 (513,463–607,915) | 14.85 (13.64–16.38) | 261,007 (237,127–287,997) | 12.64 (11.44–13.99) | 291,666 (259,303–334,444) | 18.13 (16.26–21.03) | 1,527,639 (1,389,377–1,638,914) | 18.5 (16.72–19.85) | 733,120 (654,830–795,633) | 15.9 (14.22–17.27) | 794,519 (719,354–856,326) | 21.91 (19.66–23.6) | 0.82 (0.75–0.89) | 0.83 (0.75–0.9) | 0.74 (0.68–0.8) |
| DALYs | 20,739,895 (18,843,684–22,588,533) | 479.85 (439.18–523.79) | 9,670,407 (8,788,280–10,592,764) | 426.9 (389.12–467.43) | 11,069,488 (9,601,627–12,296,840) | 546.41 (476.93–612.62) | 44,453,684 (40,840,762–48,508,462) | 529.62 (486.25–577.42) | 20,693,932 (18,836,614–22,728,832) | 465.69 (424.02–511.12) | 23,759,752 (21,473,235–26,215,374) | 603.4 (546.08–663.35) | 0.37 (0.33–0.41) | 0.3 (0.25–0.35) | 0.39 (0.36–0.43) |
| T1DM | |||||||||||||||
| Prevalence | 49,300 (39,088–61,208) | 1.08 (0.84–1.35) | 22,377 (17,833–28,820) | 0.97 (0.77–1.26) | 26,924 (20,680–34,089) | 1.19 (0.9–1.53) | 94,020 (71,457–119,984) | 1.08 (0.83–1.38) | 39,416 (30,272–51,111) | 0.89 (0.69–1.15) | 54,604 (40,656–69,965) | 1.28 (0.96–1.63) | −0.07 (−0.13 to 0) | −0.42 (−0.52 to −0.33) | 0.2 (0.16–0.25) |
| Incidence | 2,967,857 (2,607,069–3,328,285) | 57.54 (50.87–64.11) | 1,728,367 (1,482,021–1,974,137) | 66.85 (57.8–75.9) | 1,239,490 (1,113,261–1,373,486) | 48.37 (43.74–53.53) | 6,295,711 (5,459,693–7,114,345) | 77.31 (66.91–87.58) | 3,668,687 (3,109,394–4,232,810) | 90.71 (76.97–104.6) | 2,627,023 (2,318,287–2,923,705) | 64.19 (56.78–71.74) | 1.35 (1.25–1.46) | 1.37 (1.27–1.47) | 1.33 (1.22–1.45) |
| Deaths | 63,601 (52,476–76,375) | 1.1 (0.92–1.31) | 26,773 (21,783–33,119) | 0.94 (0.77–1.15) | 36,829 (30,520–43,841) | 1.25 (1.06–1.48) | 95,140 (82,237–111,471) | 1.31 (1.12–1.55) | 38,228 (32,027–45,888) | 1.08 (0.89–1.33) | 56,911 (49,528–65,500) | 1.53 (1.32–1.78) | 0.69 (0.63–0.74) | 0.55 (0.51–0.58) | 0.79 (0.73–0.86) |
| DALYs | 2,227,518 (1,835,373–2,679,208) | 47.05 (38.4–57.32) | 1,010,830 (828,455–1,248,632) | 42.69 (34.68–53.34) | 1,216,689 (978,326–1,486,172) | 51.44 (40.65–63.6) | 3,875,628 (3,062,396–4,845,503) | 45.2 (36.01–56.35) | 1,609,247 (1,278,069–2,036,183) | 37.27 (29.68–47.09) | 2,266,380 (1,739,578–2,862,625) | 53.21 (40.96–67.05) | −0.21 (−0.28 to −0.14) | −0.59 (−0.69 to −0.49) | 0.08 (0.03–0.13) |
| T2DM | |||||||||||||||
| Prevalence | 58,105,268 (53,056,992–63,286,818) | 1,327.22 (1,223.26–1,439.42) | 28,360,560 (25,996,835–30,841,479) | 1,250.08 (1,152.38–1,357.8) | 29,744,708 (27,057,208–32,317,657) | 1,414.09 (1,298.44–1,528.78) | 107,559,955 (99,170,797–115,994,732) | 1,259.63 (1,161.99–1,359.92) | 52,837,532 (48,769,234–56,931,920) | 1,191.96 (1,100.99–1,286.63) | 54,722,423 (50,395,175–59,068,229) | 1,333.1 (1,229.35–1,437.39) | −0.17 (−0.2 to −0.13) | −0.14 (−0.19 to −0.09) | −0.21 (−0.23 to −0.18) |
| Incidence | 753,106 (680,930–826,928) | 19.07 (17.28–20.83) | 376,968 (341,204–413,084) | 17.62 (15.96–19.26) | 376,138 (339,359–412,959) | 20.88 (18.91–22.8) | 2,012,025 (1,857,800–2,154,288) | 23.07 (21.4–24.72) | 990,074 (915,628–1,063,729) | 21.42 (19.84–22.97) | 1,021,951 (943,498–1,098,453) | 25.01 (23.14–26.82) | 0.61 (0.6–0.62) | 0.63 (0.62–0.65) | 0.57 (0.56–0.58) |
| Deaths | 147,970 (124,179–176,413) | 4.15 (3.5–4.94) | 72,522 (60,489–86,024) | 3.6 (3–4.29) | 75,448 (61,702–93,510) | 4.98 (4.09–6.13) | 477,273 (401,541–565,951) | 5.72 (4.83–6.79) | 230,668 (193,896–274,409) | 4.93 (4.15–5.86) | 246,605 (204,152–294,508) | 6.77 (5.57–8.14) | 1.16 (1.09–1.24) | 1.1 (1.02–1.17) | 1.16 (1.09–1.23) |
| DALYs | 4,122,919 (3,498,980–4,818,958) | 105.71 (90.68–122.67) | 1,975,646 (1,674,230–2,307,158) | 93.54 (79.27–108.89) | 2,147,273 (1,750,418–2,594,132) | 121.65 (100.4–145.91) | 11,278,935 (9,682,785–13,103,871) | 131.08 (112.75–152.49) | 5,262,931 (4,502,103–6,118,770) | 113.67 (97.44–132.05) | 6,016,004 (5,067,209–7,070,255) | 151.81 (129.54–177.25) | 0.8 (0.74–0.87) | 0.69 (0.63–0.76) | 0.86 (0.8–0.92) |
| Glomerulonephritis | |||||||||||||||
| Prevalence | 244,229 (218,811–271,857) | 4.3 (3.88–4.75) | 87,235 (77,100–99,306) | 3.1 (2.75–3.5) | 156,994 (141,222–173,481) | 5.48 (4.98–6.01) | 357,288 (329,226–388,483) | 4.84 (4.42–5.29) | 120,654 (109,596–133,046) | 3.38 (3.04–3.77) | 236,634 (218,787–254,836) | 6.28 (5.77–6.78) | 0.39 (0.36–0.43) | 0.28 (0.24–0.32) | 0.45 (0.41–0.49) |
| Incidence | 6,370,882 (5,926,723–6,848,154) | 128.55 (119.33–137.58) | 2,644,789 (2,434,847–2,883,624) | 106.92 (98.49–116.09) | 3,726,093 (3,484,081–3,986,630) | 150.9 (141.25–160.98) | 10,735,809 (9,925,500–11,520,171) | 129.94 (120.25–139.51) | 4,531,261 (4,169,272–4,956,553) | 108.5 (99.78–118.56) | 6,204,548 (5,774,782–6,630,226) | 151.85 (141.58–162.39) | 0.06 (0.04–0.08) | 0.09 (0.06–0.11) | 0.04 (0.02–0.06) |
| Deaths | 83,170 (69,625–97,738) | 2.02 (1.68–2.38) | 37,141 (31,114–43,462) | 1.67 (1.38–1.96) | 46,028 (37,748–54,972) | 2.5 (2.05–3.01) | 193,997 (162,332–226,569) | 2.34 (1.96–2.74) | 89,022 (73,524–105,883) | 1.99 (1.66–2.36) | 104,975 (87,280–123,438) | 2.78 (2.3–3.26) | 0.54 (0.5–0.59) | 0.6 (0.54–0.66) | 0.43 (0.39–0.47) |
| DALYs | 3,751,088 (3,252,292–4,269,460) | 77.78 (67.62–88.41) | 1,655,577 (1,429,752–1,885,529) | 67.19 (57.78–76.73) | 2,095,512 (1,783,982–2,409,288) | 90.23 (77.22–104.71) | 6,959,758 (6,018,414–7,961,673) | 84.47 (73.2–96.13) | 3,068,936 (2,640,502–3,521,006) | 72.47 (62.8–82.98) | 3,890,822 (3,322,946–4,499,291) | 97.57 (83.48–112.8) | 0.28 (0.25–0.31) | 0.23 (0.19–0.28) | 0.29 (0.27–0.31) |
| Hypertension | |||||||||||||||
| Prevalence | 11,712,345 (10,891,658–12,623,876) | 310.68 (289.07–333.84) | 5,934,028 (5,515,951–6,381,488) | 285.32 (265.67–306.5) | 5,778,317 (5,369,612–6,220,947) | 344.62 (320.69–370.53) | 24,467,653 (22,861,634–26,230,869) | 291.19 (272.49–311.88) | 11,975,406 (11,204,542–12,802,395) | 261.49 (244.79–279.02) | 12,492,247 (11,676,417–13,414,331) | 327.71 (306.18–351.39) | −0.16 (−0.18 to −0.13) | −0.22 (−0.25 to −0.19) | −0.12 (−0.14 to −0.1) |
| Incidence | 463,924 (426,189–505,831) | 12.24 (11.31–13.33) | 235,211 (216,325–257,276) | 11.23 (10.36–12.21) | 228,713 (209,258–248,913) | 13.59 (12.56–14.86) | 1,282,205 (1,195,230–1,366,296) | 14.97 (14.02–15.93) | 633,339 (591,756–672,358) | 13.71 (12.82–14.56) | 648,865 (605,404–692,260) | 16.54 (15.47–17.64) | 0.66 (0.65–0.67) | 0.66 (0.65–0.66) | 0.64 (0.64–0.65) |
| Deaths | 148,983 (123,167–176,985) | 4.29 (3.55–5.11) | 68,301 (56,331–80,968) | 3.47 (2.85–4.11) | 80,682 (65,428–100,070) | 5.53 (4.55–6.86) | 454,359 (381,291–524,688) | 5.54 (4.68–6.41) | 214,533 (175,442–249,402) | 4.6 (3.77–5.33) | 239,825 (200,045–280,262) | 6.8 (5.66–7.85) | 0.96 (0.9–1.02) | 1.03 (0.96–1.11) | 0.82 (0.76–0.87) |
| DALYs | 4,344,896 (3,676,494–5,110,004) | 107.77 (91.26–126.92) | 1,915,563 (1,616,163–2,234,955) | 88.81 (74.66–103.46) | 2,429,333 (2,032,444–2,969,455) | 132.24 (111.27–160.76) | 10,850,728 (9,207,080–12,320,650) | 128.41 (109.14–145.64) | 4,814,732 (4,100,512–5,513,964) | 106.04 (90.33–121.44) | 6,035,995 (5,059,223–7,010,183) | 154.81 (130.79–178.18) | 0.62 (0.58–0.67) | 0.6 (0.54–0.66) | 0.59 (0.55–0.63) |
| Other | |||||||||||||||
| Prevalence | 271,806,360 (253,122,975–291,694,859) | 6,248.77 (5,852.52–6,683.27) | 149,517,320 (139,624,963–160,490,353) | 6,583.91 (6,168.11–7,039.66) | 122,289,039 (113,501,069–131,644,298) | 5,854.82 (5,470.99–6,265.45) | 524,663,972 (488,899,870–562,780,408) | 6,247.94 (5,823.88–6,691.38) | 285,764,930 (267,230,946–305,356,489) | 6,530.01 (6,090.76–6,986.52) | 238,899,041 (221,964,877–257,251,009) | 5,932.11 (5,522.85–6,362.71) | 0.04 (0.01–0.07) | 0.01 (−0.02 to 0.05) | 0.08 (0.05–0.1) |
| Incidence | 6,265,844 (5,808,707–6,762,739) | 155.45 (144.13–167.87) | 3,679,445 (3,411,383–3,983,479) | 169 (156.95–182.99) | 2,586,399 (2,387,039–2,788,824) | 139.68 (129.2–150.66) | 16,188,381 (15,192,359–17,180,106) | 189.36 (178.21–200.61) | 9,346,396 (8,784,299–9,915,713) | 206.44 (194.9–218.84) | 6,841,985 (6,404,404–7,271,000) | 170.74 (160.45–180.96) | 0.65 (0.64–0.66) | 0.66 (0.65–0.67) | 0.66 (0.65–0.67) |
| Deaths | 123,249 (104,874–140,205) | 3.32 (2.78–3.82) | 60,666 (51,157–68,834) | 2.93 (2.47–3.34) | 62,584 (52,112–73,492) | 3.93 (3.17–4.74) | 307,990 (259,417–357,326) | 3.81 (3.2–4.41) | 159,480 (131,659–185,890) | 3.48 (2.91–4.04) | 148,510 (124,115–174,016) | 4.29 (3.6–5) | 0.59 (0.5–0.69) | 0.7 (0.6–0.81) | 0.41 (0.33–0.48) |
| DALYs | 6,293,473 (5,433,783–7,066,172) | 141.53 (122.79–160.33) | 3,112,792 (2,699,263–3,559,928) | 134.66 (116.65–153.58) | 3,180,681 (2,619,213–3,612,428) | 150.85 (126.07–171.29) | 11,488,636 (10,007,838–13,046,210) | 140.45 (122.56–159.28) | 5,938,086 (5,122,641–6,815,624) | 136.24 (117.73–155.85) | 5,550,550 (4,837,739–6,316,302) | 146 (127.54–166.15) | 0.03 (−0.01 to 0.07) | 0.09 (0.05–0.13) | −0.05 (−0.09 to −0.01) |
Disease burden of CKD and its subtypes by gender, and comparative analysis between 1990 and 2021.
CI, confidence interval; CKD, chronic kidney disease; DALYs, disability-adjusted life years; EAPC, estimated annual percentage change; SDI, socio-demographic index; T1DM, type 1 diabetes mellitus; T2DM, type 2 diabetes mellitus; UI, uncertainty interval.
Table 6
| Location measure | CKD | T1DM | T2DM | Glomerulonephritis | Hypertension | Other | ||||||
|---|---|---|---|---|---|---|---|---|---|---|---|---|
| AAPC (95%CI) | p-value | AAPC (95%CI) | p-value | AAPC (95%CI) | p-value | AAPC (95%CI) | p-value | AAPC (95%CI) | p-value | AAPC (95%CI) | p-value | |
| Prevalence | ||||||||||||
| Global | −0.021 (−0.039 to −0.002) | 0.030 | 0.956 (0.847–1.065) | <0.001 | −0.169 (−0.197 to −0.14) | <0.001 | 0.041 (0.027–0.054) | <0.001 | −0.213 (−0.244 to −0.181) | <0.001 | 0.007 (−0.016 to 0.031) | 0.538 |
| Africa | 0.032 (0.027–0.037) | <0.001 | 0.47 (0.367–0.574) | <0.001 | −0.101 (−0.112 to −0.089) | <0.001 | −0.004 (−0.019 to 0.01) | 0.566 | −0.102 (−0.107 to −0.097) | <0.001 | 0.062 (0.05–0.073) | <0.001 |
| America | 0.045 (0.009–0.081) | 0.015 | 0.432 (0.378–0.487) | <0.001 | 0.005 (−0.047 to 0.058) | 0.844 | 0.17 (0.126–0.214) | <0.001 | 0.109 (0.076–0.142) | <0.001 | 0.037 (0.008–0.066) | 0.012 |
| Asia | −0.105 (−0.125 to −0.085) | <0.001 | 1.129 (1.032–1.226) | <0.001 | −0.273 (−0.33 to −0.216) | <0.001 | 0.023 (0.006–0.04) | 0.009 | −0.4 (−0.487 to −0.314) | <0.001 | −0.068 (−0.088 to −0.047) | <0.001 |
| Europe | −0.073 (−0.08 to −0.066) | <0.001 | 1.833 (1.779–1.888) | <0.001 | −0.303 (−0.32 to −0.286) | <0.001 | −0.163 (−0.18 to −0.146) | <0.001 | −0.165 (−0.181 to −0.149) | <0.001 | −0.056 (−0.062 to −0.05) | <0.001 |
| Oceania | 0.087 (0.077–0.096) | <0.001 | 0.137 (0.073–0.202) | <0.001 | −0.143 (−0.158 to −0.127) | <0.001 | 0.161 (0.151–0.171) | <0.001 | 0.012 (−0.006 to 0.03) | 0.200 | 0.141 (0.129–0.153) | <0.001 |
| Incidence | ||||||||||||
| Global | 0.634 (0.621–0.646) | <0.001 | 0.59 (0.537–0.643) | <0.001 | 0.617 (0.598–0.637) | <0.001 | 0.394 (0.361–0.427) | <0.001 | 0.654 (0.638–0.669) | <0.001 | 0.641 (0.628–0.654) | <0.001 |
| Africa | 1.262 (1.2–1.324) | <0.001 | 0.532 (0.495–0.569) | <0.001 | 1.331 (1.284–1.377) | <0.001 | 0.625 (0.583–0.667) | <0.001 | 1.325 (1.262–1.388) | <0.001 | 1.285 (1.185–1.385) | <0.001 |
| America | 0.619 (0.604–0.633) | <0.001 | 0.625 (0.566–0.683) | <0.001 | 0.619 (0.607–0.631) | <0.001 | 0.665 (0.653–0.678) | <0.001 | 0.588 (0.578–0.598) | <0.001 | 0.62 (0.607–0.634) | <0.001 |
| Asia | 0.607 (0.59–0.625) | <0.001 | 0.453 (0.37–0.536) | <0.001 | 0.517 (0.495–0.539) | <0.001 | 0.25 (0.178–0.322) | <0.001 | 0.683 (0.663–0.702) | <0.001 | 0.625 (0.602–0.647) | <0.001 |
| Europe | 0.847 (0.832–0.862) | <0.001 | 1.052 (0.951–1.154) | <0.001 | 0.885 (0.866–0.905) | <0.001 | 0.219 (0.197–0.241) | <0.001 | 0.882 (0.846–0.918) | <0.001 | 0.852 (0.839–0.866) | <0.001 |
| Oceania | 0.788 (0.757–0.819) | <0.001 | 0.3 (0.263–0.338) | <0.001 | 0.8 (0.743–0.857) | <0.001 | 0.427 (0.377–0.477) | <0.001 | 0.889 (0.862–0.916) | <0.001 | 0.8 (0.771–0.829) | <0.001 |
| Death | ||||||||||||
| Global | 0.745 (0.603–0.886) | <0.001 | 0.026 (−0.087 to 0.138) | 0.655 | 1.069 (0.928–1.209) | <0.001 | 0.499 (0.412–0.587) | <0.001 | 0.868 (0.779–0.957) | <0.001 | 0.468 (0.344–0.593) | <0.001 |
| Africa | 0.513 (0.46–0.566) | <0.001 | −0.317 (−0.378 to −0.256) | <0.001 | 0.538 (0.497–0.579) | <0.001 | 0.145 (0.071–0.219) | <0.001 | 0.623 (0.567–0.678) | <0.001 | 0.777 (0.726–0.829) | <0.001 |
| America | 1.835 (1.663–2.008) | <0.001 | 1.713 (1.478–1.948) | <0.001 | 2.583 (2.441–2.725) | <0.001 | 1.534 (1.223–1.847) | <0.001 | 1.844 (1.677–2.011) | <0.001 | 0.849 (0.537–1.162) | <0.001 |
| Asia | 0.07 (−0.051–0.191) | 0.259 | −0.495 (−0.567 to −0.423) | <0.001 | 0.172 (0.009–0.335) | 0.039 | −0.009 (−0.155 to 0.138) | 0.908 | 0.108 (−0.034 to 0.251) | 0.137 | 0.048 (−0.078 to 0.175) | 0.456 |
| Europe | 0.87 (0.54–1.201) | <0.001 | −0.178 (−0.727 to 0.374) | 0.526 | 1.238 (0.968–1.509) | <0.001 | 0.344 (−0.023 to 0.714) | 0.067 | 1.217 (0.786–1.651) | <0.001 | 0.858 (0.604–1.114) | <0.001 |
| Oceania | 0.715 (0.57–0.86) | <0.001 | 0.664 (0.587–0.742) | <0.001 | 0.77 (0.64–0.9) | <0.001 | 0.717 (0.628–0.806) | <0.001 | 0.585 (0.447–0.723) | <0.001 | 0.724 (0.588–0.86) | <0.001 |
| DALYs | ||||||||||||
| Global | 0.322 (0.262–0.383) | <0.001 | −0.119 (−0.209 to −0.03) | 0.009 | 0.696 (0.595–0.797) | <0.001 | 0.271 (0.171–0.37) | <0.001 | 0.583 (0.481–0.684) | <0.001 | −0.016 (−0.088 to 0.056) | 0.655 |
| Africa | 0.198 (0.152–0.244) | <0.001 | −0.345 (−0.383 to −0.308) | <0.001 | 0.282 (0.247–0.317) | <0.001 | −0.064 (−0.112 to −0.016) | 0.009 | 0.434 (0.327–0.542) | <0.001 | 0.246 (0.172–0.319) | <0.001 |
| America | 1.333 (1.089–1.577) | <0.001 | 1.421 (1.209–1.633) | <0.001 | 2.053 (1.847–2.259) | <0.001 | 1.091 (0.815–1.367) | <0.001 | 1.572 (1.394–1.75) | <0.001 | 0.431 (0.233–0.63) | <0.001 |
| Asia | −0.19 (−0.272 to −0.108) | <0.001 | −0.573 (−0.646 to −0.5) | <0.001 | 0.006 (−0.091 to 0.103) | 0.899 | −0.231 (−0.308 to −0.155) | <0.001 | 0.008 (−0.063 to 0.079) | 0.833 | −0.372 (−0.462 to −0.283) | <0.001 |
| Europe | 0.025 (−0.193 to 0.244) | 0.820 | −0.1 (−0.528 to 0.33) | 0.648 | 0.502 (0.309–0.696) | <0.001 | −0.466 (−0.756 to −0.175) | 0.002 | 0.504 (0.262–0.747) | <0.001 | −0.091 (−0.213 to 0.031) | 0.145 |
| Oceania | 0.623 (0.541–0.706) | <0.001 | 0.612 (0.523–0.701) | <0.001 | 0.695 (0.562–0.828) | <0.001 | 0.562 (0.489–0.636) | <0.001 | 0.458 (0.355–0.562) | <0.001 | 0.385 (0.242–0.528) | <0.001 |
Global average annual percentage changes in the burden of CKD and its subtypes.
AAPC, average annual percentage change; CI, confidence interval; CKD, chronic kidney disease; DALYs, disability-adjusted life years; T1DM, type 1 diabetes mellitus; T2DM, type 2 diabetes mellitus; UI, uncertainty interval.
Regional level
In 2021, the ASPR of CKD was highest in Central Asia at 10,698.24 per 100,000 population (95% UI: 10,022.94–11,348.1), followed by Southeast Asia at 10,474.65 per 100,000 population (95% UI: 9,718.92–11,301.72). Concurrently, the highest ASPR on a global SDI level was found in low-middle SDI regions at 9,171.03 per 100,000 population (95% UI: 8,543.99–9,848.15). In contrast, regions with a high SDI exhibited the lowest ASPR at 6,733.55 per 100,000 population (95% UI: 6,322.09–7,159.65), with Western Europe at 5,226.19 per 100,000 population (95% UI: 4,924.43–5,544.2) and Australasia at 5,910.04 per 100,000 population (95% UI: 5,548.15–6,301.57) (Table 1; Figure 2A).
Figure 2

Global distribution of the burden of chronic kidney disease in 2021. (A) Age standardized prevalence rate (per 100,000 population), both sexes; (B) Age standardized incidence rate (per 100,000 population), both sexes; (C) Age standardized mortality rate (per 100,000 population), both sexes; (D) Age standardized disability-adjusted life rate (per 100,000 population), both sexes.
A comparison of the ASPR variations across different global regions over the period from 1990 to 2021 revealed distinct trends over the 30-year period. Geographically, the highest income North America exhibited the most significant increase, with an EAPC of 0.17 per 100,000 population (95% CI: 0.12–0.22). This trend was followed by Southern Latin America, which had an EAPC of 0.16 per 100,000 population (95% CI: 0.14–0.18), and Andean Latin America, with an EAPC of 0.14 per 100,000 population (95% CI: 0.12–0.16). In contrast, the most significant decrease was observed in high-income Asia Pacific, with an EAPC of −0.28 per 100,000 population (95% CI: −0.32 to −0.24). This was followed by East Asia, with an EAPC of −0.19 per 100,000 population (95% CI: −0.32 to −0.05), and South Asia, with an EAPC of −0.19 per 100,000 population (95% UI: −0.25 to −0.14). On a global SDI level, Middle SDI regions showed a slight increase with an EAPC of 0.01 per 100,000 population (95% CI: −0.03 to 0.05), which was not statistically significant. Conversely, regions with a high SDI had an EAPC of −0.03 per 100,000 population (95% CI: −0.07 to 0.01). Regions with a high-middle SDI had an EAPC of −0.09 per 100,000 population (95% CI: −0.14 to −0.04). Regions with a low-middle SDI had an EAPC of −0.07 per 100,000 population (95% CI: −0.1 to −0.05). SDI regions exhibited an EAPC of −0.07 per 100,000 population (95% CI: −0.1 to −0.05), while low SDI regions demonstrated an EAPC of −0.07 per 100,000 population (95% CI: −0.09 to −0.05), indicating a declining trend (Table 1).
Analysis of the 30-year prevalence trends across various continents revealed diverse patterns In Africa and America, the AAPCs were above zero, indicating an increasing prevalence of CKD. Conversely, in Asia, Europe, and Oceania, the AAPCs were below zero, indicating a general decline in CKD prevalence (Table 6).
In 2021, the ASIR of CKD exhibited an upward trajectory across diverse geographical regions and SDI areas, as illustrated in Table 2. Globally, Central Latin America exhibited the highest ASIR at 411.41 per 100,000 population (95% UI: 390.17–431.32), closely followed by North Africa and the Middle East at 411.19 per 100,000 population (95% UI: 385.4–438.45) (Figure 2B). From 1990 to 2021, the most significant increase in ASIR occurred in Andean Latin America, with an EAPC of 2.27 per 100,000 population (95% CI: 2.17–2.38). Consequently, among the various SDI regions, high SDI regions exhibited the highest ASIR in 2021, at 277.75 per 100,000 population (95% UI: 260.7–295.01), whereas Middle SDI regions demonstrated the most pronounced increase in ASIR from 1990 to 2021, with an EAPC of 1.06 per 100,000 population (95% CI: 1.04–1.08) (Table 2). Concurrently, the overall incidence trends across continents demonstrated consistent AAPCs exceeding zero (Table 6).
In 2021, the ASMR of CKD was highest in Central Sub-Saharan Africa at 43.69 per 100,000 population (95% UI: 33.26–56.29), followed by Central Latin America at 42.35 per 100,000 population (95% UI: 38.32–47.03), and Eastern Sub-Saharan Africa at 40.09 per 100,000 population (95% UI: 35.57–46.03) (Figure 2C). Similarly, the ASMR was highest in low SDI regions, at 29.43 per 100,000 population (95% UI: 26.13–33.79), followed by low-middle SDI regions, at 23.08 per 100,000 population (95% UI: 20.97–26.31). Conversely, Eastern Europe exhibited the lowest ASMR at 5.22 per 100,000 population (95% UI: 4.73–5.82). The ASMR was lower in both the High-middle SDI and High SDI regions, at 12.02 per 100,000 population (95% UI: 10.68–13.38) and 14.11 per 100,000 population (95% UI: 12.3–15.21), respectively (Table 3). It is noteworthy that, between 1990 and 2021, the High-income North America region exhibited the most pronounced increase in ASMR, with an EAPC of 3.4 per 100,000 population (95% CI: 3.2–3.6). In contrast, East Asia displayed the most notable decrease, with an EAPC of −0.84 per 100,000 population (95% CI: −0.92 to −0.76). Conversely, regions with a high SDI exhibited a significant increase in ASMR, with an EAPC of 1.73 per 100,000 population (95% CI: 1.61–1.86). In contrast, regions with a low SDI were the only SDI area to show a decrease, with an EAPC of −0.08 per 100,000 population (95% CI: −0.2 to 0.03) (Table 3). Furthermore, the overall mortality trends across continents demonstrated an increase with AAPCs greater than 0. Nevertheless, this uptrend was not statistically significant in Asia (AAPC = 7, 95% CI: −5.1 to 19.1%, p = 0.259) (Table 6).
The ASDR of CKD in 2021 was highest in Central Latin America, with a rate of 1,171.14 per 100,000 population (95% UI: 1,054.82–1,316.26). This was followed by Central Sub-Saharan Africa, with a rate of 1,124.7 per 100,000 population (95% UI: 899.03–1,436.09) (Table 4; Figure 2D). It is noteworthy that the two regions exhibited markedly disparate trends in change, with EAPCs of 1.75 per 100,000 population (95% CI: 1.32–2.18) and −0.19 per 100,000 population (95% CI: −0.26 to −0.12), respectively. The ASDR trends across regions categorized by SDI revealed patterns correlated with geographical patterns. Low SDI regions recorded the highest rates in 2021 at 791.8 per 100,000 population (95% UI: 704.14–909.1), with a declining EAPC of −0.34 per 100,000 population (95% CI: −0.42 to −0.25). By contrast, the High-middle SDI regions exhibited the lowest rate, at 324.64 per 100,000 population (95% CI: 293.58–360.92), with a similar downward EAPC trend of −0.35 per 100,000 population (95% CI: −0.42 to −0.28). In contrast, the other three SDI regions demonstrated increasing trends in ASDR (Table 4). Conversely, the overall DALYs trend in Asia diverged from the global and other continental trends, exhibiting an AAPC less than zero, indicative of a reduction in the burden of CKD-related health over the past three decades. This contrasts with global and other continental trends, suggesting that significant progress has been made in managing and treating CKD in the Asia region, with a reduction in associated health burdens (Table 6).
Heterogeneity of CKD types
This study outlines the proportions of CKD and its subtypes caused by specific etiologies from a global perspective before delving into regional trends from 1990 to 2021.
This analysis primarily focuses on ASPR as the central metric, with additional indicators such as ASIR, ASMR, and ASMR included to provide supplementary insights into the global and regional CKD burden.
Globally, based on the ASPR, it is evident that over 70% of CKD cases in 1990 and 2021 were due to unspecified causes, followed by CKD induced by T2DM, CKD due to hypertension, CKD related to glomerulonephritis, and CKD caused by T1DM (Figure 3A). Among them, CKD stemming from unspecified causes remained the most dominant subtype, with an incidence rate of 6,247.94 per 100,000 (95% UI: 5,823.88–6,691.38) in 2021. CKD caused by T2DM was the second most prevalent subtype, with an incidence rate of 1,259.63 per 100,000 (95% UI: 1,161.99–1,359.92) in 2021. These two subtypes collectively account for the majority of new incidence rates in 2021 (Table 5; Figure 3A). Over time, the proportions of the different subtypes of CKD have remained relatively stable globally, although significant regional variations have occurred (Figure 3).
Figure 3

Contribution of T1DM, T2DM, glomerulonephritis, hypertension, and other causes to the disease burden of CKD, both sexes, globally and by region, in 1990 and 2021. (A) Contribution to prevalence cases of CKD; (B) Contribution to incidence cases of CKD; (C) Contribution to mortality cases of CKD; (D) Contribution to DALYs cases of CKD. CKD, chronic kidney disease; DALYs, disability-adjusted life years; T1DM, type 1 diabetes mellitus; T2DM, type 2 diabetes mellitus.
Regionally, there are notable differences in CKD subtype trends. For instance, in Australasia, the proportion of CKD caused by T2DM decreased from 13.8% in 1990 to 13.4% in 2021, while CKD caused by T1DM increased from 1.5 to 2% during the same period. In low-middle SDI regions, the proportion of CKD caused by other factors increased from 77.5 to 78.5%, while the proportion of CKD caused by T2DM decreased from 16.9 to 15.8% (Figure 3A).
A long-term trend analysis of global CKD subtypes indicates that the rising incidence rates are primarily driven by increased detection of CKD due to glomerulonephritis (EAPC = 0.39 per 100,000, 95% CI: 0.36–0.43) and CKD from unspecified causes (EAPC = 0.04 per 100,000, 95% CI: 0.01–0.07) (Table 5; Figures 4A,E). Consequently, the incidence of CKD subtypes exhibiting rising trends includes that of CKD caused by T1DM (AAPC = 95.6, 95% CI: 84.7–106.5%, p < 0.001), CKD caused by glomerulonephritis (AAPC = 4.1, 95% CI: 2.7–5.4%, p < 0.001), and CKD caused by other factors (AAPC = 0.7, 95% CI: −1.6 to 3.1%, p = 0.538) (Table 6). This may be indicative of heightened difficulties in the global management of diabetes and enhanced diagnostic capabilities for glomerulonephritis during this period.
Figure 4

Heat map and development trends for the five subtypes disease indicators of CKD from 1990 to 2021. (A) The prevalence of five subtypes of CKD; (B) The incidence of five subtypes of CKD; (C) The mortality of five subtypes of CKD; (D) The DALYs of five subtypes of CKD; (E) Changes in the prevalence of five subtypes of CKD; (F) Changes in the incidence of five subtypes of CKD; (G) Changes in the mortality of five subtypes of CKD; (H) Changes in the DALYs of five subtypes of CKD. CKD, chronic kidney disease; DALYs, disability-adjusted life years; T1DM, type 1 diabetes mellitus; T2DM, type 2 diabetes mellitus.
Similarly, on a global scale, the top three CKD types with the highest ASIR in 2021 are CKD caused by unspecified factors (189.36 per 100,000), glomerulonephritis (129.94 per 100,000), and T1DM (77.31 per 100,000), as shown in Table 5. Figure 3B further illustrates the contribution of various causes to the CKD incidence rate burden. The significant increase in CKD incidence is primarily attributed to improved detection rates, particularly in cases linked to hypertension, unspecified causes, and T2DM, with respective rates of 0.66 per 100,000, 0.65 per 100,000, and 0.61 per 100,000 (Table 5; Figures 4B,F). Additionally, global long-term trend analysis shows significant increases in CKD cases caused by hypertension (AAPC = 65.4, 95% CI: 63.8–66.9%, p < 0.001), unspecified causes (AAPC = 64.1, 95% CI: 62.8–65.4%, p < 0.001), and T2DM (AAPC = 61.7, 95% CI: 59.8–63.7%, p < 0.001) (Table 6), underscoring that hypertension, unspecified causes, and T2DM are the primary factors driving the rise in CKD incidence rates.
Furthermore, based on the ASMR, it can be observed globally that by 2021, the proportion of CKD caused by T2DM has increased from 26.8 to 31.2%, while CKD caused by hypertension has increased from 27 to 29.7%. In contrast, other CKD subtypes have shown decreases (Figure 3C). In regions such as East Asia, High-income North America, and Southeast Asia, the combined proportion of CKD caused by T2DM and hypertension has escalated to as much as 80% (Figure 3C). These two types of CKD are the most prevalent contributors to mortality rates, with CKD caused by T2DM having a rate of 5.72 per 100,000 (95% UI: 4.83–6.79) and CKD caused by hypertension with a rate of 5.54 per 100,000 (95% UI: 4.68–6.41) (Table 5; Figure 4C). Additionally, significant changes in mortality trends for different CKD subtypes from 1990 to 2021 are highlighted in Figures 4C,G. A long-term global mortality trend analysis reveals a particularly significant increase in mortality rates associated with CKD caused by T2DM (AAPC = 106.9, 95% CI = 92.8–120.9%, p < 0.001), positioning it as one of the primary driving factors for the increasing global mortality related to CKD (Table 6).
Furthermore, based on ASDR, it was observed globally in 2021 that CKD caused by T2DM and hypertension each accounted for approximately one-fourth of the total CKD cases, comparable to CKD caused by other factors (Figure 3D). The rise in DALY rates is primarily due to enhanced detection of CKD caused by T2DM and hypertension, with respective rates of 0.8 per 100,000 and 0.62 per 100,000 (Figure 4D). Notably, from 1990 to 2021, only CKD caused by T1DM showed a significant decline in ASDR, with an EAPC of −0.21 per 100,000 (Table 5; Figures 4D,H). The global analysis reveals that while DALY rates for CKD and other subtypes have increased, T1DM and other causes have seen declines. The observed decrease in CKD incidence among individuals with T1DM suggests improvements in its management and treatment, warranting further research to identify strategies for enhancing prevention, treatment, and management across CKD types to reduce health burdens and disabilities.
Gender and age structure and temporal trends
For both sexes and all age groups overall, from 1990 to 2021, the ASPR of CKD demonstrated a general decline, while the ASIR, ASMR, and ASDR exhibited a general upward trend (Figure 5). It is notable that the ASPR initially followed a downward trend, with a slight increase around 2010 before decreasing again (Figure 5A). In contrast, ASIR showed a steady and continuous increase (Figure 5B). ASMR initially exhibited fluctuating increases, followed by a significant decline and rebound observed from 2017 to 2021, resulting in a noticeable fluctuating increase (Figure 5C). Similarly, ASDR rates exhibited a fluctuating upward trend (Figure 5D).
Figure 5
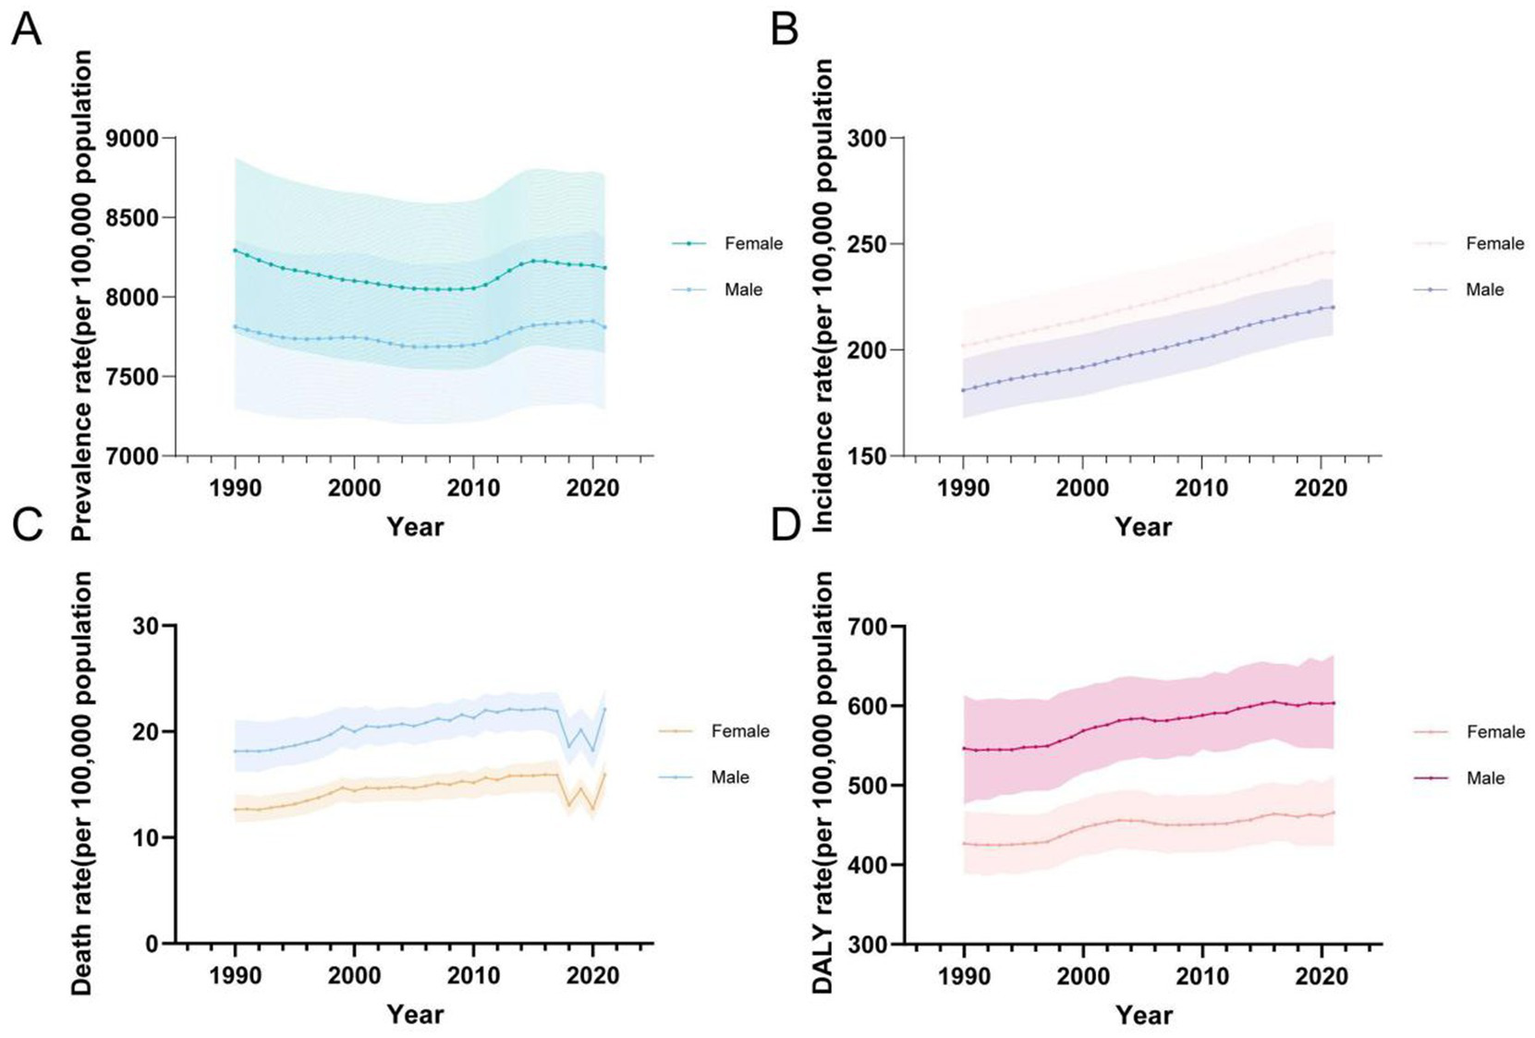
Global temporal trends in CKD disease burden, 1990–2021. (A) ASPR in different sexes; (B) ASIR in different sexes; (C) ASMR in different sexes; (D) ASDR in different sexes. CKD, chronic kidney disease; DALY, disability-adjusted life year; ASPR, Age standardized prevalence rate; ASIR, Age standardized incidence rate; ASMR, Age standardized mobility rate; ASDR, Age standardized DALYS rate.
In terms of gender, it is noteworthy that, between 1990 and 2021, females consistently had higher ASPR and ASIR rates compared to males, whereas males exhibited higher ASMR and ASDR rates (Table 5; Figure 5).
Regarding ASPR, females had a higher rate of 8,182.65 per 100,000 (95% UI: 7,653.14–8,764.76), compared to males at 7,808.96 per 100,000 (95% UI: 7,288.71–8,366.6) (Table 1). Prevalence rates were generally higher in females across most age groups, except for the 10–24 and 90+ age groups, where males showed higher rates (Figures 5A, 6A). The greatest disparity in prevalence rates between the sexes was observed in the 15–19 age group, while the smallest difference was seen in the 20–24 age group.
Figure 6

Sex and age-structured analysis of CKD disease burden in 2021. (A) Prevalence rates; (B) Incidence rates; (C) Mortality rates; (D) DALYs rates. CKD, chronic kidney disease; DALYs, disability-adjusted life years.
A similar pattern was observed for ASIR, with females at 246.03 per 100,000 (95% UI: 231.84–260.67), compared to males at 220.11 per 100,000 (95% UI: 207.07–233.07) (Table 2). No significant gender difference was observed across age groups for ASIR (Figure 6B).
In terms of ASMR, males had consistently higher mortality rates (21.91 per 100,000, 95% UI: 19.66–23.60) than females (16.9 per 100,000, 95% UI: 14.22–17.27) (Table 3). The largest gender difference in mortality rates was observed in the 5–9 age group, while the smallest difference occurred in the 10–14 age group (Figure 6C).
Finally, ASDR rates were higher in males (603.4 per 100,000, 95% UI: 546.08–663.35) compared to females (465.69 per 100,000, 95% UI: 424.02–511.12) (Table 4). The DALY trend mirrored that of mortality, with males consistently exhibiting higher rates across age groups. The greatest disparity in DALYs between the sexes was seen in the 5–9 age group, while the smallest difference was in the 10–14 age group (Figure 6D).
Reflecting on age groupings, in 2021, all CKD burden indicators showed an increase with age, with sharp rises observed beyond 65 years old. The group aged 95 and older had the highest rates for prevalence, mortality, and DALYs, while the 80–84 age group reported the highest incidence rates (Figure 6).
Temporal joinpoint analysis
The results of the joinpoint regression analysis indicate that the ASPR of CKD globally exhibited a downward trend over the period from 1990 to 2021. However, an upward trend was observed during the period from 2010 to 2015 (APC = 40.3, 95% CI: 34.7–45.9%, p < 0.001) (Table 6; Figure 7A). In contrast, the ASIR demonstrated a significant and steady increase globally over the 30-years period, with the most notable increase observed between 2010 and 2019 (APC = 70.6, 95% CI: 69.1–72%, p < 0.001) (Table 6; Figure 7B).
Figure 7

Joinpoint regression analysis of the CKD disease burden temporal trends, 1990–2021. (A) ASPR; (B) ASIR; (C) ASMR; (D) ASDR. CKD, chronic kidney disease; DALYs, disability-adjusted life years; ASPR, Age standardized prevalence rate; ASIR, Age standardized incidence rate; ASMR, Age standardized mobility rate; ASDR, Age standardized DALYS rate.
Similarly, the ASMR demonstrated a significant global increase over the 30-year period, with a notably steep rise during 1997–2000 (APC = 226.9, 95% CI: 128–326.7%, p < 0.001). However, a slight decrease was observed from 2003 to 2007, which was not statistically significant (APC = −0.5, 95% CI: −45.3 to 44.5%, p = 0.982) (Table 6; Figure 7C). The trends in ASDR mirrored those of ASMR, showing a similar upward trend over 30 years, with a substantial increase during 1996–2003 (APC = 98.2, 95% CI: 85.6–110.7%, p < 0.001). However, a slight non-significant decrease was observed from 2003 to 2008 (APC = −18.4, 95% CI: −41 to 4.3%, p = 0.106) (Table 6; Figure 7D).
In different regions, the overall trends of CKD burden indicators are generally aligned with global patterns. However, some regions exhibit phenomena that are in opposition to these global trends. For example, between 1990 and 2021, the ASPR increased in Africa (AAPC = 3.2, 95% CI: 2.7–3.7%, p < 0.001), America (AAPC = 4.5, 95% CI: 0.9–8.1%, p = 0.015), and Oceania (AAPC = 8.7, 95% CI: 7.7–9.6%, p < 0.001), contrasting with the global trend. Similarly, the ASDR exhibited a decline in Asia (AAPC = −19, 95% CI: −27.2% to −10.8%, p < 0.001), which contrasts with the global increase (Table 6).
As expected, there are discrepancies in the prevalence of CKD indicators across regions over the same temporal period. For example, with regard to ASPR, there was a decrease in Asia (APC = −26, 95% CI: −31.3% to −20.7%, p < 0.001) from 1994 to 2000, while America experienced an increase (APC = 22.3, 95% CI: 14.6–30%, p < 0.001) during the same period (Supplementary Figure 1).
From 1990 to 2021, a comparison of five different subtypes of CKD worldwide revealed significant differences in disease burden indicators in terms of prevalence and DALYs compared to the overall CKD population. For instance, the global AAPC in the prevalence of CKD caused by T1DM (AAPC = 95.6, 95% CI: 84.7–106.5%, p < 0.001), CKD caused by glomerulonephritis (AAPC = 4.1, 95% CI: 2.7–5.4%, p < 0.001), and CKD caused by other (AAPC = 0.7, 95% CI: −1.6 to 3.1%, p = 0.538) showed an upward trend, which contrasts with the overall decline in CKD prevalence. Similarly, the global AAPC in DALYs for CKD caused by T1DM (AAPC = −11.9, 95% CI: −20.9% to −3%, p = 0.009) and CKD caused by other (AAPC = −1.6, 95% CI: −8.8 to 5.6%, p = 0.655) showed a decrease, whereas the overall CKD DALYs increased (Table 6).
Nevertheless, other indicators, such as incidence and mortality rates, did not show significant global changes, particularly between subtypes, where differences were not pronounced. Therefore, the research perspective shifts from a global to a regional analysis, with a particular focus on incidence and mortality rates.
The study reveals notable regional differences in the prevalence of CKD subtypes compared to global trends. For instance, in Europe, the incidence of CKD caused by glomerulonephritis is significantly lower than that of other causes, which are closer to global levels (Supplementary Figure 2). This suggests that regional factors, such as healthcare access, diagnostic capabilities, and genetic predispositions, may play a significant role in shaping the prevalence of CKD subtypes in Europe, contrasting with global trends. Regarding mortality rates, while all CKD subtypes showed an increasing trend globally, in both Africa and Europe, CKD caused by T1DM demonstrated a decreasing trend, which is in contrast to the rising mortality trends observed in the other subtypes (Supplementary Figures 3, 4). This divergence is an interesting phenomenon, highlighting the distinct mortality trends of T1DM-induced CKD compared to other subtypes. It may reflect regional differences in healthcare interventions or lifestyle factors that specifically influence T1DM-related CKD mortality.
Additionally, the study further conducted a year-by-year analysis over the past 30 years and found that, despite an overall trend across the three decades, specific years within this period showed deviations from the general trend. This suggests that factors such as healthcare advancements, changes in medical policies, improvements in diagnostic capabilities, and even socio-economic conditions may have influenced the trends on a more localized or short-term scale. For instance, differences in the annual percentage change in ASPR for CKD caused by T1DM during 2015–2021 revealed contrasting trends across regions: Europe saw a dramatic increase (APC = 146, 95% CI: 139.1–153%, p < 0.001), while America experienced a significant decrease (APC = −46.3, 95% CI: −55.4% to −37.3%, p < 0.001) (Supplementary Figure 5). These regional variations highlight how healthcare factors and public health interventions can lead to different trends in CKD prevalence and mortality across different parts of the world, even when the overall global trend suggests a more consistent pattern. Such anomalies underscore the need to consider both long-term global trends and regional-specific factors when analyzing disease burdens.
Discussion
CKD is a significant global public health concern (11, 12), with increasing incidence rates and mortality, as well as a contributory factor in the development of systemic diseases such as ocular (13), neurological (14), and cardiovascular diseases (15–17). Despite substantial research on CKD (18–20), comprehensive literature analyses covering the global burden, including prevalence, incidence, mortality, and DALYs for CKD and its subtypes, are lacking. Most previous studies have focused on specific age groups, subtypes, or countries (2, 9, 21). This study aims to fill this gap by providing a broad, up-to-date analysis spanning 32 years, covering 204 countries and territories across all age groups, sexes, and SDI levels. The findings underscore the importance of continued global efforts in managing CKD and its subtypes, highlighting the need for updated data to inform policymaking and effective interventions.
Global trends in CKD epidemiology
In 2021, global CKD incidence reached 11,128,691 cases, with prevalence at 358,777,424 cases. Mortality attributed to CKD was 1,527,639 deaths, and DALYs totaled 44,453,684. Compared to 1990, these figures represent significant increases. However, due to the considerable uncertainty surrounding these figures, caution is warranted in interpreting them. Joinpoint regression analysis reveals that while overall prevalence has decreased slightly, incidence, mortality, and DALYs rates continue to rise, reflecting increasing CKD burden. Despite this, the decrease in prevalence over time may reflect improvements in healthcare, preventive measures, and treatment options globally, which have led to more effective management, even as the overall disease burden escalates.
Population dynamics and key drivers of the global CKD burden
The global burden of CKD is driven by more than just population growth; various demographic and epidemiological factors also play a crucial role. A 47% increase in global population, according to the 2022 Revision of World Population Prospects, contributes significantly to the rise in CKD cases, despite stable prevalence and incidence rates. Changes in disease incidence, survival rates, and life expectancy also influence CKD prevalence, with mortality and DALY rates closely tied to these factors (22).
The increase in CKD prevalence is particularly marked in middle SDI regions, which are more vulnerable to CKD’s impact (22). This trend is driven by demographic factors such as population growth, migration, and birth rates. Previous studies highlight the role of treatment modalities (23), dietary habits (24), nutritional management (25), healthcare access (26), and lifestyle behaviors (27) in shaping CKD burdens. These findings underscore the importance of equitable resource distribution to mitigate CKD’s impact, especially in lower-income countries. Additionally, joinpoint regression analysis highlights geographical disparities in CKD trends, suggesting the need for region-specific public health interventions.
However, the rising CKD prevalence is not solely attributable to population growth. Aging populations, urbanization, and the increasing prevalence of risk factors such as diabetes and hypertension also contribute significantly. These demographic shifts, along with environmental and lifestyle factors and advances in healthcare, improve CKD detection. While population growth is responsible for the increase in absolute CKD numbers, further research is needed to better understand the roles of aging, chronic diseases, and other factors in shaping the global CKD burden.
Major CKD risk factors and public health challenges
The growing global burden of CKD is exacerbated by major risk factors such as diabetes, hypertension, and glomerulonephritis (28, 29). The rapid rise in diabetes cases, as indicated by the 2022 International Diabetes Federation Diabetes Atlas,3 contributes significantly to CKD, with projections suggesting 783 million diabetes patients by 2045 (30). Both Type 1 and Type 2 diabetes are crucial contributors to CKD, with diabetes-related complications requiring continuous management, adding to the strain on healthcare systems (31, 32). The prevalence and incidence of CKD caused by T1DM have notably increased over the past three decades, underscoring its emerging significance as a public health issue. Early detection and intervention are essential for preventing CKD in T1DM patients (2, 22). On the other hand, T2DM remains a major CKD risk factor (33, 34), with substantial global research investigating the T2DM-CKD relationship (35–39).
Hypertension, another well-established CKD risk factor, is linked to CKD progression, though the role of primary hypertension in end-stage renal disease (ESRD) remains under debate (40). Elevated blood pressure may point to underlying genetic factors or pathophysiological conditions, such as APOL1 nephropathy (41–43), vascular calcification (44), or reduced renal unit endowment (45), contributing to CKD and increasing its burden, especially in regions with limited healthcare resources (46, 47).
Although less common, glomerulonephritis is a lifelong cause of CKD (48), with a significant impact on patient quality of life (49). Studies have shown that the complex interaction of lncRNA and epigenetic modifications in glomerulonephritis complicates its management (50). Patients affected by CKD caused by glomerulonephritis experience severe impacts on emotional, social, physical, and economic aspects (51), and it is particularly prevalent in middle-to-low-income countries, contributing to global CKD disparities (52). Additionally, CKD cases from other undiagnosed causes present unique challenges due to the lack of standardized treatment protocols, highlighting the need for coordinated global healthcare policies to improve kidney disease care (53, 54).
Regional disparities and trends
CKD trends show significant variation across regions, influenced by factors such as SDI levels, healthcare access, and demographic transitions (55, 56). The Middle SDI region, for example, has seen a steady increase in CKD prevalence, driven by factors like aging populations, migration, dietary shifts, and economic development (57). This region, positioned between low and high SDI levels, faces unique challenges related to healthcare infrastructure and disease patterns, such as the shift from infectious to chronic diseases.
In contrast, high-middle and high SDI regions, while experiencing an aging population and rising chronic disease burden, benefit from better disease detection and healthcare systems. These improvements have led to more accurate CKD diagnosis and management, resulting in slower increases in CKD prevalence despite the growing number of cases. Some regions, like parts of Asia and Europe, have even seen a decline in CKD prevalence, reflecting the success of public health measures (58–60).
However, disparities persist within regions. In the Americas, socioeconomic factors, unequal healthcare coverage, and regional health challenges contribute to uneven CKD outcomes, particularly among disadvantaged populations (57–59). These variations underscore the need for region-specific CKD strategies that consider local economic, demographic, and healthcare conditions to improve global and regional health outcomes.
Age and gender disparities
Pediatric CKD, although sharing similarities with adult CKD, presents unique challenges due to its impact on children’s growth, development, and long-term health. Boys are generally more affected by CKD than girls, with higher mortality and DALY rates observed in male children (61) Globally, the incidence of CKD in children ranges from 15 to 74.7 cases per million, with the highest rates in middle- and low-income countries (62–64). Preventing and managing childhood CKD is crucial, as it affects not only renal health but also cardiovascular and metabolic functions (61, 65–67).
As individuals age, the burden of CKD increases. Middle-aged and elderly populations are at heightened risk due to the natural decline in kidney function and the cumulative impact of chronic diseases like hypertension and diabetes (68–74). For older adults, CKD not only impacts kidney health but also increases the risk of complications such as cardiovascular events, depression, and cognitive decline (22, 75–78),. Diagnosing CKD in this age group can be challenging, as they may not report symptoms as accurately as younger individuals, complicating early detection and management.
Gender-specific disparities in the burden of CKD exist not only in children but also in young adults and the elderly (79). Gender differences and stereotypes negatively impact various aspects of healthcare, leading to delays in diagnosis and treatment, decreased quality of care, and increased disease burden. Broadly speaking, these biases have a more severe impact on women than men, but any bias leads to health inequities and negatively affects everyone (80). Over three decades, ASPR and ASIR rates for CKD have consistently been higher in women than in men (81, 82). Studies suggest that as age increases, the natural decline in glomerular filtration rate due to extended life expectancy and potential overdiagnosis of CKD contribute to higher rates of CKD in women (83, 84). Women generally have a higher risk of incidence and prevalence of CKD over three decades, reflecting specific biological and social factors such as gender biases, hormone levels, reproductive history, and patterns of healthcare utilization (85). Additionally, studies indicate that women are less likely than men to recognize they have CKD (86, 87), factors that may increase the risk of CKD in women. A substantial body of research indicates that awareness of kidney disease is low not only in women but also in all populations (88). Therefore, there is an urgent need for carefully designed clinical trials to increase female representation, enhance knowledge of early detection of kidney disease, improve doctor-patient communication, update and use the CKD-EPI formula reasonably to ensure consistency and accuracy in global assessment of kidney function between genders (89), and prioritize gender and gender consideration factors in health decision-making (90). Conversely, ASMR and ASDR rates have consistently been higher in men than women (91, 92), possibly due to higher specific health risks such as cardiovascular disease and certain types of cancer, which are more common or severe in men. This is consistent with Vallianou et al.’s study, which found mutual risk factors between cardiovascular disease and chronic kidney disease include age, hypertension, diabetes, and male gender (93). Additionally, studies indicate that women have longer survival periods after kidney transplantation compared to men (79), which may also contribute to higher absolute cases of CKD-related deaths in men. In conclusion, these findings of gender disparities and stereotypes highlight the importance of considering gender factors in developing public health strategies and health interventions for CKD. Further research could explore biological and social differences between genders in CKD disease development and health outcomes to better tailor and optimize gender-specific healthcare measures.
Limitations
It should be noted, however, that the study is not without limitations. Firstly, the study utilized the GBD 2021 database, which provides estimated data derived from a combination of system dynamics and statistical models rather than real observational data. This limitation implies that the estimates of disease burden may not be precise and may not reflect the most current data available. Secondly, GBD data are aggregated at a global and national level, lacking detailed data from specific regions, urban and rural areas, as well as specific demographic groups such as age, ethnicity, and socioeconomic status. This limitation could potentially affect the comprehensiveness and depth of the analysis of CKD disease burden. Finally, the study broadened the scope to include all types of CKD, yet it did not differentiate the specific burdens of each subtype nor further distinguish CKD caused by other conditions.
Conclusion
In conclusion, this study employed data from the GBD 2021 to illustrate the global, regional, and national burden of CKD, analyzing trends from 1990 to 2021. The results indicate a slight decrease in the overall prevalence of CKD, but a further increase in the disease burden of the condition, which may be mainly caused by population growth and aging. The findings provide updated epidemiological information on CKD and emphasize the necessity for continual improvement in policies for diagnosing, treating, and managing CKD.
Statements
Data availability statement
The original contributions presented in the study are included in the article/Supplementary material, further inquiries can be directed to the corresponding authors.
Author contributions
JG: Conceptualization, Data curation, Formal analysis, Investigation, Methodology, Validation, Visualization, Writing – original draft, Writing – review & editing. ZhL: Formal analysis, Investigation, Validation, Visualization, Writing – review & editing. PW: Investigation, Validation, Writing – review & editing. HW: Investigation, Validation, Writing – review & editing. KF: Investigation, Validation, Writing – review & editing. JJ: Investigation, Validation, Writing – review & editing. LZ: Investigation, Validation, Writing – review & editing. ZeL: Investigation, Validation, Writing – review & editing. RX: Conceptualization, Funding acquisition, Methodology, Project administration, Supervision, Writing – review & editing. CL: Conceptualization, Funding acquisition, Methodology, Project administration, Supervision, Writing – review & editing.
Funding
The author(s) declare that financial support was received for the research, authorship, and/or publication of this article. This work was supported by the National Key R&D Program of China (2020YFA0908100); Natural Science Foundation of Xiamen, China (3502Z202374102); the Scientific Research Foundation of State Key Laboratory of Vaccines for Infectious Diseases, Xiang An Biomedicine Laboratory (2023XAKJ0102044); the National Natural Science Foundation of China (82471048, 82271045, 82070931); Science and Techonlogy Project of Fujian Province (2024D006); Guiding Project of Medical and Health of Xiamen, China (3502Z20244ZD1194); Guiding Project of Combination of Medicine and Engineering of Xiamen, China (3502Z20244ZD2041); Science and Techonlogy Project of Fujian Province (2024D006).
Conflict of interest
The authors declare that the research was conducted in the absence of any commercial or financial relationships that could be construed as a potential conflict of interest.
Publisher’s note
All claims expressed in this article are solely those of the authors and do not necessarily represent those of their affiliated organizations, or those of the publisher, the editors and the reviewers. Any product that may be evaluated in this article, or claim that may be made by its manufacturer, is not guaranteed or endorsed by the publisher.
Supplementary material
The Supplementary material for this article can be found online at: https://www.frontiersin.org/articles/10.3389/fmed.2024.1501175/full#supplementary-material
Footnotes
1.^ Available at: https://ghdx.healthdata.org/gbd-2021/sources.
2.^ Available at: https://www.healthdata.org/research-analysis/diseases-injuries-risks/factsheets/2021-chronic-kidney-disease-level-3-disease.
3.^ Available at: http://www.diabetesatlas.org/.
References
1.
Webster AC Nagler EV Morton RL Masson P . Chronic kidney disease. Lancet. (2017) 389:1238–52. doi: 10.1016/S0140-6736(16)32064-5
2.
Qing X Jiang J Yuan C Xie K Wang K . Temporal trends in prevalence and disability of chronic kidney disease caused by specific etiologies: an analysis of the global burden of disease study 2019. J Nephrol. (2024) 37:723–37. doi: 10.1007/s40620-024-01914-x
3.
GBD Chronic Kidney Disease Collaboration . Global, regional, and national burden of chronic kidney disease, 1990-2017: a systematic analysis for the global burden of disease study 2017. Lancet. (2020) 395:709–33. doi: 10.1016/S0140-6736(20)30045-3
4.
GBD 2021 Diseases and Injuries Collaborators . Global incidence, prevalence, years lived with disability (YLDs), disability-adjusted life-years (DALYs), and healthy life expectancy (HALE) for 371 diseases and injuries in 204 countries and territories and 811 subnational locations, 1990-2021: a systematic analysis for the global burden of disease study 2021. Lancet. (2024) 403:2133–61. doi: 10.1016/S0140-6736(24)00757-8
5.
Tuo Y Li Y Li Y Ma J Yang X Wu S et al . Global, regional, and national burden of thalassemia, 1990-2021: a systematic analysis for the global burden of disease study 2021. EClinicalMedicine. (2024) 72:102619. doi: 10.1016/j.eclinm.2024.102619
6.
GBD 2019 Demographics Collaborators . Global age-sex-specific fertility, mortality, healthy life expectancy (HALE), and population estimates in 204 countries and territories, 1950-2019: a comprehensive demographic analysis for the global burden of disease study 2019. Lancet. (2020) 396:1160–203. doi: 10.1016/S0140-6736(20)30977-6
7.
Kim HJ Fay MP Feuer EJ Midthune DN . Permutation tests for joinpoint regression with applications to cancer rates. Stat Med. (2000) 19:335–51. doi: 10.1002/(SICI)1097-0258(20000215)19:3<335::AID-SIM336>3.0.CO;2-Z
8.
Kim HJ Chen HS Byrne J Wheeler B Feuer EJ . Twenty years since Joinpoint 1.0: two major enhancements, their justification, and impact. Stat Med. (2022) 41:3102–30. doi: 10.1002/sim.9407
9.
Wei H Ren J Li R Qi X Yang F Li Q . Global, regional, and national burden of chronic kidney disease attributable to high fasting plasma glucose from 1990 to 2019: a systematic analysis from the global burden of disease study 2019. Front Endocrinol (Lausanne). (2024) 15:1379634. doi: 10.3389/fendo.2024.1379634
10.
Cen J Wang Q Cheng L Gao Q Wang H Sun F . Global, regional, and national burden and trends of migraine among women of childbearing age from 1990 to 2021: insights from the global burden of disease study 2021. J Headache Pain. (2024) 25:96. doi: 10.1186/s10194-024-01798-z
11.
Jha V Garcia-Garcia G Iseki K Li Z Naicker S Plattner B et al . Chronic kidney disease: global dimension and perspectives. Lancet. (2013) 382:260–72. doi: 10.1016/S0140-6736(13)60687-X
12.
Tonelli M Wiebe N Culleton B House A Rabbat C Fok M et al . Chronic kidney disease and mortality risk: a systematic review. J Am Soc Nephrol. (2006) 17:2034–47. doi: 10.1681/ASN.2005101085
13.
Zong RR Zhu FF Han W Wang YX Wang GL Wang YZ et al . Tear dynamics testing and quantitative proteomics analysis in patients with chronic renal failure. J Proteome. (2021) 248:104351. doi: 10.1016/j.jprot.2021.104351
14.
Lyons OD . Sleep disorders in chronic kidney disease. Nat Rev Nephrol. (2024) 20:690–700. doi: 10.1038/s41581-024-00848-8
15.
Schutte E Lambers Heerspink HJ Lutgers HL Bakker SJ Vart P Wolffenbuttel BH et al . Serum bicarbonate and kidney disease progression and cardiovascular outcome in patients with diabetic nephropathy: a Post hoc analysis of the RENAAL (reduction of end points in non-insulin-dependent diabetes with the angiotensin II antagonist losartan) study and IDNT (Irbesartan diabetic nephropathy trial). Am J Kidney Dis. (2015) 66:450–8. doi: 10.1053/j.ajkd.2015.03.032
16.
Schiffrin EL Lipman ML Mann JF . Chronic kidney disease: effects on the cardiovascular system. Circulation. (2007) 116:85–97. doi: 10.1161/CIRCULATIONAHA.106.678342
17.
Sarnak MJ Amann K Bangalore S Cavalcante JL Charytan DM Craig JC et al . Chronic kidney disease and coronary artery disease: JACC state-of-the-art review. J Am Coll Cardiol. (2019) 74:1823–38. doi: 10.1016/j.jacc.2019.08.1017
18.
Wen CP Cheng TYD Tsai MK Chang YC Chan HT Tsai SP et al . All-cause mortality attributable to chronic kidney disease: a prospective cohort study based on 462 293 adults in Taiwan. Lancet. (2008) 371:2173–82. doi: 10.1016/S0140-6736(08)60952-6
19.
Jha V Wang AY Wang H . The impact of CKD identification in large countries: the burden of illness. Nephrol Dial Transplant. (2012) 27:iii32. doi: 10.1093/ndt/gfs113
20.
Packham DK Alves TP Dwyer JP Atkins R de Zeeuw D Cooper M et al . Relative incidence of ESRD versus cardiovascular mortality in proteinuric type 2 diabetes and nephropathy: results from the DIAMETRIC (diabetes mellitus treatment for renal insufficiency consortium) database. Am J Kidney Dis. (2012) 59:75–83. doi: 10.1053/j.ajkd.2011.09.017
21.
Liu Y He Q Li Q Tian M Li X Yao X et al . Global incidence and death estimates of chronic kidney disease due to hypertension from 1990 to 2019, an ecological analysis of the global burden of diseases 2019 study. BMC Nephrol. (2023) 24:352. doi: 10.1186/s12882-023-03391-z
22.
Kovesdy CP . Epidemiology of chronic kidney disease: an update 2022. Kidney Int Suppl. (2022) 12:7–11. doi: 10.1016/j.kisu.2021.11.003
23.
Gopaul A Kanagalingam T Thain J Khan T Cowan A Sultan N et al . Denosumab in chronic kidney disease: a narrative review of treatment efficacy and safety. Arch Osteoporos. (2021) 16:116. doi: 10.1007/s11657-021-00971-0
24.
Carrero JJ González-Ortiz A Avesani CM Bakker SJL Bellizzi V Chauveau P et al . Plant-based diets to manage the risks and complications of chronic kidney disease. Nat Rev Nephrol. (2020) 16:525–42. doi: 10.1038/s41581-020-0297-2
25.
Kim SM Jung JY . Nutritional management in patients with chronic kidney disease. Korean J Intern Med. (2020) 35:1279–90. doi: 10.3904/kjim.2020.408
26.
Géza Pethő Á Tapolyai M Csongrádi É Orosz P . Management of chronic kidney disease: the current novel and forgotten therapies. J Clin Transl Endocrinol. (2024) 36:100354. doi: 10.1016/j.jcte.2024.100354
27.
Stringhini S Sabia S Shipley M Brunner E Nabi H Kivimaki M et al . Association of socioeconomic position with health behaviors and mortality. JAMA. (2010) 303:1159–66. doi: 10.1001/jama.2010.297
28.
Scilletta S di Marco M Miano N Filippello A di Mauro S Scamporrino A et al . Update on diabetic kidney disease (DKD): focus on non-albuminuric DKD and cardiovascular risk. Biomol Ther. (2023) 13:752. doi: 10.3390/biom13050752
29.
Duan J Wang C Liu D Qiao Y Pan S Jiang D et al . Prevalence and risk factors of chronic kidney disease and diabetic kidney disease in Chinese rural residents: a cross-sectional survey. Sci Rep. (2019) 9:10408. doi: 10.1038/s41598-019-46857-7
30.
Zaimi M Michalopoulou O Stefanaki K Kazakou P Vasileiou V Psaltopoulou T et al . Gonadal dysfunction in women with diabetes mellitus. Endocrine. (2024) 85:461–72. doi: 10.1007/s12020-024-03729-z
31.
Yang K Yang X Jin C Ding S Liu T Ma B et al . Global burden of type 1 diabetes in adults aged 65 years and older, 1990-2019: population based study. BMJ. (2024) 385:e078432. doi: 10.1136/bmj-2023-078432
32.
Wang X Chen L Shi K Lv J Sun D Pei P et al . Diabetes and chronic kidney disease in Chinese adults: a population-based cohort study. BMJ Open Diabetes Res Care. (2024) 12:e003721. doi: 10.1136/bmjdrc-2023-003721
33.
Cen C Fan Z Ding X Tu X Liu Y . Associations between metabolic dysfunction-associated fatty liver disease, chronic kidney disease, and abdominal obesity: a national retrospective cohort study. Sci Rep. (2024) 14:12645. doi: 10.1038/s41598-024-63386-0
34.
Podadera-Herreros A Arenas-de Larriva AP Gutierrez-Mariscal FM Alcala-Diaz JF Ojeda-Rodriguez A Rodriguez-Cantalejo F et al . Mediterranean diet as a strategy for preserving kidney function in patients with coronary heart disease with type 2 diabetes and obesity: a secondary analysis of CORDIOPREV randomized controlled trial. Nutr Diabetes. (2024) 14:27. doi: 10.1038/s41387-024-00285-3
35.
Drake T Landsteiner A Langsetmo L MacDonald R Anthony M Kalinowski C et al . Newer pharmacologic treatments in adults with type 2 diabetes: a systematic review and network meta-analysis for the American College of Physicians. Ann Intern Med. (2024) 177:618–32. doi: 10.7326/M23-1490
36.
Alshaya OA Korayem GB Alghwainm M Alyami W Alotaibi A Alyami MS et al . The prevalence of cardiovascular diseases, chronic kidney disease, and obesity in patients with type 2 diabetes mellitus and the description of concurrent treatments: a two-center retrospective cross-sectional study in Saudi Arabia. Saudi Pharm J. (2024) 32:102054. doi: 10.1016/j.jsps.2024.102054
37.
Farah R Alhajahjeh A al-farahid O Abuzaid H Hyassat D al-Khuraisat G et al . Risk factors for chronic kidney disease in middle eastern patients with type 2 diabetes mellitus: a cross-sectional study using the KDIGO classification. J Diabetes Complicat. (2024) 38:108740. doi: 10.1016/j.jdiacomp.2024.108740
38.
Liu S Qiu C Li W Li X Liu F Hu G . Blood urea nitrogen to serum albumin ratio as a new prognostic indicator in type 2 diabetes mellitus patients with chronic kidney disease. Sci Rep. (2024) 14:8002. doi: 10.1038/s41598-024-58678-4
39.
Surawit A Pongkunakorn T Manosan T Mongkolsucharitkul P Chamnan P Suvarnabhumi K et al . Factors influencing optimal diabetes care and clinical outcomes in Thai patients with type 2 diabetes mellitus: a multilevel modelling analysis. BMJ Open. (2024) 14:e079415. doi: 10.1136/bmjopen-2023-079415
40.
Freedman BI Sedor JR . Hypertension-associated kidney disease: perhaps no more. J Am Soc Nephrol. (2008) 19:2047–51. doi: 10.1681/ASN.2008060621
41.
Freedman BI Cohen AH . Hypertension-attributed nephropathy: what's in a name?Nat Rev Nephrol. (2016) 12:27–36. doi: 10.1038/nrneph.2015.172
42.
Kopp JB . Rethinking hypertensive kidney disease: arterionephrosclerosis as a genetic, metabolic, and inflammatory disorder. Curr Opin Nephrol Hypertens. (2013) 22:266–72. doi: 10.1097/MNH.0b013e3283600f8c
43.
Robinson TW Freedman BI . The apolipoprotein L1 gene and cardiovascular disease. Methodist Debakey Cardiovasc J. (2016) 12:2–5. doi: 10.14797/mdcj-12-4s1-2
44.
Gui Z Shao C Zhan Y Wang Z Li L . Vascular calcification: high incidence sites, distribution, and detection. Cardiovasc Pathol. (2024) 72:107667. doi: 10.1016/j.carpath.2024.107667
45.
Boubred F Saint-Faust M Buffat C Ligi I Grandvuillemin I Simeoni U . Developmental origins of chronic renal disease: an integrative hypothesis. Int J Nephrol. (2013) 2013:346067. doi: 10.1155/2013/346067
46.
Chen TK Appel LJ Grams ME Tin A Choi MJ Lipkowitz MS et al . APOL1 risk variants and cardiovascular disease: results from the AASK (African American study of kidney disease and hypertension). Arterioscler Thromb Vasc Biol. (2017) 37:1765–9. doi: 10.1161/ATVBAHA.117.309384
47.
Parsa A Kao WH Xie D Astor BC Li M Hsu CY et al . APOL1 risk variants, race, and progression of chronic kidney disease. N Engl J Med. (2013) 369:2183–96. doi: 10.1056/NEJMoa1310345
48.
Garrisi D Bevan A Angeles C . Advancing treatments for rare renal diseases: new hopes and opportunities to address a high unmet need. Glomerular Dis. (2024) 4:11–8. doi: 10.1159/000535955
49.
Bose B Jha V . Trends in the global burden of glomerulonephritis. Clin J Am Soc Nephrol. (2023) 18:14–6. doi: 10.2215/CJN.0000000000000029
50.
Tan RZ Jia J Li T Wang L Kantawong F . A systematic review of epigenetic interplay in kidney diseases: crosstalk between long noncoding RNAs and methylation, acetylation of chromatin and histone. Biomed Pharmacother. (2024) 176:116922. doi: 10.1016/j.biopha.2024.116922
51.
Gautam S Kiran UV . Clinical effects of yoga and meditational practices on the holistic health of chronic kidney disease patients: a systematic review. Cureus. (2024) 16:e57546. doi: 10.7759/cureus.57546
52.
Hustrini NM Susalit E Widjaja FF Khumaedi AI Dekkers OM van Diepen M et al . The etiology of advanced chronic kidney disease in Southeast Asia: a meta-analysis. J Epidemiol Glob Health. (2024) 14:740–64. doi: 10.1007/s44197-024-00209-5
53.
Mitrofanova A Merscher S Fornoni A . Kidney lipid dysmetabolism and lipid droplet accumulation in chronic kidney disease. Nat Rev Nephrol. (2023) 19:629–45. doi: 10.1038/s41581-023-00741-w
54.
Mallawaarachchi AC Fowles L Wardrop L Wood A O'Shea R Biros E et al . Genomic testing in patients with kidney failure of an unknown cause: a national Australian study. Clin J Am Soc Nephrol. (2024) 19:887–97. doi: 10.2215/CJN.0000000000000464
55.
Olanrewaju TO Aderibigbe A Popoola AA Braimoh KT Buhari MO Adedoyin OT . Prevalence of chronic kidney disease and risk factors in North-Central Nigeria: a population-based survey. BMC Nephrol. (2020) 21:467. doi: 10.1186/s12882-020-02126-8
56.
Council E-E Group EW . Chronic kidney disease is a key risk factor for severe COVID-19: a call to action by the ERA-EDTA. Nephrol Dial Transpl. (2020) 36:87–94. doi: 10.1093/ndt/gfaa314
57.
Nugent RA Fathima SF Feigl AB Chyung D . The burden of chronic kidney disease on developing nations: a 21st century challenge in global health. Nephron Clin Pract. (2011) 118:c269–77. doi: 10.1159/000321382
58.
Shrestha N Gautam S Mishra SR Virani SS Dhungana RR . Burden of chronic kidney disease in the general population and high-risk groups in South Asia: a systematic review and meta-analysis. PLoS One. (2021) 16:e0258494. doi: 10.1371/journal.pone.0258494
59.
McGee J Pandey B Maskey A Frazer T Mackinney T . Free dialysis in Nepal: logistical challenges explored. Hemodial Int. (2018) 22:283–9. doi: 10.1111/hdi.12629
60.
Jha V Ur-Rashid H Agarwal SK Akhtar SF Kafle RK Sheriff R . The state of nephrology in South Asia. Kidney Int. (2019) 95:31–7. doi: 10.1016/j.kint.2018.09.001
61.
Collins AJ Foley RN Herzog C Chavers B Gilbertson D Ishani A . Epidemiology of chronic kidney disease in children. Pediatr Nephrol. (2012) 27:363–73. doi: 10.1007/s00467-011-1939-1
62.
Collins AJ et al . United States renal data system 2008 annual data report. Am J Kidney Dis. (2009) 53:S1–2. doi: 10.1053/j.ajkd.2009.01.003
63.
Johansen KL Gilbertson DT Li S Li S Liu J Roetker NS et al . US renal data system 2023 annual data report: epidemiology of kidney disease in the United States. Am J Kidney Dis. (2024) 83:A8–a13. doi: 10.1053/j.ajkd.2024.01.001
64.
Amanullah F Malik AA Zaidi Z . Chronic kidney disease causes and outcomes in children: perspective from a LMIC setting. PLoS One. (2022) 17:e0269632. doi: 10.1371/journal.pone.0269632
65.
van Biljon G Meintjes CJ Becker PJ Karusseit VOL . Risk factors for progression of chronic kidney disease: an investigation in prepubertal children. Nephrology (Carlton). (2023) 28:276–82. doi: 10.1111/nep.14153
66.
Penna FJ Elder JS . CKD and bladder problems in children. Adv Chronic Kidney Dis. (2011) 18:362–9. doi: 10.1053/j.ackd.2011.08.001
67.
Harada R Hamasaki Y Okuda Y Hamada R Ishikura K . Epidemiology of pediatric chronic kidney disease/kidney failure: learning from registries and cohort studies. Pediatr Nephrol. (2022) 37:1215–29. doi: 10.1007/s00467-021-05145-1
68.
Pizzarelli F Basile C Aucella F Dattolo PC . Chronic kidney disease in the elderly and frail patient: perspectives with opinions and comments. J Nephrol. (2023) 36:1565–70. doi: 10.1007/s40620-023-01676-y
69.
Evans M Lewis RD Morgan AR Whyte MB Hanif W Bain SC et al . A narrative review of chronic kidney disease in clinical practice: current challenges and future perspectives. Adv Ther. (2022) 39:33–43. doi: 10.1007/s12325-021-01927-z
70.
Palmer S Vecchio M Craig JC Tonelli M Johnson DW Nicolucci A et al . Prevalence of depression in chronic kidney disease: systematic review and meta-analysis of observational studies. Kidney Int. (2013) 84:179–91. doi: 10.1038/ki.2013.77
71.
Marini S Georgakis MK Anderson CD . Interactions between kidney function and cerebrovascular disease: vessel pathology that fires together wires together. Front Neurol. (2021) 12:785273. doi: 10.3389/fneur.2021.785273
72.
Musio F . Kidney disease and Anemia in elderly patients. Clin Geriatr Med. (2019) 35:327–37. doi: 10.1016/j.cger.2019.03.009
73.
Sabatino A Cuppari L Stenvinkel P Lindholm B Avesani CM . Sarcopenia in chronic kidney disease: what have we learned so far?J Nephrol. (2021) 34:1347–72. doi: 10.1007/s40620-020-00840-y
74.
Warsame F Chu NM Hong J Mathur A Crews DC Bayliss G et al . Sleep duration and cognitive function among older adults with chronic kidney disease: results from the national health and nutrition examination survey (2011-2014). Nephrol Dial Transplant. (2023) 38:1636–44. doi: 10.1093/ndt/gfac325
75.
Egbi OG Okafor UH Miebodei KE Kasia BE Kunle-Olowu OE Unuigbe EI . Prevalence and correlates of chronic kidney disease among civil servants in Bayelsa state, Nigeria. Niger J Clin Pract. (2014) 17:602–7. doi: 10.4103/1119-3077.141426
76.
Silva-Tinoco R Cuatecontzi-Xochitiotzi T Morales-Buenrostro LE Gracia-Ramos AE Aguilar-Salinas CA Castillo-Martínez L . Prevalence of chronic kidney disease in individuals with type 2 diabetes within primary care: a cross-sectional study. J Prim Care Community Health. (2024) 15:21501319241259325. doi: 10.1177/21501319241259325
77.
Ahmed SB . Menopause and chronic kidney disease. Semin Nephrol. (2017) 37:404–11. doi: 10.1016/j.semnephrol.2017.05.013
78.
Xiao Y Devakumar V Xu L Liu L Mo H Hong X . Elevated serum creatinine levels and risk of cognitive impairment in older adults with diabetes: a NHANES study from 2011-2014. Front Endocrinol (Lausanne). (2023) 14:1149084. doi: 10.3389/fendo.2023.1149084
79.
Chesnaye NC Carrero JJ Hecking M Jager KJ . Differences in the epidemiology, management and outcomes of kidney disease in men and women. Nat Rev Nephrol. (2024) 20:7–20. doi: 10.1038/s41581-023-00784-z
80.
Stevens KI Mallamaci F Ortiz A Bover J Delanaye P Torra R et al . 'The forgotten sex': gender disparities in kidney disease. Clin Kidney J. (2024) 17:p. sfad102. doi: 10.1093/ckj/sfad102
81.
Brar A Markell M . Impact of gender and gender disparities in patients with kidney disease. Curr Opin Nephrol Hypertens. (2019) 28:178–82. doi: 10.1097/MNH.0000000000000482
82.
Melsom T Norvik JV Enoksen IT Stefansson V Mathisen UD Fuskevåg OM et al . Sex differences in age-related loss of kidney function. J Am Soc Nephrol. (2022) 33:1891–902. doi: 10.1681/ASN.2022030323
83.
Carrero JJ Hecking M Chesnaye NC Jager KJ . Sex and gender disparities in the epidemiology and outcomes of chronic kidney disease. Nat Rev Nephrol. (2018) 14:151–64. doi: 10.1038/nrneph.2017.181
84.
Beridze G Vetrano DL Marengoni A Dai L Carrero JJ Calderón-Larrañaga A . Concordance and discrepancies among 5 creatinine-based equations for assessing estimated glomerular filtration rate in older adults. JAMA Netw Open. (2023) 6:e234211. doi: 10.1001/jamanetworkopen.2023.4211
85.
Carrero JJ Hecking M Ulasi I Sola L Thomas B . Chronic kidney disease, gender, and access to care: a global perspective. Semin Nephrol. (2017) 37:296–308. doi: 10.1016/j.semnephrol.2017.02.009
86.
Hödlmoser S Winkelmayer WC Zee J Pecoits-Filho R Pisoni RL Port FK et al . Sex differences in chronic kidney disease awareness among US adults, 1999 to 2018. PLoS One. (2020) 15:e0243431. doi: 10.1371/journal.pone.0243431
87.
Hödlmoser S Winkelmayer WC Zee J Pecoits-Filho R Pisoni RL Port FK . High patient unawareness for chronic kidney disease even in later stages - but why is it more frequent in women than in men?Dtsch Med Wochenschr. (2022) 147:e70–81. doi: 10.1055/a-1819-0870
88.
Francis A Harhay MN Ong ACM Tummalapalli SL Ortiz A Fogo AB et al . Chronic kidney disease and the global public health agenda: an international consensus. Nat Rev Nephrol. (2024) 20:473–85. doi: 10.1038/s41581-024-00820-6
89.
Escribano-Serrano J Jiménez-Varo E Escribano-Cobalea M López-Ceres A Casto-Jarillo C Hormigo-Pozo A et al . Is the use of the new chronic kidney disease epidemiology consortium (CKD-EPI 2021) formula appropriate for the Spanish population?Rev Clin Esp (Barc). (2023) 223:144–53. doi: 10.1016/j.rce.2022.11.005
90.
Williams A Lyeo JS Geffros S Mouriopoulos A . The integration of sex and gender considerations in health policymaking: a scoping review. Int J Equity Health. (2021) 20:69. doi: 10.1186/s12939-021-01411-8
91.
Swartling O Rydell H Stendahl M Segelmark M Trolle Lagerros Y Evans M . CKD progression and mortality among men and women: a nationwide study in Sweden. Am J Kidney Dis. (2021) 78:190–199.e1. doi: 10.1053/j.ajkd.2020.11.026
92.
Balafa O Fernandez-Fernandez B Ortiz A Dounousi E Ekart R Ferro CJ et al . Sex disparities in mortality and cardiovascular outcomes in chronic kidney disease. Clin Kidney J. (2024) 17:sfae044. doi: 10.1093/ckj/sfae044
93.
Vallianou NG Mitesh S Gkogkou A Geladari E . Chronic kidney disease and cardiovascular disease: is there any relationship?Curr Cardiol Rev. (2019) 15:55–63. doi: 10.2174/1573403X14666180711124825
Summary
Keywords
chronic kidney disease, global burden of disease, prevalence, incidence, mortality, disability-adjusted life years
Citation
Guo J, Liu Z, Wang P, Wu H, Fan K, Jin J, Zheng L, Liu Z, Xie R and Li C (2025) Global, regional, and national burden inequality of chronic kidney disease, 1990–2021: a systematic analysis for the global burden of disease study 2021. Front. Med. 11:1501175. doi: 10.3389/fmed.2024.1501175
Received
24 September 2024
Accepted
30 December 2024
Published
15 January 2025
Volume
11 - 2024
Edited by
Francesco Perticone, Magna Græcia University, Italy
Reviewed by
De-quan Su, Fudan University, China
Shao-Hong Tao, Guangdong Provincial Hospital of Integrated Traditional Chinese and Western Medicine, China
Updates
Copyright
© 2025 Guo, Liu, Wang, Wu, Fan, Jin, Zheng, Liu, Xie and Li.
This is an open-access article distributed under the terms of the Creative Commons Attribution License (CC BY). The use, distribution or reproduction in other forums is permitted, provided the original author(s) and the copyright owner(s) are credited and that the original publication in this journal is cited, in accordance with accepted academic practice. No use, distribution or reproduction is permitted which does not comply with these terms.
*Correspondence: Renyi Xie, xierenyi@163.com; Cheng Li, cheng-li@xmu.edu.cn
†These authors have contributed equally to this work
Disclaimer
All claims expressed in this article are solely those of the authors and do not necessarily represent those of their affiliated organizations, or those of the publisher, the editors and the reviewers. Any product that may be evaluated in this article or claim that may be made by its manufacturer is not guaranteed or endorsed by the publisher.