 Zhang Jing1,2*
 Liu Yuntao3
 Zheng Danwen4Ye Gangfu1Chen Qiumin5Huang Jianshan6Wang Jiamei7Ma Zengming8Zhang Zhongde3*
- 1Department of Pulmonary and Critical Care Medicine, Xiamen Hospital of Traditional Chinese Medicine, Xiamen, Fujian, China
- 2Guangzhou University of Chinese Medicine, Guangzhou, Guangdong, China
- 3Key Laboratory of Infectious Diseases, Guangdong Provincial Bureau of Chinese Medicine, Guangzhou, China
- 4Emergency Department, The Second Affiliated Hospital of Guangzhou University of Chinese Medicine, Guangzhou, Guangdong, China
- 5Department of Traditional Chinese Medicine, Xinglin Branch of the First Affiliated Hospital of Xiamen University, Xiamen, Fujian, China
- 6Department of Pediatrics, Xiamen Hospital of Traditional Chinese Medicine, Xiamen, Fujian, China
- 7Department of Traditional Chinese Medicine, Xiamen Fifth Hospital, Xiamen, Fujian, China
- 8Integrated TCM & Western Medicine Department, Xiamen Xianyue Hospital, Xiamen, Fujian, China
Objective: This study aims to identify early warning indicators of COVID-19 severity by integrating modern medical biomarkers with traditional Chinese medicine (TCM) tongue features.
Methods: A retrospective observational study was conducted on 409 hospitalized COVID-19 patients from two centers in China. Patients were stratified into severe (n = 50) and non-severe (n = 359) groups based on the 10th edition of China’s diagnostic guidelines. Data included demographics, clinical symptoms, tongue characteristics, and laboratory parameters. Univariate analyses (chi-square/Fisher’s exact tests) and stepwise logistic regression were performed to identify key predictors.
Results: Age (p < 0.001), fever (p < 0.001), elevated procalcitonin (PCT, p < 0.001), thick tongue fur (p = 0.003), and fat tongue shape (p = 0.002) were significant predictors of severity. The combined model integrating these factors demonstrated superior predictive performance (Nagelkerke R2 = 0.741).
Conclusion: Integrating TCM tongue features (thick fur and fat shape) with clinical biomarkers (age, fever, and PCT) enhances early identification of severe COVID-19, particularly in resource-limited settings.
1 Introduction
As of 12 July 2024, the World Health Organization (WHO) (1) reports that the global pandemic of novel Coronavirus Disease 2019 (COVID-19) has resulted in over 700 million confirmed cases and 7 million deaths. History teaches us that the next pandemic is a matter of “when,” not “if” (2). Strategies for preventing severe outcomes and improving treatment efficacy remain critical areas requiring ongoing and relentless research in COVID-19 management. In this study, we focus on obtaining warning indicators of severity by using the retrospective observational method.
To date, numerous studies have explored warning indicators for COVID-19. These include baseline characteristics, such as age, diabetes, obesity, hypertension, and genetic risk (3–7), clinical symptoms, such as chest pain, dyspnea, and headache (8), and laboratory markers, such as procalcitonin (PCT), D-dimer (D-D), lactic dehydrogenase (LDH), c-reactive protein (CRP), lymphocyte (LY), tumor necrosis factor-α (TNF-α), and serum cystatin C (sCys C) (9–13). However, the majority of existing research relies on cross-sectional or retrospective designs, lacking comprehensive integration of multidisciplinary approaches.
Traditional Chinese medicine (TCM), akin to other global traditional medical systems, posits that external manifestations (e.g., tongue features) can predict disease progression. For instance, tongue diagnosis has been shown to aid in predicting acute heart failure, classifying diabetes and hypertension, and identifying diagnostic signatures in coronary artery disease with clopidogrel resistance (14–17). These non-invasive diagnostic methods are particularly valuable in resource-limited settings where advanced testing equipment is unavailable. Despite this potential, research on TCM-based warning indicators for COVID-19 severity remains scarce.
In this study, we conducted a retrospective observational analysis combining modern medical indicators (e.g., laboratory markers) and TCM tongue features. These variables were analyzed using one-way ANOVA and logistic regression to identify severity-related warning indicators. This approach aims to bridge the gap between modern and traditional medicine, offering a supplementary tool for early risk stratification in diverse clinical settings.
2 Materials and methods
2.1 Cases
A total of 409 cases of novel coronavirus infection were admitted to sentinel hospitals in Guangzhou, Guangdong, and Xiamen, Fujian, China, from May to October 2021.
2.2 Inclusion and exclusion criteria
According to China’s 10th edition of the Diagnosis and Treatment Guidelines for Novel Coronavirus Infection (Trial) (18), a positive nucleic acid test for the novel coronavirus was the diagnostic criterion. During this period, all patients were infected with the Delta strain, and cases with psychiatric conditions were excluded. The diagnostic criteria for severity are listed in Table 1. A diagnosis could be made if any one of the following criteria was met. Cases meeting these criteria were included in the severe group, while others were placed in the non-severe group.
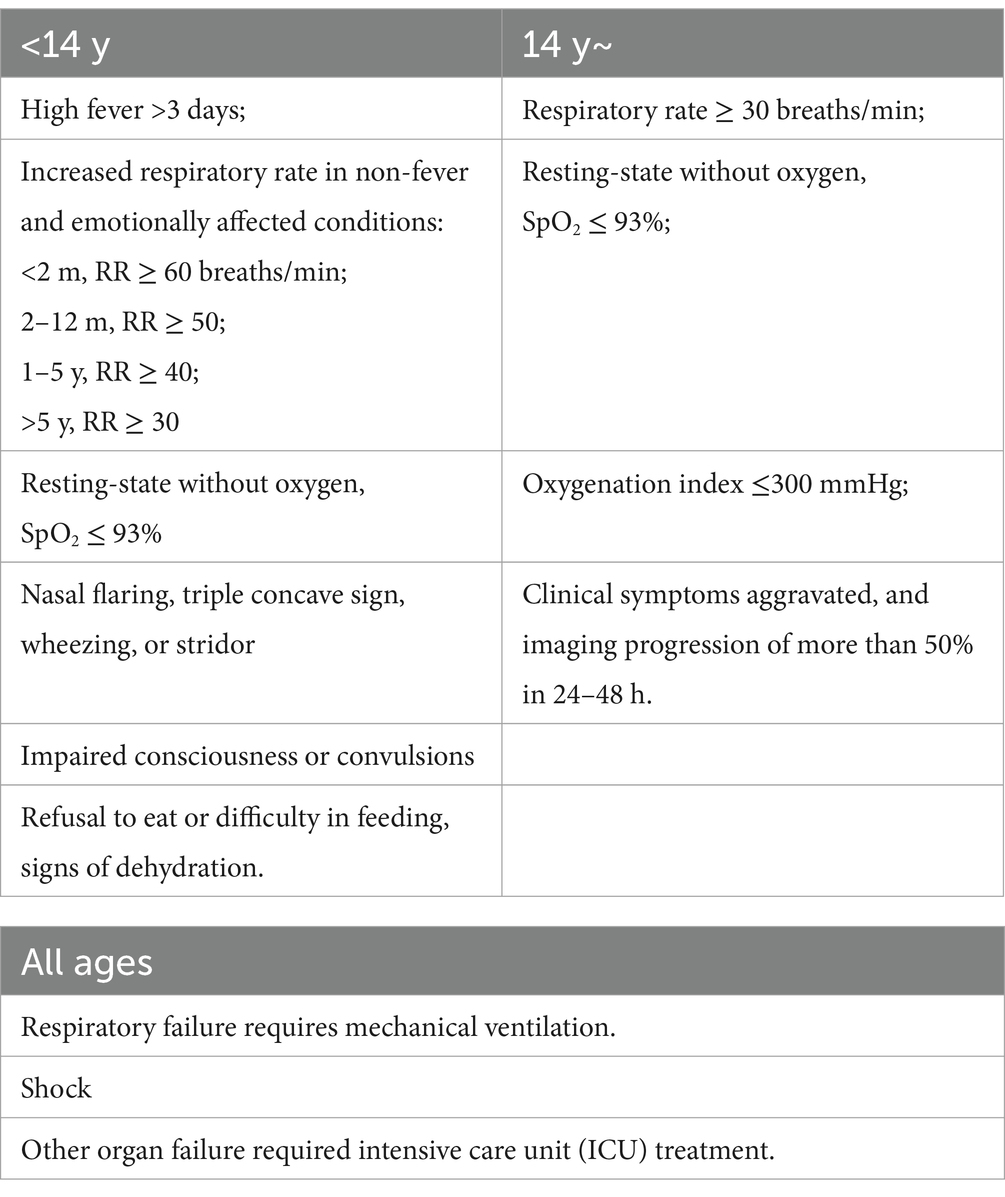
Table 1. Diagnostic criteria for severity.
2.3 Data collection
Data were collected by clinicians and cross-verified by two independent researchers. Inaccurate data were discarded and treated as missing. Abbreviations are provided in Appendix Table 1.
General information includes gender, age, body mass index (BMI), heavy smoking, hypertension, heart disease, diabetes, chronic lung disease, chronic liver disease, chronic kidney disease, neoplasms, rheumatologic and immunologic diseases, surgery, and vaccination history, totaling 15 items.
Clinical symptoms include fever, cold, headache, sweating, nasal congestion and runny nose, cough, sputum, sore throat, shortness of breath, chest tightness, nausea and vomiting, fatigue, loss of taste or smell, diarrhea, muscular pains, and poor appetite, totaling 18 items. Data for the severe group were collected 4 days before the diagnosis of severity, while data for the non-severe group were collected between 7 and 11 days of disease duration. The aim of the study was to detect critically ill patients as early as possible. Therefore, data from 4 days before the diagnosis of severity were selected for the severe group. In contrast, the non-severe group was pre-measured and found to have worse data between days 7 and 11 of the disease course; hence, this period was selected for comparison.
Tongue features were evaluated according to the tongue assessment criteria (19), with two senior staff members providing their evaluations after careful deliberation. The classification of tongue features is detailed in Table 2. Examples of assessments are provided in Appendix Table 2.
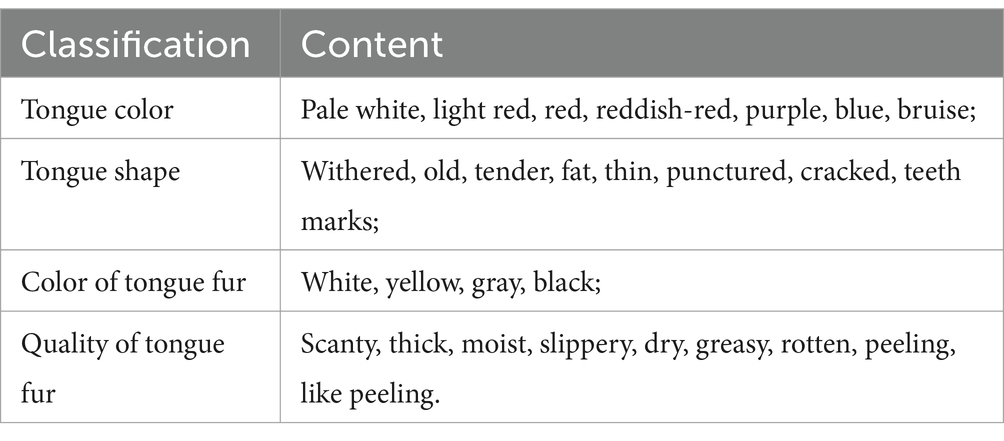
Table 2. Tongue classification (29 items).
Testing information was categorized as normal or abnormal based on the reference range provided by the test results. The criteria for judgment are provided in Appendix Table 3. The Tongue classification items are presented in Table 3. As the study objective was to identify early warning indicators rather than precise disease manifestations, abnormal laboratory findings were not subcategorized into elevated or decreased levels. Comprehensive data characterization, including median values and interquartile ranges (IQR), are provided in Appendix Table 4. Data for the severe group were collected 4 days before the diagnosis of severity, while data for the non-severe group were collected between 7 and 11 days of disease duration.
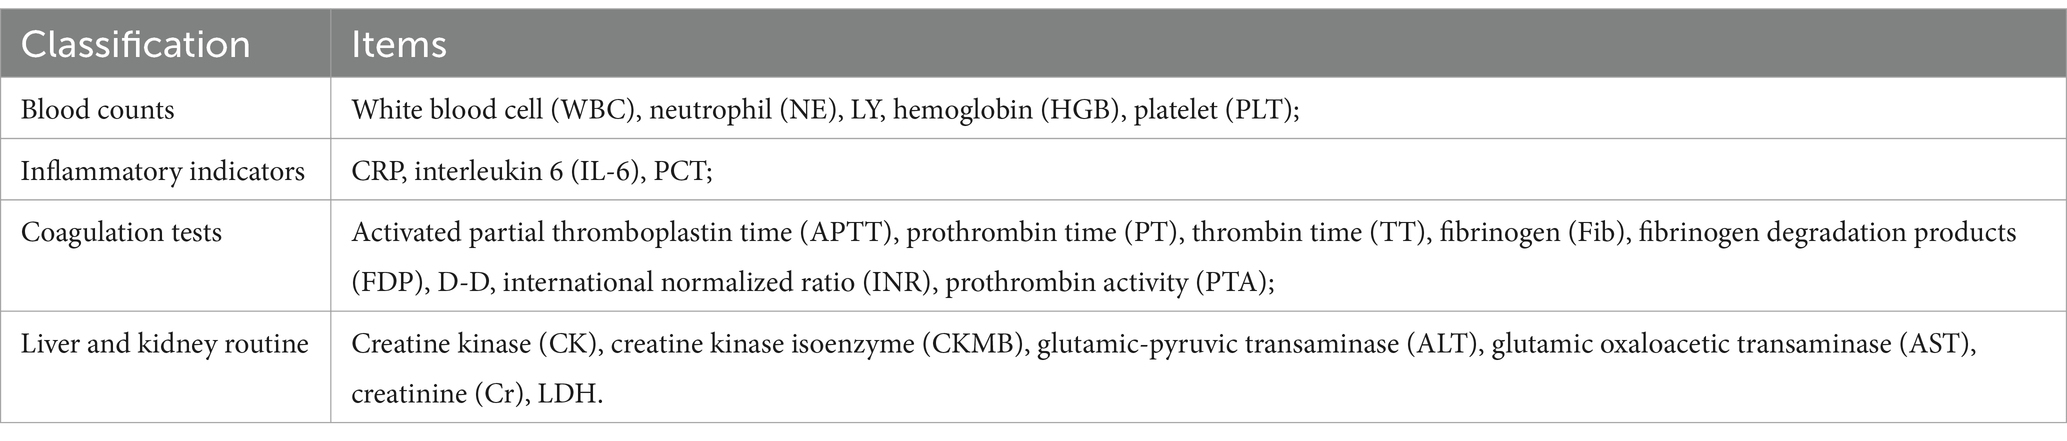
Table 3. Laboratory markers (22 items).
2.4 Statistical analysis methods
Excel was used for data entry, and SPSS Statistics for Windows, version 18.0 (SPSS Inc., Chicago, Ill., USA) was used for statistical analysis. Continuous variables were checked for maximum and minimum values, and histograms and quartiles were used to examine the data. Categorical variables were assessed using frequency tables, which were sorted to screen for and exclude erroneous data. Measured data were described using the mean ± standard deviation for conformity to a normal distribution, otherwise median and interquartile spacing median were used (P25, P75). Frequency and percentage were used to express the count data. General information, clinical symptoms, tongue features, and testing information were categorized as count data. Univariate analysis of the count data between groups was performed using the chi-square test or Fisher’s exact probability test. Frequency indicators with a severe positive rate of <3% and secondary indicators with obvious correlations were discarded based on medical and testing principles. The resulting positive indicators were analyzed using binary logistic regression. A p < 0.05 was considered statistically significant.
3 Results
A total of 409 cases with novel coronavirus infection were included: 50 cases in the severe group and 359 cases in the non-severe group.
3.1 Univariate analysis
In the univariate analysis of general information, indicators with a positive rate of <3% for severity (such as heavy smoking, heart disease, diabetes, chronic lung disease, chronic liver disease, chronic kidney disease, tumors, rheumatologic and immunologic diseases, and surgery) were discarded. Using p < 0.05 as the inclusion criterion, four indicators, namely age (p < 0.001), BMI (p = 0.036), hypertension (p < 0.001), and vaccination (p < 0.001), were included, as shown in Table 4.
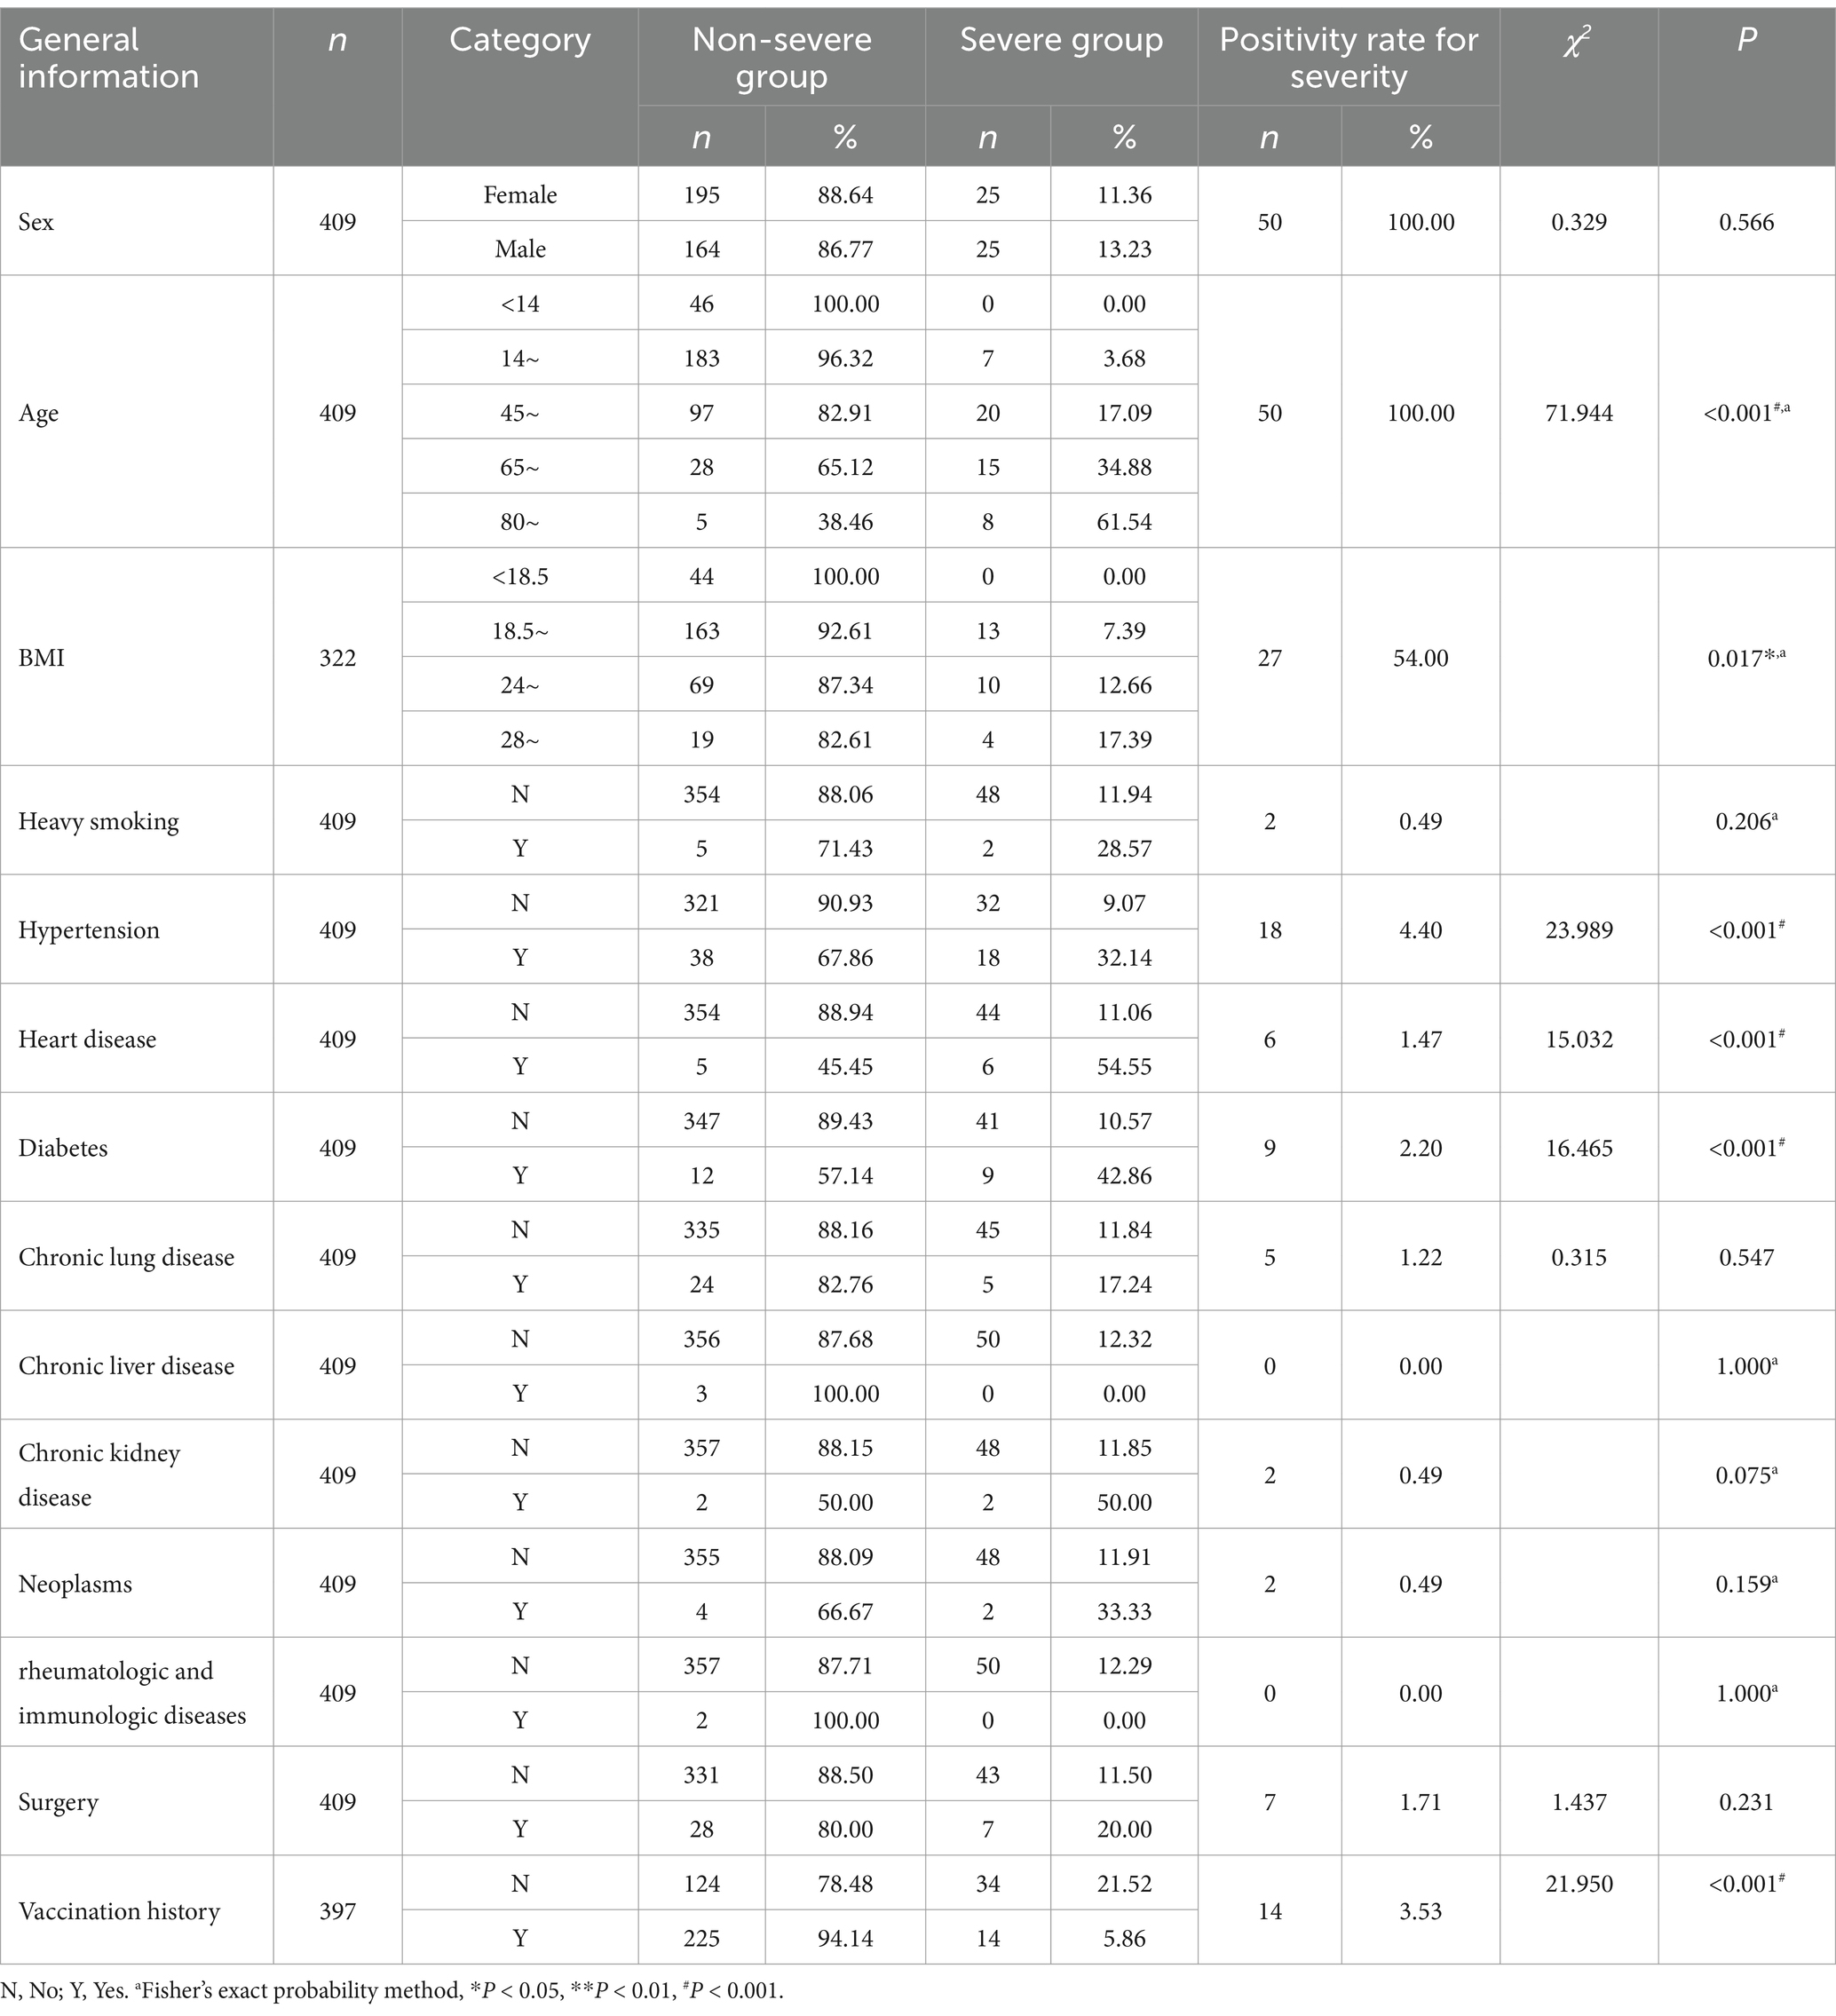
Table 4. Univariate analysis of general information.
In the univariate analysis of clinical symptoms, indicators with a positive rate of <3% for severity (such as cold, headache, sweating, nasal congestion and runny nose, sore throat, chest tightness, nausea and vomiting, loss of taste or smell, diarrhea, and muscle pain) were discarded. Finally, six indicators, namely fever (p < 0.001), cough (p < 0.001), sputum (p < 0.001), shortness of breath (p < 0.001), fatigue (p < 0.001), and poor appetite (p < 0.001), were included, as shown in Table 5.
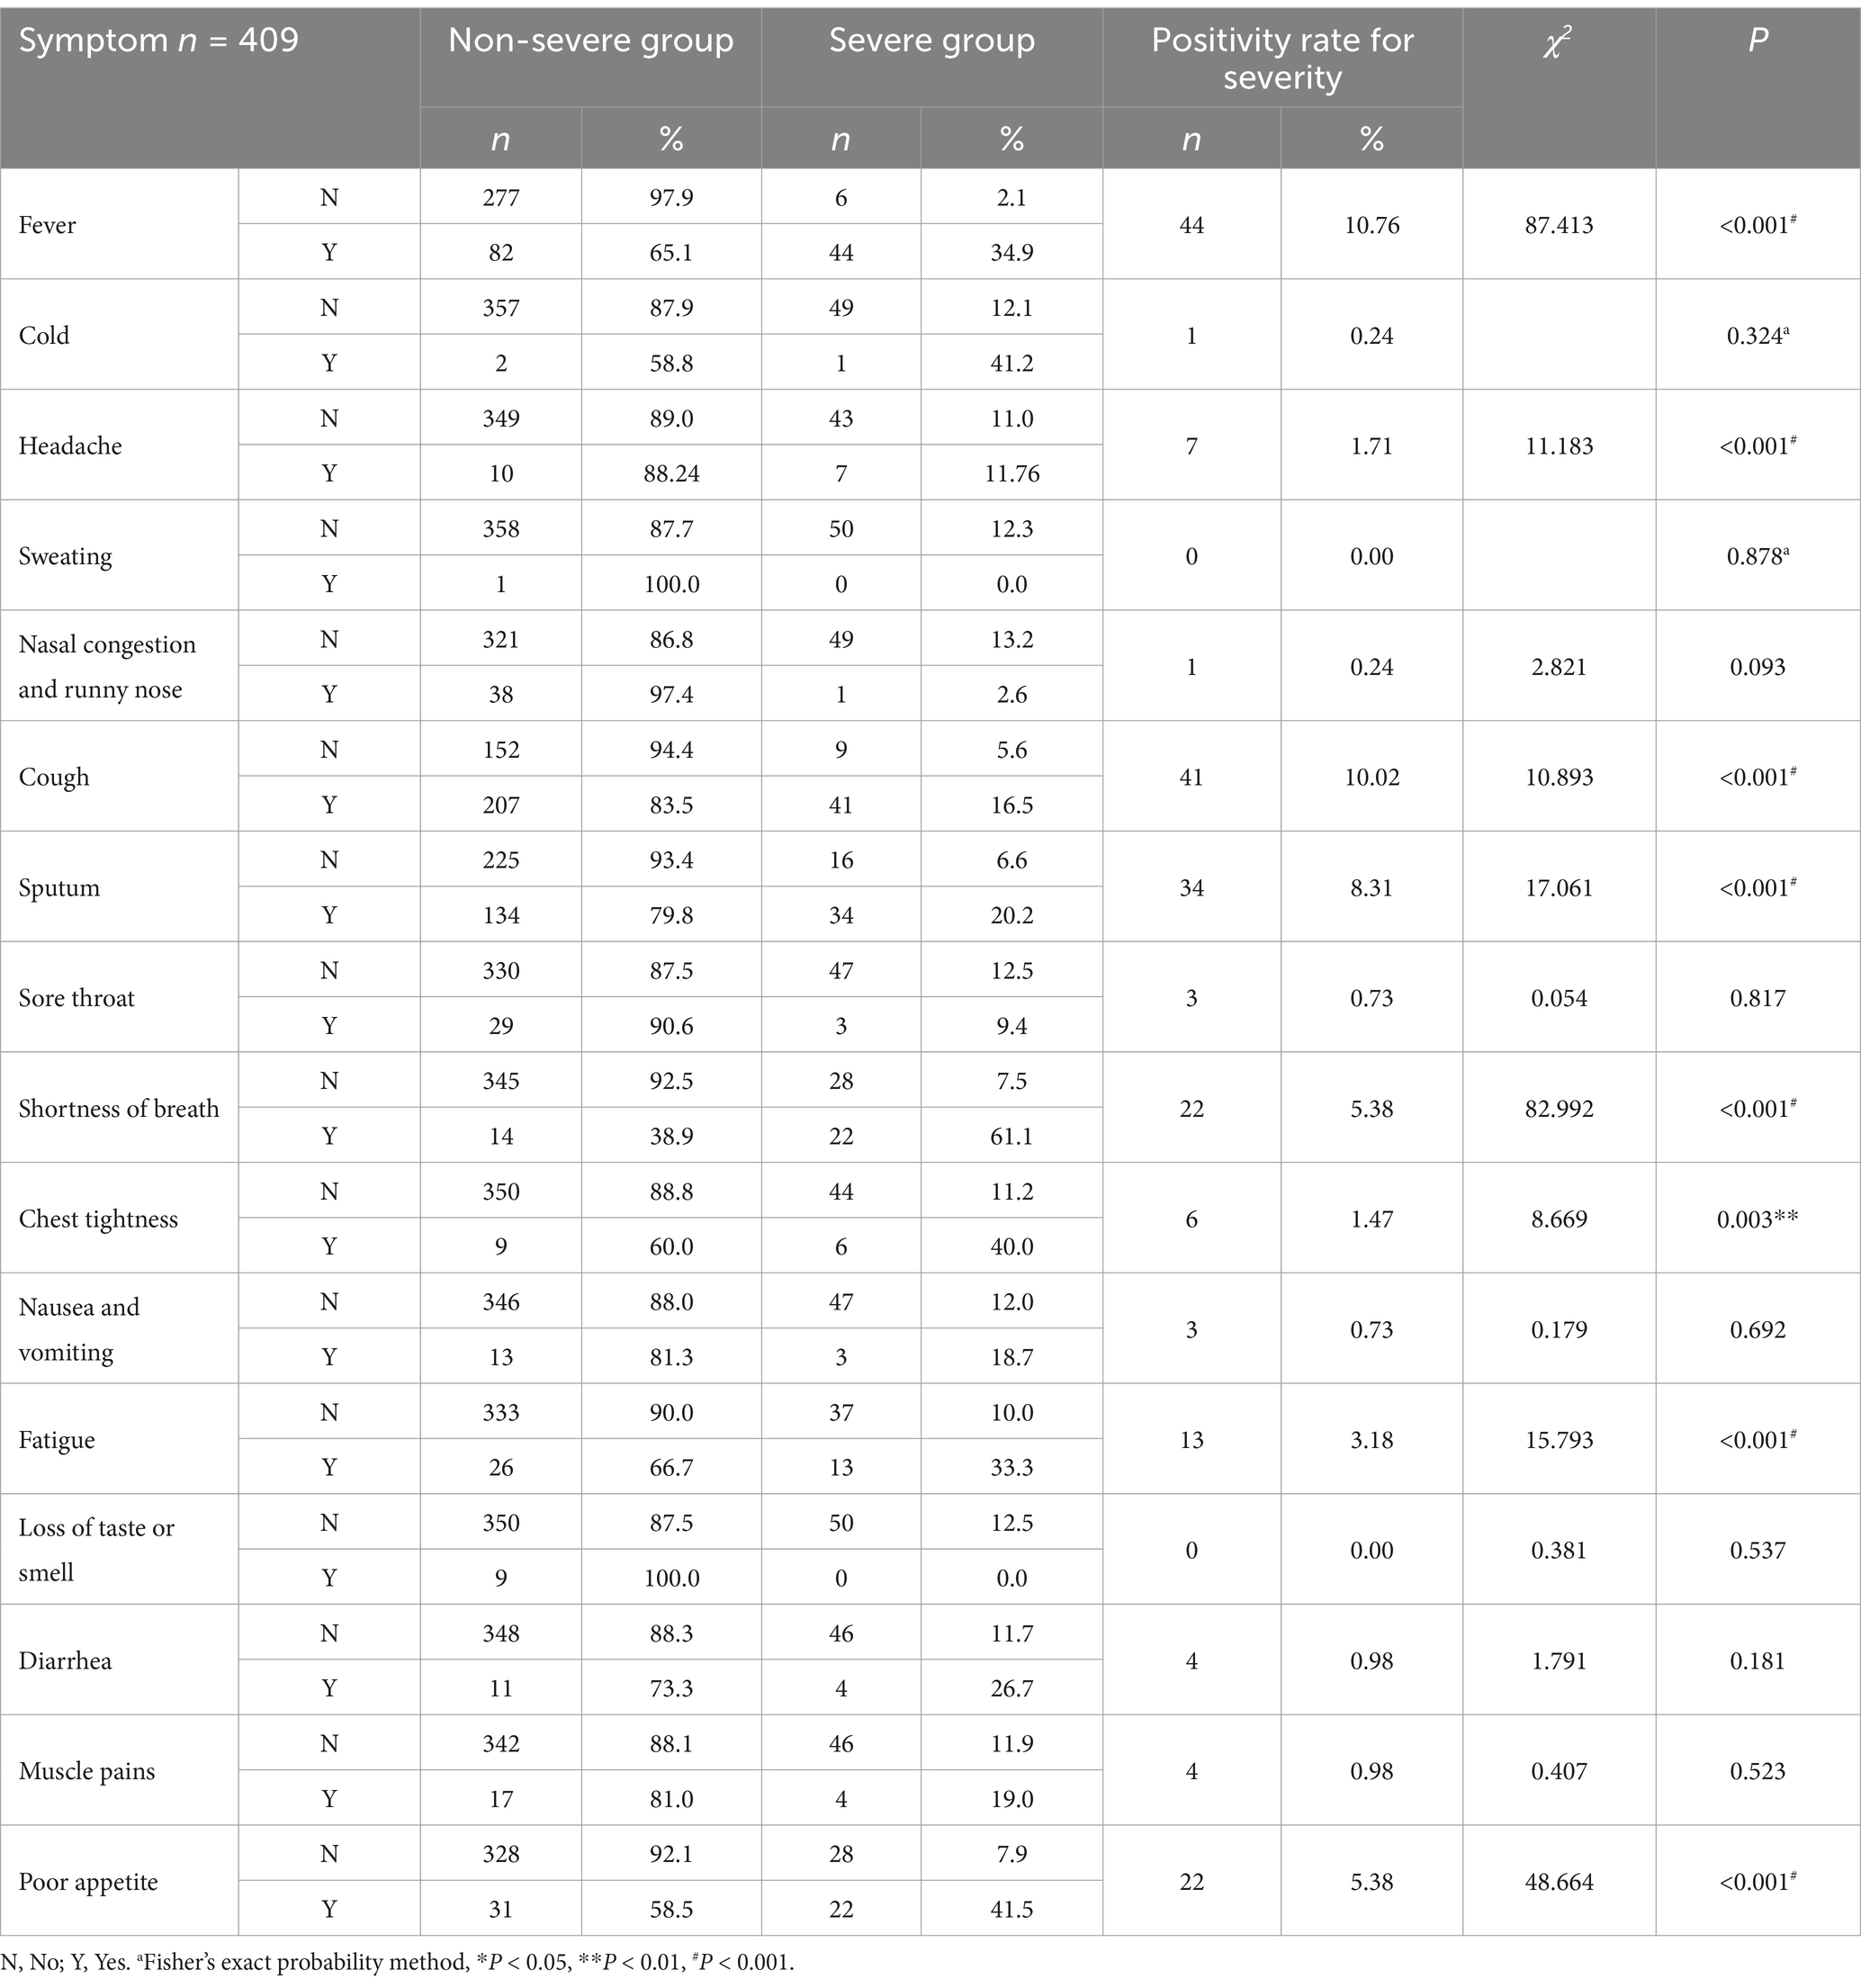
Table 5. Univariate analysis of clinical symptoms.
In the univariate analysis of tongue features, indicators with a positive rate of <3% for severity (such as pale white, pale red, red, reddish-red, blue, bruise, withered, old, tender, fat, thin, punctured, cracked, white, gray, black, weak, moist, dry, rotten, peeling, or like peeling) were excluded. Finally, five indicators, namely purple (p < 0.001), fat (p < 0.001), teeth marks (p = 0.04), thick (p < 0.001), and greasy (p = 0.031), were included, as shown in Table 6.
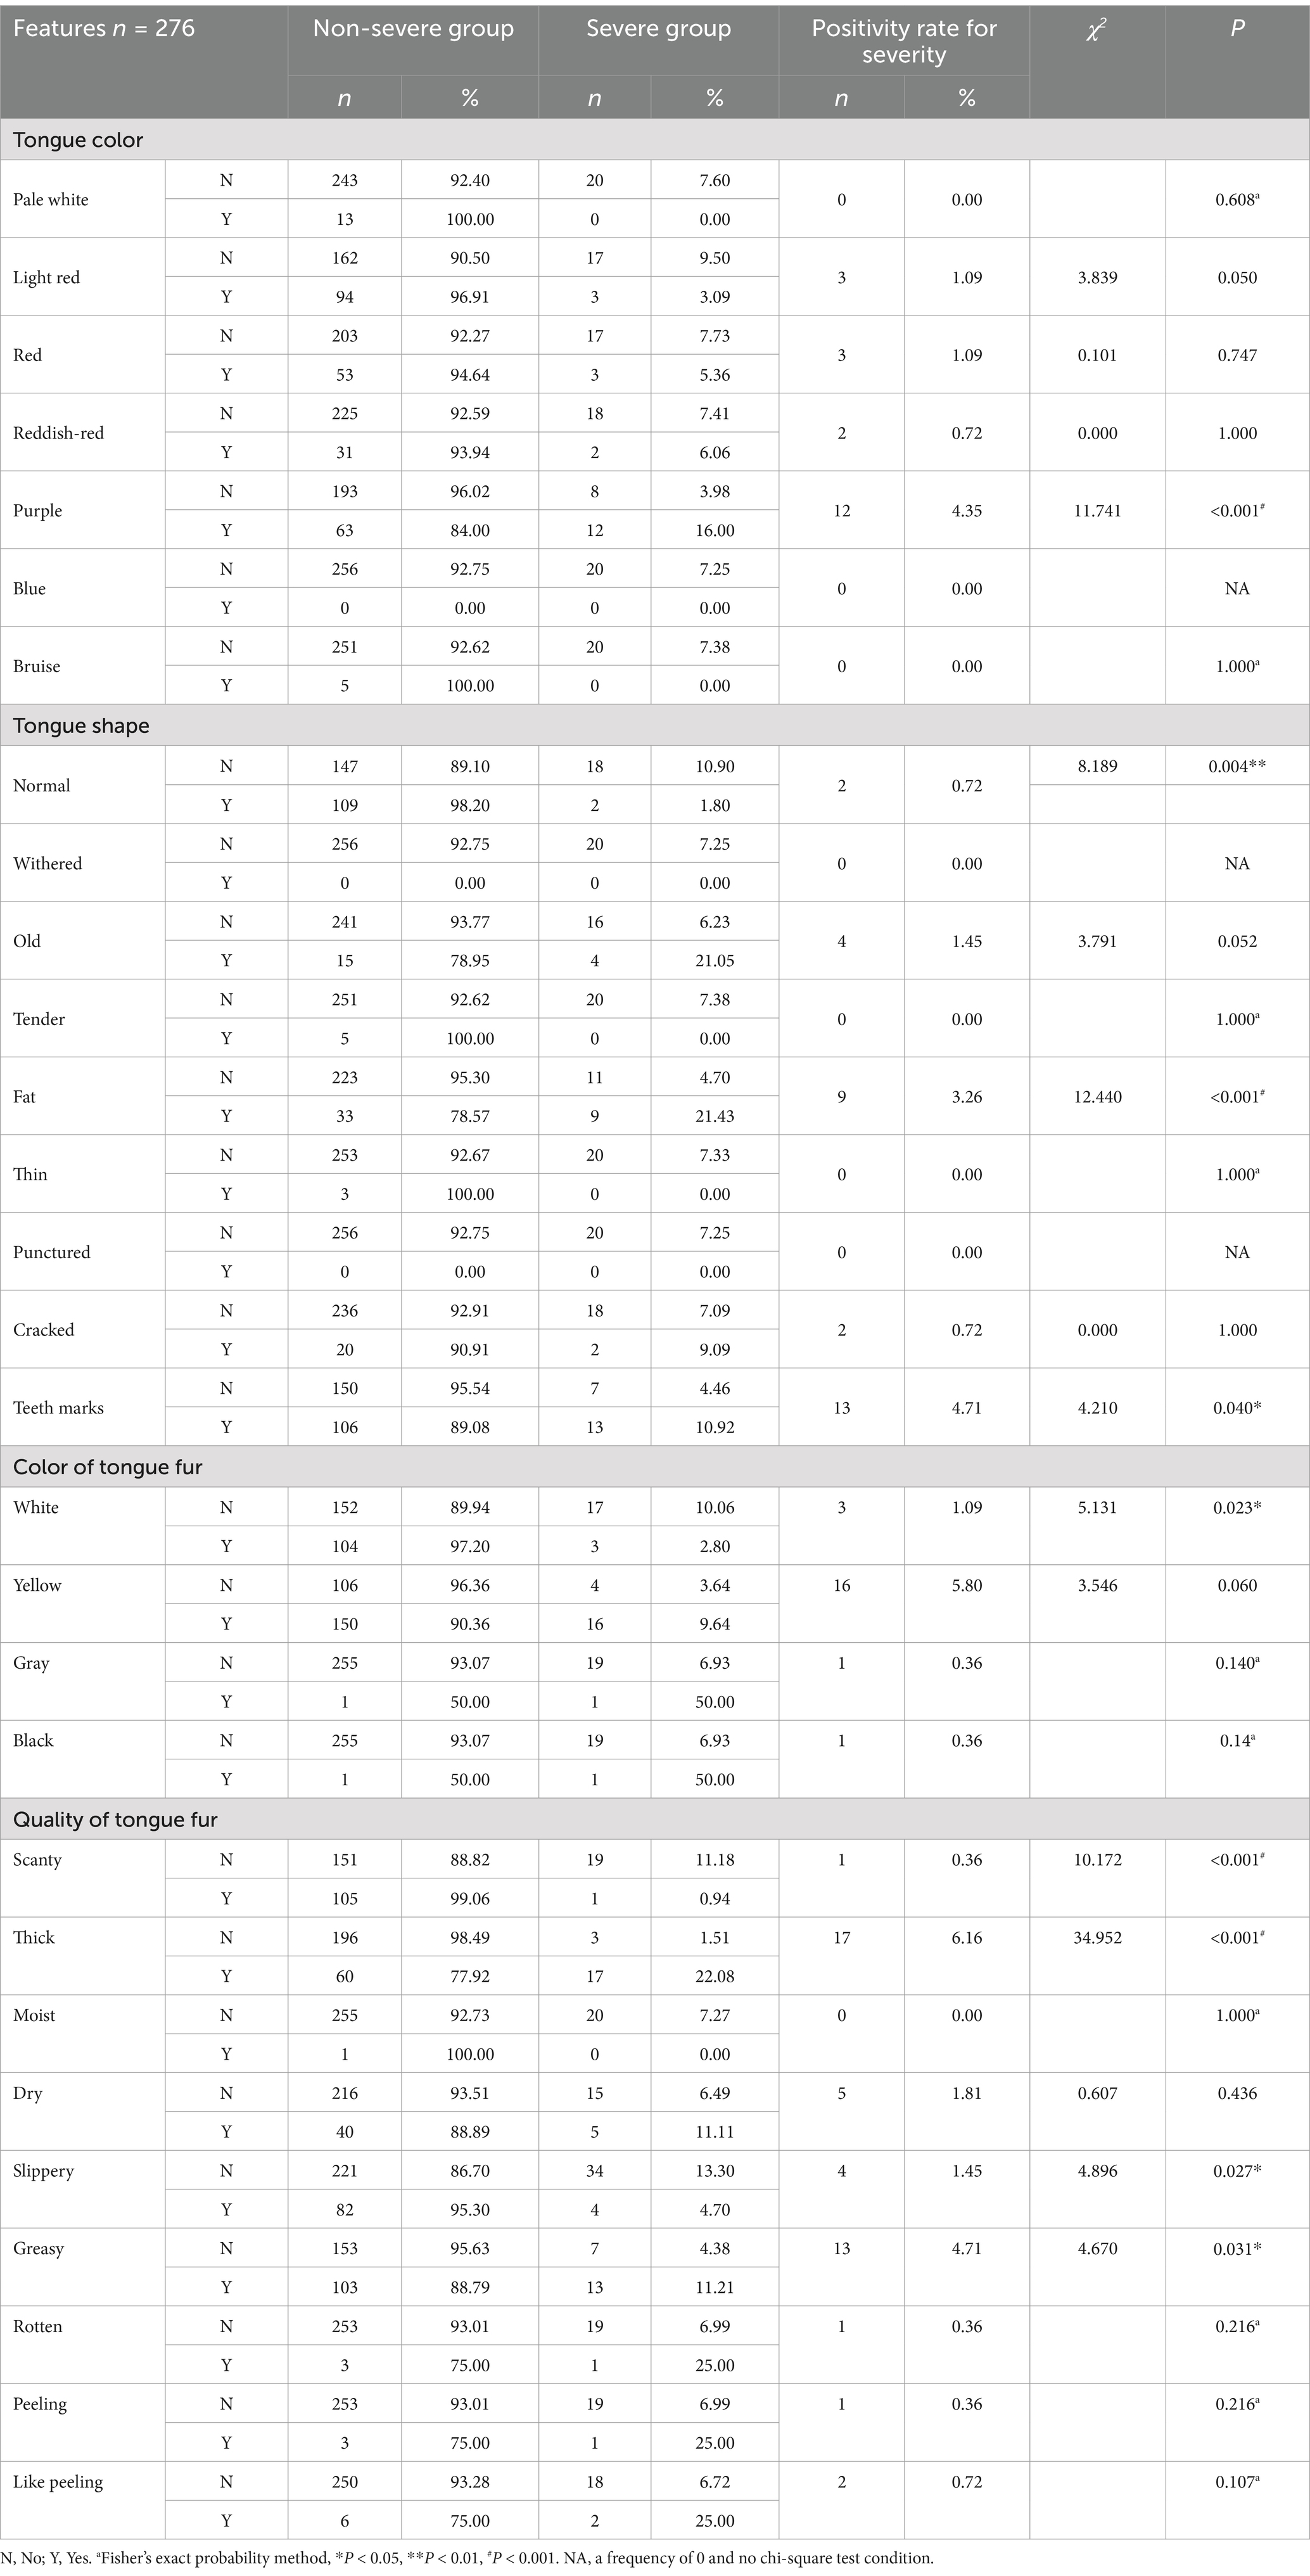
Table 6. Univariate analysis of tongue features.
In the univariate analysis of testing information, indicators with a positive rate of <3% for severity (such as PT, INR, TT, APTT, and CKMB) were excluded. Finally, nine indicators, namely NE (p = 0.007), LY (p < 0.001), PLT (p < 0.001), IL-6 (p < 0.001), PCT (p < 0.001), D-D (p < 0.001), CK (p < 0.001), AST (p < 0.001), and LDH (p < 0.001), were included, as shown in Table 7. Among them, CRP, IL-6, FDP, and D-D are highly correlated. Previous studies (20, 21) support the greater significance of IL-6, while D-D has a higher positivity rate. A lower p-value was selected for inclusion.
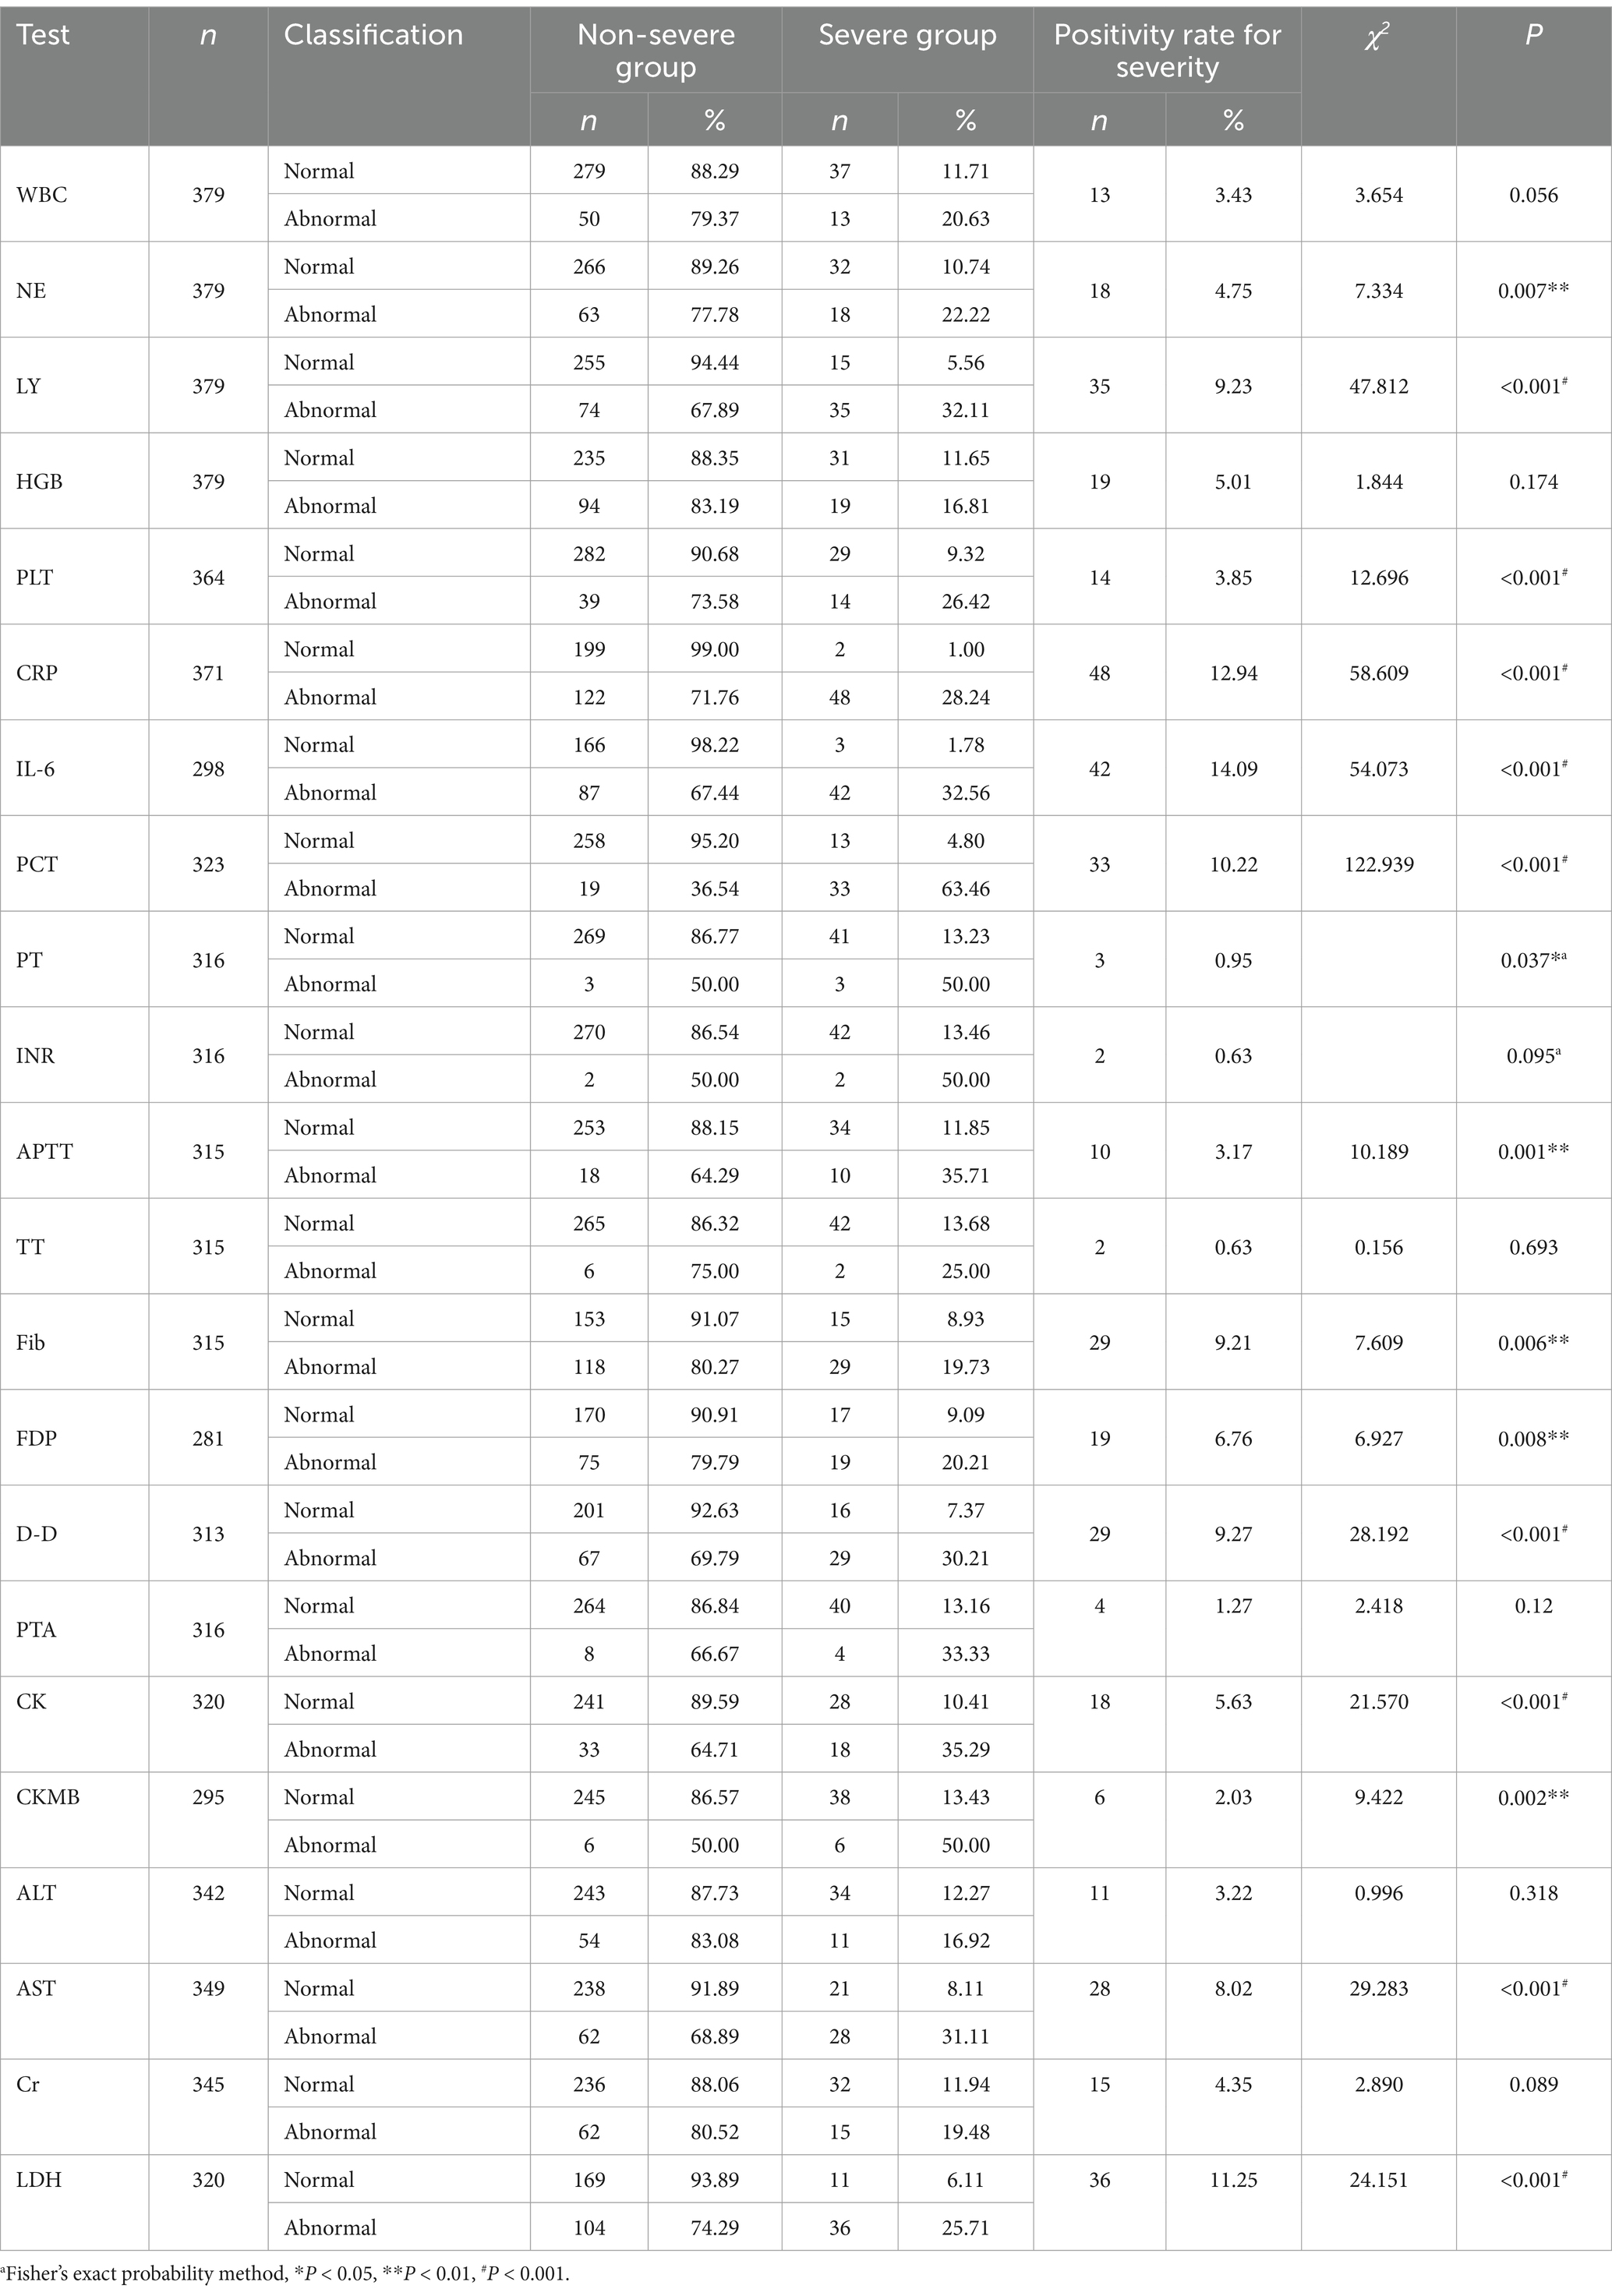
Table 7. Univariate analysis of testing information.
3.2 Binary unconditional stepwise logistic analysis
1 Warning indicators of severity without testing information.
Including positive indicators of general information (four items), clinical symptom (six items), and tongue feature (five items), with severity or not as an outcome, through binary unconditional stepwise logistic analysis, we obtained four correlations, namely age (p < 0.001), fever (p < 0.001), fat tongue shape (p < 0.001), and thick tongue fur (p < 0.001), as shown in Table 8.
2 Warning indicators of severity without tongue feature.
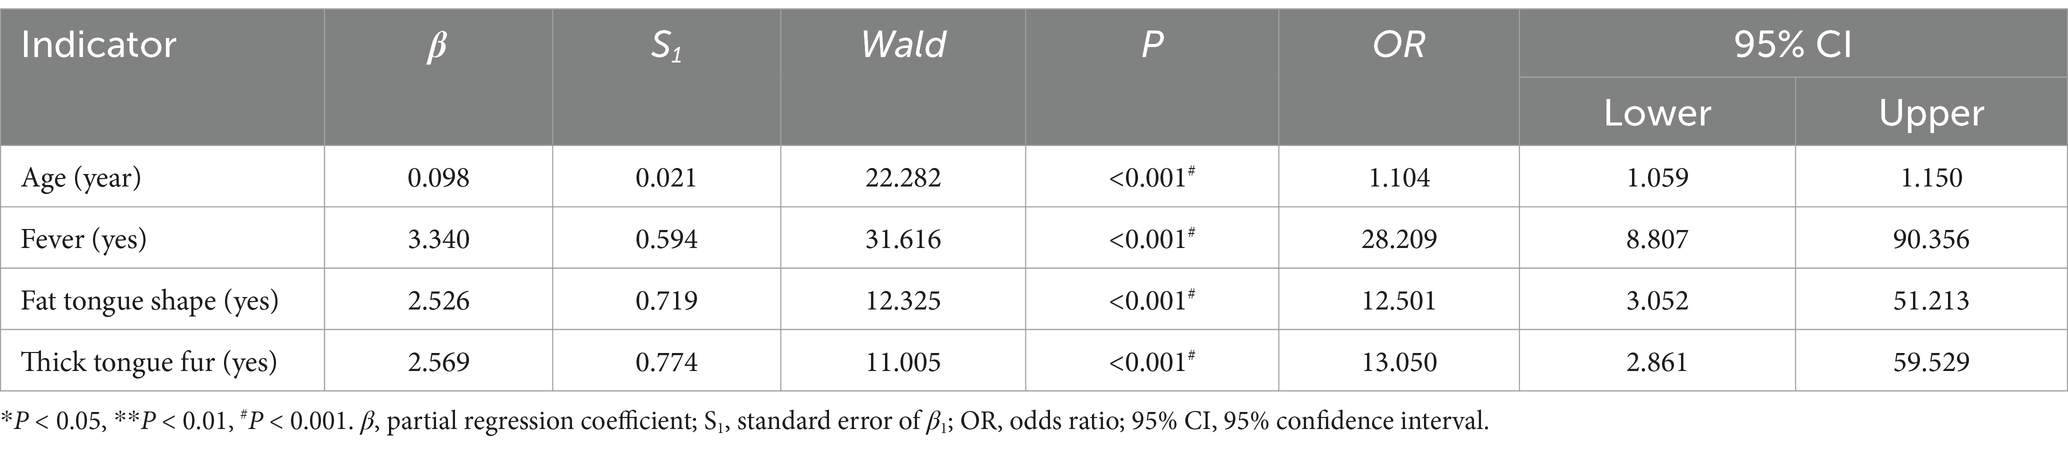
Table 8. Warning indicators of severity without testing information by logistic analysis.
Including positive indicators of general information (four items), clinical symptom (six items), and testing information (five items), with severity or not as an outcome, through binary unconditional stepwise logistic analysis, we obtained three correlations, namely age (p < 0.001), fever (p < 0.001), and PCT (p < 0.001), as shown in Table 9.
3 Aggregate indicators.

Table 9. Warning indicators of severity without tongue feature by logistic analysis.
Including positive indicators of the above two parts, with severity or not as an outcome, through binary unconditional stepwise logistic analysis, we obtained five correlations, namely age (p < 0.001), fever (p < 0.001), PCT (p < 0.001), thick tongue fur (p = 0.004), and fat tongue shape (p = 0.002), as shown in Table 10.
4 Model comparison.
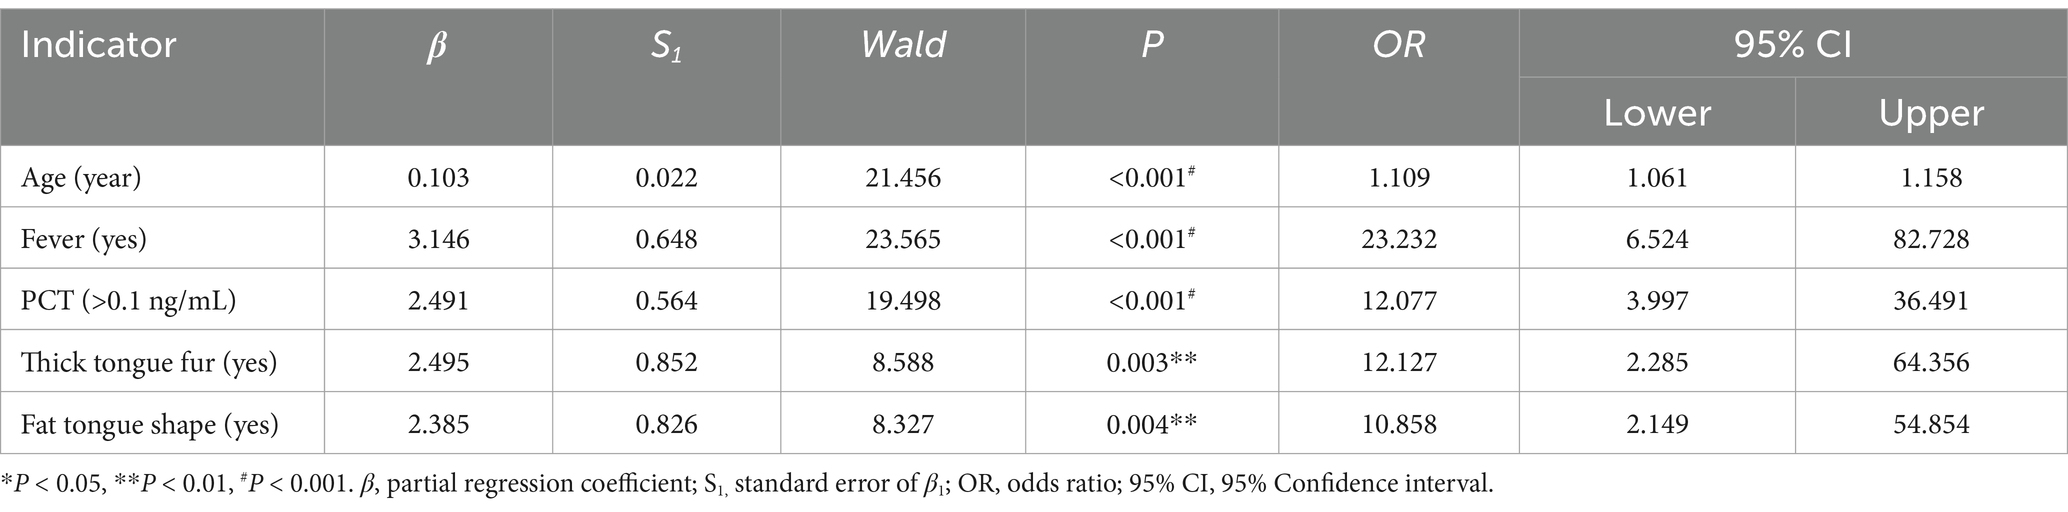
Table 10. Aggregate warning indicators of severity by logistic analysis.
We evaluated three logistic models using the Cox and Snell R and Negelkerke R methods. The closer the score is to 1, the better the fit. Aggregate indicators performed the best, as shown in Table 11.
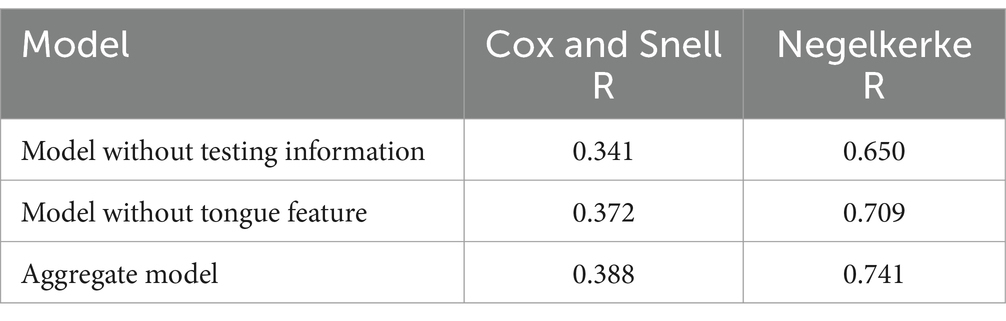
Table 11. Comparison of three logistic models.
4 Discussion
This study highlights the prognostic value of integrating traditional Chinese medicine (TCM) tongue features with clinical biomarkers. It has always been challenging to associate tongue features with systemic inflammation. Studies have found that increased reproductive activity of glossal epithelial cells is one of the main characteristics in the formation of thick, greasy tongue fur, and that increased vascular permeability is closely associated with its formation (22). COVID-19 is a virus that causes systemic inflammatory storms and a concomitant increase in vascular permeability. The oral cavity and intestine are the main distribution sites for human digestive bacteria. Some data suggest that the abundance of the same flora in both sites may follow a common change trend (23). Systemic immune dysfunction and bacteriological disorders, which are usually present in severe patients of COVID-19, may be related. Changes in tongue features are associated with systemic metabolism. A fat tongue is associated with abnormal upper airway patency and whole-body adiposity (24). This means that these patients have an underlying condition of airway problems and increased airway resistance and are also more likely to develop serious conditions, such as respiratory failure. These factors appear to be connected. Thick fur and fat shape reflect systemic inflammation and fluid retention in TCM theory, aligning with severe COVID-19 pathophysiology (e.g., cytokine storm, endothelial dysfunction, and airway problems).
According to Traditional Chinese Medicine theory, tongue diagnosis serves as a significant indicator for evaluating disease progression and severity. They help summarize the main etiologies of severe acute respiratory diseases from a TCM perspective (25). Studies have shown that the characteristics of the tongue and tongue coating in patients with severe acute respiratory syndrome are distinct, indicating a close relationship between the tongue appearance and the state of illness (26, 27). Other studies suggested that patients diagnosed with severe COVID-19 had a purple tongue and yellow tongue coating, while non-severe ones commonly had a light red tongue and white tongue coating. Tongue features can serve as potential indicators for evaluating disease prognosis (28). These studies suggest that while tongue features may predict disease progression, their relevance can vary over time, across locations, and with different strains.
This retrospective observational study may be subject to bias due to factors such as inaccurate data, patient memory errors, and different photo exposures. While we made every effort to verify the data, some bias may still exist. Moreover, different seasons and strains of the virus may produce variations in tongue features. This study was conducted during the summer amid the Delta variant pandemic.
5 Conclusion
Age, fever, PCT, thick tongue fur, and fat tongue shape together form a robust predictive model for COVID-19 severity. TCM-derived indicators contribute to early risk stratification, particularly in settings with limited laboratory access. Further validation across diverse populations and variants is warranted.
Data availability statement
The original contributions presented in the study are included in the article/Supplementary material, further inquiries can be directed to the corresponding authors.
Ethics statement
The studies involving humans were approved by the Ethics Committee of Guangdong Provincial Hospital of Chinese Medicine: BF2021-113-01; Ethics Committee of Xiamen Hospital of Chinese Medicine: 2022-K017-01. The studies were conducted in accordance with the local legislation and institutional requirements. Written informed consent for participation in this study was provided by the participants’ legal guardians/next of kin. Written informed consent was obtained from the individual(s), and minor(s)’ legal guardian/next of kin, for the publication of any potentially identifiable images or data included in this article.
Author contributions
ZJ: Writing – original draft. LY: Methodology, Supervision, Writing – review & editing. ZD: Data curation, Investigation, Writing – review & editing. YG: Methodology, Supervision, Writing – review & editing. CQ: Data curation, Resources, Supervision, Writing – review & editing. HJ: Data curation, Formal analysis, Writing – review & editing. WJ: Data curation, Investigation, Writing – review & editing. MZ: Data curation, Investigation, Writing – review & editing. ZZ: Supervision, Writing – review & editing.
Funding
The author(s) declare that financial support was received for the research and/or publication of this article. This study was supported by the Xiamen Municipal Program for Supporting Chinese Medicine (no.: XWZY-2023-0612), 2022 Xiamen Health Guidance Program (no: 3502Z20224ZD1179), Innovation Team and Talents Cultivation Program of National Administration of Traditional Chinese Medicine (no.: ZYYCXTD-D-202203), Xiamen Young and Middle-aged TCM Reserve Talents Training Project, and The Fifth Batch of National Traditional Chinese Medicine Excellent Clinical Talents Training Project (Announcement from the Personnel and Education Department of the National Administration of Traditional Chinese Medicine. no. 2022–1).
Conflict of interest
The authors declare that the research was conducted in the absence of any commercial or financial relationships that could be construed as a potential conflict of interest.
Publisher’s note
All claims expressed in this article are solely those of the authors and do not necessarily represent those of their affiliated organizations, or those of the publisher, the editors and the reviewers. Any product that may be evaluated in this article, or claim that may be made by its manufacturer, is not guaranteed or endorsed by the publisher.
Supplementary material
The Supplementary material for this article can be found online at: https://www.frontiersin.org/articles/10.3389/fmed.2025.1500605/full#supplementary-material
References
1. WHO Coronavirus (COVID-19) Dashboard. (2023). Available online at: https://covid19.who.int (accessed August 2, 2023).
2. WHO Director-General’s opening remarks at the Global Forum for Vaccine Sovereignty and Innovation (2024). Available online at: https://www.who.int/director-general/speeches/detail/who-director-general-s-opening-remarks-at-the-global-forum-for-vaccine-sovereignty-and-innovation-20-june-2024 (accessed July 13, 2024).
3. Nakanishi, T, Pigazzini, S, Degenhardt, F, Cordioli, M, Butler-Laporte, G, Maya-Miles, D, et al. Age-dependent impact of the major common genetic risk factor for COVID-19 on severity and mortality. J Clin Invest. (2021) 131:e152386. doi: 10.1172/JCI152386
4. Erener, S. Diabetes, infection risk and COVID-19. Mol Metab. (2020) 39:101044. doi: 10.1016/j.molmet.2020.101044
5. Petrakis, D, Margină, D, Tsarouhas, K, Tekos, F, Stan, M, Nikitovic, D, et al. Obesity - a risk factor for increased COVID-19 prevalence, severity and lethality (review). Mol Med Rep. (2020) 22:9–19. doi: 10.3892/mmr.2020.11127
6. Angeli, F, Masnaghetti, S, Visca, D, Rossoni, A, Taddeo, S, Biagini, F, et al. Severity of COVID-19: the importance of being hypertensive. Monaldi Arch Chest Dis. (2020) 90:1372. doi: 10.4081/monaldi.2020.1372
7. Zanella, I, Zacchi, E, Piva, S, Filosto, M, Beligni, G, Alaverdian, D, et al. C9orf72 intermediate repeats confer genetic risk for severe COVID-19 pneumonia independently of age. Int J Mol Sci. (2021) 22:6991. doi: 10.3390/ijms22136991
8. Sisay, G, Mantefardo, B, and Beyene, A. Time from symptom onset to severe COVID-19 and risk factors among patients in southern Ethiopia: a survival analysis. J Int Med Res. (2022) 50:3000605221119366. doi: 10.1177/03000605221119366
9. Liu, Z-M, Li, J-P, Wang, S-P, Chen, D-Y, Zeng, W, Chen, S-C, et al. Association of Procalcitonin Levels with the progression and prognosis of hospitalized patients with COVID-19. Int J Med Sci. (2020) 17:2468–76. doi: 10.7150/ijms.48396
10. Abou-Ismail, MY, Diamond, A, Kapoor, S, Arafah, Y, and Nayak, L. The Hypercoagulable state in COVID-19: incidence, pathophysiology, and management. Thromb Res. (2020) 194:101–15. doi: 10.1016/j.thromres.2020.06.029
11. Han, Y, Zhang, H, Mu, S, Wei, W, Jin, C, Tong, C, et al. Lactate dehydrogenase, an independent risk factor of severe COVID-19 patients: a retrospective and observational study. Aging. (2020) 12:11245–58. doi: 10.18632/aging.103372
12. Jia, F, Wang, G, Xu, J, Long, J, Deng, F, and Jiang, W. Role of tumor necrosis factor-α in the mortality of hospitalized patients with severe and critical COVID-19 pneumonia. Aging. (2021) 13:23895–912. doi: 10.18632/aging.203663
13. Li, Y, Yang, S, Peng, D, Zhu, H-M, Li, B-Y, Yang, X, et al. Predictive value of serum cystatin C for risk of mortality in severe and critically ill patients with COVID-19. World J Clin Cases. (2020) 8:4726–34. doi: 10.12998/wjcc.v8.i20.4726
14. Yunhu, C, Moqing, Y, Lihua, F, Xuechun, J, Tao, Z, Xingyu, Z, et al. Mirror-like tongue is an important predictor of acute heart failure: a cohort study of acute heart failure in Chinese patients. J Tradit Chin Med. (2023) 43:1243–51. doi: 10.19852/j.cnki.jtcm.20230904.004
15. Li, G-Z, He, Z, Shao, F-F, Ou, A-H, and Lin, X-Z. Patient classification of hypertension in traditional Chinese medicine using multi-label learning techniques. BMC Med Genet. (2015) 8:S4. doi: 10.1186/1755-8794-8-S3-S4
16. Liang, B, Li, R, Lu, J, Tian, X-J, and Gu, N. Tongue diagnostic parameters-based diagnostic signature in coronary artery disease patients with Clopidogrel resistance after percutaneous coronary intervention. Explore. (2023) 19:528–35. doi: 10.1016/j.explore.2022.10.018
17. Li, J, Huang, J, Jiang, T, Tu, L, Cui, L, Cui, J, et al. A multi-step approach for tongue image classification in patients with diabetes. Comput Biol Med. (2022) 149:105935. doi: 10.1016/j.compbiomed.2022.105935
18. The State Council, The People’s Republic of China. Diagnosis and Treatment Protocol for COVID-19 (Trial Version 10) [EB/OL] (2024). Available online at: https://www.gov.cn/zhengce/zhengceku/2023–01/06/5735343/files/5844ce04246b431dbd322d8ba10afb48.pdf (accessed July 26, 2024).
19. Zhu, W. Diagnostics of traditional Chinese medicine. Beijing: People’s Medical Publishing House (1999).
20. Chandna, A, Mahajan, R, Gautam, P, Mwandigha, L, Gunasekaran, K, Bhusan, D, et al. Facilitating safe discharge through predicting disease progression in moderate coronavirus disease 2019 (COVID-19): a prospective cohort study to develop and validate a clinical prediction model in resource-limited settings. Clin Infect Dis. (2022) 75:e368–79. doi: 10.1093/cid/ciac224
21. Haroun, RA, Osman, WH, Amin, RE, Eessa, AM, and Saad, S. Increased serum Interleukin-6 and lactate dehydrogenase levels among nonsurvival severe COVID-19 patients when compared to survival ones. Int Immunopharmacol. (2023) 122:110626. doi: 10.1016/j.Intimp.2023.110626
22. Qi, WJ, Zhang, MM, Wang, H, Wen, Y, Wang, BE, and Zhang, SW. Research on the relationship between thick greasy tongue Fur formation and vascular endothelial cell permeability with the protein expression of zonula Occludens-1. Chin J Integr Med. (2011) 17:510–6. doi: 10.1007/S11655-011-0784-1
23. Guo, XJ, Jiang, T, Ma, XX, Hu, XJ, Huang, JB, Cui, LT, et al. Relationships between diurnal changes of tongue coating microbiota and intestinal microbiota. Front Cell Infect Microbiol. (2022) 12:813790. doi: 10.3389/Fcimb.2022.813790
24. Godoy, IR, Martinez-Salazar, EL, Eajazi, A, Genta, PR, Bredella, MA, and Torriani, M. Fat accumulation in the tongue is associated with male gender, abnormal upper airway patency and whole-body adiposity. Metabolism. (2016) 65:1657–63. doi: 10.1016/j.Metabol.2016.08.008
25. Wen, Z, Min, C, Ding, S, Li, S, Wei, LU, Xiangru, XU, et al. Tongue and pulse features of 668 asymptomatic patients infected with the severe acute respiratory syndrome coronavirus 2 omicron variant in Shanghai. J Tradit Chin Med. (2022) 42:1006–11. doi: 10.19852/j.cnki.jtcm.20220922.004
26. Zou, JP, Wang, WD, and Li, GX. Study on relationship between quantitative data of tongue picture and state of illness in 224 patients with severe acute respiratory syndrome. Zhongguo Zhong Xi Yi Jie He Za Zhi. (2003) 23:740–3. Chinese.
27. Liang, K, Huang, X, Chen, H, Qiu, L, Zhuang, Y, Zou, C, et al. Tongue diagnosis and treatment in traditional Chinese medicine for severe COVID-19: a case report. Ann Palliat Med. (2020) 9:2400–7. doi: 10.21037/apm-20-1330
Keywords: COVID-19, severity prediction, traditional Chinese medicine, tongue diagnosis, biomarkers
Citation: Jing Z, Yuntao L, Danwen Z, Gangfu Y, Qiumin C, Jianshan H, Jiamei W, Zengming M and Zhongde Z (2025) Warning indicators of COVID-19 severity: a retrospective observational study integrating modern biomarkers and traditional tongue features. Front. Med. 12:1500605. doi: 10.3389/fmed.2025.1500605
Edited by:
Elisa Belluzzi, University of Padua, ItalyReviewed by:
Namyata Pathak, University of California, San Francisco, United StatesRyuichiro Araki, Saitama Medical University, Japan
Copyright © 2025 Jing, Yuntao, Danwen, Gangfu, Qiumin, Jianshan, Jiamei, Zengming and Zhongde. This is an open-access article distributed under the terms of the Creative Commons Attribution License (CC BY). The use, distribution or reproduction in other forums is permitted, provided the original author(s) and the copyright owner(s) are credited and that the original publication in this journal is cited, in accordance with accepted academic practice. No use, distribution or reproduction is permitted which does not comply with these terms.
*Correspondence: Zhang Jing, MTc0Njk3MDQyNkBxcS5jb20=; Zhang Zhongde, ZGVzaHU5OTY2QDE2My5jb20=