Abstract
Purpose:
We aimed to investigate the potential association between the aggregate index of systemic inflammation (AISI) and chronic kidney disease (CKD).
Patients and methods:
This study analyzed data from the National Health and Nutrition Examination Survey (NHANES) spanning 1999 to 2018. CKD was defined as either an estimated glomerular filtration rate (eGFR) of less than 60 mL/min/1.73 m2 or the presence of albuminuria, defined as a urine albumin-to-creatinine ratio (ACR) of 30 mg/g or higher. Low eGFR is an eGFR of less than 60 mL/min/1.73 m2. Multivariate regression analysis, smoothed curve fitting, and subgroup analyses were conducted to investigate the relationship between the Inflammatory status index (AISI) and CKD. The receiver operating characteristic (ROC) curve analysis was used to evaluate its ability to identify CKD and low eGFR. The AISI was transformed using the natural logarithm (Ln) for statistical analysis.
Results:
Of the 50,768 recruits, 49.86% were male. The prevalence of CKD and low eGFR was 20.31% and 8.57%, respectively. Ln-AISI was positively associated with CKD (OR = 1.24; 95% CI: 1.19, 1.28) and low eGFR (OR = 1.17; 95% CI:1.11, 1.24). Smooth curve fitting revealed a positive association between AISI and CKD and low eGFR. Subgroup analysis and interaction tests indicated that stratifications did not significantly alter the association between AISI and CKD and low eGFR. Threshold effect analysis indicated that this relationship became more pronounced when Ln-AISI exceeded 5.2 (AISI > 181.27). The ROC analysis showed that AISI had better discrimination and accuracy for identifying CKD and low eGFR compared to other inflammatory indicators [lymphocyte count (LYM), systemic immune-inflammation index (SII), platelet-to-lymphocyte ratio (PLR), and the product of platelet count and neutrophil count (PPN)].
Conclusion:
AISI was significantly and positively correlated with the prevalence of CKD, and this relationship was more potent when AISI was greater than 181.27. Compared with other inflammatory indicators, AISI was more effective in identifying CKD.
Introduction
Chronic kidney disease (CKD), defined by a low estimated glomerular filtration rate (eGFR) or elevated albuminuria, is recognized as one of the top 10 global prognostic factors (1). Patients with CKD commonly exhibit hypertension, atherosclerosis, abnormal lipid metabolism, chronic inflammation, and oxidative stress (2). Chronic inflammation and oxidative stress worsen endothelial damage, forming unstable atherosclerotic plaques (3–5). Inflammation, obesity, diabetes mellitus, hypertension, and hyperlipidemia are established risk factors for CKD (6, 7). Inflammation, as a critical risk factor, is pivotal in developing effective therapeutic strategies to prevent the onset and progression of CKD in clinical practice.
The aggregate index of systemic inflammation (AISI), also known as the pan-immune-inflammation value (PIV), is a marker that evaluates systemic inflammation through key components of the complete blood count (CBC), including neutrophils (NEU), platelets (PLT), monocytes (MONO), and lymphocytes (LYM). AISI is calculated using the formula: AISI = (NEU * PLT * MONO) / LYM. AISI has been investigated as a novel inflammatory marker in patients with rheumatoid arthritis, hypertension, proteinuria, and certain cancers (8–12). It has demonstrated the ability to identify specific diseases and assess prognosis. Previous studies have shown that inflammation is associated with kidney damage and that AISI is a more comprehensive inflammatory indicator than SII and SIRI. It can more comprehensively evaluate the systemic inflammatory state and is superior in assessing proteinuria (10). However, no studies have investigated the relationship between AISI and CKD or low eGFR. Therefore, this study aims to explore the association between AISI and CKD using data from the National Health and Nutrition Examination Survey (NHANES).
Methodology
Study population
The National Health and Nutrition Examination Survey (NHANES) is a key initiative sponsored by the US Centers for Disease Control and Prevention (CDC) to evaluate the health and nutritional status of the US population. This study utilized data from 10 NHANES cycles spanning 1999 to 2018, comprising 101,316 participants. After excluding participants with missing albumin-creatinine ratio (ACR), eGFR, and AISI data, pregnant women, and those under 18, the final cohort comprised 50,768 subjects. The National Center approved the study for the Health Statistics Research Ethics Review Board, and all participants provided informed consent. Detailed information on the publicly available NHANES study design and data can be accessed at https://wwwn.cdc.gov/nchs/nhanes/default.aspx. The inclusion and exclusion process is illustrated in Figure 1.
FIGURE 1
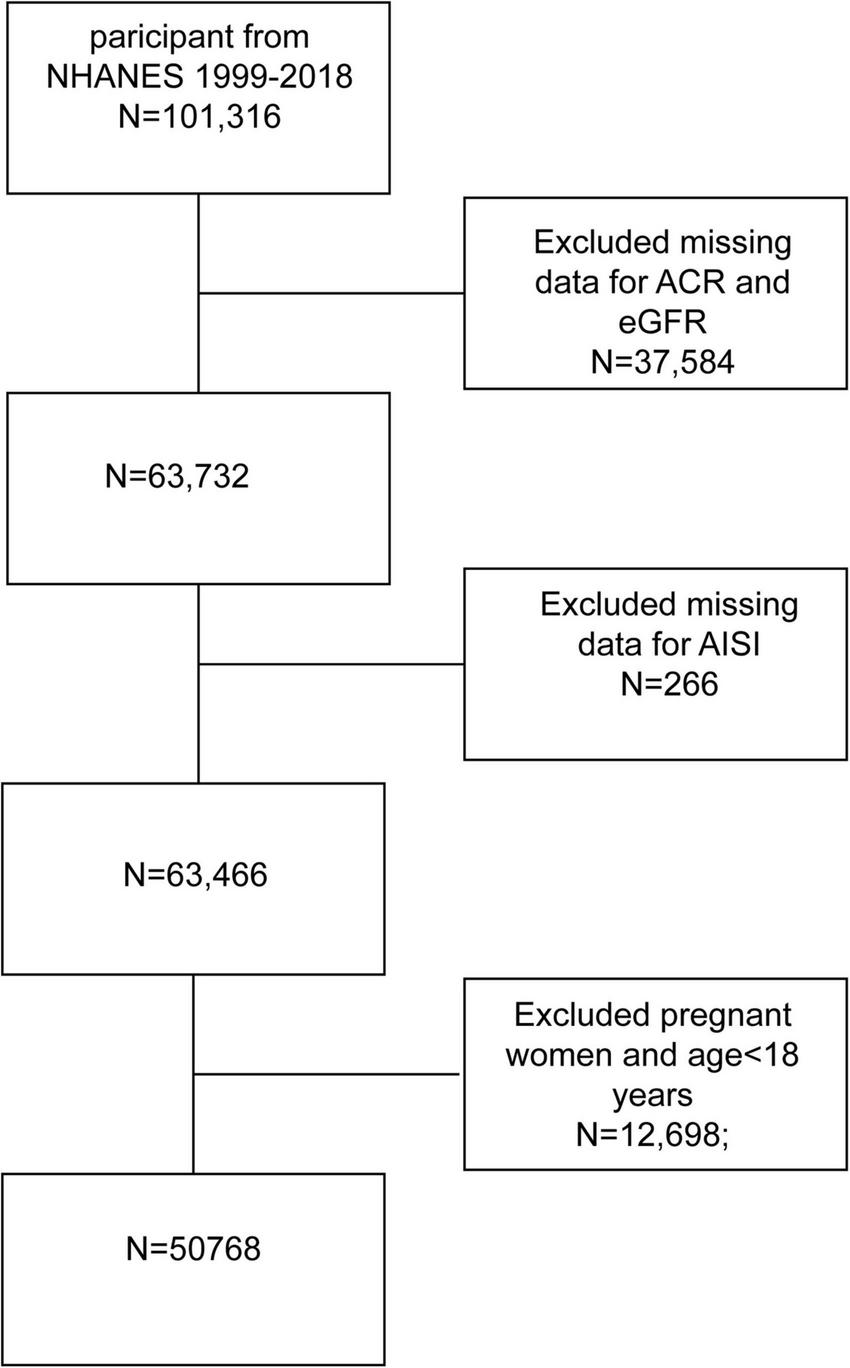
Flowchart of participant selection. NHANES, National Health and Nutrition Examination Survey; AISI, aggregate index of systemic inflammation.
Aggregate index of systemic inflammation definition
AISI is a biomarker to evaluate systemic inflammation. It is derived from the complete blood count (CBC) components. Using a single-beam photometer involves automated sample processing, including dilution, mixing, and hemoglobin determination. In the NHANES Mobile Examination Center (MEC), the Beckman Coulter DxH 800 device conducts CBC analysis on blood samples, providing blood cell distribution, including neutrophils (NEU), platelets (PLT), monocytes (MONO), and lymphocytes (LYM). AISI is calculated as (NEU * PLT * MONO)/LYM (13). AISI was log-transformed (Ln) for the regression analysis due to its right-skewed distribution.
Diagnosis of CKD
According to prior studies on CKD using the NHANES database, CKD was diagnosed based on proteinuria or an eGFR below 60 mL/min/1.73 m2 (14–17). The eGFR was calculated using the chronic kidney disease epidemiology collaboration (CKD-EPI) equation with standardized creatinine (18). An eGFR of less than 60 mL/min/1.73 m2 was classified as low eGFR. Previous studies have demonstrated a relationship between AISI and proteinuria (10); thus, our study’s outcome variables were CKD and low eGFR.
Selection of covariates
Covariates that could potentially influence the association between AISI and proteinuria were included in this study. The covariates included sex (male/female), age (< 60 years/≥ 60 years), ethnicity (Mexican American/Other Hispanic/Non-Hispanic White/Non-Hispanic Black/Other), an education level (less than high school/high school or equivalent/college graduate or above), marital status (married/widowed/divorced or separated/never married/living with a partner), poverty-to-income ratio (PIR: < 1.3, 1.3–3.49, ≥ 3.5), smoking status (current smokers/nonsmokers/former smokers), alcohol consumption (current drinkers/nondrinkers/former drinkers), physical activity (vigorous activity/moderate activity), body mass index (BMI: < 25, 25–30, > 30 kg/m2), hypertension (yes/no), diabetes mellitus (yes/no), alanine aminotransferase (ALT, IU/L), aspartate aminotransferase (AST, IU/L), triglycerides (TG, mmol/L), low-density lipoprotein cholesterol (LDL-C, mmol/L), albumin (ALB, g/L), and blood uric acid (UA, mg/dL). Physical activity was categorized as vigorous (yes/no) or moderate (yes/no). Participants who reported smoking at least 100 cigarettes in their lifetime and were smoking at the time of the survey were classified as current smokers. Former smokers were defined as those who had smoked at least 100 cigarettes in their lifetime but were not smoking at the time of the survey. Additionally, men who had smoked fewer than 100 cigarettes in their lifetime were classified as non-smokers. A non-drinker was a participant who answered “no” to having consumed at least 12 alcoholic beverages in their lifetime or any single year. In this study, men who answered “yes” to having consumed 12 alcoholic drinks in their lifetime or any single year but had not consumed any in the past 12 months were classified as former drinkers. Participants who answered “yes” to consuming 12 alcoholic beverages in their lifetime or any single year and had consumed at least one in the past 12 months were classified as current drinkers. Participants were considered diabetic if a physician had diagnosed them, had a fasting blood glucose level ≥ 7.0 mmol/L, glycosylated hemoglobin ≥ 6.5%, a 75 g oral glucose tolerance test result ≥ 200 mg/dL, or were using glucose-lowering medications or insulin. Hypertension was defined as systolic blood pressure ≥ 130 mmHg, diastolic blood pressure ≥ 80 mmHg, a doctor’s diagnosis of high blood pressure, or current use of prescription medication for hypertension. Detailed measurement procedures for these variables are publicly available at https://wwwn.cdc.gov/nchs/nhanes/default.aspx.
Statistical analysis
In line with the Centers for Disease Control and Prevention (CDC) recommendations, all statistical analyses accounted for the complex sample design of a multistage cohort survey. Continuous variables were expressed as means and standard deviations, and categorical variables were expressed as percentages. Differences in continuous variables across AISI tertiles were assessed using the Kruskal-Wallis rank sum test, while differences in categorical variables across AISI tertiles were assessed using chi-square tests. We found that the AISI data is skewed. Therefore, we must perform an Ln transformation on the values before performing the statistical analysis (Supplementary Figures 1, 2). We used multivariate regression models to examine the association between Ln-AISI and CKD and low eGFR (Models 1–3). Model 1 was unadjusted for any covariates. Model 2 adjusted for sex, age, and race. Model 3 adjusted for gender, age, race, albumin (Alb), body mass index (BMI), education level, marital status, poverty income ratio (PIR), serum uric acid (UA), triglycerides (TG), low-density lipoprotein (LDL), diabetes, alcohol consumption, hypertension, vigorous and moderate physical activity, smoking status, alanine aminotransferase (ALT), and aspartate aminotransferase (AST). To evaluate robustness, we transformed AISI from a continuous variable to a categorical variable (tertiles) for sensitivity analysis. We addressed nonlinearity by applying smooth curve fitting and generalized additive models (GAM). When nonlinear correlations were present, a two-stage linear regression model (segmented regression) was fitted to each interval to estimate threshold effects. A two-step recursive method was employed to further identify breakpoints (K) (The specific methods and explanations of the principles can be found in Supplementary Data Sheet 1). Subgroup analyses were conducted using stratified multivariate logistic regression models [sex, age, poverty-to-income ratio (PIR), BMI, hypertension, diabetes, smoking, alcohol consumption, education, race, and physical activity] to assess the association between AISI and CKD and low eGFR. These stratification variables were also considered as potential effect modifiers to evaluate the heterogeneity of the associations between subgroups. Finally, we compared the ability of AISI and other inflammatory markers (LYM, SII, PLR, PPN) to identify CKD and low eGFR using receiver operating characteristic (ROC) curves and area under the curve (AUC) values. Multiple imputations were applied to handle missing values in categorical and continuous variables. All statistical analyses were performed using R version 4.1.3 and Empower software.1 Statistical significance was defined as a p-value < 0.05.
Results
Baseline characteristics of participants
The study included 50,768 participants, of which 25,311 were men (49.86%) and 25,475 were women (50.14%). Of the participants, 16,420 (32.34%) were aged over 60 years, and 10,312 (20.31%) and 4,350 (8.57%) had been diagnosed with CKD and low eGFR, respectively. Table 1 presents the clinical characteristics of participants stratified by AISI tertiles. Significant differences were found for age, race, education level, marital status, body mass index (BMI), poverty-income ratio (PIR), hypertension, diabetes, alcohol consumption, smoking status, and inflammatory indicators (AISI, LYM, SII, PLR, PPN) (all p < 0.001). No significant differences were found for gender and moderate activity (p > 0.05).
TABLE 1
| Variables | Tertiles of Ln-AISI | P-value | ||
| T1 | T2 | T3 | ||
| N | 16,921 | 16,924 | 16,923 | |
| ALB, (g/l) | 42.73 ± 3.36 | 42.76 ± 3.32 | 42.32 ± 3.66 | < 0.001 |
| UA, (mg/dL) | 5.32 ± 1.40 | 5.44 ± 1.41 | 5.58 ± 1.50 | < 0.001 |
| AISI | 128.28 ± 40.13 | 254.01 ± 40.00 | 570.12 ± 377.78 | < 0.001 |
| ACR (mg/g) | 32.18 ± 290.93 | 41.93 ± 326.06 | 64.59 ± 449.94 | < 0.001 |
| TG, (mmol/L) | 1.42 ± 1.76 | 1.59 ± 1.83 | 1.59 ± 1.83 | < 0.001 |
| LDL-C (mmol/L) | 2.93 ± 0.70 | 2.94 ± 0.65 | 2.92 ± 0.62 | 0.007 |
| ALT, (U/L) | 24.85 ± 17.84 | 25.35 ± 20.31 | 25.28 ± 31.98 | < 0.001 |
| AST, (U/L) | 25.11 ± 18.80 | 25.02 ± 20.69 | 26.69 ± 18.92 | < 0.001 |
| LYM, (1,000 cells/ul) | 2.28 ± 3.35 | 2.16 ± 0.71 | 2.07 ± 0.73 | < 0.001 |
| SII | 308.11 ± 114.15 | 494.05 ± 148.75 | 848.46 ± 485.75 | < 0.001 |
| PLR | 108.00 ± 37.76 | 125.93 ± 43.05 | 153.70 ± 62.33 | < 0.001 |
| PPN | 649.66 ± 256.12 | 1,022.72 ± 327.49 | 1,636.16 ± 938.36 | < 0.001 |
| eGFR (mL/min/1.73m2) | < 0.001 | |||
| < 60 | 1,048 (6.19%) | 1,329 (7.85%) | 1,973 (11.66%) | |
| ≥ 60 | 15,873 (93.81%) | 15,595 (92.15%) | 14,950 (88.34%) | |
| BMI, n (%) | < 0.001 | |||
| < 25 | 5,926 (35.02%) | 5,028 (29.71%) | 4,790 (28.30%) | |
| ≥ 25, < 30 | 5,745 (33.95%) | 5,924 (35.00%) | 5,632 (33.28%) | |
| ≥ 30 | 5,250 (31.03%) | 5,972 (35.29%) | 6,501 (38.42%) | |
| Gender, n (%) | 0.122 | |||
| Male | 8,358 (49.39%) | 8,411 (49.70%) | 8,542 (50.48%) | |
| Female | 8,563 (50.61%) | 8,513 (50.30%) | 4,969 (36.13%) | |
| Age, n (%) | < 0.001 | |||
| < 60 | 11,889 (70.26%) | 11,571 (68.37%) | 10,888 (64.34%) | |
| ≥ 60 | 5,032 (29.74%) | 5,353 (31.63%) | 6,035 (35.66%) | |
| Race, n (%) | < 0.001 | |||
| Mexican American | 2,856 (16.88%) | 2,410 (17.55%) | 2,922 (21.24%) | |
| Other Hispanic | 1,360 (8.04%) | 1,494 (8.83%) | 1,321 (7.81%) | |
| Non-Hispanic White | 5,461 (32.27%) | 7,687 (45.42%) | 8,910 (52.65%) | |
| Non-Hispanic Black | 5,307 (31.36%) | 2,938 (17.36%) | 2,276 (13.45%) | |
| Other Race | 1,937 (11.45%) | 1,490 (8.80%) | 1,227 (7.25%) | |
| Education, n (%) | < 0.001 | |||
| Under high school | 4,224 (24.96%) | 4,246 (25.09%) | 4,285 (25.32%) | |
| High school or equivalent | 3,366 (19.89%) | 3,598 (21.26%) | 3,959 (23.39%) | |
| College graduate or above | 9,331 (55.14%) | 9,080 (53.65%) | 8,679 (51.29%) | |
| Marital status, n (%) | < 0.001 | |||
| Married | 9,119 (53.89%) | 9,166 (54.16%) | 8,580 (50.70%) | |
| Widowed | 1,167 (6.90%) | 1,276 (7.54%) | 935 (6.80%) | |
| Divorced | 1,500 (10.92%) | 1,452 (10.57%) | 1,628 (9.62%) | |
| Separated | 1,554 (9.18%) | 1,620 (9.57%) | 1,723 (10.18%) | |
| Never married | 3,321 (19.63%) | 3,200 (18.91%) | 3,322 (19.63%) | |
| Living with partner | 1,248 (7.38%) | 1,149 (6.79%) | 1,117 (6.60%) | |
| PIR, n (%) | < 0.001 | |||
| < 1.3 | 4,848 (28.65%) | 4,778 (28.23%) | 5,183 (30.63%) | |
| ≥ 1.3, < 3.5 | 7,218 (42.66%) | 7,319 (43.25%) | 7,385 (43.64%) | |
| ≥ 3.5 | 4,855 (28.69%) | 4,827 (28.52%) | 4,355 (25.73%) | |
| Diabetes, n (%) | < 0.001 | |||
| Yes | 2,411 (14.25%) | 2,545 (15.04%) | 2,981 (17.62%) | |
| No | 14,510 (85.75%) | 14,379 (84.96%) | 13,942 (82.38%) | |
| Drink, n (%) | < 0.001 | |||
| Current drinkers | 11,905 (70.36%) | 12,038 (71.13%) | 11,785 (69.64%) | |
| Nondrinkers | 2,351 (13.89%) | 2,171 (23.83%) | 1,989 (11.75%) | |
| Former drinkers | 2,665 (15.75%) | 2,715 (16.04%) | 3,149 (18.61%) | |
| Hypertension, n (%) | < 0.001 | |||
| Yes | 8,372 (49.48%) | 8,778 (51.87%) | 9,615 (56.82%) | |
| No | 8,549 (50.52%) | 8,146 (48.13%) | 7,308 (43.18%) | |
| Vigorous activity, n (%) | < 0.001 | |||
| Yes | 6,471 (38.24%) | 5,979 (35.33%) | 5,313 (31.40%) | |
| No | 10,450 (61.76%) | 10,945 (64.67%) | 11,610 (68.60%) | |
| Moderate activity, n (%) | 0.069 | |||
| Yes | 6,952 (41.09%) | 7,163 (42.32%) | 7,057 (41.70%) | |
| No | 9,969 (58.91%) | 9,761 (57.68%) | 9,866 (58.30%) | |
| Smoke, n (%) | < 0.001 | |||
| Current smokers | 2,778 (16.42%) | 3,201 (18.91%) | 4,049 (23.93%) | |
| Nonsmokers | 10,481 (61.94%) | 9,747 (51.59%) | 8,693 (51.37%) | |
| Former smokers | 3,662 (21.46%) | 3,976 (23.49%) | 4,181 (24.71%) | |
| CKD, n (%) | < 0.001 | |||
| Yes | 2,850 (16.84%) | 3,267 (19.30%) | 4,195 (24.79%) | |
| No | 14,071 (83.16%) | 13,657 (80.70%) | 12,728 (75.21%) | |
Baseline characteristics of NHANES participants, 1999–2018.
Categorized according to AISI tertiles. AISI, aggregate index of systemic inflammation; BMI, body mass index; CKD, chronic kidney disease; LYM, lymphocyte count; SII, systemic immune-inflammation index; PLR, platelet-to-lymphocyte ratio; PPN, the product of platelet count and neutrophil count.
The association between AISI and CKD, as well as low eGFR
Table 2 presents the multivariate logistic regression analysis results, indicating a significant association between higher AISI levels and increased prevalence of CKD and low eGFR. This association remained substantial across various models. In Model 1, each one-unit increase in Ln-AISI was significantly associated with a 39% increase in CKD prevalence (OR: 1.39; 95% CI: 1.35–1.44, p < 0.001) and a 58% increase in low eGFR prevalence (OR: 1.58; 95% CI: 1.51–1.65, p < 0.001). After adjusting for sex, age, and race in Model 2, the association remained significant (CKD OR: 1.37; 95% CI: 1.33–1.42, p < 0.001; low eGFR OR: 1.43; 95% CI: 1.36–1.50, p < 0.001). Model 3 further adjusted for Alb, BMI, education, marital status, PIR, UA, TG, LDL-C, diabetes, drinking, hypertension, vigorous activity, moderate activity, smoking, ALT, AST, and the association between AISI and increased CKD and low eGFR prevalence remained significant. AISI was also analyzed as a categorical variable (tertiles) to assess sensitivity. Compared to the lowest tertile, the highest tertile was associated with a 63% increase in Model 1 (OR: 1.63; 95% CI: 1.51–1.72, p < 0.001). This increase remained consistent in Model 3 (OR: 1.36; 95% CI: 1.28–1.45, p < 0.001). Similarly, the prevalence of low eGFR doubled in the crude model (OR: 2.0; 95% CI: 1.85–2.16, p < 0.001) and increased by 33% in Model 3 (OR: 1.33; 95% CI: 1.21–1.46, p < 0.001) when comparing the highest to the lowest tertile. These findings indicate that in the population, the higher the AISI value, the higher the prevalence of CKD.
TABLE 2
| Model 1 OR 95% CI |
Model 2 OR 95% CI |
Model 3 OR 95% CI |
|
| Ln-AISI VS CKD | 1.39 (1.35, 1.44) | 1.37 (1.33, 1.42) | 1.24 (1.19, 1.28) |
| Stratified by Ln-AISI tertiles | |||
| T1 | Ref | Ref | Ref |
| T2 | 1.18 (1.12, 1.25) | 1.20 (1.13, 1.27) | 1.12 (1.06, 1.20) |
| T3 | 1.63 (1.51, 1.72) | 1.60 (1.51, 1.70) | 1.36 (1.28, 1.45) |
| P for trend | < 0.001 | < 0.001 | < 0.001 |
| Ln-AISI VS low eGFR | 1.58 (1.51, 1.65) | 1.43 (1.36, 1.50) | 1.17 (1.11, 1.24) |
| Stratified by Ln-AISI quartiles | |||
| T1 | Ref | Ref | Ref |
| T2 | 1.29 (1.19, 1.40) | 1.23 (1.12, 1.35) | 1.12 (1.01, 1.23) |
| T3 | 2.00 (1.85, 2.16) | 1.75 (1.60, 1.91) | 1.33 (1.21, 1.46) |
| P for trend | < 0.001 | < 0.001 | < 0.001 |
Multivariate regression analysis of Ln-AISI with CKD and low eGFR.
OR, odds ratio; 95% CI, 95% confidence interval. Model 1: no covariates were adjusted. Model 2: adjusted for gender, age, and race. Model 3: gender, age, race, Alb, BMI, education, marital status, PIR, UA, TG, LDL, diabetes, drink, hypertension, vigorous activity, moderate activity, smoke, ALT, AST.
Non-linear relationship between AISI and CKD, as well as low eGFR
Results from the smooth curve fitting analysis revealed a positive correlation between Ln-AISI and the prevalence of CKD and low eGFR in the fully adjusted model (see Figure 2). In CKD, this relationship demonstrated a threshold effect characterized by an inflection point at an Ln-AISI value of 5.20, corresponding to an AISI value of 181.27. Below this threshold, the risk of CKD remained relatively stable (OR: 1.08; 95% CI: 0.98–1.19, p = 0.1386). However, when the Ln-AISI value exceeds the cutoff point, the risk of CKD increases sharply (OR: 1.38; 95% CI: 1.31–1.46, p < 0.001), exhibiting a J-shaped nonlinear relationship (Table 3). There is also a breakpoint at Ln-AISI = 5.12 (AISI = 167.46) for low eGFR, but the effect on both sides of the breakpoint was not statistically significant (p = 0.06) (Table 4).
FIGURE 2
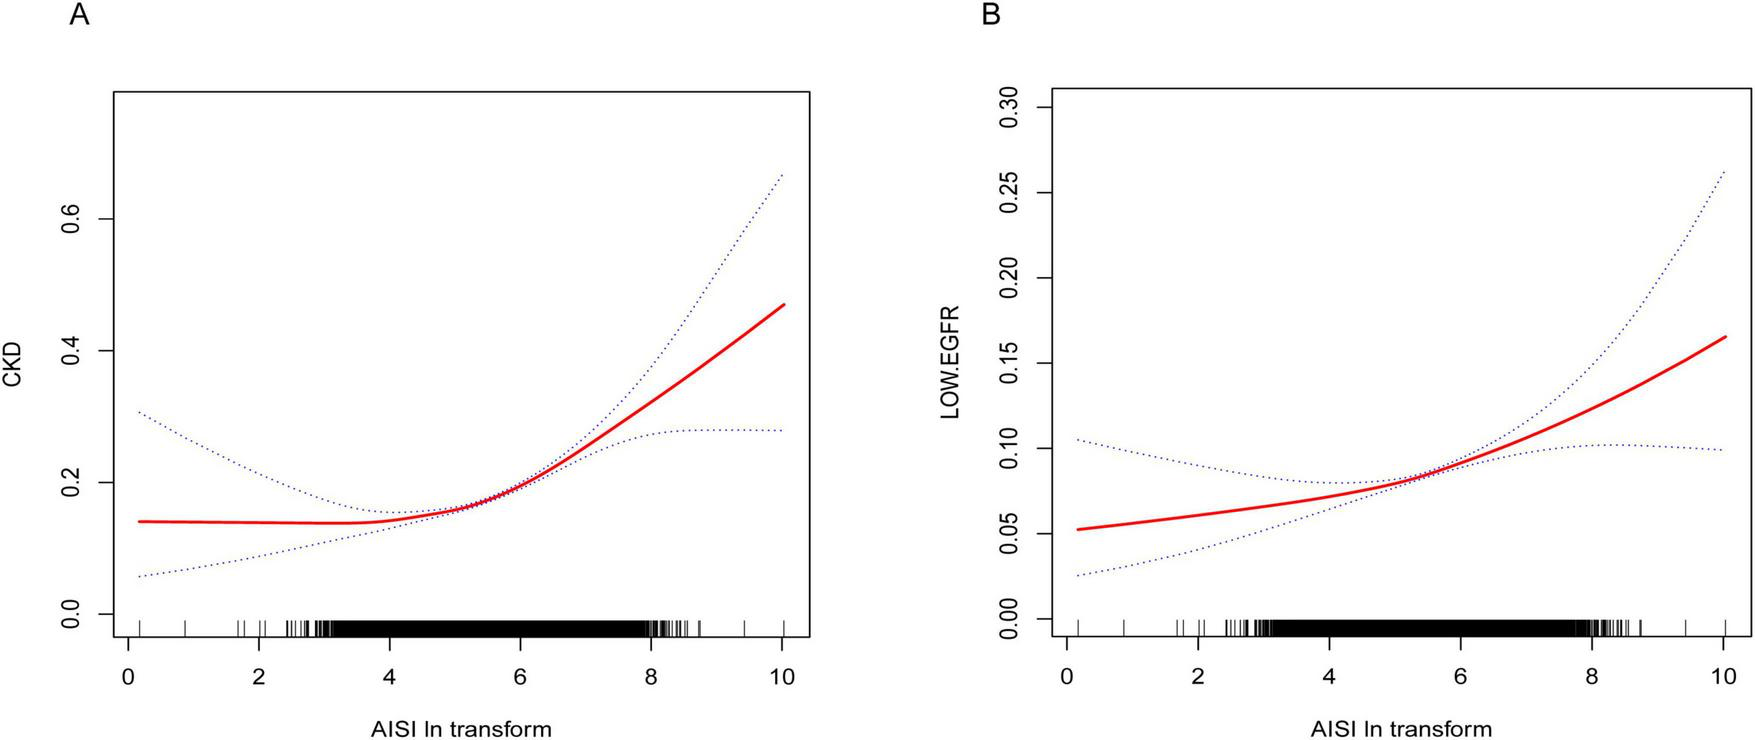
(A) Smooth curve fitting diagram of Ln-AISI and CKD in full adjusted models. (B) Smooth curve fitting graph of Ln-AISI and low eGFR in full adjusted models.
TABLE 3
| Adjusted OR (95% CI), P-value | |
| Fitting by the standard linear model | 1.29 (1.24, 1.34) < 0.0001 |
| Fitting by the two-piecewise linear model | |
| Ln-AISI | |
| Inflection point | 5.2 |
| Ln-AISI < 5.2 | 1.08 (0.98, 1.19) 0.1386 |
| Ln-AISI > 5.2 | 1.38 (1.31, 1.46) < 0.0001 |
| Log likelihood ratio | < 0.001 |
Threshold effects of AISI on CKD analyzed using linear regression models.
Adjusted for gender, age, race, Alb, BMI, education, marital status, PIR, UA, TG, LDL, diabetes, drink, hypertension, vigorous activity, moderate activity, smoke, ALT, and AST. OR, odd ratio; 95% CI, 95% confidence interval.
TABLE 4
| Adjusted OR (95% CI), P-value | |
| Fitting by the standard linear model | 1.16 (1.10, 1.23) < 0.0001 |
| Fitting by the two-piecewise linear model | |
| Ln-AISI | |
| Inflection point | 5.12 |
| Ln-AISI < 5.2 | 1.00 (0.85, 1.17) 0.9510 |
| Ln-AISI > 5.2 | 1.22 (1.13, 1.31) < 0.0001 |
| Log likelihood ratio | 0.060 |
Threshold effects of AISI on low eGFR analyzed using linear regression models.
Adjusted for gender, age, race, Alb, BMI, education, marital status, PIR, UA, TG, LDL, diabetes, drink, hypertension, vigorous activity, moderate activity, smoke, ALT, and AST. OR, odd ratio; 95% CI, 95% confidence interval.
Interaction test and subgroup analysis
Subgroup analysis (Table 5) revealed that the association between AISI levels and CKD prevalence was consistent across subgroups, with no significant interaction between groups (p for interaction > 0.05). This relationship remained consistent across groups in the subgroup analysis of AISI and low eGFR (Table 6).
TABLE 5
| Character | OR 95% CI | P-value | P for interaction |
| BMI | 0.9456 | ||
| Blow 25 | 1.24 (1.17, 1.33) | < 0.0001 | |
| 25–29.9 | 1.23 (1.15, 1.31) | < 0.0001 | |
| ≥ 30 | 1.25 (1.17, 1.32) | < 0.0001 | |
| PIR | 0.1592 | ||
| Blow 1.3 | 1.18 (1.10, 1.25) | < 0.0001 | |
| 1.3–3.5 | 1.27 (1.20, 1.34) | < 0.0001 | |
| Over 3.5 | 1.26 (1.17, 1.35) | < 0.0001 | |
| Drink | 0.1259 | ||
| Current drinkers | 1.22 (1.17, 1.28) | < 0.0001 | |
| Nondrinkers | 1.17 (1.07, 1.29) | 0.0008 | |
| Former drinkers | 1.31 (1.21, 1.41) | < 0.0001 | |
| Hypertension | 0.2796 | ||
| Yes | 1.25 (1.20, 1.31) | < 0.0001 | |
| No | 1.20 (1.12, 1.28) | < 0.0001 | |
| Diabetes | 0.0600 | ||
| Yes | 1.35 (1.26, 1.45) | < 0.0001 | |
| No | 1.26 (1.20, 1.33) | < 0.0001 | |
| Vigorous activity | 0.1172 | ||
| Yes | 1.17 (1.09, 1.26) | < 0.0001 | |
| No | 1.25 (1.20, 1.31) | < 0.0001 | |
| Moderate activity | 0.8943 | ||
| Yes | 1.23 (1.16, 1.31) | < 0.0001 | |
| No | 1.24 (1.18, 1.30) | < 0.0001 | |
| Gender | 0.7541 | ||
| Male | 1.24 (1.18, 1.31) | < 0.0001 | |
| Female | 1.23 (1.17, 1.29) | < 0.0001 | |
| Smoke | 0.7793 | ||
| Current smokers | 1.21 (1.11, 1.35) | < 0.0001 | |
| Nonsmokers | 1.24 (1.18, 1.30) | < 0.0001 | |
| Former smokers | 1.25 (1.17, 1.34) | < 0.0001 | |
| Age | 0.4520 | ||
| < 60 | 1.26 (1.17, 1.30) | < 0.0001 | |
| ≥ 60 | 1.29 (1.22, 1.39) | < 0.0001 | |
| Education | 0.0950 | ||
| Under high school | 1.31 (1.23, 1.40) | < 0.0001 | |
| High school or equivalent | 1.21 (1.12, 1.30) | < 0.0001 | |
| College graduate or above | 1.20 (1.14, 1.27) | < 0.0001 | |
| Race | 0.7641 | ||
| Mexican American | 1.29 (1.17, 1.42) | < 0.0001 | |
| Other Hispanic | 1.27 (1.11, 1.45) | 0.0006 | |
| Non-Hispanic White | 1.24 (1.17, 1.31) | < 0.0001 | |
| Non-Hispanic Black | 1.21 (1.12, 1.30) | < 0.0001 | |
| Other Race | 1.18 (1.04, 1.33) | 0.0085 |
Subgroup analysis for the association between AISI and CKD.
TABLE 6
| Character | OR 95% CI | P-value | P for interaction |
| BMI | 0.5602 | ||
| Blow 25 | 1.23 (1.11, 1.36) | < 0.0001 | |
| 25–29.9 | 1.17 (1.07, 1.28) | 0.0007 | |
| ≥ 30 | 1.14 (1.04, 1.24) | 0.0058 | |
| PIR | 0.1911 | ||
| Blow 1.3 | 1.09 (0.98, 1.20) | 0.1020 | |
| 1.3–3.5 | 1.22 (1.13, 1.32) | < 0.0001 | |
| Over 3.5 | 1.18 (1.06, 1.32) | 0.0032 | |
| Drink | 0.3632 | ||
| Current drinkers | 1.16 (1.08, 1.25) | < 0.0001 | |
| Nondrinkers | 1.25 (1.10, 1.42) | < 0.0001 | |
| Former drinkers | 1.15 (1.04, 1.26) | 0.0058 | |
| Hypertension | 0.1921 | ||
| Yes | 1.15 (1.08, 1.22) | < 0.0001 | |
| No | 1.26 (1.11, 1.43) | 0.0004 | |
| Diabetes | 0.6602 | ||
| Yes | 1.19 (1.08, 1.31) | 0.0002 | |
| No | 1.16 (1.09, 1.24) | < 0.0001 | |
| Vigorous activity | 0.5605 | ||
| Yes | 1.13 (0.98, 1.30) | 0.0889 | |
| No | 1.18 (1.11, 1.25) | < 0.0001 | |
| Moderate activity | 0.9565 | ||
| Yes | 1.18 (1.07, 1.49) | 0.0007 | |
| No | 1.17 (1.09, 1.25) | < 0.0001 | |
| Gender | 0.1984 | ||
| Male | 1.13 (1.05, 1.22) | 0.0014 | |
| Female | 1.21 (1.12, 1.31) | < 0.0001 | |
| Smoke | 0.1855 | ||
| Current smokers | 1.18 (1.01, 1.38) | 0.0399 | |
| Nonsmokers | 1.23 (1.13, 1.33) | < 0.0001 | |
| Former smokers | 1.11 (1.02, 1.20) | 0.0202 | |
| Age | 0.2789 | ||
| < 60 | 1.26 (1.10, 1.46) | 0.0013 | |
| ≥ 60 | 1.16 (1.09, 1.23) | < 0.0001 | |
| Education | 0.6720 | ||
| Under high school | 1.20 (1.19, 1.32) | 0.0002 | |
| High school or equivalent | 1.13 (1.01, 1.26) | 0.0333 | |
| College graduate or above | 1.18 (1.08, 1.27) | < 0.0001 | |
| Race | 0.1790 | ||
| Mexican American | 1.23 (1.03, 1.48) | 0.0219 | |
| Other Hispanic | 1.14 (0.90, 1.45) | 0.2881 | |
| Non-Hispanic White | 1.12 (1.04, 1.20) | 0.0028 | |
| Non-Hispanic Black | 1.18 (1.05, 1.32) | 0.0067 | |
| Other Race | 1.49 (1.18, 1.88) | 0.0007 |
Subgroup analysis for the association between AISI and low eGFR.
ROC analysis
The AUC was calculated to compare the performance of AISI with other inflammatory markers (LYM, SII, PLR, PPN) in identifying CKD and low eGFR (Figure 3). For identifying CKD, the AUC of AISI was 0.5629 (95% CI: 0.5566–0.5692), which was higher than that of the other four inflammatory markers. Additionally, there were statistically significant differences between the AUCs of AISI and those of SII, PLR, and PPN (all P < 0.05), but no significant difference between the AUC of AISI and that of LYM (AUC = 0.5605, 95% CI: 0.5540–0.5669, p = 0.5641). However, the AUC of AISI was greater than that of LYM. Furthermore, LYM was the best marker for identifying low eGFR (AUC = 0.6142, 95% CI: 0.6048–0.6232) (Table 7).
FIGURE 3
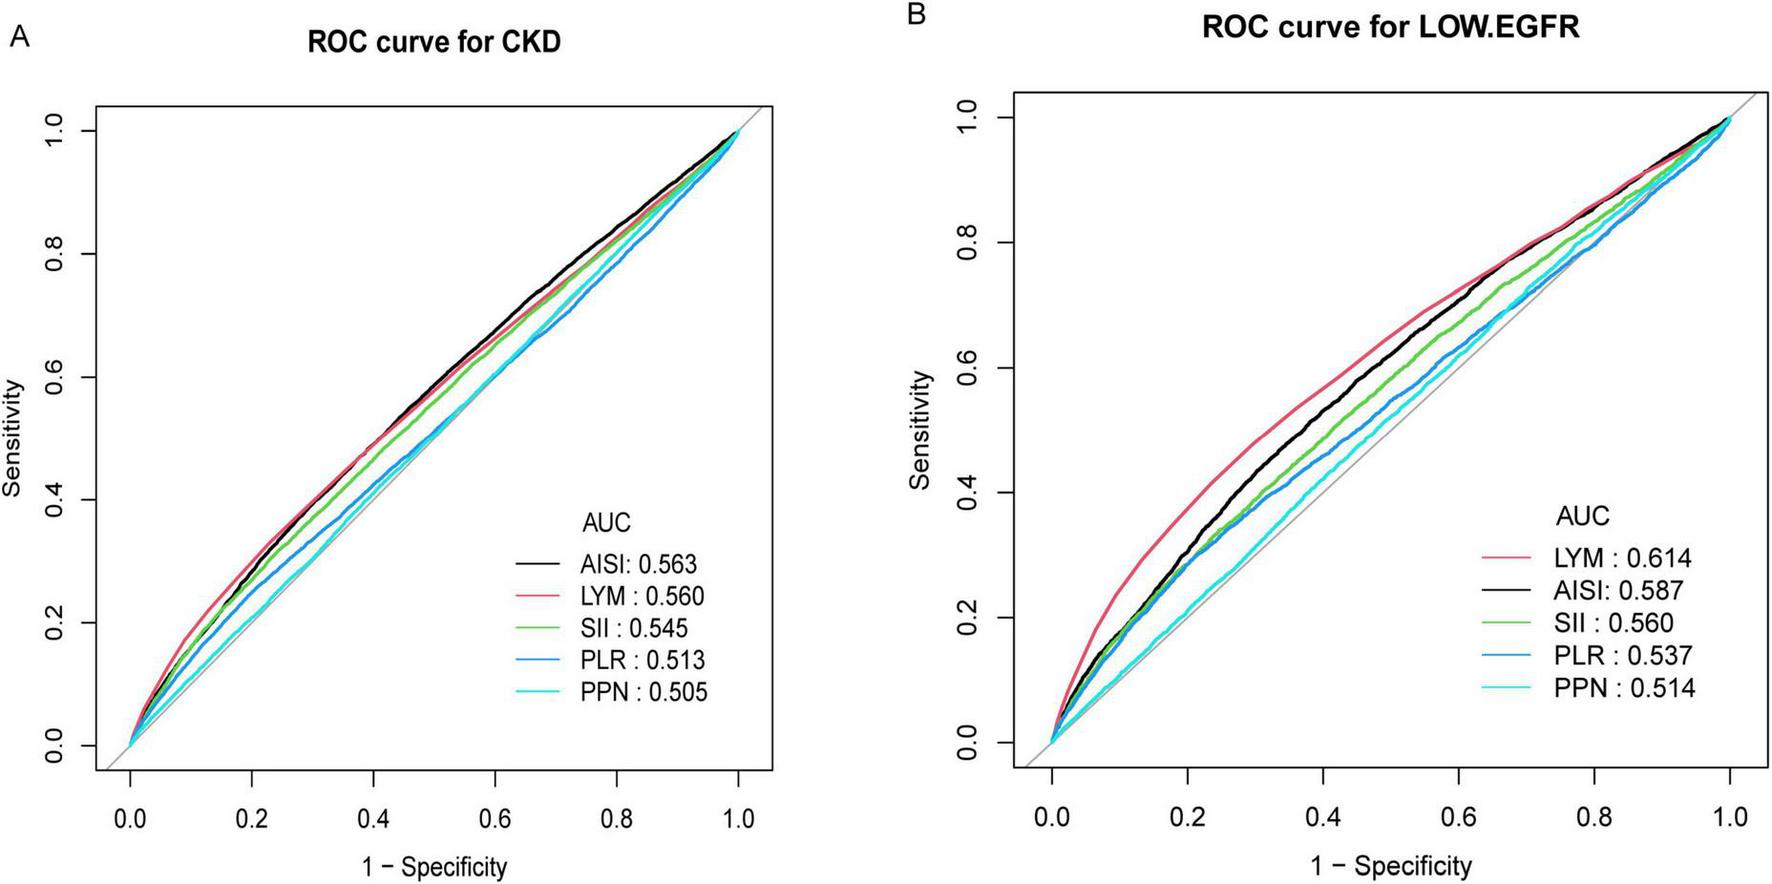
(A) ROC curve and AUC value of five inflammatory indicators (LYM, SII, PLR, PPN, and AISI) for identifying CKD; (B) ROC curve and AUC value of five inflammatory indicators (LYM, SII, PLR, PPN, and AISI) for identifying low eGFR.
TABLE 7
| Test | AUC | 95% CI low | 95% CI upp | Best threshold | Specificity | Sensitivity | P for different in AUC |
| CKD | |||||||
| AISI | 0.5629 | 0.5566 | 0.5692 | 337.10 | 0.6955 | 0.3989 | reference |
| LYM | 0.5605 | 0.5540 | 0.5669 | 1.65 | 0.7705 | 0.3304 | 0.5641 |
| PLR | 0.5126 | 0.5061 | 0.5191 | 160.69 | 0.8064 | 0.2437 | < 0.0001 |
| PPN | 0.5055 | 0.4992 | 0.5117 | 1080.90 | 0.5895 | 0.4228 | < 0.0001 |
| SII | 0.5452 | 0.5387 | 0.5516 | 660.43 | 0.7582 | 0.3157 | < 0.0001 |
| Low eGFR | |||||||
| LYM | 0.6142 | 0.6048 | 0.6236 | 1.75 | 0.7033 | 0.4779 | reference |
| AISI | 0.5870 | 0.5779 | 0.5960 | 299.15 | 0.6193 | 0.5140 | < 0.0001 |
| PLR | 0.5367 | 0.5271 | 0.5463 | 159.07 | 0.7960 | 0.2906 | < 0.0001 |
| PPN | 0.5138 | 0.5049 | 0.5228 | 1274.65 | 0.2950 | 0.7031 | < 0.0001 |
| SII | 0.5604 | 0.5511 | 0.5697 | 663.38 | 0.7538 | 0.3391 | < 0.0001 |
Comparison of AUC values between AISI and other inflammatory markers in identifying CKD and low eGFR.
AUC, area under the curve; 95% CI, 95% confidence interval.
Sensitivity analysis
This is a cross-sectional study and we show how the sample size was calculated (Supplementary Data Sheet 1). Inflammation markers were important covariates in this study. Due to limitations of the NHANES database, CRP data were available only from 1999 to 2010. After applying our inclusion and exclusion criteria, 25,418 participants (50.07%) in the final dataset had CRP data. However, there was a large amount of missing data, and direct inclusion in the analysis could introduce significant bias. Therefore, we excluded it from the covariate adjustment in our study. We performed a sensitivity analysis using multiple imputations to address all missing values, including CRP and included it in Model 3 for logistic regression (Supplementary Table 1). The results of this analysis were consistent with those of the current study. After including CRP as a covariate in Model 3, the ORs for Ln-AISI and CKD were 1.21 (95% CI: 1.17–1.26), and for Ln-AISI and low eGFR, the ORs were 1.21 (95% CI: 1.14–1.28), respectively. Additionally, we conducted a sensitivity analysis without CRP interpolation, using only participants with available CRP data for multivariate logistic regression (see Supplementary Table 2). The results remained consistent.
Furthermore, our study excluded participants with missing ACR, eGFR, and AISI data. Although this direct exclusion method is commonly employed, it may still introduce bias. To address this, we performed a sensitivity analysis in which all participants were retained, and multiple imputation was applied to the entire population of 101,316 without exclusion criteria. Regression analysis was then performed using the three models of this study (see Supplementary Table 3). Under model 3, which adjusted for all covariates, the OR value of Ln (AISI) and CKD were 1.14 (95% CI: 1.11–1.18) for CKD and 1.28 (95% CI: 1.11–1.25) for low eGFR. The direction of effect was consistent with our findings, and the results were significant.
Discussion
In this cross-sectional study of 50,768 adults, multivariate logistic regression analysis identified a positive correlation between AISI and CKD and low eGFR. The threshold effect of the non-linear relationship between AISI and CKD was identified through smooth curve fitting. A J-shaped association between AISI and CKD was found, with a breakpoint at 181.27. Additionally, a positive correlation was also observed between AISI and low eGFR. Subgroup analysis and interaction tests revealed no significant differences in the association between AISI and CKD across different populations. ROC analysis showed that AISI was the best indicator for identifying CKD compared with other inflammatory indicators (LYM, SII, PLR, PPN).
Previous studies on inflammatory markers and chronic kidney disease (CKD) have shown that the systemic immune-inflammation index (SII) and systemic inflammation response index (SIRI) are significantly associated with CKD prevalence and mortality in the US population (19, 20). Inflammation plays a crucial role in the development and progression of kidney disease. The aggregate index of systemic inflammation (AISI), a novel inflammatory marker introduced in 2018 (21), has since been studied for its clinical significance in various diseases, including idiopathic pulmonary fibrosis, COVID-19, non-small cell lung cancer, acute coronary syndrome, and multiple types of cancer (11, 12, 22–24). To our knowledge, this is the first study to investigate the association between AISI and CKD prevalence. A previous study of 369 peritoneal dialysis patients, with a median follow-up of 32.83 months, found that those with higher AISI levels had lower survival rates (25). Another cross-sectional study on AISI and proteinuria indicated that when log2AISI exceeds 7.25, the risk of albuminuria significantly increases, similar to our findings (10). Similarly, elevated AISI levels have been associated with an increased risk of cardiovascular mortality in hypertensive patients (9, 26), and kidney damage is closely linked to endothelial injury in the renal tubules caused by hypertension (27).
Chronic systemic inflammation is key to developing and progressing CKD (28). Elevated AISI levels may promote the development of CKD and the decline of eGFR through these mechanisms. Cytokines and chemokines released during inflammation (e.g., IL-6 and TNF-α) directly damage glomerular and tubular cells and promote mesangial cell proliferation and matrix deposition, ultimately leading to glomerulosclerosis (29). Specifically, elevated IL-6 and TNF-α levels are closely linked to renal inflammation. These factors activate downstream signaling pathways (e.g., NF-κB), promoting the infiltration and activation of inflammatory cells, which exacerbates renal damage. Systemic inflammation also induces oxidative stress, leading to the overproduction of reactive oxygen species (ROS). These free radicals directly damage renal cell DNA, proteins, and lipids and exacerbate kidney function through apoptosis and necrosis (30). Studies have shown that excessive ROS production is closely associated with dysfunction of tubular cells. Additionally, inflammation impairs endothelial function, affecting renal blood perfusion and filtration, thereby promoting proteinuria (31). Endothelial dysfunction-induced vasoconstriction and increased permeability worsen renal ischemia, further amplifying the inflammatory response. Persistent inflammation also activates pro-fibrotic factors, such as transforming growth factor beta (TGF-β), which promotes renal interstitial fibrosis and reduces kidney filtration capacity (32). TGF-β induces structural remodeling and kidney dysfunction by activating fibroblasts and promoting collagen deposition.
This study has several key strengths. This is the first study to examine the relationship between AISI and CKD using the NHANES database, offering a novel perspective on the link between inflammation and CKD through AISI. These data are drawn from a large, nationally representative survey in the United States, providing comprehensive health information across diverse ethnicities, genders, and age groups. Therefore, our findings have strong external validity and can be generalized to various populations. Additionally, careful adjustment for confounding variables enhances the credibility and generalizability of the findings. The non-linear relationship between AISI and CKD was examined through smoothing curve fitting and subgroup analysis. The advantages of AISI as an inflammatory marker were demonstrated by comparing its ROC curve with those of other inflammatory markers.
This study has several limitations. First, as a cross-sectional study, our findings suggest an association between AISI and CKD. However, causal inference is not feasible due to the absence of time-series data. Furthermore, due to the limitations of the NHANES database, serum creatinine and albuminuria were measured only once for each subject, introducing potential bias in the diagnosis of CKD. Additionally, since cross-sectional data capture only a single point in time, we could not assess the long-term effects of AISI changes on CKD progression. Future longitudinal studies are required to validate these findings. Second, the sample consisted solely of US adults, limiting the applicability of these findings to children or populations from other regions, particularly those in Asia. Although we adjusted for multiple confounding factors, unmeasured ones remain, including classic inflammatory indicators such as IL-6 and TNF-α. Due to limitations in the NHANES database, we cannot obtain these inflammatory indicators, limiting our ability to fully assess the impact of other inflammatory markers on the relationship between AISI and CKD. Finally, the NHANES database’s design and specific exclusion criteria may introduce selection bias.
A promising direction for future research is the use of longitudinal data to explore the relationship between AISI and various potential causes of chronic kidney disease, such as diabetic nephropathy and hypertensive nephropathy. Additionally, the strong correlation between AISI and CKD, along with its superiority over other traditional inflammatory markers, makes it a potential tool for identifying high-risk groups for CKD. Future research could combine AISI with other indicators to develop a comprehensive predictive model, which may enhance early detection. In addition, studies of different populations, including populations outside the United States or studies of childhood cohorts, would be valuable.
Conclusion
Our study offers new insights into the relationship between CKD and AISI. In general, AISI is positively correlated with CKD. The advantages of AISI include its low cost, ease of collection, and simple calculation, making it potentially valuable for clinical applications. However, further prospective clinical trials are required to validate the potential role of AISI in kidney disease.
Statements
Data availability statement
Publicly available datasets were analyzed in this study. This data can be found here: https://wwwn.cdc.gov/nchs/nhanes/default.aspx.
Ethics statement
The studies involving humans were approved by the Ethics Review Board of the National Center for Health Statistics (NCHS) and Centers for Disease Control and Prevention (CDC). The studies were conducted in accordance with the local legislation and institutional requirements. Written informed consent for participation was not required from the participants or the participants’ legal guardians/next of kin in accordance with the national legislation and institutional requirements.
Author contributions
DH: Data curation, Formal Analysis, Visualization, Writing – original draft. HW: Resources, Supervision, Validation, Writing – review and editing.
Funding
The authors declare that no financial support was received for the research, authorship, and/or publication of this article.
Acknowledgments
We sincerely appreciate the valuable feedback from the editor and four reviewers, which have contributed significantly to enhancing the rigor and scientific quality of this study. To further address the interests of readers, we have provided a more comprehensive model, incorporating additional covariates, in Supplementary Figure 3, along with its corresponding ROC curve and AUC values, to illustrate the performance of AISI in conjunction with other factors for identifying CKD and low eGFR.
Conflict of interest
The authors declare that the research was conducted in the absence of any commercial or financial relationships that could be construed as a potential conflict of interest.
Generative AI statement
The author(s) declare that Generative AI was used in the creation of this manuscript. The author(s) verify and take full responsibility for the use of generative AI in the preparation of this manuscript. Generative AI was used specifically for language polishing and grammar correction during the final revision stages of the manuscript. All intellectual and conceptual content, data analysis, and interpretations presented in the manuscript were conducted independently by the author(s), and the AI was only employed to enhance readability and clarity without altering the scientific content.
Publisher’s note
All claims expressed in this article are solely those of the authors and do not necessarily represent those of their affiliated organizations, or those of the publisher, the editors and the reviewers. Any product that may be evaluated in this article, or claim that may be made by its manufacturer, is not guaranteed or endorsed by the publisher.
Supplementary material
The Supplementary Material for this article can be found online at: https://www.frontiersin.org/articles/10.3389/fmed.2025.1506575/full#supplementary-material
Footnotes
References
1.
GBD 2019 Risk Factors Collaborators. Global burden of 87 risk factors in 204 countries and territories, 1990-2019: A systematic analysis for the Global Burden of Disease Study 2019. Lancet. (2020) 396:1223–49.
2.
Jankowski J Floege J Fliser D Böhm M Marx N . Cardiovascular disease in chronic kidney disease: Pathophysiological insights and therapeutic options.Circulation. (2021) 143:1157–72.
3.
Ku E Lee B Wei J Weir M . Hypertension in CKD: Core curriculum 2019.Am J Kidney Dis. (2019) 74:120–31.
4.
Baaten C Schröer J Floege J Marx N Jankowski J Berger M et al Platelet abnormalities in CKD and their implications for antiplatelet therapy. Clin J Am Soc Nephrol. (2022) 17:155–70.
5.
Kaur R Singh R . Mechanistic insights into CKD-MBD-related vascular calcification and its clinical implications.Life Sci. (2022) 311:121148. 10.1016/j.lfs.2022.121148
6.
Tarun T Ghanta S Ong V Kore R Menon L Kovesdy C et al Updates on new therapies for patients with CKD. Kidney Int Rep. (2024) 9:16–28.
7.
Cupisti A Giannese D Moriconi D D’Alessandro C Torreggiani M Piccoli G . Nephroprotection by SGLT2i in CKD patients: May it be modulated by low-protein plant-based diets?Front Med (Lausanne). (2020) 7:622593. 10.3389/fmed.2020.622593
8.
Yin X Zou J Yang J . The association between the aggregate index of systemic inflammation and risk of rheumatoid arthritis: retrospective analysis of NHANES 1999-2018.Front Med (Lausanne). (2024) 11:1446160. 10.3389/fmed.2024.1446160
9.
Xiu J Lin X Chen Q Yu P Lu J Yang Y et al The aggregate index of systemic inflammation (AISI): A novel predictor for hypertension. Front Cardiovasc Med. (2023) 10:1163900. 10.3389/fcvm.2023.1163900
10.
Sun L Huo X Jia S Chen X . [Association between the aggregate index of systemic inflammation and albuminuria: A cross-sectional study of national health and nutrition examination survey 2007-2018].Sichuan Da Xue Xue Bao Yi Xue Ban. (2024) 55:671–9. 10.12182/20240560108
11.
Wang H Wei Q Yang Y Lu T Yan Y Wang F . Clinical usefulness of the lymphocyte-to-monocyte ratio and aggregate index of systemic inflammation in patients with esophageal cancer: A retrospective cohort study.Cancer Cell Int. (2023) 23:13. 10.1186/s12935-023-02856-3
12.
Xie W Xu Z Qiu Y Ye W Zhang Z Wang C et al Novel nomogram combined the aggregate index of systemic inflammation and PIRADS score to predict the risk of clinically significant prostate cancer. Biomed Res Int. (2023) 2023:9936087. 10.1155/2023/9936087
13.
Jin C Li X Luo Y Zhang C Zuo D . Associations between pan-immune-inflammation value and abdominal aortic calcification: A cross-sectional study.Front Immunol. (2024) 15:1370516. 10.3389/fimmu.2024.1370516
14.
Ostrominski J Arnold S Butler J Fonarow G Hirsch J Palli S et al Prevalence and overlap of cardiac, Renal, and metabolic conditions in US adults, 1999-2020. JAMA Cardiol. (2023) 8:1050–60. 10.1001/jamacardio.2023.3241
15.
Sun D Jin Y Wang T Zheng K Rios R Zhang H et al MAFLD and risk of CKD. Metabolism. (2021) 115:154433.
16.
Guo W Song Y Sun Y Du H Cai Y You Q et al Systemic immune-inflammation index is associated with diabetic kidney disease in Type 2 diabetes mellitus patients: Evidence from NHANES 2011-2018. Front Endocrinol (Lausanne). (2022) 13:1071465. 10.3389/fendo.2022.1071465
17.
Murphy D McCulloch C Lin F Banerjee T Bragg-Gresham J Eberhardt M et al Trends in prevalence of chronic kidney disease in the United States. Ann Intern Med. (2016) 165:473–81.
18.
Levey AS Stevens LA Schmid CH Zhang YL Castro AF Feldman HI et al A new equation to estimate glomerular filtration rate. Ann. Intern. Med. (2009). 150:604–12. 10.7326/0003-4819-150-9-200905050-00006
19.
Huang P Mai Y Zhao J Yi Y Wen Y . Association of systemic immune-inflammation index and systemic inflammation response index with chronic kidney disease: Observational study of 40,937 adults.Inflamm Res. (2024) 73:655–67. 10.1007/s00011-024-01861-0
20.
Li X Cui L Xu H . Association between systemic inflammation response index and chronic kidney disease: A population-based study.Front Endocrinol (Lausanne). (2024) 15:1329256. 10.3389/fendo.2024.1329256
21.
Putzu C Cortinovis D Colonese F Canova S Carru C Zinellu A et al Blood cell count indexes as predictors of outcomes in advanced non-small-cell lung cancer patients treated with Nivolumab. Cancer Immunol Immunother. (2018) 67:1349–53. 10.1007/s00262-018-2182-4
22.
Ercan Z Evren Öztop K Pınar M Varim C Dheir H Karacaer C et al The aggregate index of systemic inflammation may predict mortality in COVID-19 patients with chronic renal failure. Eur Rev Med Pharmacol Sci. (2023) 27:3747–52.
23.
Hamad D Aly M Abdelhameid M Ahmed S Shaltout A Abdel-Moniem A et al Combined blood indexes of systemic inflammation as a mirror to admission to intensive care unit in COVID-19 patients: A multicentric study. J Epidemiol Glob Health. (2022) 12:64–73. 10.1007/s44197-021-00021-5
24.
Fan W Wei C Liu Y Sun Q Tian Y Wang X et al The prognostic value of hematologic inflammatory markers in patients with acute coronary syndrome undergoing percutaneous coronary intervention. Clin Appl Thromb Hemost. (2022) 28:10760296221146183.
25.
Yang Y Xu Y Liu S Lu P Zhou H Yang M . The systemic inflammation indexes predict all-cause mortality in peritoneal dialysis patients.Ren Fail. (2023) 45:2160348.
26.
Jin N Huang L Hong J Zhao X Hu J Wang S et al The association between systemic inflammation markers and the prevalence of hypertension. BMC Cardiovasc Disord. (2023) 23:615. 10.1186/s12872-023-03661-6
27.
Sun D Wang J Shao W Wang J Yao L Li Z et al Pathogenesis and damage targets of hypertensive kidney injury. J Transl Int Med. (2020) 8:205–9.
28.
Ren F Jin Q Jin Q Qian Y Ren X Liu T et al Genetic evidence supporting the causal role of gut microbiota in chronic kidney disease and chronic systemic inflammation in CKD: A bilateral two-sample Mendelian randomization study. Front Immunol. (2023) 14:1287698. 10.3389/fimmu.2023.1287698
29.
Rapa S Di Iorio B Campiglia P Heidland A Marzocco S . Inflammation and oxidative stress in chronic kidney disease-potential therapeutic role of minerals, vitamins and plant-derived metabolites.Int J Mol Sci. (2019) 21:263. 10.3390/ijms21010263
30.
Mihai S Codrici E Popescu I Enciu A Albulescu L Necula L et al Inflammation-related mechanisms in chronic kidney disease prediction, progression, and outcome. J Immunol Res. (2018) 2018:2180373. 10.1155/2018/2180373
31.
Moradi H Pahl M Elahimehr R Vaziri N . Impaired antioxidant activity of high-density lipoprotein in chronic kidney disease.Transl Res. (2009) 153:77–85.
32.
Liu Y . Cellular and molecular mechanisms of renal fibrosis.Nat Rev Nephrol. (2011) 7:684–96.
Summary
Keywords
the aggregate index of systemic inflammation, chronic kidney disease, estimated glomerular filtration rate, cross-sectional study, inflammation markers
Citation
Huang D and Wu H (2025) Association between the aggregate index of systemic inflammation and CKD: evidence from NHANES 1999–2018. Front. Med. 12:1506575. doi: 10.3389/fmed.2025.1506575
Received
05 October 2024
Accepted
14 February 2025
Published
10 March 2025
Volume
12 - 2025
Edited by
Giuseppe Murdaca, University of Genoa, Italy
Reviewed by
Nicolas Padilla-Raygoza, Institute of Public Health of the State of Guanajuato (ISAPEG), Mexico
İsa Ardahanl ı, Bilecik Şeyh Edebali University, Türkiye
Dorota Formanowicz, Poznan University of Medical Sciences, Poland
Sada Ghalib Taher, Thi Qar University, Iraq
Updates
Copyright
© 2025 Huang and Wu.
This is an open-access article distributed under the terms of the Creative Commons Attribution License (CC BY). The use, distribution or reproduction in other forums is permitted, provided the original author(s) and the copyright owner(s) are credited and that the original publication in this journal is cited, in accordance with accepted academic practice. No use, distribution or reproduction is permitted which does not comply with these terms.
*Correspondence: Hang Wu, wuhang0613@163.com
Disclaimer
All claims expressed in this article are solely those of the authors and do not necessarily represent those of their affiliated organizations, or those of the publisher, the editors and the reviewers. Any product that may be evaluated in this article or claim that may be made by its manufacturer is not guaranteed or endorsed by the publisher.