Abstract
Background:
Acute pancreatitis (AP) severity assessment upon admission is crucial for prognosis, yet existing clinical scoring systems have limitations like delayed results, complexity, or low sensitivity. Obesity correlates with AP severity, but traditional body mass index (BMI) fails to accurately reflect visceral fat distribution. Although anthropometric indicators for visceral obesity offer alternatives, their predictive value for AP severity across all etiologies is poorly studied.
Methods:
This retrospective cohort study analyzed 629 AP patients admitted to a tertiary hospital (2016–2023). Patients were classified as mild AP (MAP, n = 531) or moderately severe/severe AP (MSAP/SAP, n = 98) based on organ failure (modified Marshall score ≥ 2). Eleven anthropometric indicators and six clinical scoring systems were evaluated. Patients were randomly divided into training group (n = 441) and validation group (n = 188). LASSO regression identified key predictors from 37 clinical variables. Six machine learning (ML) models were built and evaluated using receiver operating characteristic (ROC) analysis, area under the ROC curve (AUC), calibration curves, and decision curve analysis (DCA).
Results:
Nine anthropometric indicators [waist circumference, body roundness index, BMI, conicity index, lipid accumulation products (LAP), waist triglyceride index (WTI), cardiometabolic index (CMI), visceral adiposity index (VAI), chinese visceral adiposity index] and all clinical scoring systems (Ranson score, Glasgow score, SIRS, BISAP, APACHE II, JSS) significantly differed between MAP and MSAP/SAP groups (p < 0.05). VAI demonstrated the highest predictive AUC among anthropometric indicators (0.737 vs. SIRS 0.750, JSS 0.815), but superior to Ranson score, Glasgow score, BISAP, and APACHE II. LAP, WTI, and CMI also showed strong AUCs (0.729, 0.722, 0.736 respectively). LASSO selected 15 variables. Among ML models, XGBoost model performed best on the validation group (AUC = 0.878), and relatively good calibration curve and DCA results.
Conclusion:
VAI, CMI, LAP, and WTI are independent predictors of AP severity, with VAI showing the highest individual predictive capability among them. The XGBoost model, incorporating VAI and routinely available clinical variables, achieved excellent performance (AUC = 0.878) for early severity assessment, offering a potentially rapid and cost-effective clinical tool. This supports the utility of visceral obesity anthropometric indicators and ML models for improving early risk stratification in AP.
1 Introduction
Acute pancreatitis (AP) is a common inflammatory disorder of the digestive system (1), characterized by the abnormal activation of pancreatic enzymes. Worldwide, the incidence of AP is 34 cases per 100,000 individuals, and in certain regions, it is more than twice that (2). Over the past few years, there has been a notable enhancement in living standards, the incidence of AP has been steadily rising, estimated to increase by approximately 3% on average per year between 1961 and 2016 (3). AP is characterized by different degrees of prognosis. Around 80% of patients afflicted with AP present with a mild form, featuring solely pancreatic edema. This often manifests as a self-limiting disorder and holds a favorable prognosis (4). In contrast, 20% of patients with AP progress to severe forms, which might give rise to pancreatic necrosis, peritonitis, and systemic multi-organ dysfunction, accompanied by a mortality rate as elevated as 20–40% (5, 6). Therefore, evaluating the severity of AP in the initial phases of hospitalization is of considerable significance. Early intervention for high-risk patients is a necessary condition for reducing mortality and improving prognosis (7). Currently, the prediction and evaluation of the severity of AP disease are mainly conducted through clinical scoring systems, including the Ranson score, Glasgow score, systemic inflammatory response syndrome (SIRS), bedside index for severity in acute pancreatitis (BISAP), acute physiology and chronic health evaluation II (APACHE II), and Japanese severity score (JSS). However, they have certain limitations in application (8). The Ranson score and Glasgow score require more than 48 h to obtain the results (9, 10). The variables of the SIRS score include vital signs, which change constantly, thus requiring repeated evaluations (11). The BISAP score uses only five variables to predict the severity of AP patients within 24 h after admission, and its scoring sensitivity is relatively low (12, 13). The APACHE II score is designed for critically ill patients in the ICU. Multiple laboratory indicators among the variables cannot be routinely obtained within 24 h after admission, and the score is complex to use and exhibits a relatively elevated false positive rate (14). The JSS is composed of five clinical signs, 10 blood tests, CT manifestations, SIRS, and age. With complex parameters, it is restricted to a certain extent in clinical use. Consequently, there is an urgent necessity to explore novel predictive indicators that are more readily obtainable in the early stage of hospitalization, simpler to utilize, and highly accurate for identifying high-risk AP patients. This is of utmost significance for optimizing clinical decision-making and enhancing patient prognosis. Clinical evidence links obesity to AP severity (15). Body mass index (BMI) has been widely used to quantify obesity and correlate body size with fat distribution. However, BMI has limitations. In young, muscular individuals, high BMI may reflect increased muscle mass rather than obesity (16). In the elderly, declining muscle mass reduces BMI’s accuracy for obesity assessment (17). Additionally, BMI ignores variations in body fat distribution, especially visceral fat, which is closely tied to metabolic and inflammatory processes (18–20). In order to more precisely characterize varying degrees of obesity, particularly to mirror the distribution of visceral fat, several novel anthropometric indicators targeting visceral obesity have been recently introduced. These include body roundness index (BRI) (21), a body shape index (ABSI) (22), conicity index (23), weight-adjusted waist index (WWI) (24), lipid accumulation product (LAP) (25), waist triglyceride index (WTI) (26), cardiometabolic index (CMI) (27), visceral adiposity index (VAI) (28), and Chinese visceral adiposity index (CVAI) (29).
Currently, there is a paucity of studies examining the relationship between anthropometric indicators and the severity of AP. However, to date, the research regarding the correlation between these novel anthropometric indices and the severity of AP remains remarkably limited. Existing investigations have predominantly centered on specific etiologies, such as hyperlipidemic pancreatitis (HLAP) (30, 31). There is a dearth of systematic assessments encompassing the entire spectrum of AP patient populations across all etiologies. More critically, whether these novel anthropometric indices can function as straightforward, cost-effective independent predictors or complementary tools to accurately identify the severity of AP and the risk of adverse prognoses during the early stage of hospitalization has yet to be comprehensively explored and validated.
To address these gaps, this study endeavors to bridge the aforementioned knowledge gaps. Specifically, it systematically probes into the associations between a series of novel anthropometric indices and the disease severity among patients with AP across all etiologies. Simultaneously, this research assesses the latent value of these indices in predicting disease severity in AP patients during the early stage of hospitalization. The overarching objective of this study is to furnish clinical practice with a more expedient, expeditious, and potentially more precise adjunctive tool. This tool can enable the early identification of high-risk AP patients, thereby guiding more timely interventions.
2 Materials and methods
2.1 Study population
This study conducted a retrospective analysis of the AP patients who admitted to the Department of Gastroenterology at the First Affiliated Hospital of the Wenzhou Medical University from January 2016 to December 2023. The study was approved by the Ethics Committee of the First Affiliated Hospital of Wenzhou Medical University and conducted in accordance with the principles of the Declaration of Helsinki. This research constituted a retrospective, observational cohort study, wherein data were anonymized and aggregated prior to access and analysis. Consequently, the Ethics Committee granted a waiver for informed consent from all participants (Ethical Reference Number: 2025-re-031).
Inclusion criteria: meeting the AP diagnostic criteria. Exclusion criteria: (1) AP caused by ERCP, pancreatic trauma, or pancreatic surgery; (n = 129); (2) Ages below 18 years or above 80 years (n = 157); (3) Time from onset to admission more than 72 h (n = 802); (4) Other possible causes of pancreatic disease (chronic pancreatitis, pregnancy-related pancreatitis, or pancreatic cancer); a history of previous pancreatic-related surgery (n = 57); (5) Previous serious heart, lung, liver, and kidney diseases (n = 38); (6) A history of immune or blood disorders (n = 49); (7) A history of malignant tumors or previous chemotherapy or radiation therapy (n = 91); (8) Stay in the hospital for less than 48 h (n = 18); (9) Inadequate clinical records or missing medical records (n = 838). A total of 629 patients with AP were included in this study based on the predetermined inclusion and exclusion criteria.
Patients were divided into two groups based on the incidence of organ failure (OF): the MSAP/SAP group (n = 98) and the MAP group (n = 531). The selection process is shown in Figure 1.
Figure 1

Flowchart of patient inclusion and exclusion.
2.2 Diagnostic criteria for AP
Two or more of the following three requirements must be met in order to diagnose AP, under the 2012 revisions to the Atlanta criteria (32): (a) Persistent upper abdominal pain; (b) Characteristic imaging findings of AP; (c) Serum amylase and/or lipase levels were elevated to at least three times the upper limit of normal.
The severity of the disease is classified as mild or moderate/severe based on whether OF and local and/or systemic complications occur. The diagnosis of OF is based on the modified Marshall scoring system, namely the assessment of the respiratory, renal, and cardiovascular systems. The definition of OF is a modified Marshall score of at least two for any one of the three systems. Local complications include acute peripancreatic fluid collections, acute necrotic fluid collections, pancreatic pseudocysts, walled-off necrosis, and infected pancreatic necrosis.
2.3 Data collection
Data were retrospectively collected from electronic medical records of the First Affiliated Hospital of Wenzhou Medical University. Based on literature and clinical experience, we selected 45 potential predictor variables, including baseline characteristics, medical history, etiology, laboratory results, and endpoint events. Baseline clinical characteristics: gender, age, BMI, waist circumference (WC). Medical history: hypertension, diabetes, fatty liver, hyperlipemia, drinking, smoking. Etiology: biliary, hyperlipemia, alcohol abuse, unknown. Laboratory findings: white blood cell (WBC), red blood cell (RBC), hemoglobin (Hb), platelet count (PLT), hematocrit (HCT), total bilirubin (TBil), albumin (Alb), alanine aminotransferase (ALT), aspartate transaminase (AST), alkaline phosphatase (ALP), blood glucose (BG), blood urea nitrogen (BUN), creatinine (Cr), potassium (K+), sodium (Na+), chlorine (Cl−), calcium (Ca2+), amylase (AMY), total cholesterol (TC), triglyceride (TG), high-density lipoprotein cholesterol (HDL), low-density lipoprotein cholesterol (LDL), lipase (LIP), C-reactive protein (CRP), thrombin time (TT), prothrombin time (PT), fibrinogen (Fib), activated partial thromboplastin time (APTT), international standardized ratio (INR), D-dimer. The initial samples were collected within 24 h of admission to minimize the potential interference from subsequent treatments. Endpoint event: whether or OF, admission to the ICU, length of stay in hospital. Based on the medical records, six commonly used clinical scoring systems for the severity of AP at admission were calculated: Ranson score, Glasgow score, SIRS, BISAP, APACHE II, and JSS.
2.4 The calculation of anthropometric makers for visceral obesity
All anthropometric indicators are calculated through the following standard equations:
WC is estimated through abdominal CT imaging. The transverse and longitudinal axes of the umbilicus on abdominal CT are measured. Subsequently, WC is calculated by using the standard ellipse formula (33).
2.5 Data processing
Excel was used to sanitize the data. Variable with a missing data rate of more than 20% (D-dimer) was excluded; multiple imputation was employed to fill missing values for variables ranging from 5 to 20% (BG, Ca2+, LIP, TT, PT, FIB, APTT, INR), aiming to identify the optimal dataset for imputing these values. Variables with a missing data rate of less than 5% (WBC, RBC, Hb, PLT, HCT, TBIL, Alb, ALT, AST, ALP, BUN, Cr, K+, Na+, Cl−, AMY, CRP, and total length of hospital stay) were replaced with their mean values.
2.6 Model construction
The recruited patients were divided into two groups at random (7:3): the training group and the validation group. Models with different machine learning (ML) techniques were developed using the training group, and their performance was assessed using the validation group. The dataset was divided into two groups, training (441 patients total, 64 MSAP/SAP, and 377 MAP) and validation (188 patients total, 34 MSAP/SAP, and 154 MAP). From the training group, clinical variables were chosen using the Least Absolute Shrinkage and Selection Operator (LASSO) regression approach. The selected variables were incorporated into six distinct ML models, including K-Nearest Neighbor (KNN), Light Gradient Boosting Machine (LGBM), Logistic Regression (LR), Random Forest (RF), Support Vector Machine (SVM), and eXtreme Gradient Boosting (XGB). The models’ identification capability was assessed using the receiver operating characteristic (ROC) curve, along with the calculation of the area under the ROC curve (AUC) and confusion matrices. The calibration of the models was assessed by a calibration curve. The clinical effectiveness of the models was evaluated by decision curve analysis (DCA). The complete research flow chart is presented in Figure 1.
2.7 Rationality of sample size
This study is a retrospective cohort analysis, where the sample size was naturally determined according to the inclusion and exclusion criteria. Despite the absence of a prospective power analysis, the adequacy of the sample size is evidenced by the following aspects: 1. Epidemiological Rationality: The proportion of patients with MSAP/SAP was 15.6% (98/629), which is in line with the reported international incidence range of SAP (10–20%) (34). 2. Power Verification: A post-hoc power analysis was performed using G*Power 3.1 software (parameters: significance level α = 0.05, effect size d = 0.5). The results demonstrated that the power to detect differences between groups for the key indicators (e.g., VAI) reached as high as 99.2%. 3. Result Stability: The width of the CI of the AUC for all anthropometric indicators was less than 0.2. This conforms to the stability criteria of the predictive model, suggesting that a confidence interval width < 0.2 implies a relatively minor impact of sampling variation.
2.8 Statistical analysis
Statistical analyses were executed by means of SPSS software (version 25.0). Categorical variables were represented as counts and percentages, and inter-group comparisons were carried out via the chi-square test. The normality of continuous variables was appraised through the Kolmogorov–Smirnov test. Variables adhering to a normal distribution were presented as mean ± standard deviation, conversely, non-normally distributed variables were depicted as median and interquartile range. The Spearman rank correlation coefficient was enlisted to scrutinize the relationship between two continuous variables with non-normal distributions. The predictive capabilities of anthropometric indicators and clinical scoring systems were assessed by ROC curves and the calculation of the AUC. The optimal cut-off values of each index for predicting the severity of AP were determined by maximizing Youden’s Index (J), where J = sensitivity + specificity - 1. This cut-off point corresponds to the point on the ROC curve that is closest to the upper left corner, representing the best balance between sensitivity and specificity. A p value less than 0.05 was regarded as statistically substantive.
3 Results
3.1 Characteristics of participants
To study the differences in baseline characteristics of patients with different outcomes of AP, a retrospective analysis was performed on 629 enrolled patients. Tables 1, 2 presents the differences in baseline characteristics of patients with different outcomes of AP. Among all the patients, the incidence of MSAP/SAP group was 15.6% (n = 98), including 437 males (69.48%) and 192 females (30.52%). The mean values of age, BMI, and WC of the patients were 48.16 years, 25.06 kg/m2, and 85.37 cm, respectively, and the median TG was 1.94 mmol/L. The ICU admission rate was 2.54%. Compared to the MAP group, MSAP/SAP patients had significantly younger age, higher BMI, WC, and TG levels, and higher rates of diabetes, fatty liver, alcohol use, smoking, and ICU admission. Laboratory findings (WBC, RBC, Hb, HCT, Alb, ALT, ALP, BG, Na+, Cl−, Ca2+, TC, TG, HDL, LDL, CRP, PT, Fib, INR, D-dimer) within 24 h of admission also differed significantly (p < 0.05). Meanwhile, no significant differences were observed in gender and the prevalence of hypertension between the MAP group and the MSAP/SAP group (p > 0.05).
Table 1
| Variables | Total (n = 629) | MAP (n = 531) | MSAP/SAP (n = 98) | p value |
|---|---|---|---|---|
| Baseline characteristics | ||||
| Gender, male, N (%) | 437 (69.48) | 367 (69.11) | 70 (71.43) | 0.648 |
| Age, years (SD) | 48.16 ± 13.64 | 48.77 ± 14.01 | 44.83 ± 10.94 | 0.002 |
| BMI, kg/m2 (IQR) | 25.06 (22.76, 27.68) | 24.22 (22.05, 26.34) | 25.39 (22.82, 27.73) | 0.018 |
| WC, cm (SD) | 85.37 ± 9.37 | 84.86 ± 9.38 | 88.12 ± 8.90 | 0.002 |
| Medical history | ||||
| Hypertension, N (%) | 139 (22.1) | 123 (23.16) | 16 (16.33) | 0.134 |
| Diabetes, N (%) | 167 (26.55) | 123 (23.16) | 44 (44.90) | <0.001 |
| Fatty Liver, N (%) | 372 (59.14) | 295 (55.56) | 77 (78.57) | <0.001 |
| Hyperlipemia, N (%) | 282 (44.83) | 213 (40.11) | 69 (70.41) | <0.001 |
| Drinking, N (%) | 253 (40.22) | 198 (37.29) | 55 (56.12) | <0.001 |
| Smoking, N (%) | 224 (35.61) | 176 (33.15) | 48 (48.98) | 0.003 |
| Etiology | <0.001 | |||
| Biliary, N (%) | 263 (41.81) | 242 (45.57) | 21 (21.43) | |
| Hyperlipemia, N (%) | 41 (6.52) | 35 (6.59) | 6 (6.12) | |
| Alcohol abuse, N (%) | 200 (31.80) | 138 (25.99) | 62 (63.27) | |
| Unknown, N (%) | 125 (19.87) | 116 (21.85) | 9 (9.18) | |
| Endpoint event | ||||
| AICU, N (%) | 16 (2.54) | 3 (0.56) | 13 (13.27) | <0.001 |
| Hospital LOS, N (%) | 6.86 (5.26, 9.82) | 6.80 (5.56, 9.73) | 16.79 (11.63, 23.70) | <0.001 |
Comparison of baseline characteristics, medical history, etiology, and endpoint events between patients with MAP group and MSAP/SAP group.
AP, Acute pancreatitis; MAP, Mild acute pancreatitis; MSAP, Moderately severe acute pancreatitis; SAP, Severe acute pancreatitis; BMI, Body mass index; WC, Waist circumference; AICU, Admission to intensive care unit; LOS, Length of stay.
Table 2
| Variables | Total (n = 629) | MAP (n = 531) | MSAP/SAP (n = 98) | p value |
|---|---|---|---|---|
| WBC, 109/L (IQR) | 10.21 (7.66, 13.43) | 10.03 (7.29, 12.48) | 13.65 (9.91, 17.37) | <0.001 |
| RBC, 1012/L (IQR) | 4.57 (4.16, 4.96) | 4.42 (4.04, 4.91) | 4.91 (4.57, 5.60) | <0.001 |
| Hb, g/L (IQR) | 140 (128, 152) | 137 (127, 149) | 154 (134, 172) | <0.001 |
| PLT, 109/L (IQR) | 204 (170, 242) | 193 (157, 231) | 201 (172, 253) | 0.107 |
| HCT (IQR) | 0.41 (0.38, 0.45) | 0.40 (0.37, 0.44) | 0.44 (0.40, 0.50) | <0.001 |
| TBil, μmol/L (IQR) | 20 (15, 30) | 20 (15, 41) | 20 (16, 27) | 0.376 |
| Alb, g/L (SD) | 37.54 ± 4.49 | 37.97 ± 4.30 | 35.26 ± 4.84 | <0.001 |
| ALT, U/L (IQR) | 30 (17, 77) | 40 (18, 123) | 26 (14, 49) | 0.014 |
| AST, U/L (IQR) | 28 (20, 58) | 31 (19, 82) | 38 (23, 53) | 0.324 |
| ALP, U/L (IQR) | 83 (67, 109) | 88 (70, 130) | 63 (58, 78) | 0.005 |
| BG, mmol/L (IQR) | 7.6 (5.8, 11.2) | 7.6 (5.7, 11.3) | 11.4 (7.2, 15.4) | <0.001 |
| BUN, mmol/L (IQR) | 4.0 (3.1, 5.3) | 4.5 (3.2, 5.5) | 5.7 (3.7, 7.1) | 0.060 |
| Cr, μmol/L (IQR) | 65 (54, 77) | 66 (54, 77) | 66 (56, 89) | 0.794 |
| K+, mmol/L (IQR) | 3.92 (3.70, 4.12) | 3.90 (3.73, 4.09) | 4.06 (3.70, 4.50) | 0.135 |
| Na+, mmol/L (SD) | 136.87 ± 3.27 | 137.18 ± 3.00 | 135.21 ± 4.10 | <0.001 |
| Cl−, mmol/L (IQR) | 103 (100, 105) | 103 (101, 105) | 102 (99, 106) | 0.004 |
| Ca2+, mmol/L (IQR) | 2.16 (2.06, 2.24) | 2.15 (2.09, 2.24) | 1.86 (1.74, 2.13) | <0.001 |
| AMY, U/L (IQR) | 151 (72, 387) | 225 (79, 489) | 307 (143, 770) | 0.093 |
| TC, mmol/L (IQR) | 5.32 (4.26, 7.14) | 4.99 (4.26, 6.06) | 5.71 (3.54, 9.39) | <0.001 |
| TG, mmol/L (IQR) | 1.94 (0.95, 5.79) | 1.59 (0.87, 3.48) | 5.27 (1.19, 11.22) | <0.001 |
| HDL, mmol/L (SD) | 1.10 ± 0.35 | 1.12 ± 0.33 | 1.02 ± 0.42 | 0.024 |
| LDL, mmol/L (IQR) | 3.04 (2.34, 3.90) | 2.89 (2.20, 3.56) | 2.93 (1.78, 4.17) | 0.240 |
| LIP, IU/L (IQR) | 192 (79, 514) | 215 (88, 663) | 349 (89, 1,073) | 0.122 |
| CRP, mg/L (IQR) | 106.6 (34.4, 192.7) | 105.9 (33.7, 187.8) | 205.5 (121.9, 298.1) | <0.001 |
| TT, seconds (IQR) | 16.3 (15.5, 17.1) | 16.4 (15.5, 17.3) | 16.7 (15.9, 17.5) | 0.523 |
| PT, seconds (IQR) | 13.8 (13.2, 14.5) | 13.9 (13.3, 14.6) | 14.3 (13.9, 15.5) | 0.002 |
| Fib, g/L (IQR) | 4.83 (3.77, 6.38) | 4.80 (3.77, 6.41) | 5.86 (4.08, 6.71) | <0.001 |
| APTT, seconds (IQR) | 37.1 (34.2, 40.3) | 37.2 (34.7, 40.4) | 38.1 (34.1, 41.9) | 0.951 |
| INR (IQR) | 1.06 (1.01, 1.12) | 1.07 (1.02, 1.15) | 1.11 (1.07, 1.24) | 0.003 |
Comparison of laboratory findings between patients with MAP group and MSAP/SAP group.
AP, Acute pancreatitis; MAP, Mild acute pancreatitis; MSAP, Moderately severe acute pancreatitis; SAP, Severe acute pancreatitis; WBC, White blood cell; RBC, Red blood cell; Hb, Hemoglobin; PLT, Platelet counts; HCT, Hematocrit value; TBil, Total bilirubin; Alb, Albumin; ALT, Alanine aminotransferase; AST, Aspartate transaminase; ALP, Alkaline phosphatase; BG, Blood glucose; BUN, Blood urea nitrogen; Cr, Creatinine; K+, Potassium; Na+, Sodium; Cl−, Chlorine; Ca2+, Calcium; AMY, Amylase; TC, Total cholesterol; TG, Triglyceride; HDL, High-density lipoprotein cholesterol; LDL: Low-density lipoprotein cholesterol; LIP, Lipase; CRP, C-reactive protein; TT, Thrombin time; PT, Prothrombin time; Fib, Fibrinogen; APTT, Activated partial thromboplastin time; INR, International standardized ratio.
3.2 The correlation among anthropometric indicators
To further investigate the correlation among anthropometric indicators, TG, and WC, Figure 2 presents the magnitudes of their rank correlation coefficients using a heatmap. The results demonstrated a significant positive correlation between TG and VAI, CMI, LAP, and WTI. Meanwhile, a significant positive correlation was observed between WC and BRI, BMI, and CVAI. Statistically significant correlations could be observed between any two variables among VAI, CMI, LAP, and WTI. For further analysis of the correlation among these variables, refer to Figure 3. Additionally, statistically significant correlations could also be observed between the following pairs of variables: BRI vs. BMI, BRI vs. CVAI, ABSI vs. CI, ABSI vs. WWI, and CI vs. WWI.
Figure 2
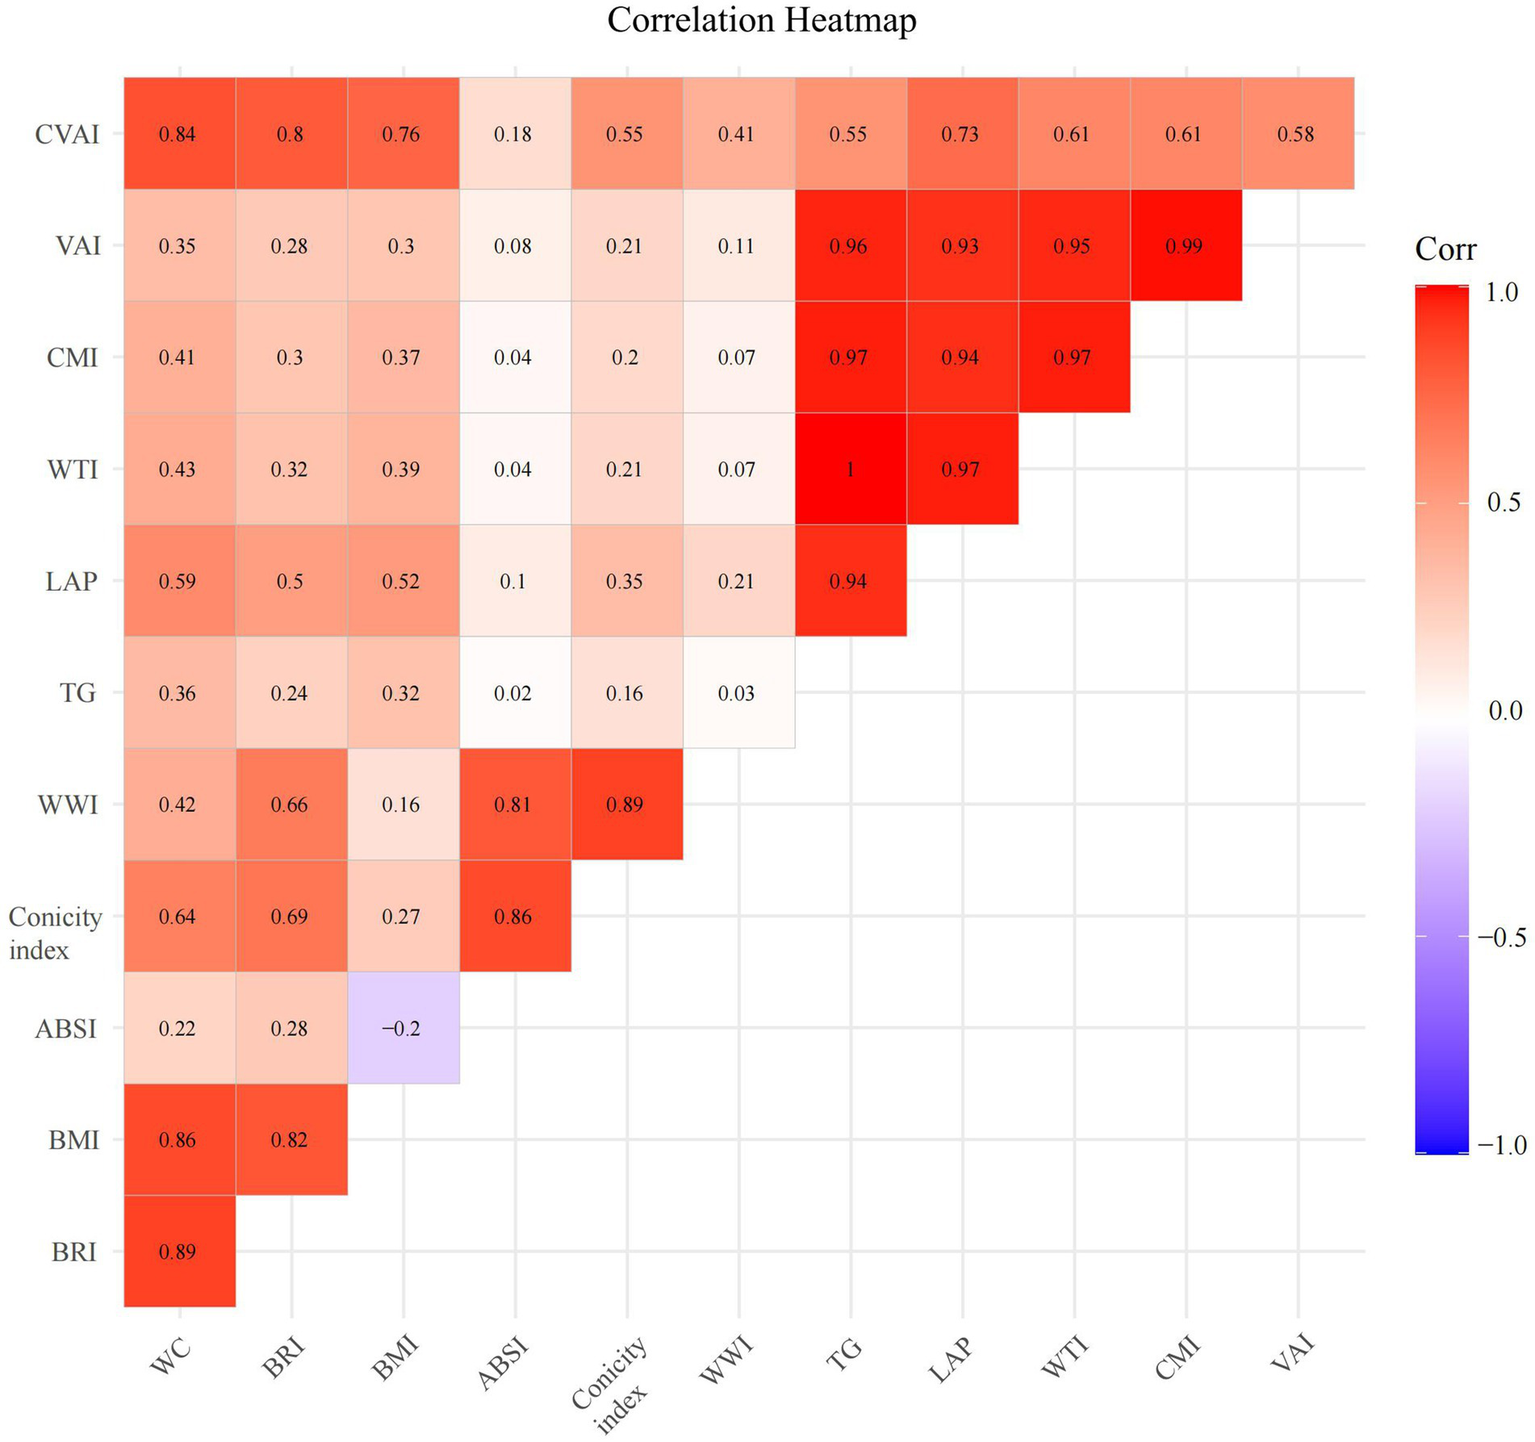
Correlation heatmap of anthropometric indicators with visceral obesity. WC, Waist circumference; BRI, Body roundness index; BMI, Body mass index; ABSI, A body shape index; TG, triglyceride; WWI, Weight-adjusted waist index; LAP, Lipid accumulation product; WTI, Waist triglyceride index; CMI, Cardiometabolic index; VAI, Visceral adiposity index; CVAI, Chinese visceral adiposity index.
Figure 3

Correlation analysis of anthropometric indicators with visceral obesity. LAP, Lipid accumulation product; WTI, Waist triglyceride index; CMI, Cardiometabolic index; VAI, Visceral adiposity index; CVAI, Chinese visceral adiposity index; BRI, Body roundness index; BMI, Body mass index; ABSI, A body shape index; WWI, Weight-adjusted waist index.
3.3 Comparison of anthropometric indicators between the MAP and MSAP/SAP groups
To explore and compare the correlations between the severity of AP disease and anthropometric indicators as well as common clinical scoring systems, this study analyzed and compared 11 anthropometric indicators and six common clinical scoring systems of patients in the MAP and MSAP/SAP groups. As demonstrated in Table 3, the severity of AP disease was significantly correlated with nine anthropometric indicators (WC, BRI, BMI, CI, LAP, WTI, CMI, VAI, and CVAI) and all six common clinical scoring systems (Ranson score, Glasgow score, SIRS, BISAP, APACHE II, and JSS) (p < 0.05).
Table 3
| Variables | Total (n = 629) | MAP (n = 531) | MSAP/SAP (n = 98) | p value |
|---|---|---|---|---|
| WC (SD) | 85.37 ± 9.37 | 84.86 ± 9.38 | 88.12 ± 8.90 | 0.002 |
| BRI (IQR) | 3.57 (2.93, 4.31) | 3.42 (2.88, 4.18) | 3.80 (3.18, 4.45) | 0.007 |
| BMI (SD) | 25.06 (22.76, 27.68) | 24.22 (22.05, 26.34) | 25.39 (22.82, 27.73) | 0.018 |
| ABSI (IQR) | 0.0770 (0.0746, 0.0793) | 0.0775 (0.0747, 0.0792) | 0.0782 (0.0750, 0.0815) | 0.208 |
| Conicity index (IQR) | 12.11 (11.69, 12.5) | 12.08 (11.66, 12.44) | 12.24 (11.86, 12.65) | 0.010 |
| WWI (SD) | 10.27 ± 0.61 | 10.25 ± 0.62 | 10.36 ± 0.53 | 0.120 |
| LAP (IQR) | 44.87 (17.32, 143.29) | 36.23 (13.34, 80.88) | 130.64 (29.92, 258.45) | <0.001 |
| WTI (IQR) | 166.3 (74.79, 524.71) | 129.48 (68.33, 305.62) | 490.74 (107.44, 954.04) | <0.001 |
| CMI (IQR) | 0.99 (0.40, 3.24) | 0.79 (0.34, 2.22) | 3.90 (0.53, 5.39) | <0.001 |
| VAI (IQR) | 2.65 (1.27, 8.42) | 2.30 (1.04, 5.21) | 12.27 (1.56, 14.88) | <0.001 |
| CVAI (SD) | 100.99 ± 39.56 | 97.94 ± 39.29 | 117.53 ± 37.04 | <0.001 |
| Ranson score (IQR) | 1.00 (0.00, 2.00) | 1.00 (0.00, 2.00) | 2.00 (1.00, 3.00) | <0.001 |
| Glasgow score (IQR) | 1.00 (0.00, 2.00) | 1.00 (0.00, 2.00) | 3.00 (2.00, 3.00) | <0.001 |
| SIRS (IQR) | 1.00 (0.00, 2.00) | 1.00 (0.00, 2.00) | 2.00 (1.00, 2.00) | <0.001 |
| BISAP (IQR) | 1.00 (0.00, 1.00) | 1.00 (0.00, 1.00) | 1.00 (1.00, 2.00) | <0.001 |
| APACHE II (IQR) | 5.00 (3.00, 7.00) | 5.00 (4.00, 7.00) | 8.00 (5.00, 13.00) | <0.001 |
| JSS (IQR) | 1.00 (0.00, 3.00) | 1.00 (0.00, 3.00) | 4.00 (2.00, 5.00) | <0.001 |
Comparison of novel anthropometric indicators and clinical scoring systems for different severities of AP.
AP, Acute pancreatitis; MAP, Mild acute pancreatitis; MSAP, Moderately severe acute pancreatitis; SAP, Severe acute pancreatitis; WC, Waist circumference; BRI, Body roundness index; BMI, Body mass index; ABSI, A body shape index; WWI, Weight-adjusted waist index; LAP, Lipid accumulation products; WTI, Waist triglyceride index; CMI, Cardiometabolic index; VAI, Visceral adiposity index; CVAI, Chinese visceral adiposity index; SIRS, Systemic inflammatory response syndrome; BISAP, Bedside index of severity in acute pancreatitis; APACHE II, Acute physiology and chronic health evaluation II; JSS, Japanese severity score.
The nine anthropometric indicators and all six common clinical scoring systems in the MSAP/SAP group were significantly elevated compared to those in the MAP group, while the other two anthropometric indicators (ABSI and WWI) showed no significant statistical difference. This outcome indicates that anthropometric indicators may have the potential to predict the severity of AP.
3.4 Evaluation of the capacity of anthropometric indicators in predicting the severity of AP
To compare the effectiveness of anthropometric indicators in predicting the severity of AP, this research calculated the AUC values (Table 4) and plotted the ROC curves (Figure 4) for the aforementioned nine anthropometric indicators and six commonly used clinical scoring systems. The AUC of VAI presents the best predictive performance, followed closely by CMI, LAP, and WTI. The prediction probabilities for these four anthropometric indicators were marginally lower than that of JSS, but were proximate to the SIRS score and higher than those of several other scores. This outcome further demonstrates that anthropometric indicators can be employed to prognosticate the severity of AP.
Table 4
| Variables | AUC (95% CI) | p value | Cutoff value | Sensitivity | Specificity |
|---|---|---|---|---|---|
| WC | 0.600 (0.545–0.655) | 0.002 | 80.815 | 0.837 | 0.352 |
| BRI | 0.586 (0.530–0.641) | 0.007 | 2.812 | 0.939 | 0.234 |
| BMI | 0.575 (0.516–0.634) | 0.018 | 22.479 | 0.908 | 0.243 |
| Conicity index | 0.582 (0.521–0.643) | 0.010 | 12.410 | 0.418 | 0.736 |
| LAP | 0.729 (0.673–0.784) | <0.001 | 56.222 | 0.786 | 0.606 |
| WTI | 0.722 (0.664–0.781) | <0.001 | 187.471 | 0.796 | 0.580 |
| CMI | 0.736 (0.679–0.793) | <0.001 | 2.298 | 0.673 | 0.746 |
| VAI | 0.737 (0.680–0.794) | <0.001 | 3.874 | 0.786 | 0.653 |
| CVAI | 0.643 (0.589–0.697) | <0.001 | 101.894 | 0.745 | 0.540 |
| Ranson score | 0.642 (0.576–0.707) | <0.001 | 1.500 | 0.469 | 0.780 |
| Glasgow score | 0.717 (0.660–0.775) | <0.001 | 1.500 | 0.633 | 0.744 |
| SIRS | 0.750 (0.699–0.800) | <0.001 | 1.500 | 0.622 | 0.751 |
| BISAP | 0.691 (0.635–0.747) | <0.001 | 0.500 | 0.837 | 0.467 |
| APACHE II | 0.681 (0.622–0.740) | <0.001 | 4.500 | 0.796 | 0.497 |
| JSS | 0.815 (0.770–0.860) | <0.001 | 2.500 | 0.694 | 0.802 |
Comparison of diagnostic performance for predicting different severities of AP between novel anthropometric indicators and clinical scoring systems.
AP, Acute pancreatitis; WC, Waist circumference; BRI, Body roundness index; BMI, Body mass index; ABSI, A body shape index; WWI, Weight-adjusted waist index; LAP, Lipid accumulation products; WTI, Waist triglyceride index; CMI, Cardiometabolic index; VAI, Visceral adiposity index; CVAI, Chinese visceral adiposity index; SIRS, Systemic inflammatory response syndrome; BISAP, Bedside index of severity in acute pancreatitis; APACHE II, Acute physiology and chronic health evaluation II; JSS, Japanese severity score.
Figure 4

ROC curve analysis of anthropometric indicators (A) and clinical scoring systems (B). ROC, receiver operating characteristic; AUC, area under the curve; WC, Waist circumference; BRI, Body roundness index; BMI, Body mass index; CI, Conicity index; LAP, Lipid accumulation product; WTI, Waist triglyceride index; CMI, Cardiometabolic index; VAI, Visceral adiposity index; CVAI, Chinese visceral adiposity index; SIRS, Systemic inflammatory response syndrome; BISAP, Bedside index of severity in acute pancreatitis; APACHE II, Acute physiology and chronic health evaluation II; JSS, Japanese severity score.
3.5 Identification of clinical variables for selection
We constructed and verified prediction models with clinical variables encompassing anthropometric indicators. It is known from the abovementioned results in this research that the correlations among anthropometric indicators are relatively high. Therefore, only the VAI variable was incorporated from the 11 variables for subsequent discussions. Supplementary Table 1 exhibits the baseline characteristics of the training group and validation group, with no statistically salient disparity existing between the two groups (p > 0.05). LASSO regression analysis was conducted in the training group. The LASSO regression encompassed 37 clinical variables, and the coefficients and the related log(λ) values are displayed in Figure 5. When the λ value was 0.01415317, the minimum cross-validation error was identified, obtaining 15 clinical variables with non-zero coefficients. When the λ value was 0.06882121, the minimum cross-validation error within one standard error was identified, obtaining three clinical variables with non-zero coefficients (Ca2+, CRP, FIB).
Figure 5
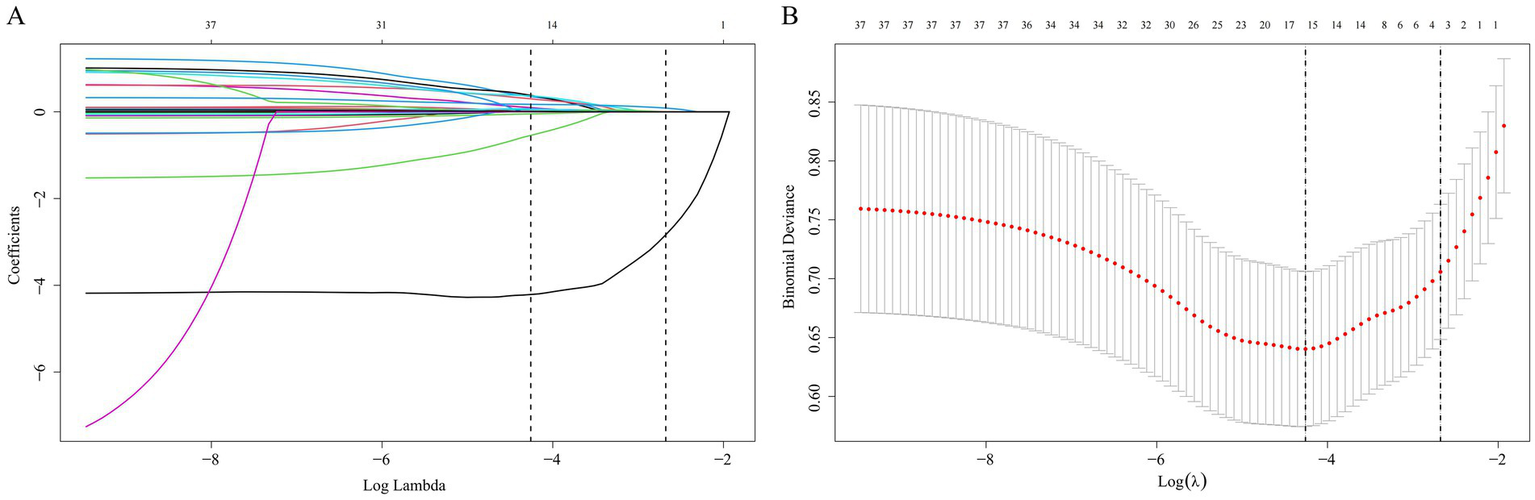
Selection of clinical variables via the LASSO regression method. (A) The coefficient values for 37 variables are shown in relation to log(λ); (B) The left vertical dashed line demarcates the position where the minimum cross-validation error emerges, while the right vertical dashed line specifies the minimum error plus one standard deviation. LASSO, Least Absolute Shrinkage and Selection Operator.
3.6 Assess the predictive efficacy of the model
The aforementioned 15 selected variables were input into ML models (KNN, LGBM, LR, RF, SVM, XGB). The model performances are presented in Table 5 and Figure 6. The key to evaluating the performance of the model lies in its performance on the validation group. In the validation group, the XGB model exhibited the highest AUC. The other models likewise demonstrated favorable AUC, signifying that all the ML models possess excellent discriminatory ability (Table 5). Among them, the XGB model had the highest AUC, accuracy, precision, and F1 score; the LGBM model presented the best sensitivity and negative predictive value; and the RF model presented the highest specificity and positive predictive value. The calibration curves reveal that the XGB model, the SVM model, and the RF model displayed relatively good consistency between the observed and predicted outcomes (Figure 6D). The DCA curves indicate that the XGB model achieved the best DCA results, while the LGBM model manifested inferior DCA results (Figure 6F). To sum up, the XGB model was ultimately selected as the ideal model because it had the highest AUC and a relatively high recall rate in the validation group, along with the largest net benefit and a wide range of high-risk thresholds. The importance graph of the clinical variables constituting the XGB model is presented in Figure 7.
Table 5
| Class | Model | AUC (95% CI) | Accuracy | Sensitivity | Specificity | Pos pred value | Neg pred value | F1 score |
|---|---|---|---|---|---|---|---|---|
| Training group | ||||||||
| KNN | 1.000 (1.000–1.000) | 1.000 | 1.000 | 1.000 | 1.000 | 1.000 | 1.000 | |
| LGBM | 0.900 (0.853–0.947) | 0.861 | 0.875 | 0.846 | 0.491 | 0.976 | 0.629 | |
| LR | 0.873 (0.817–0.930) | 0.832 | 0.812 | 0.851 | 0.481 | 0.964 | 0.605 | |
| RF | 1.000 (1.000–1.000) | 1.000 | 1.000 | 1.000 | 1.000 | 1.000 | 1.000 | |
| SVM | 0.872 (0.813–0.930) | 0.830 | 0.766 | 0.894 | 0.551 | 0.957 | 0.641 | |
| XGB | 0.943 (0.911–0.975) | 0.889 | 0.859 | 0.918 | 0.640 | 0.975 | 0.733 | |
| Validation group | ||||||||
| KNN | 0.726 (0.633–0.819) | 0.610 | 0.324 | 0.896 | 0.407 | 0.857 | 0.361 | |
| LGBM | 0.848 (0.774–0.921) | 0.764 | 0.794 | 0.734 | 0.397 | 0.942 | 0.529 | |
| LR | 0.860 (0.795–0.924) | 0.757 | 0.735 | 0.779 | 0.424 | 0.930 | 0.538 | |
| RF | 0.865 (0.796–0.933) | 0.677 | 0.412 | 0.942 | 0.609 | 0.879 | 0.491 | |
| SVM | 0.847 (0.779–0.915) | 0.706 | 0.588 | 0.825 | 0.426 | 0.901 | 0.494 | |
| XGB | 0.878 (0.813–0.944) | 0.782 | 0.706 | 0.857 | 0.522 | 0.930 | 0.600 | |
Performance of machine learning algorithms.
AUC, area under the curve; CI, confidence interval; KNN, K-Nearest Neighbor; LGBM, Light Gradient Boosting Machine; LR, Logistic Regression; RF, Random Forest; SVM, Support Vector Machine; XGB, eXtreme Gradient Boosting.
Figure 6
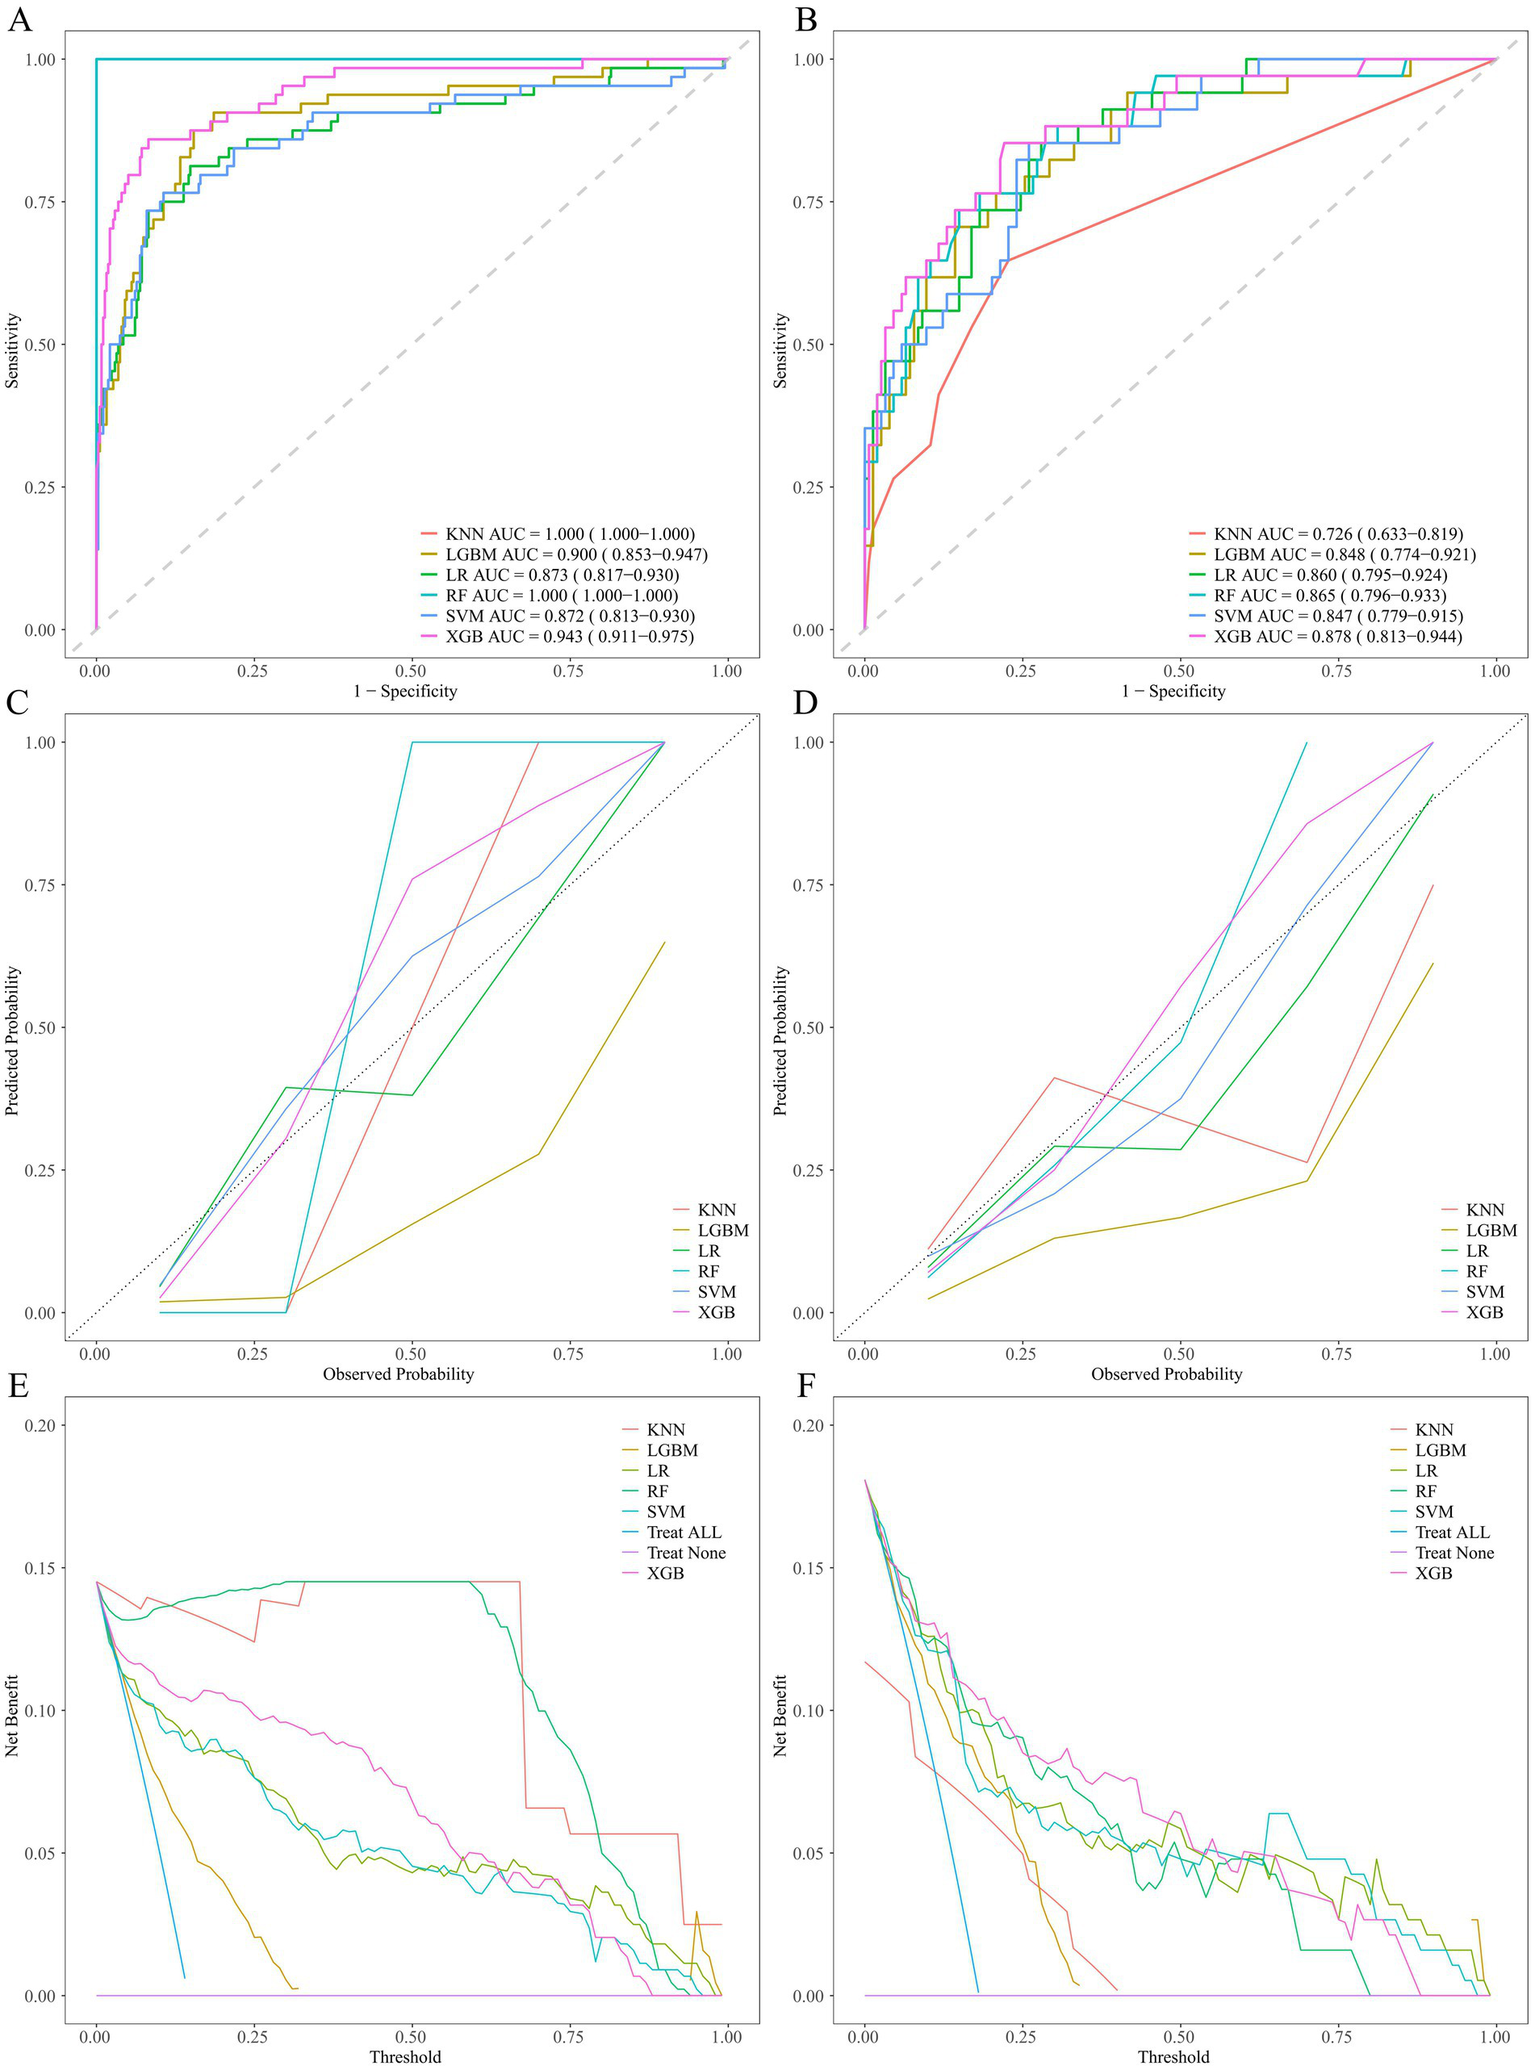
Performance comparison of ML models. ROC curves on the training group (A) and validation group (B). Calibration plots on the training group (C) and validation group (D). Decision curves on the training group (E) and validation group (F). ROC, receiver operating characteristic.
Figure 7

Variable Importance Plots in the XGB Model. (A) The Gain Metric; (B) The Cover Metri; (C) The Frequency Metric; (D) Shapley Additive exPlanations visualization.
4 Discussion
This study shows the correlation between anthropometric indicators of visceral obesity and the severity of AP, and demonstrates that the VAI is the most accurate anthropometric predictor of AP. Additionally, this study constructs an ML model using VAI and other common clinical variables and discovers that the XGB model may be a promising tool for the early prediction of the severity of AP patients.
In AP, mild cases only present with pancreatic edema and have a favorable prognosis (4). Conversely, severe cases may result in multiple OF throughout the body, with a mortality rate as high as 20–40% (5, 6). Therefore, assessing the severity of AP during the early stages of hospitalization is of considerable importance (7). Timely intervention for high-risk patients is a necessary condition for reducing mortality and improving prognosis. The current commonly used clinical scoring systems, on the one hand, are unable to complete the assessment as early as possible, and on the other hand, have complex parameters, thus being limited to a certain extent in clinical application. Furthermore, none of these clinical scoring systems take into account the differences in obesity or the distribution of visceral fat.
In recent years, apart from the traditional Body Mass Index (BMI), several anthropometric indices have been employed to assess fat distribution, such as BRI, CI, LAP, WTI, CMI, VAI, and CVAI. In a cross-sectional study involving tens of thousands of American adults, the BRI index was demonstrated to be a predictive marker for diabetes and prediabetes (35). They have, respectively, been verified and shown certain predictive efficacy in multiple diseases. In a study encompassing three databases, it was discovered that, compared with BMI, BRI is a clinical indicator that is more effective in assessing body fat conditions (21). CI was established as an indicator several decades ago (23). This index was formulated as an indicator for obesity and the distribution of body adiposity. LAP is a crucial indicator for various metabolic disorders, particularly obesity. It was found in a cohort of 1,912 obese adult subjects that LAP and CMI possess superior diagnostic accuracy for metabolic syndrome and can be utilized for the identification of metabolic syndrome (36).
In a study involving 279 women, it was discovered that LAP and VAI can effectively assess visceral fat distribution, indirectly express visceral obesity function. Moreover, they constitute more sensitive indicators for evaluating total body adiposity and fat accumulation in the central abdominal region in contrast to BMI (28). Liu et al. developed the indicator of WTI and discovered through cross-sectional studies that WTI presents differences in detecting metabolic syndrome in women and is a suitable marker for screening metabolic syndrome in population studies (26). A nationwide Chinese study of 60,000 participants found that WTI strongly predicted hyperuricemia (37). A study involving 47,683 adults in China found that CMI serves as a dependable new marker for identifying the metabolic obesity phenotype among individuals with normal weight (27). Research has shown that CVAI serves as a dependable and useful biomarker for assessing visceral adiposity dysfunction in the Chinese population, and it can also be employed to evaluate the metabolic health status of individuals in Asia (29).
A Chinese cohort of 3 million participants identified CVAI as a robust predictor of all-cause, cardiovascular, and cancer mortality (38). This finding underscores its potential value in health economic planning and secondary prevention. Currently, there is a lack of studies examining the relationship between anthropometric measurements and the severity of AP. So far, only prior research has addressed the link between these body metrics and the severity of HLAP (31). However, relevant studies on AP of all etiologies are lacking.
This study highlights the relationship between anthropometric indicators and AP in various disease patterns. This study explored the relationships between 11 anthropometric indicators (WC, BRI, BMI, ABSI, CI, WWI, LAP, WTI, CMI, VAI, and CVAI) and the severity of AP, and discovered that VAI, CMI, LAP, and WTI were independent predictors of the severity of AP. There existed a significant correlation among these four indicators, and they exhibited higher diagnostic capabilities compared to other anthropometric methods and common clinical scoring systems, providing a direction for risk prediction of the severity of AP. Zhu et al. verified the significant correlations between the indicators of VAI, CMI, and LAP and the severity of HLAP (31). These indicators, especially VAI, demonstrated the highest predictive capacity and were conducive to the prediction and assessment of the severity of HLAP. This is analogous to the results of this study. Nevertheless, although ABSI and WWI are anthropometric indicators of visceral obesity, they did not demonstrate a significant correlation with the severity of AP. To further validate the predictive capacity of the indicators, in this study, VAI and other common clinical indicators were employed to construct six ML models. As the indicators incorporated into the models were all routine examinations for AP patients, the constructed models were convenient and rapid, facilitating their application by clinicians in clinical practice. Furthermore, the models in this study exhibited relatively superior predictive accuracy. The results revealed that the XGB model presented the highest AUC in the validation group, along with relatively favorable calibration curves and DCA results. Consistent with our validation results showing AUC = 0.878, the XGB model is a promising tool for the early assessment of the severity of AP patients and possesses good clinical applicability.
This research showcases multiple strengths. Most importantly, it represents the first study to explore the relationship between AP and anthropometric indicators in a group sourced from a major tertiary hospital within the Chinese population. Secondly, the anthropometric indicators examined in this study can act as a cost-effective alternative approach for the early assessment of the severity of AP during hospitalization in specific patients (for instance, patients who are unable to obtain clinical scoring systems due to physical factors), which is more expeditious and convenient than traditional clinical scoring and can facilitate the application of clinicians in clinical practice. It showcases superior predictive accuracy. Among them, the predictive efficacy of VAI, CMI, LAP, and WTI is more outstanding than that of Ranson score, Glasgow score, BISAP, and APACHE II score, while showing a comparable predictive capacity to that of the SIRS score. Nonetheless, this study is not devoid of limitations. It is a retrospective analysis conducted at one institution, which may be susceptible to both selection bias and detection bias. Therefore, it should be interpreted cautiously. More extensive multicenter studies involving larger participant cohorts are warranted to validate the true predictive value of anthropometric indicators.
5 Conclusion
VAI, CMI, LAP, and WTI are independent predictors of AP severity, with VAI showing the highest individual predictive capability among them. The XGB model, incorporating VAI and routinely available clinical variables, achieved excellent performance (AUC = 0.878) for early severity assessment, offering a potentially rapid and cost-effective clinical tool. This supports the utility of visceral obesity anthropometric indicators and ML models for improving early risk stratification in AP.
Statements
Data availability statement
The data analyzed in this study is subject to the following licenses/restrictions: the datasets used and analyzed during the current study are available from the corresponding author on reasonable request. Requests to access these datasets should be directed to Dingzhou Wang, wdz199802@163.com.
Ethics statement
The studies involving humans were approved by the Ethics Committee of the First Affiliated Hospital of the Wenzhou Medical University. The studies were conducted in accordance with the local legislation and institutional requirements. The human samples used in this study were acquired from a by- product of routine care or industry. Written informed consent for participation was not required from the participants or the participants’ legal guardians/next of kin in accordance with the national legislation and institutional requirements.
Author contributions
KG: Formal analysis, Investigation, Methodology, Software, Writing – original draft. WS: Data curation, Resources, Writing – original draft. DW: Conceptualization, Supervision, Validation, Writing – review & editing.
Funding
The author(s) declare that no financial support was received for the research and/or publication of this article.
Conflict of interest
The authors declare that the research was conducted in the absence of any commercial or financial relationships that could be construed as a potential conflict of interest.
Generative AI statement
The authors declare that no Gen AI was used in the creation of this manuscript.
Publisher’s note
All claims expressed in this article are solely those of the authors and do not necessarily represent those of their affiliated organizations, or those of the publisher, the editors and the reviewers. Any product that may be evaluated in this article, or claim that may be made by its manufacturer, is not guaranteed or endorsed by the publisher.
Supplementary material
The Supplementary material for this article can be found online at: https://www.frontiersin.org/articles/10.3389/fmed.2025.1536090/full#supplementary-material
- AP
Acute pancreatitis
- MAP
Mild acute pancreatitis
- MSAP
Moderately severe acute pancreatitis
- SAP
Severe acute pancreatitis
- SIRS
Systemic inflammatory response syndrome
- BISAP
Bedside index of severity in acute pancreatitis
- APACHE II
Acute physiology and chronic health evaluation II
- JSS
Japanese severity score
- BMI
Body mass index
- BRI
Body roundness index
- ABSI
A body shape index
- WWI
Weight-adjusted waist index
- LAP
Lipid accumulation products
- WTI
Waist triglyceride index
- CMI
Cardiometabolic index
- VAI
Visceral adiposity index
- CVAI
Chinese visceral adiposity index
- OF
Organ failure
- WC
Waist circumference
- WBC
White blood cell
- RBC
Red blood cell
- Hb
Hemoglobin
- PLT
Platelet counts
- HCT
Hematocrit value
- TBil
Total bilirubin
- Alb
Albumin
- ALT
Alanine aminotransferase
- AST
Aspartate transaminase
- ALP
Alkaline phosphatase
- BG
Blood glucose
- BUN
Blood urea nitrogen
- Cr
Creatinine
- K+
Potassium
- Na+
Sodium
- Cl−
Chlorine
- Ca2+
Calcium
- AMY
Amylase
- TC
Total cholesterol
- TG
Triglyceride
- HDL
High-density lipoprotein cholesterol
- LDL
Low-density lipoprotein cholesterol
- LIP
Lipase
- CRP
C-reactive protein
- TT
Thrombin time
- PT
Prothrombin time
- Fib
Fibrinogen
- APTT
Activated partial thromboplastin time
- INR
International standardized ratio
- ML
Machine learning
- LASSO
Least Absolute Shrinkage and Selection Operator
- KNN
K-Nearest Neighbor
- LGBM
Light Gradient Boosting Machine
- LR
Logistic Regression
- RF
Random Forest
- SVM
Support Vector Machine
- XGB
eXtreme Gradient Boosting
- ROC
receiver operating characteristic
- AUC
area under the ROC curve
- DCA
decision curve analysis
Glossary
References
1.
Boxhoorn L Voermans RP Bouwense SA Bruno MJ Verdonk RC Boermeester MA et al . Acute pancreatitis. Lancet. (2020) 396:726–34. doi: 10.1016/S0140-6736(20)31310-6
2.
Xiao AY Tan ML Wu LM Asrani VM Windsor JA Yadav D et al . Global incidence and mortality of pancreatic diseases: a systematic review, meta-analysis, and meta-regression of population-based cohort studies. Lancet Gastroenterol Hepatol. (2016) 1:45–55. doi: 10.1016/S2468-1253(16)30004-8
3.
Iannuzzi JP King JA Leong JH Quan J Windsor JW Tanyingoh D et al . Global incidence of acute pancreatitis is increasing over time: a systematic review and Meta-analysis. Gastroenterology. (2022) 162:122–34. doi: 10.1053/j.gastro.2021.09.043
4.
Garg PK Singh VP . Organ failure due to systemic injury in acute pancreatitis. Gastroenterology. (2019) 156:2008–23. doi: 10.1053/j.gastro.2018.12.041
5.
Gapp J Hall AG Walters RW Jahann D Kassim T Reddymasu S . Trends and outcomes of hospitalizations related to acute pancreatitis: epidemiology from 2001 to 2014 in the United States. Pancreas. (2019) 48:548–54. doi: 10.1097/MPA.0000000000001275
6.
Lankisch PG Apte M Banks PA . Acute pancreatitis. Lancet. (2015) 386:85–96. doi: 10.1016/S0140-6736(14)60649-8
7.
Mederos MA Reber HA Girgis MD . Acute pancreatitis: a review. JAMA. (2021) 325:382–90. doi: 10.1001/jama.2020.20317
8.
Lee DW Cho CM . Predicting severity of acute pancreatitis. Medicina. (2022) 58:787. doi: 10.3390/medicina58060787
9.
Ranson JH Rifkind KM Roses DF Fink SD Eng K Localio SA . Objective early identification of severe acute pancreatitis. Am J Gastroenterol. (1974) 61:443–51.
10.
Kiat TTJ Gunasekaran SK Junnarkar SP Low JK Woon W Shelat VG . Are traditional scoring systems for severity stratification of acute pancreatitis sufficient?Ann Hepatobiliary Pancreat Surg. (2018) 22:105–15. doi: 10.14701/ahbps.2018.22.2.105
11.
Machicado JD Gougol A Tan X Gao X Paragomi P Pothoulakis I et al . Mortality in acute pancreatitis with persistent organ failure is determined by the number, type, and sequence of organ systems affected. United European Gastroenterol J. (2021) 9:139–49. doi: 10.1002/ueg2.12057
12.
Yang YX Li L . Evaluating the ability of the bedside index for severity of acute pancreatitis score to predict severe acute pancreatitis: a Meta-analysis. Med Princ Pract. (2016) 25:137–42. doi: 10.1159/000441003
13.
Di MY Liu H Yang ZY Bonis PA Tang JL Lau J . Prediction models of mortality in acute pancreatitis in adults: a systematic review. Ann Intern Med. (2016) 165:482–90. doi: 10.7326/M16-0650
14.
Knaus WA Zimmerman JE Wagner DP Draper EA Lawrence DE . APACHE-acute physiology and chronic health evaluation: a physiologically based classification system. Crit Care Med. (1981) 9:591–7. doi: 10.1097/00003246-198108000-00008
15.
Ueda T Takeyama Y Yasuda T Kamei K Satoi S Sawa H et al . Utility of the new Japanese severity score and indications for special therapies in acute pancreatitis. J Gastroenterol. (2009) 44:453–9. doi: 10.1007/s00535-009-0026-x
16.
Grier T Canham-Chervak M Sharp M Jones BH . Does body mass index misclassify physically active young men. Prev Med Rep. (2015) 2:483–7. doi: 10.1016/j.pmedr.2015.06.003
17.
Batsis JA Villareal DT . Sarcopenic obesity in older adults: aetiology, epidemiology and treatment strategies. Nat Rev Endocrinol. (2018) 14:513–37. doi: 10.1038/s41574-018-0062-9
18.
Flegal KM . BMI and obesity trends in Chinese national survey data. Lancet. (2021) 398:5–7. doi: 10.1016/S0140-6736(21)00892-8
19.
Nevill AM Stewart AD Olds T Holder R . Relationship between adiposity and body size reveals limitations of BMI. Am J Phys Anthropol. (2006) 129:151–6. doi: 10.1002/ajpa.20262
20.
Romero-Corral A Somers VK Sierra-Johnson J Thomas RJ Collazo-Clavell ML Korinek J et al . Accuracy of body mass index in diagnosing obesity in the adult general population. Int J Obes. (2008) 32:959–66. doi: 10.1038/ijo.2008.11
21.
Thomas DM Bredlau C Bosy-Westphal A Mueller M Shen W Gallagher D et al . Relationships between body roundness with body fat and visceral adipose tissue emerging from a new geometrical model. Obesity. (2013) 21:2264–71. doi: 10.1002/oby.20408
22.
Gomez-Peralta F Abreu C Cruz-Bravo M Alcarria E Gutierrez-Buey G Krakauer NY et al . Relationship between "a body shape index (ABSI)" and body composition in obese patients with type 2 diabetes. Diabetol Metab Syndr. (2018) 10:21. doi: 10.1186/s13098-018-0323-8
23.
Valdez R . A simple model-based index of abdominal adiposity. J Clin Epidemiol. (1991) 44:955–6. doi: 10.1016/0895-4356(91)90059-I
24.
Kim KJ Son S Kim KJ Kim SG Kim NH . Weight-adjusted waist as an integrated index for fat, muscle and bone health in adults. J Cachexia Sarcopenia Muscle. (2023) 14:2196–203. doi: 10.1002/jcsm.13302
25.
Taverna MJ Martínez-Larrad MT Frechtel GD Serrano-Ríos M . Lipid accumulation product: a powerful marker of metabolic syndrome in healthy population. Eur J Endocrinol. (2011) 164:559–67. doi: 10.1530/EJE-10-1039
26.
Liu PJ Lou HP Zhu YN . Screening for metabolic syndrome using an integrated continuous index consisting of waist circumference and triglyceride: a preliminary cross-sectional study. Diabetes Metab Syndr Obes. (2020) 13:2899–907. doi: 10.2147/DMSO.S259770
27.
Liu X Wu Q Yan G Duan J Chen Z Yang P et al . Cardiometabolic index: a new tool for screening the metabolically obese normal weight phenotype. J Endocrinol Investig. (2021) 44:1253–61. doi: 10.1007/s40618-020-01417-z
28.
Kogure GS Ribeiro VB Mendes MC Ferriani RA Furtado CLM Dos Reis RM . Dual-energy X-ray absorptiometry and adiposity index are sensitive methods to evaluate central fat accumulation in women with polycystic ovary syndrome and normal body mass index. Arch Endocrinol Metab. (2023) 67:e000627. doi: 10.20945/2359-3997000000627
29.
Xia MF Chen Y Lin HD Ma H Li XM Aleteng Q et al . A indicator of visceral adipose dysfunction to evaluate metabolic health in adult Chinese. Sci Rep. (2016) 6:38214. doi: 10.1038/srep38214
30.
Xia W Yu H Huang Y Yang Y Shi L . The visceral adiposity index predicts the severity of hyperlipidaemic acute pancreatitis. Intern Emerg Med. (2022) 17:417–22. doi: 10.1007/s11739-021-02819-4
31.
Zhu Y Huang Y Sun H Chen L Yu H Shi L et al . Novel anthropometric indicators of visceral obesity predict the severity of hyperlipidemic acute pancreatitis. Lipids Health Dis. (2024) 23:120. doi: 10.1186/s12944-024-02112-1
32.
Banks PA Bollen TL Dervenis C Gooszen HG Johnson CD Sarr MG et al . Classification of acute pancreatitis--2012: revision of the Atlanta classification and definitions by international consensus. Gut. (2013) 62:102–11. doi: 10.1136/gutjnl-2012-302779
33.
Joo I Kwak MS Park DH Yoon SH . Fully automated waist circumference measurement on abdominal CT: comparison with manual measurements and potential value for identifying overweight and obesity as an adjunct output of CT scan. PLoS One. (2021) 16:e0254704. doi: 10.1371/journal.pone.0254704
34.
van Dijk SM Hallensleben NDL van Santvoort HC Fockens P van Goor H Bruno MJ et al . Acute pancreatitis: recent advances through randomised trials. Gut. (2017) 66:2024–32. doi: 10.1136/gutjnl-2016-313595
35.
Qiu L Xiao Z Fan B Li L Sun G . Association of body roundness index with diabetes and prediabetes in US adults from NHANES 2007-2018: a cross-sectional study. Lipids Health Dis. (2024) 23:252. doi: 10.1186/s12944-024-02238-2
36.
Tamini S Bondesan A Caroli D Sartorio A . The lipid accumulation product index (LAP) and the Cardiometabolic index (CMI) are useful for predicting the presence and severity of metabolic syndrome in adult patients with obesity. J Clin Med. (2024) 13:843. doi: 10.3390/jcm13102843
37.
Chen D Lu C Chen K Liu T Li Y Shan Z et al . Association between anthropometric indices and hyperuricemia: a nationwide study in China. Clin Rheumatol. (2024) 43:907–20. doi: 10.1007/s10067-024-06884-w
38.
Wu X Wang C Lv D Chen B Wu Y Wu X et al . Associations between Chinese visceral adiposity index and risks of all-cause and cause-specific mortality: a population-based cohort study. Diabetes Obes Metab. (2024) 26:1264–72. doi: 10.1111/dom.15424
Summary
Keywords
acute pancreatitis, anthropometric indicator, visceral adiposity index, organ failure, severity, machine learning algorithm
Citation
Gu K, Shang W and Wang D (2025) Visceral obesity anthropometric indicators as predictors of acute pancreatitis severity. Front. Med. 12:1536090. doi: 10.3389/fmed.2025.1536090
Received
28 November 2024
Accepted
01 July 2025
Published
11 July 2025
Volume
12 - 2025
Edited by
Rawad Hodeify, American University of Ras Al Khaimah, United Arab Emirates
Reviewed by
Vinod Kumar Yata, Malla Reddy University, India
Bhowmick Mithu, Apollo Hospitals, Guwahati, India
Updates
Copyright
© 2025 Gu, Shang and Wang.
This is an open-access article distributed under the terms of the Creative Commons Attribution License (CC BY). The use, distribution or reproduction in other forums is permitted, provided the original author(s) and the copyright owner(s) are credited and that the original publication in this journal is cited, in accordance with accepted academic practice. No use, distribution or reproduction is permitted which does not comply with these terms.
*Correspondence: Dingzhou Wang, wdz199802@163.com
Disclaimer
All claims expressed in this article are solely those of the authors and do not necessarily represent those of their affiliated organizations, or those of the publisher, the editors and the reviewers. Any product that may be evaluated in this article or claim that may be made by its manufacturer is not guaranteed or endorsed by the publisher.