 Tamizhini Loganathan
 C. George Priya Doss
- Laboratory of Integrative Genomics, Department of Integrative Biology, School of Bio Sciences and Technology, Vellore Institute of Technology (VIT), Vellore, Tamil Nadu, India
Introduction: Breast cancer (BC) and diabetes are multifaceted diseases with interconnected molecular mechanisms that are not yet fully elucidated. These diseases share common risk factors, biological pathways, and treatment outcomes.
Methods: This study utilizes an integrative computational approach to investigate the interplay between BC and diabetes in African American (AA) and European American (EA) cohorts. It employs transcriptomic and exomic analyses to identify shared pathways and potential therapeutic targets.
Results: The pooled cohort of differential expression analysis identified 2,815 genes differentially expressed in BC patients with diabetes compared to those without diabetes, including 1824 upregulated and 990 downregulated genes. We reanalyzed transcriptomic data by stratifying BC patients with and without diabetes into two cohorts, identifying 3,245 DEGs in AA and 3,208 DEGs in EA, with 786 genes commonly altered between both groups. Whole-exome sequencing (WES) of 23 BC patients with diabetes revealed 899 variants across 208 unique genes, predominantly missense mutations. Among these, nine key genes were prioritized, with TNFRSF1B (L264P) and PDPN (A105G) identified as the most deleterious variants. Functional enrichment analyses highlighted the significant involvement of pathways related to extracellular matrix organization, angiogenesis, immune regulation, and signaling processes critical to cancer progression and metabolic dysfunction. The TNF pathway emerged as a central link connecting chronic inflammation, insulin resistance, and tumor growth. TNF-mediated mechanisms, including NF-κB activation, oxidative stress, and epithelial-to-mesenchymal transition (EMT), were found to drive both diseases, promoting tumorigenesis, immune evasion, and metabolic dysregulation.
Conclusion: This study provides critical molecular insights into the shared mechanisms of BC and diabetes, identifying the TNF pathway as a key therapeutic target to improve outcomes for patients with these interconnected conditions.
1 Introduction
Breast cancer (BC) is a multifaceted disease characterized by a wide range of genetic, molecular, and phenotypic variations (1). It remains one of the most prevalent malignancies among women worldwide, with significant heterogeneity in its clinical presentation, prognosis, and therapeutic response (2). Concurrently, diabetes, a chronic metabolic disorder characterized by hyperglycemia and insulin resistance, has been increasingly recognized as a comorbidity that influences cancer risk, progression, and treatment outcomes (3, 4). The intersection of BC and diabetes presents a unique and challenging clinical scenario that warrants a deeper understanding of the underlying molecular mechanisms and potential biomarkers (5). Diabetes has been implicated in altering the tumor microenvironment, enhancing chronic inflammation, promoting oxidative stress, and disrupting metabolic pathways, all of which can contribute to cancer initiation and progression (6, 7). The coexistence of diabetes with BC introduces additional layers of complexity, influencing tumor biology, therapeutic efficacy, and patient survival (3). Patients with diabetes are often associated with poor outcomes, including higher recurrence rates and reduced overall survival, potentially due to delayed diagnosis, altered pharmacokinetics of anticancer drugs, and the impact of hyperglycemia on cancer cell metabolism (8).
Advancements in high-throughput technologies, such as transcriptomics and exome sequencing, have significantly enhanced our ability to understand the molecular landscape of diseases (9). Exome sequencing facilitates the identification of somatic mutations, copy number variations, and other genomic alterations that drive cancer development (10). Conversely, transcriptomics provides insights into gene expression patterns, revealing dysregulated pathways and potential therapeutic targets (11, 12). Integrating transcriptomics and exome data has proven to be a powerful approach to uncover genetic and transcriptomic alterations, providing a more comprehensive understanding of the molecular mechanisms driving conditions such as cancer and other diseases. This integration has the potential to identify novel biomarkers and therapeutic targets. Biomarkers are invaluable for stratifying patients, predicting therapeutic responses, and monitoring disease progression (13–15). Few studies have explored the diabetes-associated gene expression profiles in BC, revealing the unique signatures that could be targeted therapeutically or used as diagnostic tools (16–19). Understanding the molecular interplay between BC and diabetes can pave the way for personalized medicine approaches, ensuring more effective and tailored treatments.
In this study, we aim to explore the biomarker landscape in BC with diabetes (African American (AA) and European American (EA) cohorts) through a comprehensive analysis of transcriptomics and exome data. By examining the transcriptomic and genomic profiles specific to this cohort, we seek to identify key molecular players and pathways that underlie the interaction between these two conditions. Our findings could provide insights into the mechanistic basis of BC in diabetic patients, highlight potential therapeutic vulnerabilities, and contribute to the development of precision oncology strategies. The detailed workflow is illustrated in Figure 1.
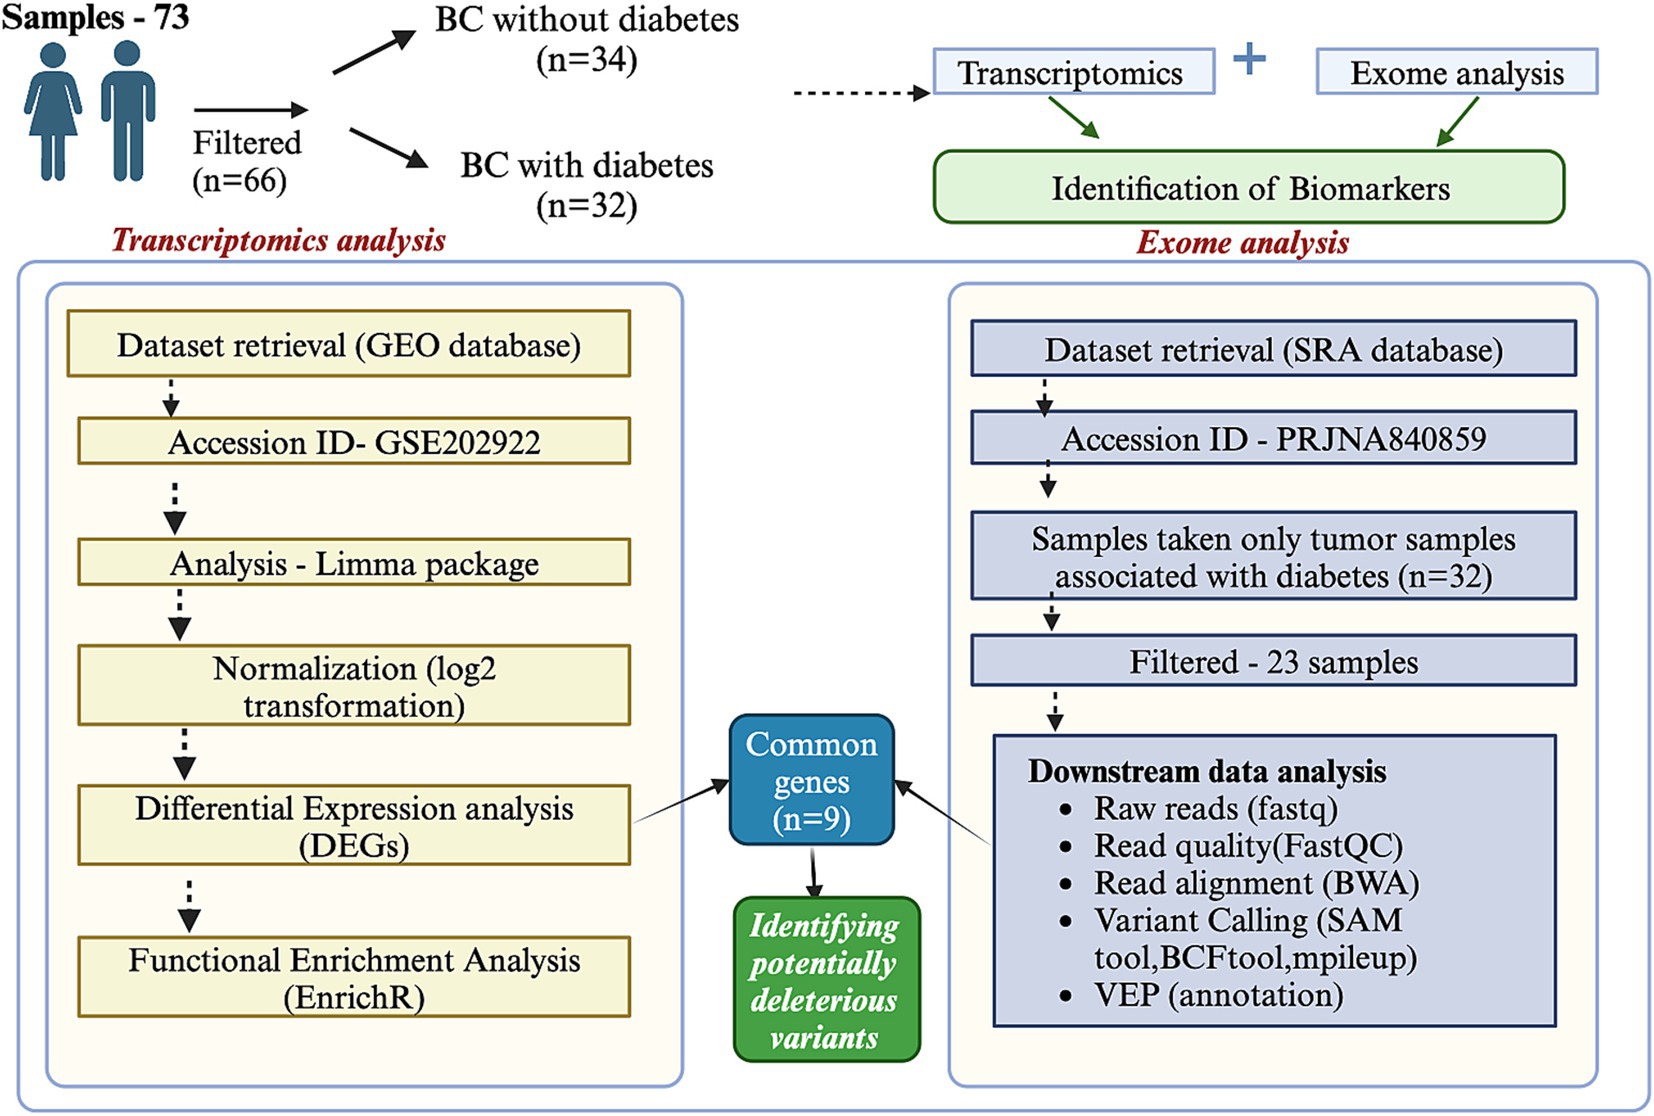
Figure 1. Integration of transcriptomics and exome data analysis. The figure illustrates the workflow and outcomes of integrating transcriptomics and exome data analysis. Transcriptomics data provides insights into differential gene expression across conditions, while exome data reveals coding region mutations. The integration identifies overlapping features, including genes with significant expression changes and mutations. This combined approach highlights key biomarkers, potential driver genes, and pathways associated with the biological process of interest.
2 Materials and methods
2.1 Transcriptomics data analysis
All data used in this study were obtained from the NCBI database. We acquired the gene expression profiling dataset produced through high-throughput sequencing (GSE202922) (16) using Illumina HiSeq 3,000 from the publicly available GEO database (20). The dataset has a total of 73 samples, and a further 66 samples have raw counts. A total of 66 samples were included in this study, comprising 32 diabetic and 34 non-diabetic cases. The detailed metadata information, along with transcriptomics data of the 66 samples, were described in Supplementary Table 1 and Supplementary Figure 1A. We also conducted race-specific transcriptomic analyses using datasets from African American (AA) and European American (EA) cohorts. The metadata for these cohorts is provided in Supplementary Table 2. GEO2R is a web-based analysis tool that enables user to compare multiple sample groups within a GEO Series to find deregulated genes under certain experimental conditions (21). Moreover, differentially expressed genes (DEGs) were detected using the limma R package (22), applying a threshold of |log2FoldChange| > = 0.5, adj p < =0.05, and p < = 0.05. All statistical analyses and data visualization were carried out using R/Bioconductor packages. Statistical plots such as boxplot and UMAP plot were performed and analyzed.
2.2 Exome data analysis
The study also utilized Whole Exome Sequencing (WES) data with ID: PRJNA840859 comprising 32 individuals with BC-associated diabetes (16). Supplementary Figure 1B provides detailed information on the selected exome data. After verifying the availability of exome data, 23 sample reads were retrieved and analyzed. These samples were subjected to exome sequence analysis. Sequencing was performed on Illumina NovaSeq 6,000 systems, generating paired-end reads. A shell script was employed to download the sequencing reads from the ENA database (23). The exome sequencing pipeline involves a comprehensive workflow for processing, analyzing, and interpreting genetic data to ensure high accuracy and reliability in identifying variants. The process begins with quality control using FastQC (24), which evaluates critical metrics such as read quality scores, GC content, and adapter contamination. This step helps to identify potential issues in the raw FASTQ files, ensuring only high-quality reads proceed to the next stage. Tools like Trimmomatic remove low-quality bases and adapter sequences in the read preprocessing step. Reads with quality scores below a threshold (commonly Q30) are trimmed or discarded, producing a clean dataset suitable for downstream analysis. Next, the high-quality reads are aligned to the human reference genome GRCh38 (25) using the BWA-MEM algorithm (26), a widely used tool for efficient and accurate alignment of short-read sequences. This step generates SAM files containing mapped reads and their corresponding positions on the genome. These SAM files are converted into BAM format using SAMtools, sorted by coordinate order, and indexed to enable efficient querying and visualization in downstream applications. The variant calling step identifies genetic variants such as SNPs and indels (27). BCFtools generate a pileup of aligned reads, and variants are called highly confidently (28). The resulting data is output in the Variant Call Format (VCF), which contains detailed information about each identified variant.
Once variants are called, they undergo filtering and annotation. Each sample VCF was merged using the “VCFmerge tool” and the Galaxy tool. The Ensembl Variant Effect Predictor (VEP) was used to annotate the functional consequences of genes (29). Filtering ensures that only high-confidence variants are retained by removing low-quality or potentially false-positive calls. Tools like the BCFtools filter allow for applying stringent criteria, such as minimum quality scores or read depth thresholds. Annotating the filtered variants with databases such as dbSNP and ClinVar provides functional insights, including potential pathogenicity, population frequency, and relevance to known diseases. The missense variants were retrieved and further used for functional analysis.
2.3 Functional enrichment analysis
Functional analysis of the differentially expressed genes (DEGs) identified from the transcriptomic analysis was conducted using EnrichR (30). Additionally, common genes identified from both transcriptomic and exome analyses were analyzed. Functional enrichment analysis included Gene Ontology categories: Biological Process (GO-BP), Cellular Component (GO-CC), and Molecular Function (GO-MF), as well as pathway analyses using KEGG and Reactome. Protein-coding genes with a p-value < 0.05 were used as the background gene set.
2.4 Identification of potentially deleterious variants
Genes featuring missense variants from a curated in-house list of cancer-associated genes were subsequently examined for functional effects using the PredictSNP web tool (31). This examination utilized six well-known predictive tools, MAPP, PhD-SNP, PolyPhen-1, PolyPhen-2, SIFT, and SNAP, to detect potentially harmful variants (missense).
MAPP demonstrated that the likelihood of disease or cancer risk is closely linked to breaches of physicochemical limitations due to amino acid variations (32). PhD-SNP, based on support vector machines (SVMs), was used to determine whether a given point mutation was a neutral polymorphism or associated with genetic disorders (33). PolyPhen-1 analyzed the impact of missense variants on protein structure and function (34). In contrast, PolyPhen-2 incorporated both sequence- and structure-based features, utilizing a Naïve Bayesian classifier to predict the consequences of amino acid substitutions. Variants identified as “probably damaging” or “possibly damaging” (scores ≥0.5) were categorized as harmful, whereas “benign” variants (scores <0.5) were regarded as acceptable. Scores nearer to 1.0 were more prone to be damaging (35).
SIFT predicted the potential harm of variants using a normalized probability score, where scores <0.05 were deemed harmful and scores ≥0.05 were considered neutral. The SIFT score assessed the effect of amino acid substitutions on protein function (36). SNAP was used to evaluate the functional impact of missense variants (37). Protein stability alterations due to single-point variants were forecasted using I-Mutant 2.0, which categorized variants into two groups: reduced stability (<0 kcal/mol -decrease) and enhanced stability (>0 kcal/mol – increase) (38).
The evolutionary conservation of amino acid positions for the most deleterious variants were assessed using the ConSurf online tool. Conservation scores ranges from 1 (most variable positions) to 9 (most conserved positions), providing insights into the variants’ functional significance (39).
3 Results
3.1 Transcriptomics and functional analysis of pooled cohort
To identify differentially expressed genes (DEGs) between BC patients with and without diabetes, we utilized normalized expression data from the GEO database. The GEO2R tool, based on the limma package, was employed for the analysis. 2,814 DEGs were analyzed across 66 samples, including BC without and BC with diabetes samples. A boxplot is a graphical representation of the distribution of a dataset that shows its central tendency and variability. It provides a concise summary of the data’s statistical properties across samples. The boxplot of each group comparison is mentioned in the Figure 2A. A UMAP plot is a dimensionality reduction technique that is particularly useful for visualizing high-dimensional data, such as gene expression values plotted in Figure 2B. The comparison revealed 2,814 DEGs comprising 1824 upregulated and 990 downregulated genes (p-value <= 0.05, adj p-value <= 0.05, |log2 fold change| > =0.5). The DEGs were visualized using a volcano plot (Figure 2C), highlighting significant genes with biological relevance. The detailed results of DEGs are mentioned in Supplementary Table 3. The heatmap illustrates the expression levels of selected genes across 66 samples, with rows representing genes and columns representing samples, as mentioned in Figure 2D.

Figure 2. Statistical plots of transcriptomics data. (A) The boxplot represents the distribution of normalized transcriptomics data across all samples. Each box corresponds to an individual sample, with the central line representing the median expression level. (B) The UMAP plot illustrates the clustering of transcriptomics data, with each point representing an individual sample. Samples are color-coded based on their respective groups (BC with diabetes vs. BC without diabetes). This visualization highlights the underlying structure and relationships in the dataset, revealing group-specific patterns. The “YES” label represents the BC with diabetes, and the “NO” label represents the BC without diabetes. The color-coded representation of the “YES” label is green, and the “NO” label is purple. (C) The volcano plot shows the relationship between statistical significance for all genes. Significant upregulated and downregulated genes are highlighted in distinct colors with respective thresholds. This visualization identifies key differentially expressed genes. The red denotes the upregulated genes, and the blue indicates the down-regulated genes. (D) The heatmap visualizes the expression levels of selected genes across 66 samples. Rows represent genes, and columns represent samples.
The functional enrichment analysis of 2,814 DEGs was performed using EnrichR. The background genes are protein-coding genes with p-value<=0.05. The functional terms are GO (Gene ontology) terms and KEGG pathways. Significant enrichment is seen in processes such as extracellular matrix organization, regulation of cell migration, angiogenesis, and circulatory system development. These are key processes in tissue remodeling, cancer metastasis, and vascular development. Highlighted components include collagen-containing extracellular matrix, cell junctions, plasma membrane raft, and sarcolemma. These components are critical for cellular integrity, signaling, and intercellular communication. Functions such as tyrosine kinase activity, platelet-derived growth factor binding, and kinase inhibitor activity dominate. These molecular functions are often associated with signaling pathways and therapeutic targets in cancer and other diseases. Enriched pathways include systemic lupus erythematosus, cell cycle regulation, ECM-receptor interaction, and PI3K-Akt signaling. These pathways are relevant to immune disorders, cancer progression, and extracellular matrix interactions. The results suggest an association with processes and pathways related to cancer progression, immune regulation, and extracellular matrix dynamics. The length of the bar indicates the top function in the barplot. The detailed functional results are mentioned in Figure 3.

Figure 3. Functional enrichment analysis (transcriptomics). The figure showcases the functional enrichment analysis of differentially expressed genes (DEGs) derived from transcriptomics data. (A) GO-BP, (B) GO-CC, (C) GO-MF, and (D) KEGG pathways. Bar sizes indicate statistical significance (adjusted p-values) and gene ratios, providing insights into DEGs’ molecular and functional context.
3.2 Transcriptomics and functional analysis of AA and EA cohorts
To identify DEGs between BC patients with and without diabetes, we analyzed normalized expression data from the GEO database separately for African American (AA) and European American (EA) cohorts. The analysis was performed using the GEO2R tool, which is based on the limma package. In the African American (AA) cohort, a total of 3,245 differentially expressed genes (DEGs) were identified from 57 samples, including 1,922 upregulated and 1,323 downregulated genes, based on thresholds of p-value ≤ 0.05, adjusted p-value ≤ 0.05, and |log₂ fold change| ≥ 0.5. Similarly, in the European American (EA) cohort, 3,208 DEGs were detected across 17 samples, with 1,640 genes upregulated and 1,568 downregulated using the same statistical criteria. Notably, 786 DEGs were found to be shared between the AA and EA cohorts. The statistical plots of boxplot and UMAP were performed and mentioned in Supplementary Figure 2. The detailed information of DEGs of both the cohorts were mentioned in the Supplementary Tables 4, 5.
The functional enrichment analysis of each cohort was performed. The functional enrichment analysis of 3,245 (AA cohort) and 3,208 (EA cohort) DEGs was performed using EnrichR. The background genes are protein-coding genes with p-value<=0.05. Some of the KEGG’s significant functions are cell cycle, ECM receptor interactions, PI3K-Akt signaling, and AGE-RAGE signaling pathway in diabetic complications, and these functions were specific to the AA cohort. Some of the important functions in the EA cohort are Oxidative phosphorylation and Diabetic cardiomyopathy. The detailed information on these enrichment analyses is mentioned in Supplementary Figures 3, 4.
The Venn diagram illustrates the overlap in transcriptomic data between the African American (AA) and European American (EA) cohorts, revealing 786 genes common to both groups (Supplementary Figure 5A). Further functional analysis of GO-BP,GO-CC,GO-MF and KEGG pathways were performed on common genes. Some of the important functions are Notch signaling pathway and Hippo signaling pathway. Both these functions were related to BC and diabetes. The detailed functional enrichment analysis were mentioned in the Supplementary Figures 5B–E.
3.3 Exome data analysis
We retrieved WES datasets for BC with diabetes from the NCBI SRA database. The tumor data of BC with diabetes (n = 23) were only taken for further analysis. Each sample was processed using a computational pipeline tailored to laboratory protocols. Sequence quality was assessed using the FastQC tool. High-quality data for analysis was ensured by trimming low-quality reads, removing adapters, and further validating the sequences’ base quality. Following the evaluation of read quality, the final reads were mapped to the human reference genome GRCh38.p13 (hg38) utilizing the BWA aligner with default settings. Every dataset attained a total alignment rate surpassing 85%. SAM tools were employed to process and enhance the sequenced files further in the “SAM” format. The SAM files were first transformed into BAM format by utilizing the “samtools view” command. This transformation enabled later processes, including file sorting, indexing, and arranging mapped reads for further analysis. Prior to indexing, samtools organized the aligned reads and clustered them according to particular genomic areas. In conclusion, base calls from the mapped reads aligned to the reference sequence were compiled using the “samtools mpileup” command.
After processing the output from “mpileup” with BCFtools, SNPs in relation to the reference genome were identified and interpreted as variations. The VCF and its binary counterpart, BCF, were used in the analysis to handle the data. The resulting output for each dataset was provided in a VCF format, containing detailed information about variant positions, types, and quality. Each VCF file was annotated using the Ensembl VEP database (release 113) which provided a thorough analysis of the variants detected in each sample. All identified variants are single-nucleotide (SNVs), accounting for 100% of the dataset. There are two types of variants: non-coding variants and coding variants. The non-coding variants constitute 56.9% of the total, including regions like upstream, downstream, and intronic variants. The coding variants represent 43.1%, further categorized into missense variants 96%, synonymous variants 3%, stop-gained 1%, and no start-lost variants. The results are depicted in Figure 4A. Among the 3,238 observed missense variants in the VCF file, filtered 899 missense variants were chosen for further analysis (no novel variants were detected) (Figure 4B). After removing duplicate genes in the 298 overlapped genes, 208 unique genes were finalized for further analysis. The detailed results of missense variants are mentioned in Supplementary Table 6. The distribution of 208 genes with respective metadata is depicted in Figure 5.
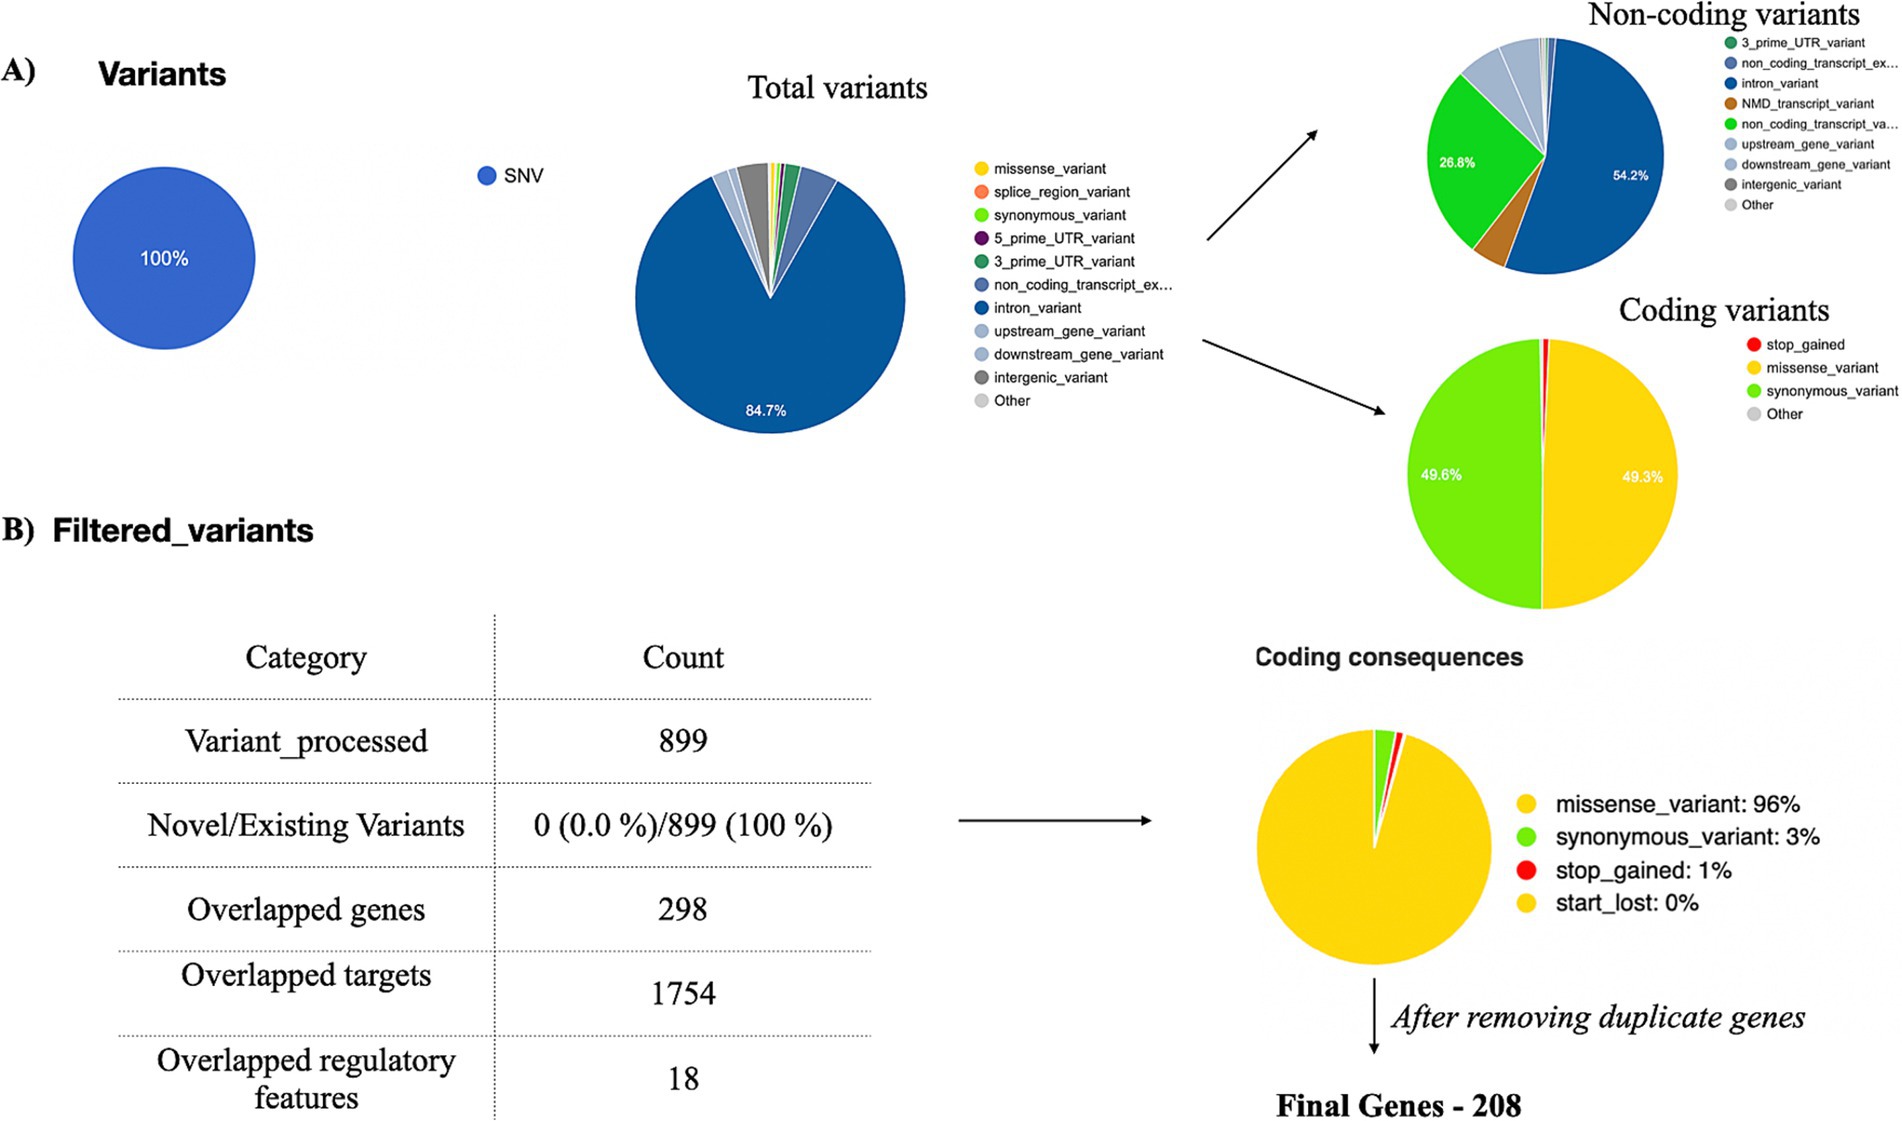
Figure 4. Exome data analysis. Exome data analysis was conducted on tumor samples (n = 23) from breast cancer patients with diabetes. Variants were annotated using the VEP tool. (A) A pie chart was generated to classify coding and non-coding variants. (B) Among the filtered coding variants, 96% were identified as missense variants. A total of 208 missense variants, derived from all 23 samples, were selected for further analysis.
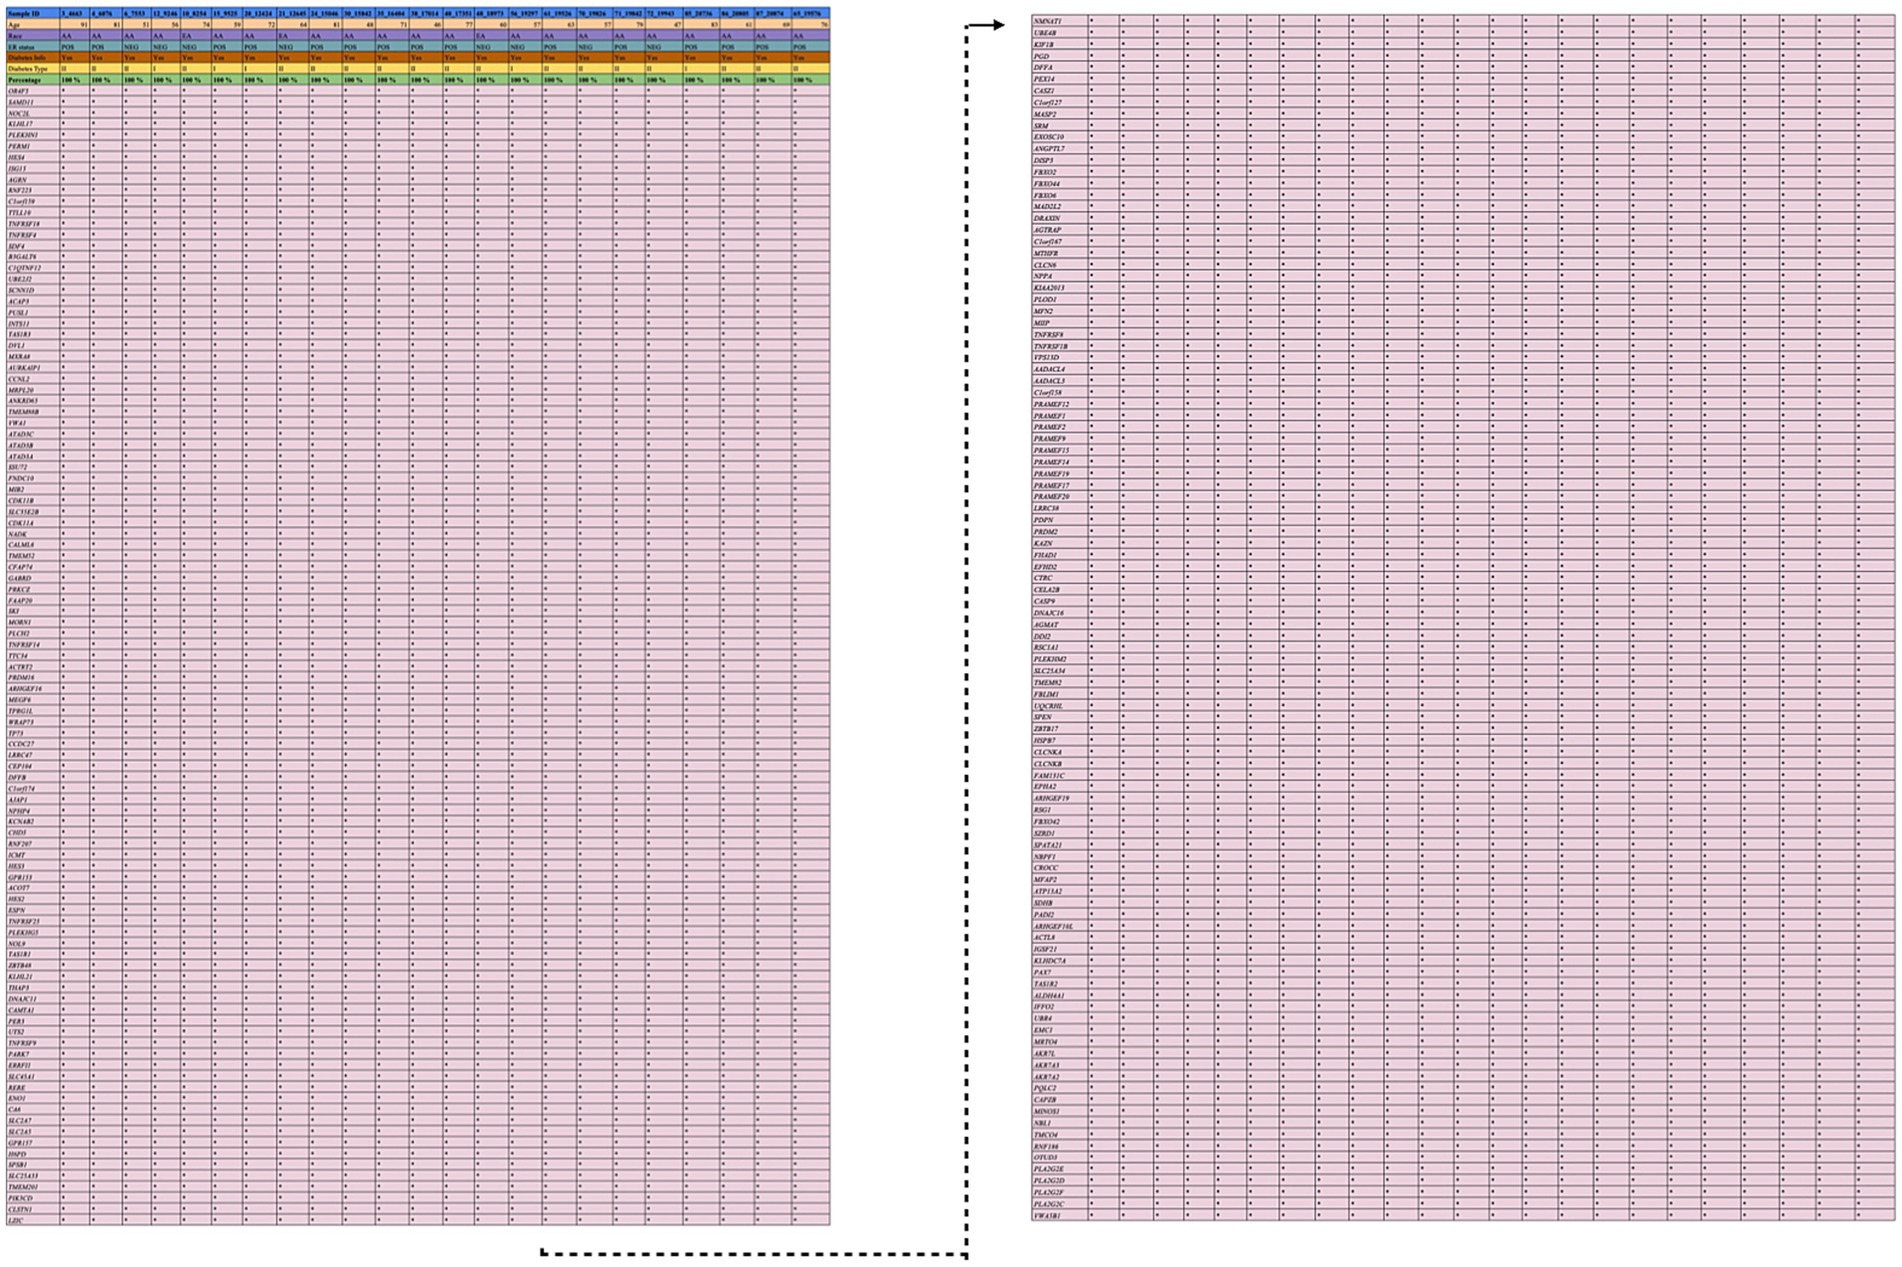
Figure 5. Distribution of variants. This figure illustrates the distribution of genetic variants observed in 23 samples, stratified by metadata variables such as age, race, ER status, diabetes type, and diabetes info. Each sample is represented as a distinct bar or point, categorized by metadata groups.
3.4 Identification of shared genes and their respective functional analysis
The Venn diagram illustrates the overlap between transcriptomic and exomic data. A total of 2,804 unique genes were identified only in transcriptomic analysis. One hundred ninety-seven unique genes are found exclusively in the exomic data. Eleven genes are shared between the datasets, representing key potentially important genes across transcriptional and mutational levels. The two genes with no variations were excluded from the analysis. The nine genes comprises six upregulated genes (SKI, TNFRSF1B, PDPN, SLC25A34, EPHA2, and IFFO2) and three down-regulated genes (ARHGEF16, FBXO6, and PADI2). The results of overlap genes are mentioned in Figure 6A. We compared the selected genes across two different cohorts AA and EA populations. Four genes such as SKI, TNFRSF1B, SLC25A34, and EPHA2, were present in both cohorts.

Figure 6. Overlapping genes and functional analysis. This figure shows the overlapping genes identified through integrative analysis of exome sequencing and transcriptomics data. The shared genes represent a subset with potential biological functions. (A) Eleven genes overlapped the exome and transcriptomics data. The functional analysis of common genes was performed. (B) GO-BP, (C) GO-CC, and (D) GO-MF. (E) Reactome pathways.
The functional analysis of nine genes was performed and analyzed, including the functional categories such as GO-BP, GO-CC, GO-MF, and the Reactome pathway. The GO-BP enriched terms include protein localization processes and synaptic pathways, reflecting cellular organization and signaling roles. The GO-CC, the enriched components, such as synaptic and endosomal compartments, highlight cellular compartmentalization for signaling and transport. The GO-MF of enriched functions includes ubiquitin-protein ligase binding, TNF activity, chemokine activity, and cadherin binding, which are crucial for protein regulation and cellular interactions. The Reactome pathways enriched are RHOG GTPase cycle, TNFs Bind their physiological receptors. The other pathways include EPHA-mediated growth cone collapse and signaling pathways. The functional results are mentioned in the Figures 6B–E. These variations were taken for further analysis.
3.5 Identification of potential variants
The analysis involved nine genes, focusing on identifying the most deleterious variants using a comprehensive suite of online prediction tools. These tools included PredictSNP, MAPP, PhD-SNP, PolyPhen-1, PolyPhen-2, SIFT, SNAP, and PANTHER, each offering distinct methodologies for assessing variant pathogenicity. The prediction results provided detailed insights into the potential impact of these variants on protein function and structure. A summary of the findings, highlighting the pathogenicity scores from each tool for the identified variants, is presented in Table 1. This table serves as a consolidated resource, showcasing the comparative outcomes from all tools, thus facilitating an in-depth evaluation of the most deleterious genetic changes. Among these nine genes, the TNFRSF1B (L264P) and PDPN (A105G) were the top 2 variants predicted by the above tools.
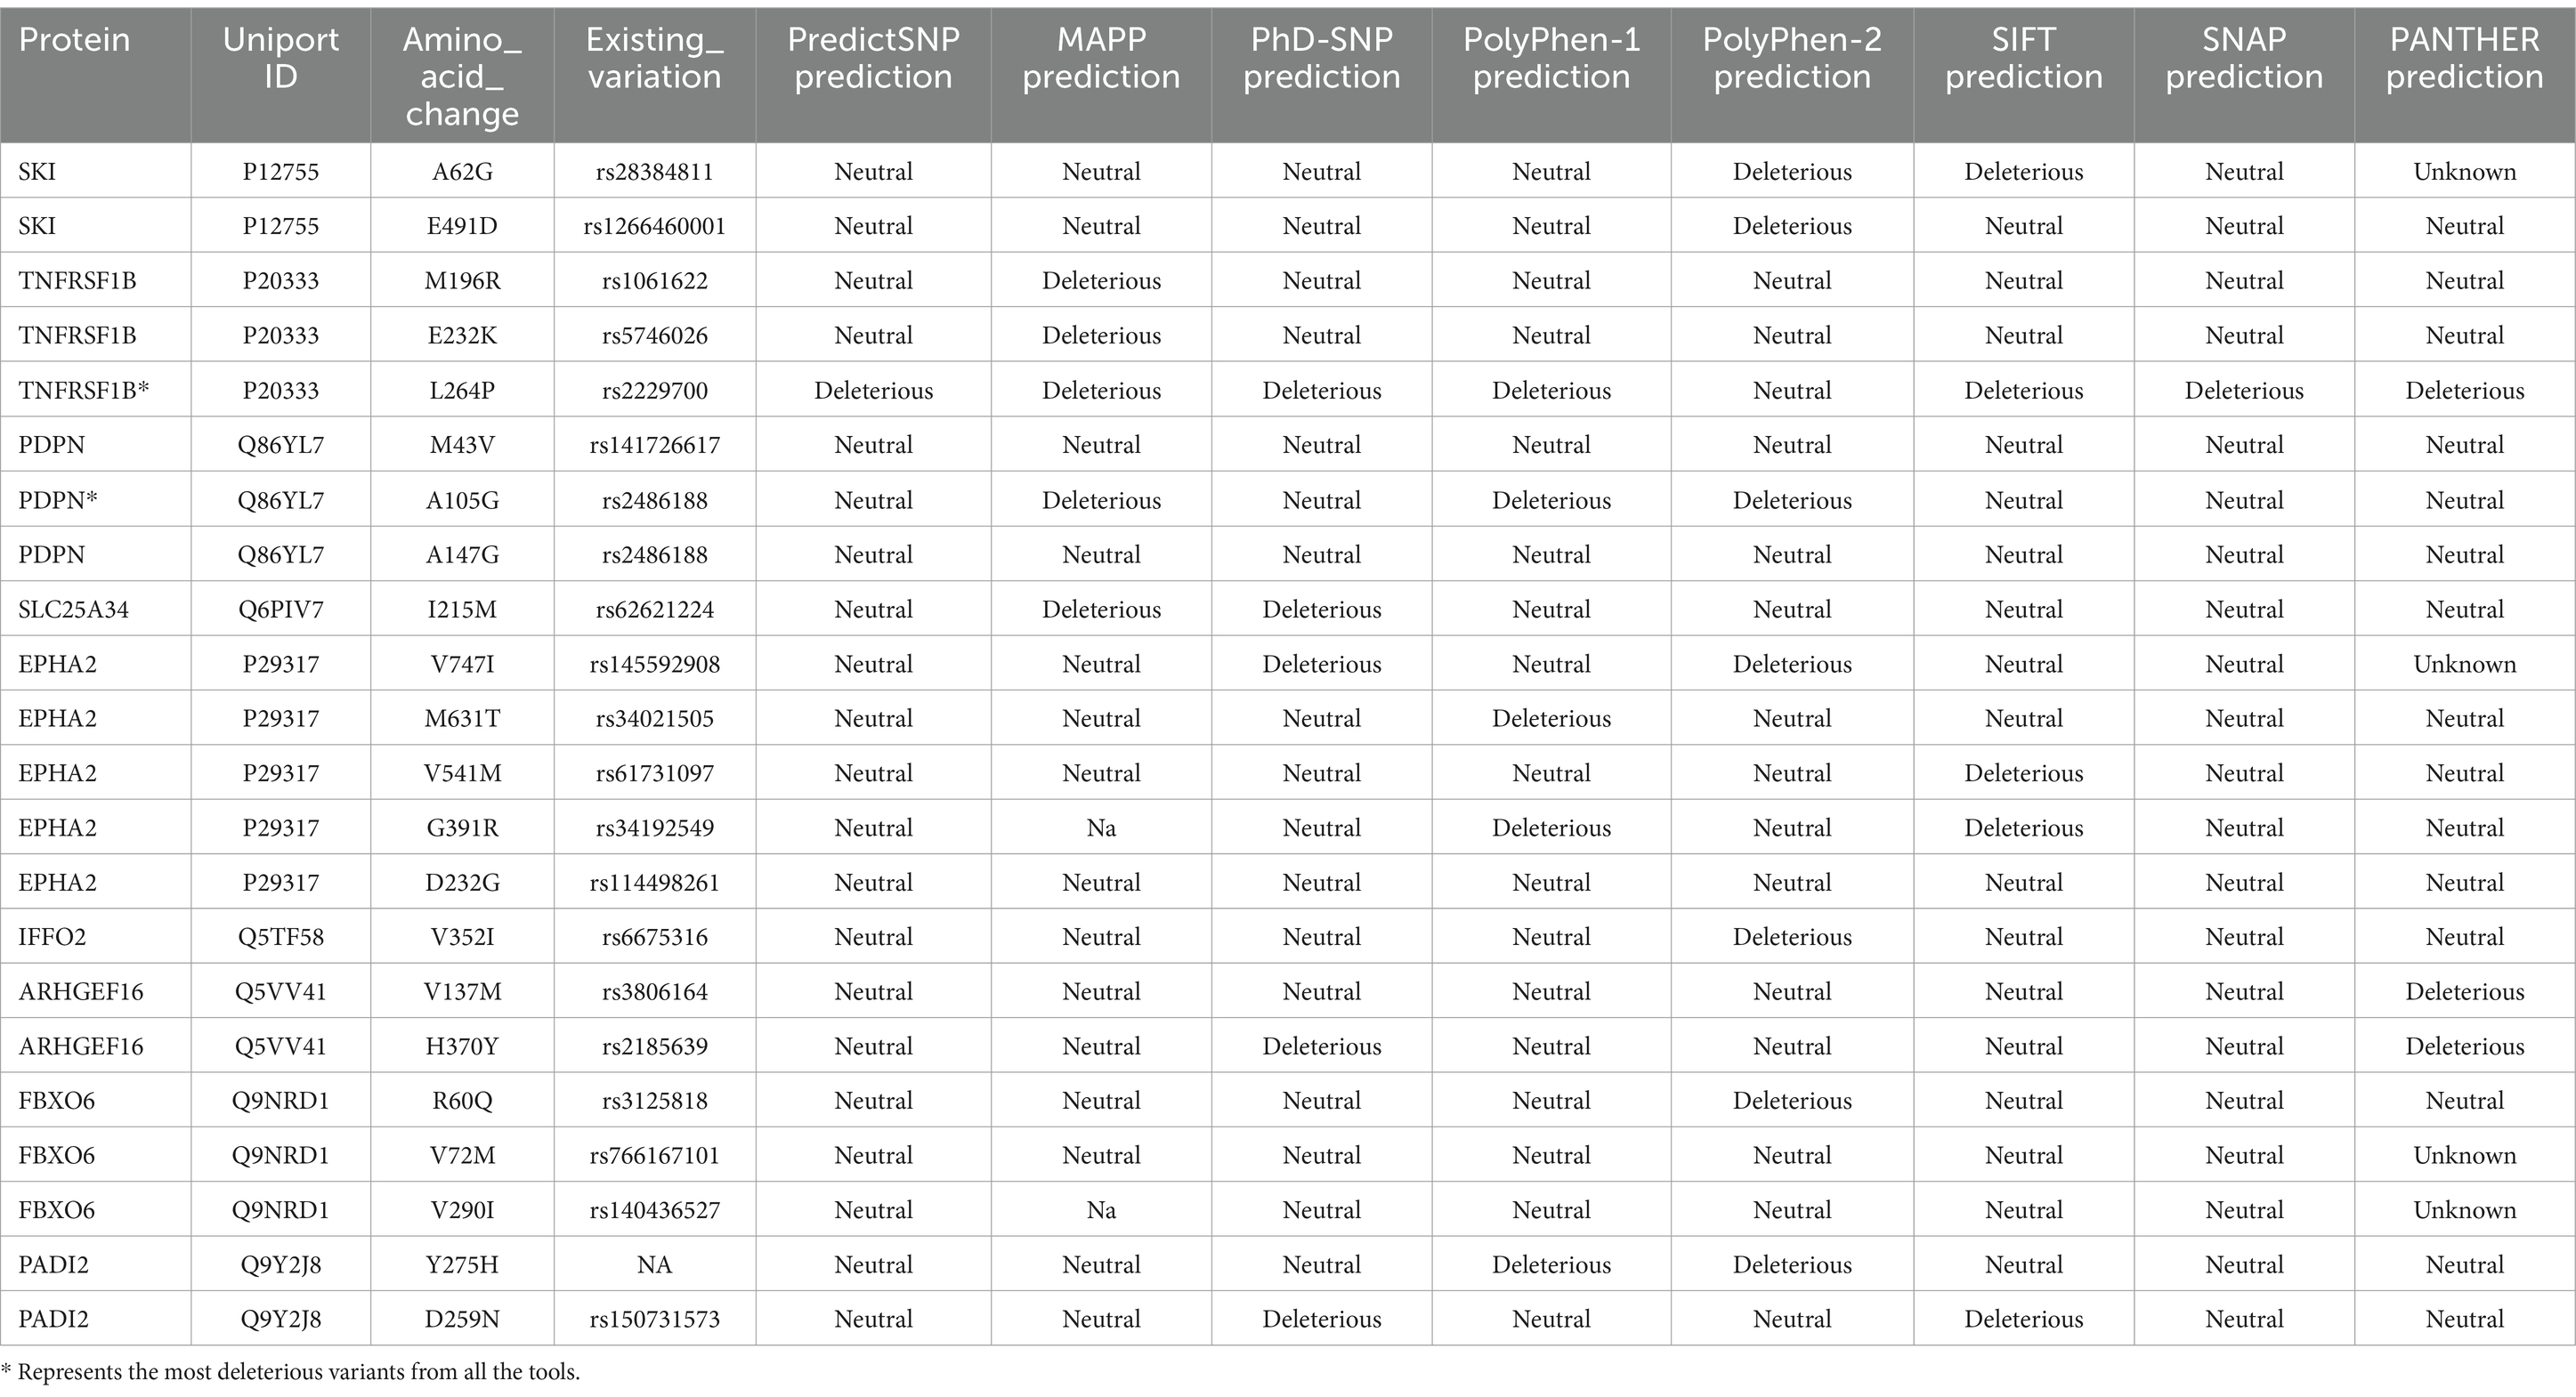
Table 1. Prediction of deleterious variants of common genes by different tools.
Variants classified as neutral were excluded from stability analysis using I-Mutant 2.0. analysis. Among these nine gene variants, the results revealed distinct patterns of stability changes. Three gene variants exhibited an increase in protein stability upon mutation. This indicates that these mutations potentially enhance the structural integrity or thermodynamic stability of the proteins, which could impact their functional roles positively or negatively, depending on the biological context. The remaining six gene variants showed a decrease in protein stability upon mutation. A reduction in stability suggests that these mutations may disrupt the protein’s structural conformation, potentially leading to misfolding, aggregation, or loss of function (38). Such destabilizing mutations could contribute to disease pathogenesis or altered protein activity. The results are mentioned in Table 2. Among these mutations, the TNFRSF1B variant (L264P) is the most deleterious variant confirmed by all computational tools. ConSurf is a tool that analyses the evolutionary conservation of amino acid positions in protein sequences. The variant (TNFRSF1B-L264P) is categorized as a highly conserved position with a significant score (score range of 9), it may suggest a deleterious impact. The ConSurf results are mentioned in Figure 7.
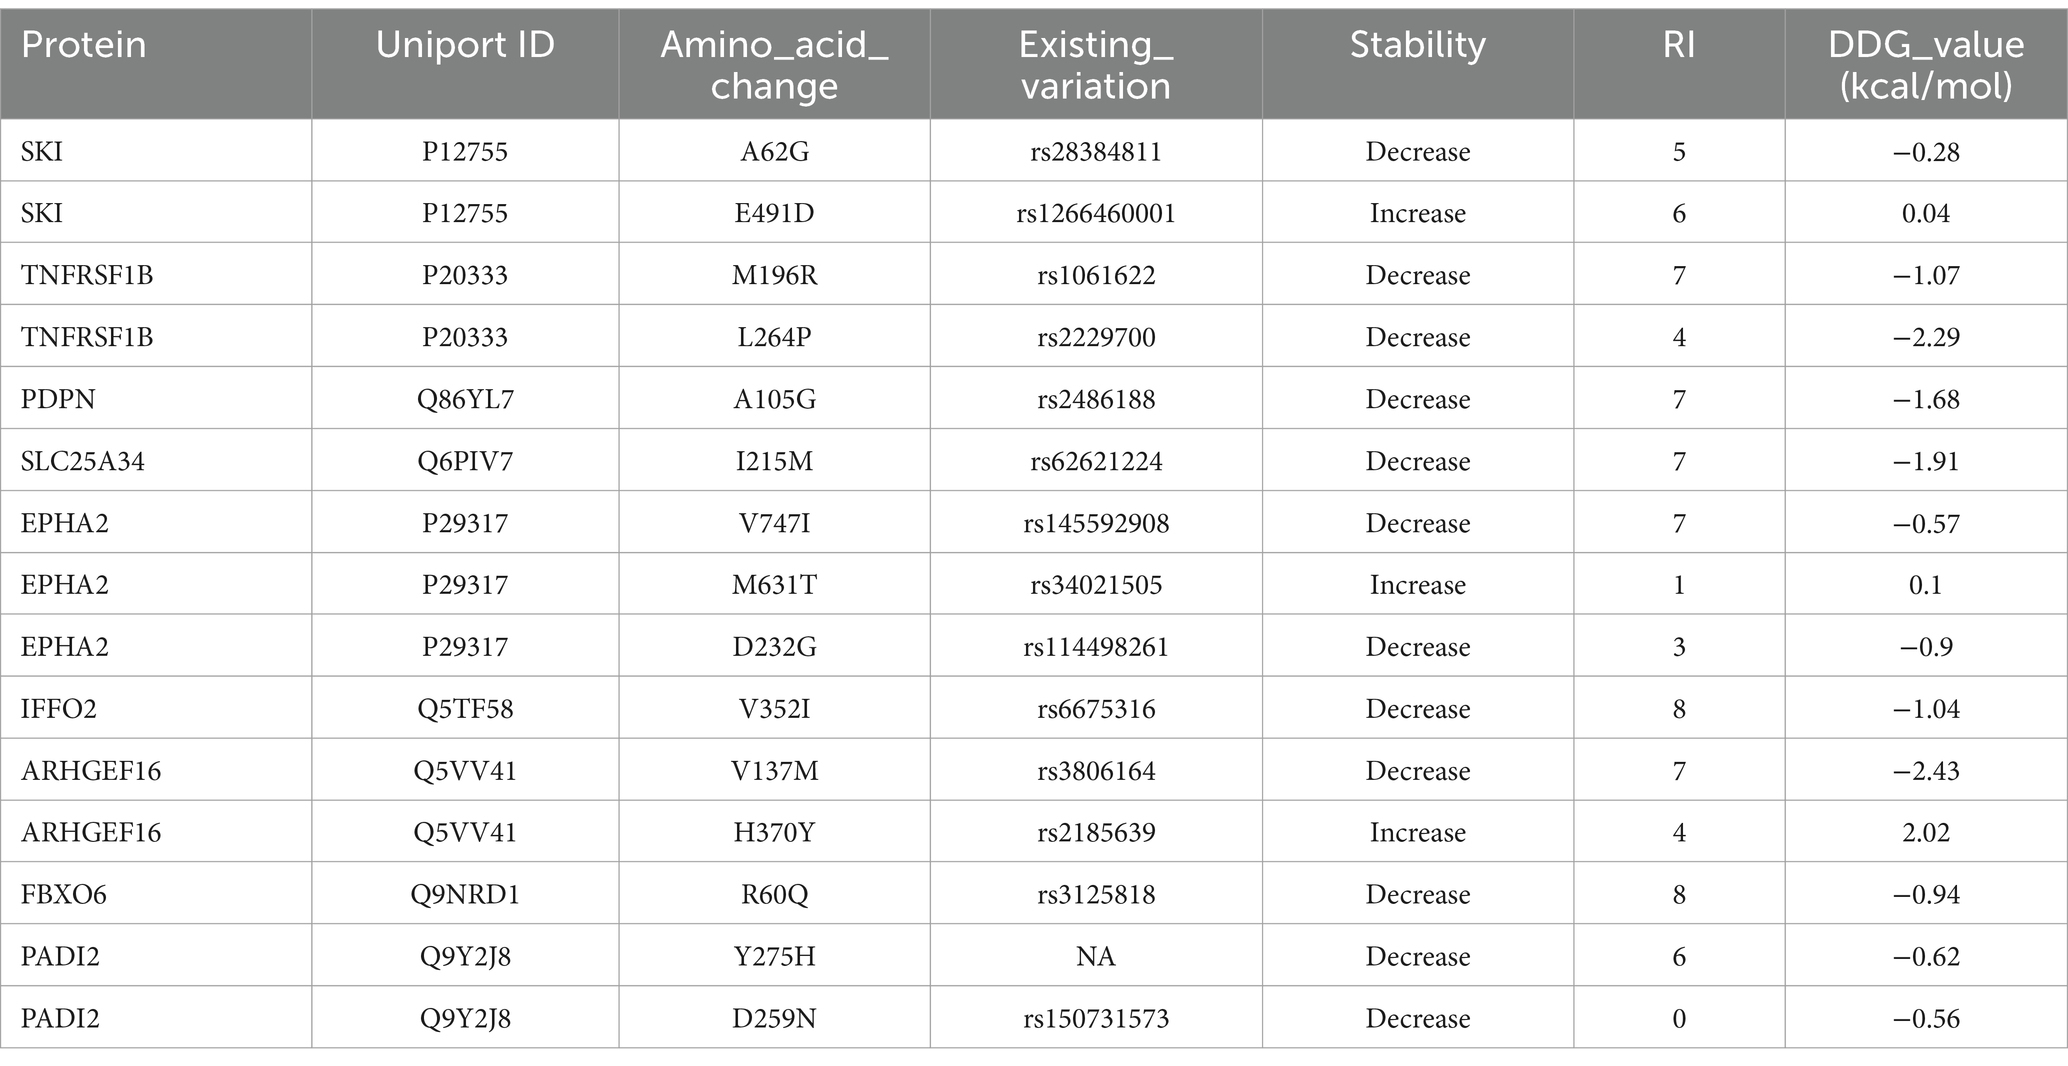
Table 2. Prediction of protein stability using I-Mutant 2.0.
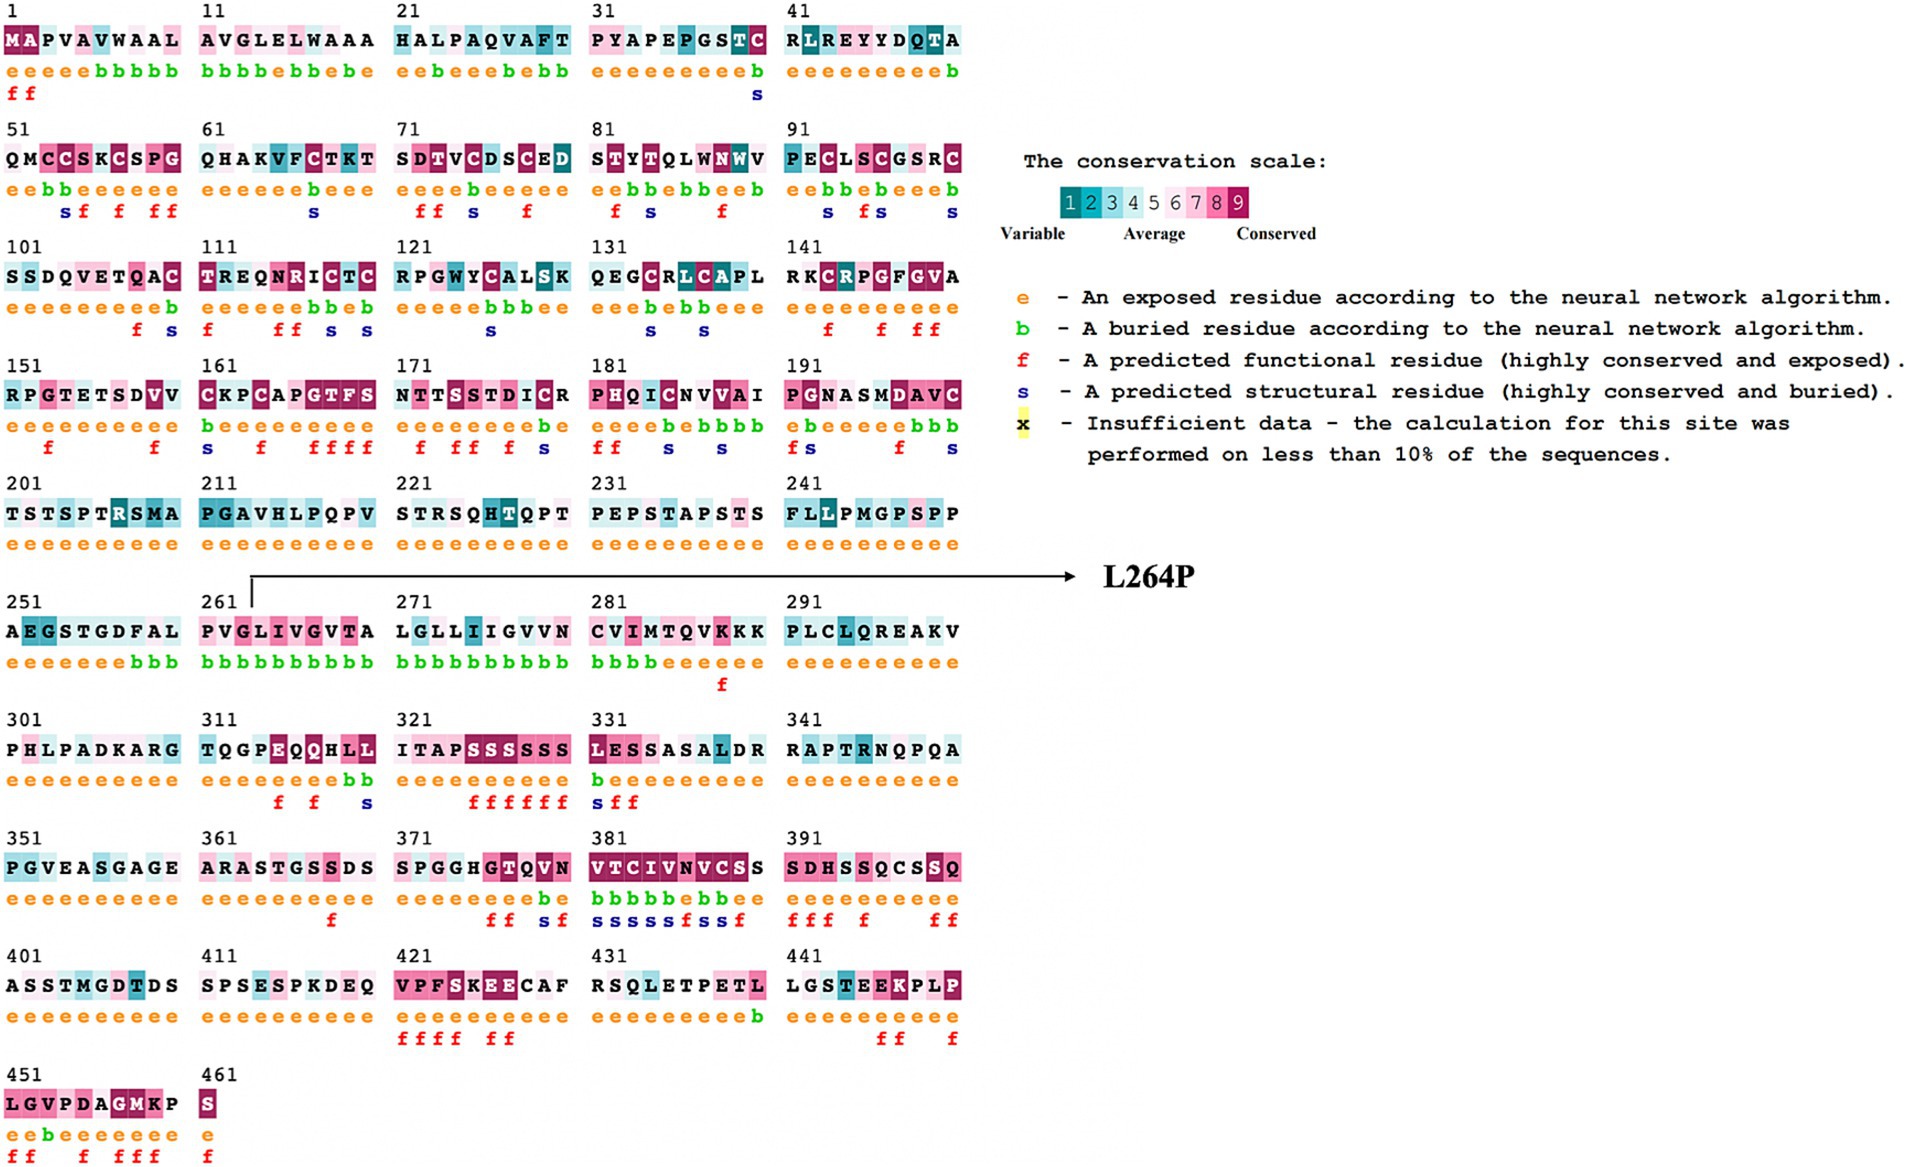
Figure 7. ConSurf analysis of potential deleterious variant (TNFRSF1B-L264P). This figure presents the results of a ConSurf analysis, highlighting the evolutionary conservation of amino acid residues in the TNFRSF1B (L264P) protein. Residues are color-coded based on their conservation scores, ranging from highly conserved (dark shades) to variable (light shades).
4 Discussion
Integrating transcriptomics and exomic analyses combines the strengths of both methods to achieve a comprehensive understanding of genomic and transcriptomic changes in biological systems (40, 41). This integration represents a powerful approach to elucidating the molecular mechanisms underlying complex diseases, facilitating the identification of robust biomarkers and therapeutic targets (42). Several studies have successfully integrated transcriptomics and exomic data to provide deeper insights into biological mechanisms, disease pathogenesis, and therapeutic strategies (43–47). The etiology of BC associated with diabetes remains poorly understood. We aimed to identify differentially expressed genes (DEGs) between BC patients without diabetes and those with diabetes. Our analysis included 66 samples, comparing BC without diabetes to BC with diabetes, and identified 2,815 DEGs, comprising 1,824 upregulated and 990 downregulated genes with statistical significance. This integrative analysis provides insights into the gene expression changes associated with diabetes in BC patients, with visualizations effectively summarizing statistical properties, significant DEGs, and their expression patterns.
Functional enrichment analysis of the 2,814 DEGs was performed using EnrichR, with protein-coding genes as the background. The study focused on GO terms and KEGG pathways, revealing significant enrichment in processes and pathways related to cancer progression, immune regulation, and extracellular matrix (ECM) dynamics. Notable enrichment was observed in processes such as extracellular matrix organization, regulation of cell migration, angiogenesis, and circulatory system development. These processes are crucial for tissue remodeling, cancer metastasis, and vascular development. Key components highlighted include collagen-containing extracellular matrix, cell junctions, plasma membrane rafts, and sarcolemma, which are essential for cellular integrity, signaling, and intercellular communication. Functions like tyrosine kinase activity, platelet-derived growth factor binding, and kinase inhibitor activity were dominant, indicating relevance to signaling pathways and therapeutic targets. The enrichment analysis underscores the involvement of key processes, components, and pathways in cancer progression, immune system regulation, and extracellular matrix interactions, offering potential insights into disease mechanisms and therapeutic targets. These processes are fundamental biological functions and pathways in BC and diabetes, as reported in several studies (48–54).
To identify DEGs between BC patients with and without diabetes, normalized expression data from the GEO database were analyzed separately for AA and EA cohorts. In the AA cohort, 3,245 DEGs were identified from 57 samples, including 1,922 upregulated and 1,323 downregulated genes, while in the EA cohort, 3,208 DEGs were detected across 17 samples, with 1,640 upregulated and 1,568 downregulated genes. A total of 786 DEGs were found to be common between the two cohorts. Key KEGG pathways identified in the AA cohort included cell cycle, ECM-receptor interaction, PI3K-Akt signaling, and AGE-RAGE signaling in diabetic complications. In contrast, significant pathways in the EA cohort included oxidative phosphorylation and diabetic cardiomyopathy. A Venn diagram illustrating the overlap between AA and EA transcriptomic profiles revealed 786 shared genes. Some of the key KEGG pathways, such as Notch signaling and Hippo signaling, both of which are relevant to breast cancer and diabetes (55–58).
The study analyzed WES data from 23 BC patients with diabetes, sourced from the NCBI SRA database, using a customized computational pipeline. Annotation via the Ensembl VEP database classified these variants into non-coding (56.9%) and coding (43.1%). Among coding variants, 96% were missense, 3% synonymous, and 1% stop-gained, with no start-lost variants detected. A total of 899 variants were analyzed, with no novel variants identified. After removing duplicates, these variants spanned 298 genes, which were reduced to 208 unique genes. A Venn diagram illustrated the overlap between transcriptomic and exomic datasets, identifying 2,804 genes unique to transcriptomics, 197 genes exclusive to exomics, and 11 common genes (Figure 6A). Two genes without mutations were excluded, leaving nine key genes: SKI (59, 60), TNFRSF1B (61, 62), PDPN (62, 63), SLC25A34 (64), EPHA2 (65, 66), IFFO2 (67, 68), ARHGEF16 (69, 70), FBXO6 (71, 72), and PADI2 (73, 74) for further analysis. Among these, six were upregulated, and three were downregulated. These genes play significant roles in both diabetes and BC. We analyzed gene expression across two cohorts—AA and EA populations and mapped these four genes (SKI, TNFRSF1B, SLC25A34, and EPHA2) that were consistently present in both groups.
Functional analysis of these nine genes revealed enriched terms across GO categories and Reactome pathways. GO-BP terms included processes like protein localization and synaptic pathways. GO-CC analysis highlighted synaptic and endosomal compartments, indicating roles in cellular organization and signaling. GO-MF terms included ubiquitin-protein ligase binding, TNF activity, chemokine activity, and cadherin binding, essential for protein regulation and interactions. These biological functions were enriched in BC and diabetes in other studies (75–79). Reactome pathways featured RHOG GTPase cycle, TNF-receptor binding, EPHA-mediated growth cone collapse, and other signaling pathways. Among these, the TNF pathway is significant in connecting BC and diabetes (16, 80, 81). The analysis focused on identifying the most deleterious variants using a comprehensive suite of online prediction tools. Among the nine genes analyzed, TNFRSF1B (L264P) and PDPN (A105G) were identified as the top two variants predicted to be most deleterious. These mutations remain poorly characterized and have not been extensively studied. TNFRSF1B (also known as TNFR2), a receptor for the pro-inflammatory cytokine TNF-α, is primarily expressed in immune cells, endothelial cells, and certain tumor cells, playing a pivotal role in immune regulation, inflammation, and cell survival. As chronic inflammation is a common feature of both BC and diabetes, TNFRSF1B may represent a molecular link between these diseases. It contributes to shared inflammatory pathways by promoting a pro-inflammatory microenvironment, and the presence of missense mutations in TNFRSF1B among BC patients with diabetes may exacerbate both tumor progression and metabolic dysfunction. Given its involvement in both cancer and metabolic disease, TNFRSF1B holds potential as a biomarker for identifying at-risk BC patients with diabetes and guiding personalized treatment strategies. Moreover, targeting TNFRSF1B signaling such as through TNF-α inhibitors could offer therapeutic benefits by mitigating inflammation and tumor development. Understanding genetic variations in TNFRSF1B may also inform precision medicine approaches that address the dual challenges of cancer and metabolic dysregulation (5, 16, 82–84).
TNF pathway plays a crucial role in linking chronic inflammation, metabolic dysfunction, and cancer progression, providing an everyday mechanistic basis for its involvement in diabetes and BC. TNF, produced by adipocytes and macrophages in adipose tissue, is elevated in obesity and diabetes (85, 86). It inhibits insulin signaling by phosphorylating insulin receptor substrate-1 (IRS1), disrupting pathways essential for glucose uptake. TNF-induced NF-κB activation and oxidative stress exacerbate inflammation, worsening insulin resistance (87). TNF-mediated inflammation also contributes to beta-cell dysfunction, reducing insulin secretion. Prolonged TNF signaling increases circulating free fatty acids, further impairing metabolic homeostasis (88). In BC, chronic TNF secretion by cancer-associated macrophages and stromal cells creates a pro-inflammatory environment that supports tumor growth (89). NF-κB activation in cancer cells increases the expression of anti-apoptotic genes, helping tumor cells evade programmed cell death (90). TNF drives epithelial-to-mesenchymal transition (EMT), enhancing cancer cell motility and invasion, and promotes angiogenesis via VEGF induction, facilitating tumor vascularization and growth (91). The cross-talk between diabetes and BC with shared mechanisms. Obesity and hyperglycemia heighten TNF levels, creating a pro-inflammatory milieu (92). TNF exacerbates oxidative stress, which damages DNA and increases cancer risk (93). TNF-mediated immune suppression allows cancer cells to escape immune surveillance. Insulin resistance and hyperinsulinemia, driven by TNF, activate pathways like PI3K/AKT, promoting cancer cell proliferation (94). Elevated TNF levels in diabetic patients may accelerate BC progression through increased inflammation and angiogenesis (95, 96). These mechanisms are illustrated in a simplified manner in Figure 8.
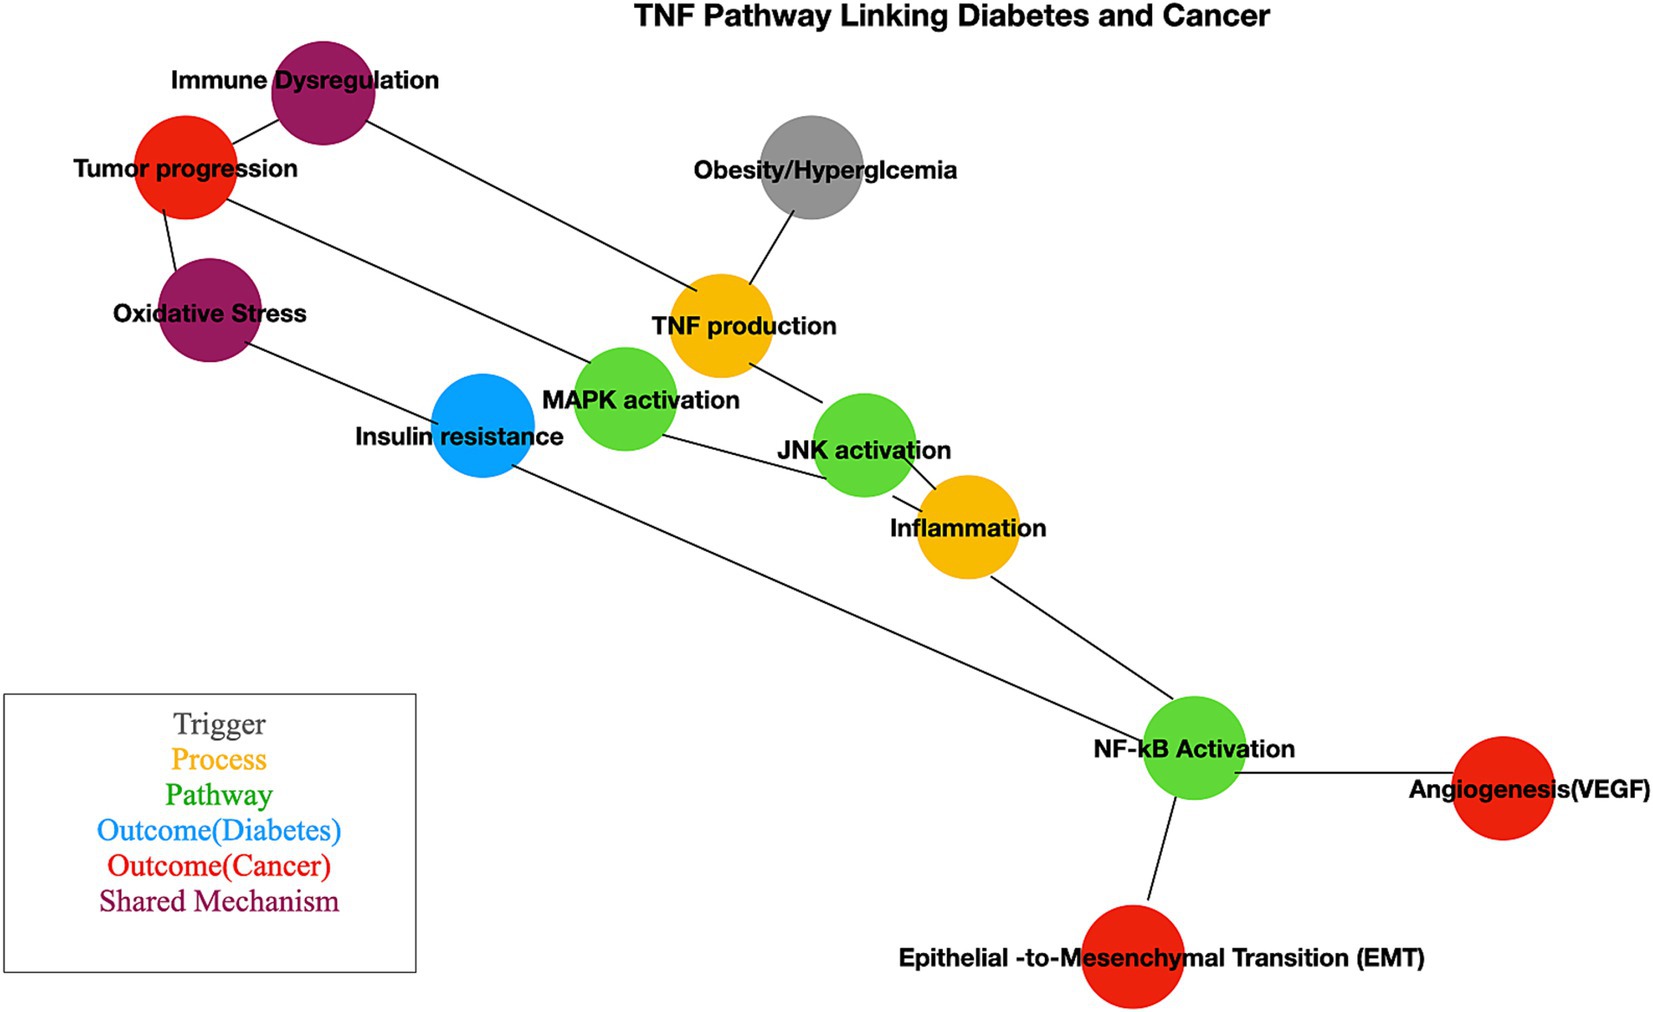
Figure 8. Pathway mechanism linked with diabetes and cancer. This schematic illustrates the interconnected molecular mechanisms linking diabetes and cancer. Key pathways include insulin signaling, chronic inflammation, oxidative stress, and altered metabolism. The figure highlights how hyperinsulinemia and insulin resistance influence cancer cell proliferation and survival through pathways like PI3K/AKT/mTOR and MAPK.
Our analysis identifies the TNF pathway as a crucial mediator in the interplay between BC and diabetes. While pathways such as PI3K-AKT, JAK–STAT, and mTOR are also implicated, our differential expression analysis reveals a significant enrichment of TNF receptor activity among genes common to both conditions. This indicates that TNF signaling plays a pivotal role in inflammation, apoptosis, and immune regulation, potentially driving the interactions between these diseases. Although the PI3K-AKT and MAPK pathways contribute broadly, TNF signaling stands out as a central hub, highlighting its potential as a therapeutic target (5, 50, 97). Further studies are needed to refine these insights. Targeting the TNF gene or its variants could have substantial therapeutic implications, especially for research on comorbidities. Anti-TNF therapies could reduce inflammation, benefiting patients with both metabolic disorders and cancer. Combining TNF inhibitors with treatments specific to metabolic or cancer conditions may offer synergistic benefits, particularly for patients with both diabetes and BC. The TNF pathway exemplifies how chronic inflammation is a common factor in complex diseases like diabetes and BC, emphasizing the importance of addressing systemic inflammation in therapeutic strategies.
5 Conclusion
This study provides a comprehensive examination of the biomarker landscape in BC associated with diabetes through integrative transcriptomics and exome analysis. Utilizing computational approaches, we identified key differentially expressed genes, mutations, and genes with potential deleterious variants that may elucidate the interplay between these conditions. Our findings highlight potential biomarkers and therapeutic targets that could enhance stratification, diagnosis, and treatment for patients with comorbid BC and diabetes. Future studies validating these biomarkers in experimental and clinical settings could significantly advance our understanding and management of this complex disease intersection.
5.1 Limitation of the study
We acknowledge the limitation of our Whole Exome Sequencing (WES) analysis due to the relatively small sample size (n = 23). This constraint primarily arises from our focus on integrating transcriptomic and exomic data specifically for BC patients with diabetes, ensuring a well-defined cohort for robust multi-omics analysis. Additionally, the stringent patient selection criteria and data availability restricted our analysis to tumor samples alone, as paired normal controls were not available within the dataset.
Data availability statement
The datasets presented in this study can be found in online repositories. The names of the repository/repositories and accession number(s) can be found in the article/Supplementary material.
Author contributions
TL: Conceptualization, Data curation, Formal analysis, Investigation, Methodology, Validation, Visualization, Writing – original draft, Writing – review & editing. CD: Conceptualization, Formal analysis, Project administration, Supervision, Validation, Writing – original draft, Writing – review & editing.
Funding
The author(s) declare that no financial support was received for the research and/or publication of this article.
Acknowledgments
The authors would like to take this opportunity to thank the management of Vellore Institute of Technology (VIT), Vellore, India, for providing the necessary facilities and encouragement to carry out this work.
Conflict of interest
The authors declare that the research was conducted in the absence of any commercial or financial relationships that could be construed as a potential conflict of interest.
Generative AI statement
The author(s) declare that no Gen AI was used in the creation of this manuscript.
Publisher’s note
All claims expressed in this article are solely those of the authors and do not necessarily represent those of their affiliated organizations, or those of the publisher, the editors and the reviewers. Any product that may be evaluated in this article, or claim that may be made by its manufacturer, is not guaranteed or endorsed by the publisher.
Supplementary material
The Supplementary material for this article can be found online at: https://www.frontiersin.org/articles/10.3389/fmed.2025.1572500/full#supplementary-material
SUPPLEMENTARY FIGURE 1 | (A) Selection of samples from transcriptomics data. (B) Selection of samples from exomic data.
SUPPLEMENTARY FIGURE 2 | Statistical plots of transcriptomics data. The boxplot represents the distribution of normalized transcriptomics data across all samples. Each box corresponds to an individual sample, with the central line representing the median expression level. (A) Boxplot of AA cohort; (B) Boxplot of EA cohort. The UMAP plot illustrates the clustering of transcriptomics data, with each point representing an individual sample. Samples are color-coded based on their respective groups (BC with diabetes vs BC without diabetes). (C) UMAP of AA cohort; (D) UMAP of EA cohort.
SUPPLEMENTARY FIGURE 3 | The figure presents the functional enrichment analysis of DEGs identified from transcriptomic data of the AA cohort. Panels include (A) GO-BP, (B) GO-CC, (C) GO-MF, and (D) KEGG pathways. Bar lengths represent both statistical significance (adjusted p-values) and gene ratios, offering insights into the molecular roles and functional relevance of the DEGs.
SUPPLEMENTARY FIGURE 4 | The figure presents the functional enrichment analysis of DEGs identified from transcriptomic data of the AA cohort. Panels include (A) GO-BP, (B) GO-CC, (C) GO-MF, and (D) KEGG pathways. Bar lengths represent both statistical significance (adjusted p-values) and gene ratios, offering insights into the molecular roles and functional relevance of the DEGs.
SUPPLEMENTARY FIGURE 5 | This figure displays the overlapping genes identified through a transcriptomics analysis of the AA and EA cohort. These shared genes represent a subset with potential biological significance and functional relevance. (A) 786 overlapping genes were present in both cohorts. The functional analysis of common genes was performed. (B) GO-BP, (C) GO-CC, and (D) GO-MF. (E) KEGG pathways.
SUPPLEMENTARY TABLE 1 | Metadata information of transcriptomics data.
SUPPLEMENTARY TABLE 2 | Detailed metadata information of AA and EA cohorts.
SUPPLEMENTARY TABLE 3 | Detailed information of differentially expressed genes (pooled cohort) in comparison of BC with and without diabetes.
SUPPLEMENTARY TABLE 4 | Detailed information of differentially expressed genes of the AA cohort in comparison of BC with and without diabetes.
SUPPLEMENTARY TABLE 5 | Detailed information of differentially expressed genes of the EA cohort in comparison of BC with and without diabetes.
SUPPLEMENTARY TABLE 6 | Detailed information of missense data.
References
1. Rossi, C, Cicalini, I, Cufaro, MC, Consalvo, A, Upadhyaya, P, Sala, G, et al. Breast cancer in the era of integrating “omics” approaches. Oncogenesis. (2022) 11:17–3. doi: 10.1038/s41389-022-00393-8
2. Guo, L, Kong, D, Liu, J, Zhan, L, Luo, L, Zheng, W, et al. Breast cancer heterogeneity and its implication in personalized precision therapy. Exp Hematol Oncol. (2023) 12:3. doi: 10.1186/s40164-022-00363-1
3. Shahid, RK, Ahmed, S, Le, D, and Yadav, S. Diabetes and Cancer: risk, challenges, management and outcomes. Cancers. (2021) 13:5735. doi: 10.3390/cancers13225735
4. Giovannucci, E, Harlan, DM, Archer, MC, Bergenstal, RM, Gapstur, SM, Habel, LA, et al. Diabetes and Cancer: A consensus report. Diabetes Care. (2010) 33:1674–85. doi: 10.2337/dc10-0666
5. Durrani, IA, Bhatti, A, and John, P. Integrated bioinformatics analyses identifying potential biomarkers for type 2 diabetes mellitus and breast cancer: in SIK1-ness and health. PLoS One. (2023) 18:e0289839–9. doi: 10.1371/journal.pone.0289839
6. Zhang, Y-Y, Li, Y-J, Xue, C-D, Li, S, Gao, Z-N, and Qin, K-R. Effects of T2DM on cancer progression: pivotal precipitating factors and underlying mechanisms. Front Endocrinol. (2024) 15:1396022. doi: 10.3389/fendo.2024.1396022
7. Rojas, A, Lindner, C, Schneider, I, Gonzàlez, I, Araya, H, Morales, E, et al. Diabetes mellitus contribution to the remodeling of the tumor microenvironment in gastric cancer. World J Gastrointest Oncol. (2021) 13:1997–2012. doi: 10.4251/wjgo.v13.i12.1997
8. Samuel, SM, Varghese, E, Varghese, S, and Büsselberg, D. Challenges and perspectives in the treatment of diabetes associated breast cancer. Cancer Treat Rev. (2018) 70:98–111. doi: 10.1016/j.ctrv.2018.08.004
9. Churko, JM, Mantalas, GL, Snyder, MP, and Wu, JC. Overview of high throughput sequencing technologies to elucidate molecular pathways in cardiovascular diseases. Circ Res. (2013) 112:1613–23. doi: 10.1161/circresaha.113.300939
10. Warr, A, Robert, C, Hume, D, Archibald, A, Deeb, N, and Watson, M. Exome sequencing: current and future perspectives. G3 (Bethesda). (2015) 5:1543–50. doi: 10.1534/g3.115.018564
11. Verbist, B, Klambauer, G, Vervoort, L, Talloen, W, Shkedy, Z, Thas, O, et al. Using transcriptomics to guide lead optimization in drug discovery projects: lessons learned from the QSTAR project. Drug Discov Today. (2015) 20:505–13. doi: 10.1016/j.drudis.2014.12.014
12. Lowe, R, Shirley, N, Bleackley, M, Dolan, S, and Shafee, T. Transcriptomics technologies. PLoS Comput Biol. (2017) 13:e1005457. doi: 10.1371/journal.pcbi.1005457
13. Goel, A, Ward, DG, Noyvert, B, Yu, M, Gordon, NS, Abbotts, B, et al. Combined exome and transcriptome sequencing of non-muscle-invasive bladder cancer: associations between genomic changes, expression subtypes, and clinical outcomes. Genome Med. (2022) 14:59. doi: 10.1186/s13073-022-01056-4
14. Codina-Solà, M, Rodríguez-Santiago, B, Homs, A, Santoyo, J, Rigau, M, Aznar-Laín, G, et al. Integrated analysis of whole-exome sequencing and transcriptome profiling in males with autism spectrum disorders. Mol Autism. (2015) 6:21. doi: 10.1186/s13229-015-0017-0
15. Nikas, JB, Mitanis, NT, and Nikas, EG. Whole exome and transcriptome RNA-sequencing model for the diagnosis of prostate Cancer. ACS Omega. (2019) 5:481–6. doi: 10.1021/acsomega.9b02995
16. Panigrahi, G, Candia, J, Dorsey, TH, Tang, W, Ohara, Y, Byun, JS, et al. Diabetes-associated breast cancer is molecularly distinct and shows a DNA damage repair deficiency. JCI Insight. (2023) 8:e170105. doi: 10.1172/jci.insight.170105
17. Zhao, X, Jia, C, Ji, S, Lu, K, Yang, P, and Wang, Y. Development and validation of a metabolic syndrome and its components to predict the efficacy of neoadjuvant chemotherapy in breast cancer: an observational, single-center, cohort study. Medicine. (2025) 104:e41221–1. doi: 10.1097/md.0000000000041221
18. Cleveland, RJ, North, KE, Stevens, J, Teitelbaum, SL, Neugut, AI, and Gammon, MD. The association of diabetes with breast cancer incidence and mortality in the Long Island breast Cancer study project. Cancer Causes Control. (2012) 23:1193–203. doi: 10.1007/s10552-012-9989-7
19. Lao, C, Gurney, J, Stanley, J, Krebs, J, Meredith, I, Campbell, I, et al. Association of diabetes and breast cancer characteristics at diagnosis. Cancer Causes Control. (2022) 34:103–11. doi: 10.1007/s10552-022-01654-y
20. Clough, E, and Barrett, T. The gene expression omnibus database. Methods Mol Biol. (2016) 1418:93–110. doi: 10.1007/978-1-4939-3578-9_5
21. Davis, S, and Meltzer, PS. GEOquery: a bridge between the gene expression omnibus (GEO) and BioConductor. Bioinformatics. (2007) 23:1846–7. doi: 10.1093/bioinformatics/btm254
22. Smyth, GK. Linear models and empirical bayes methods for assessing differential expression in microarray experiments. Stat Appl Genet Mol Biol. (2004) 3:Article3, 1–25. doi: 10.2202/1544-6115.1027
23. Yuan, D, Ahamed, A, Burgin, J, Cummins, C, Devraj, R, Gueye, K, et al. The European nucleotide archive in 2023. Nucleic Acids Res. (2023) 52:D92–7. doi: 10.1093/nar/gkad1067
24. Andrews, S. Babraham bioinformatics – FastQC a quality control tool for high throughput sequence data. Babrahamacuk (2010). Available online at: https://www.bioinformatics.babraham.ac.uk/projects/fastqc/. (Accessed February 7, 2025).
25. Nurk, S, Koren, S, Rhie, A, Rautiainen, M, Bzikadze, AV, Mikheenko, A, et al. The complete sequence of a human genome. Science. (2022) 376:44–53. doi: 10.1126/science.abj6987
26. Li, H, and Durbin, R. Fast and accurate short read alignment with burrows-wheeler transform. Bioinformatics. (2009) 25:1754–60. doi: 10.1093/bioinformatics/btp324
27. Li, H, Handsaker, B, Wysoker, A, Fennell, T, Ruan, J, Homer, N, et al. The sequence alignment/map format and SAMtools. Bioinformatics. (2009) 25:2078–9. doi: 10.1093/bioinformatics/btp352
28. Danecek, P, Bonfield, JK, Liddle, J, Marshall, J, Ohan, V, Pollard, MO, et al. Twelve years of SAMtools and BCFtools. GigaScience. (2021) 10:giab008. doi: 10.1093/gigascience/giab008
29. McLaren, W, Gil, L, Hunt, SE, Riat, HS, Ritchie, GRS, Thormann, A, et al. The Ensembl variant effect predictor. Genome Biol. (2016) 17:122. doi: 10.1186/s13059-016-0974-4
30. Chen, EY, Tan, CM, Kou, Y, Duan, Q, Wang, Z, Meirelles, G, et al. Enrichr: interactive and collaborative HTML5 gene list enrichment analysis tool. BMC Bioinformatics. (2013) 14:128. doi: 10.1186/1471-2105-14-128
31. Bendl, J, Stourac, J, Salanda, O, Pavelka, A, Wieben, ED, Zendulka, J, et al. PredictSNP: robust and accurate consensus classifier for prediction of disease-related mutations. PLoS Comput Biol. (2014) 10:e1003440. doi: 10.1371/journal.pcbi.1003440
32. Stone, EA. Physicochemical constraint violation by missense substitutions mediates impairment of protein function and disease severity. Genome Res. (2005) 15:978–86. doi: 10.1101/gr.3804205
33. Capriotti, E, Calabrese, R, and Casadio, R. Predicting the insurgence of human genetic diseases associated to single point protein mutations with support vector machines and evolutionary information. Bioinformatics. (2006) 22:2729–34. doi: 10.1093/bioinformatics/btl423
34. Ramensky, V. Human non-synonymous SNPs: server and survey. Nucleic Acids Res. (2002) 30:3894–900. doi: 10.1093/nar/gkf493
35. Adzhubei, IA, Schmidt, S, Peshkin, L, Ramensky, VE, Gerasimova, A, Bork, P, et al. A method and server for predicting damaging missense mutations. Nat Methods. (2010) 7:248–9. doi: 10.1038/nmeth0410-248
36. Ng, PC. SIFT: predicting amino acid changes that affect protein function. Nucleic Acids Res. (2003) 31:3812–4. doi: 10.1093/nar/gkg509
37. Bromberg, Y, and Rost, B. SNAP: predict effect of non-synonymous polymorphisms on function. Nucleic Acids Res. (2007) 35:3823–35. doi: 10.1093/nar/gkm238
38. Capriotti, E, Fariselli, P, and Casadio, R. I-Mutant2.0: predicting stability changes upon mutation from the protein sequence or structure. Nucleic Acids Res. (2005) 33:W306–10. doi: 10.1093/nar/gki375
39. Ben Chorin, A, Masrati, G, Kessel, A, Narunsky, A, Sprinzak, J, Lahav, S, et al. ConSurf-DB: an accessible repository for the evolutionary conservation patterns of the majority of PDB proteins. Protein Sci. (2019) 29:258–67. doi: 10.1002/pro.3779
40. Cotto, KC, Feng, Y, Ramu, A, Richters, MM, Freshour, S, Skidmore, ZL, et al. Integrated analysis of genomic and transcriptomic data for the discovery of splice-associated variants in cancer. Nat Commun. (2023) 14:1589. doi: 10.1038/s41467-023-37266-6
41. Du, P, Fan, R, Zhang, N, Wu, C, and Zhang, Y. Advances in integrated multi-omics analysis for drug-target identification. Biomol Ther. (2024) 14:692–2. doi: 10.3390/biom14060692
42. Jiang, L, Zhang, S, Jiang, C, Chen, H, Huang, J, Yang, J, et al. Integrative biomarker discovery and immune profiling for ulcerative colitis: a multi-methodological approach. Sci Rep. (2024) 14:24290. doi: 10.1038/s41598-024-75797-0
43. Hicks, EM, Seah, C, Cote, A, Marchese, S, Brennand, KJ, Nestler, EJ, et al. Integrating genetics and transcriptomics to study major depressive disorder: a conceptual framework, bioinformatic approaches, and recent findings. Transl Psychiatry. (2023) 13:129–14. doi: 10.1038/s41398-023-02412-7
44. San Lucas, FA, Allenson, K, Bernard, V, Castillo, J, Kim, DU, Ellis, K, et al. Minimally invasive genomic and transcriptomic profiling of visceral cancers by next-generation sequencing of circulating exosomes. Ann Oncol. (2016) 27:635–41. doi: 10.1093/annonc/mdv604
45. Hu, Y, Zhang, X, Wang, O, Cui, M, Li, X, Wang, M, et al. Integrated whole-exome and transcriptome sequencing of sporadic parathyroid adenoma. Front Endocrinol. (2021) 12:631680. doi: 10.3389/fendo.2021.631680
46. Seo, JS, Lee, JW, Kim, A, Shin, JY, Jung, YJ, Lee, SB, et al. Whole exome and transcriptome analyses integrated with microenvironmental immune signatures of lung squamous cell carcinoma. Cancer Immunol Res. (2018) 6:848–59. doi: 10.1158/2326-6066.cir-17-0453
47. Liu, J, McCleland, M, Stawiski, EW, Gnad, F, Mayba, O, Haverty, PM, et al. Integrated exome and transcriptome sequencing reveals ZAK isoform usage in gastric cancer. Nat Commun. (2014) 5:3830. doi: 10.1038/ncomms4830
48. Wang, W, Hapach, LA, Griggs, L, Smart, K, Wu, Y, Taufalele, PV, et al. Diabetic hyperglycemia promotes primary tumor progression through glycation-induced tumor extracellular matrix stiffening. Sci Adv. (2022) 8:eabo1673. doi: 10.1126/sciadv.abo1673
49. Okumura, M, Yamamoto, M, Sakuma, H, Kojima, T, Maruyama, T, Jamali, M, et al. Leptin and high glucose stimulate cell proliferation in MCF-7 human breast cancer cells: reciprocal involvement of PKC-α and PPAR expression. Biochim Biophys Acta. (2002) 1592:107–16. doi: 10.1016/s0167-4889(02)00276-8
50. Durrani, IA, Bhatti, A, and John, P. The prognostic outcome of “type 2 diabetes mellitus and breast cancer” association pivots on hypoxia-hyperglycemia axis. Cancer Cell Int. (2021) 21:351. doi: 10.1186/s12935-021-02040-5
51. Chou, P, Choi, HH, Huang, Y, Fuentes-Mattei, E, Velazquez-Torres, G, Zhang, F, et al. Impact of diabetes on promoting the growth of breast cancer. Cancer Commun. (2021) 41:414–31. doi: 10.1002/cac2.12147
52. Lero, M, and Shaw, LM. Diversity of insulin and IGF signaling in breast cancer: implications for therapy. Mol Cell Endocrinol. (2021) 527:111213–3. doi: 10.1016/j.mce.2021.111213
53. Fountas, A, Diamantopoulos, L-N, and Tsatsoulis, A. Tyrosine kinase inhibitors and diabetes: A novel treatment paradigm? Trends Endocrinol Metab. (2015) 26:643–56. doi: 10.1016/j.tem.2015.09.003
54. Butti, R, Das, S, Gunasekaran, VP, Yadav, AS, Kumar, D, and Kundu, GC. Receptor tyrosine kinases (RTKs) in breast cancer: signaling, therapeutic implications and challenges. Mol Cancer. (2018) 17:34. doi: 10.1186/s12943-018-0797-x
55. Edwards, A, and Brennan, K. Notch Signalling in breast development and Cancer. Front Cell Dev Biol. (2021) 9:692173. doi: 10.3389/fcell.2021.692173
56. Bonegio, R, and Susztak, K. Notch signaling in diabetic nephropathy. Exp Cell Res. (2012) 318:986–92. doi: 10.1016/j.yexcr.2012.02.036
57. Ardestani, A, and Maedler, K. The hippo signaling pathway in pancreatic β-cells: functions and regulations. Endocr Rev. (2017) 39:21–35. doi: 10.1210/er.2017-00167
58. Yousefi, H, Delavar, MR, Piroozian, F, Baghi, M, Nguyen, K, Cheng, T, et al. Hippo signaling pathway: A comprehensive gene expression profile analysis in breast cancer. Biomed Pharmacother. (2022) 151:113144. doi: 10.1016/j.biopha.2022.113144
59. Liao, H-Y, Da, C-M, Wu, Z-L, and Zhang, H-H. Ski: double roles in cancers. Clin Biochem. (2020) 87:1–12. doi: 10.1016/j.clinbiochem.2020.10.015
60. Diaz, M, Martel, N, Fitzsimmons, RL, Eriksson, NA, Cowin, GJ, Thomas, GP, et al. Ski overexpression in skeletal muscle modulates genetic programs that control susceptibility to diet-induced obesity and insulin signaling. Obesity (Silver Spring). (2012) 20:2157–67. doi: 10.1038/oby.2012.101
61. Tabassum, R, Chavali, S, Mahajan, A, Ghosh, S, Madhu, SV, Tandon, N, et al. Association analysis of TNFRSF1B polymorphisms with type 2 diabetes and its related traits in North India. Genomic Med. (2008) 2:93–100. doi: 10.1007/s11568-009-9031-7
62. Xu, F, Zhou, G, Han, S, Yuan, W, Chen, S, Fu, Z, et al. Association of TNF-α, TNFRSF1A and TNFRSF1B gene polymorphisms with the risk of sporadic breast Cancer in northeast Chinese Han women. PLoS One. (2014) 9:e101138–8. doi: 10.1371/journal.pone.0101138
63. Zhu, X, Xu, M, Zhao, X, Shen, F, Ruan, C, and Zhao, Y. The detection of plasma soluble Podoplanin of patients with breast Cancer and its clinical signification. Cancer Manag Res. (2020) 12:13207–14. doi: 10.2147/cmar.s281785
64. Huan, F, and Jiang, X. Serum Podoplanin levels as a potential biomarker for diabetic nephropathy progression: A cross-sectional study. Diabetes Metab Syndr Obes. (2024) 17:4701–10. doi: 10.2147/DMSO.S500608
65. Roy, N, Alencastro, F, Roseman, BA, Wilson, S, Delgado, ER, May, MC, et al. Dysregulation of lipid and glucose homeostasis in hepatocyte-specific SLC25A34 knockout mice. Am J Pathol. (2022) 192:1259–81. doi: 10.1016/j.ajpath.2022.06.002
66. Zhao, P, Jiang, D, Huang, Y, and Chen, C. EphA2: A promising therapeutic target in breast cancer. J Genet Genomics. (2021) 48:261–7. doi: 10.1016/j.jgg.2021.02.011
67. Konstantinova, I, Nikolova, G, OharaImaizumi, M, Meda, P, Kuc̆era, T, Zarbalis, K, et al. EphAEphrinAMediated β cell communication regulates insulin secretion from pancreatic islets. Cell. (2007) 129:359–70. doi: 10.1016/j.cell.2007.02.044
68. Mahapatra, KD, Pasquali, L, Søndergaard, JN, Lapins, J, Nemeth, IB, Baltás, E, et al. A comprehensive analysis of coding and non-coding transcriptomic changes in cutaneous squamous cell carcinoma. Sci Rep. (2020) 10:3637. doi: 10.1038/s41598-020-59660-6
69. Lee, J, Park, B, Kim, G, Kim, K, Pak, J, Kim, K, et al. Arhgef16, a novel Elmo1 binding partner, promotes clearance of apoptotic cells via RhoG-dependent Rac1 activation. Biochim Biophys Acta. (2014) 1843:2438–47. doi: 10.1016/j.bbamcr.2014.07.006
70. Davegårdh, C, García-Calzón, S, Bacos, K, and Ling, C. DNA methylation in the pathogenesis of type 2 diabetes in humans. Mol Metab. (2018) 14:12–25. doi: 10.1016/j.molmet.2018.01.022
71. Liu, Y, Pan, B, Qu, W, Cao, Y, Li, J, and Zhao, H. Systematic analysis of the expression and prognosis relevance of FBXO family reveals the significance of FBXO1 in human breast cancer. Cancer Cell Int. (2021) 21:130. doi: 10.1186/s12935-021-01833-y
72. Liu, B, Lu, H, Li, D, Xiong, X, Gao, L, Wu, Z, et al. Aberrant expression of FBXO2 disrupts glucose homeostasis through ubiquitin-mediated degradation of insulin receptor in obese mice. Diabetes. (2016) 66:689–98. doi: 10.2337/db16-1104
73. Stolp, J, Chen, Y-G, Cox, SL, Henck, V, Zhang, W, Tsaih, S-W, et al. Subcongenic analyses reveal complex interactions between distal chromosome 4 genes controlling Diabetogenic B cells and CD4 T cells in nonobese diabetic mice. J Immunol. (2012) 189:1406–17. doi: 10.4049/jimmunol.1200120
74. McElwee, JL, Mohanan, S, Griffith, OL, Breuer, H, Anguish, LJ, Cherrington, BD, et al. Identification of PADI2 as a potential breast cancer biomarker and therapeutic target. BMC Cancer. (2012) 12:500. doi: 10.1186/1471-2407-12-500
75. Yang, X-D, Xiang, D-X, and Yang, Y-Y. Role of E3 ubiquitin ligases in insulin resistance. Diabetes Obes Metab. (2016) 18:747–54. doi: 10.1111/dom.12677
76. Wang, Y, Dai, J, Zeng, Y, Guo, J, and Lan, J. E3 ubiquitin ligases in breast Cancer metastasis: A systematic review of pathogenic functions and clinical implications. Front Oncol. (2021) 11:752604. doi: 10.3389/fonc.2021.752604
77. Pan, X, Kaminga, AC, Wen, SW, and Liu, A. Chemokines in prediabetes and type 2 diabetes: A Meta-analysis. Front Immunol. (2021) 12:622438. doi: 10.3389/fimmu.2021.622438
78. Ozga, AJ, Chow, MT, and Luster, AD. Chemokines and the immune response to cancer. Immunity. (2021) 54:859–74. doi: 10.1016/j.immuni.2021.01.012
79. Andrews, JL, Kim, AC, and Hens, JR. The role and function of cadherins in the mammary gland. Breast Cancer Res. (2012) 14:203. doi: 10.1186/bcr3065
80. Okita, T, Kita, S, Fukuda, S, Fukuoka, K, Kawada-Horitani, E, Iioka, M, et al. Soluble T-cadherin promotes pancreatic β-cell proliferation by upregulating notch signaling. iScience. (2022) 25:105404. doi: 10.1016/j.isci.2022.105404
81. Akash, MSH, Rehman, K, and Liaqat, A. Tumor necrosis factor-alpha: role in development of insulin resistance and pathogenesis of type 2 diabetes mellitus. J Cell Biochem. (2017) 119:105–10. doi: 10.1002/jcb.26174
82. Sergi, D, Melloni, M, Passaro, A, and Neri, LM. Influence of type 2 diabetes and adipose tissue dysfunction on breast Cancer and potential benefits from nutraceuticals inducible in microalgae. Nutrients. (2024) 16:3243–3. doi: 10.3390/nu16193243
83. Abdolvand, M, Shahini Shams Abadi, M, Soltani, A, Banisharif, F, and Ghatrehsamani, M. Chronic treatment with TNF-α, alone and in combination with Takinib, SB203580 and metformin induce cell death in breast cancer. Heliyon. (2023) 9:e21060. doi: 10.1016/j.heliyon.2023.e21060
84. Swaroop, J, Naidu, J, and Rajarajeswari, D. Association of TNF-α with insulin resistance in type 2 diabetes mellitus. Indian J Med Res. (2012) 135:127–30. doi: 10.4103/0971-5916.93435
85. Liu, W, Lu, X, Shi, P, Yang, G, Zhou, Z, Li, W, et al. TNF-α increases breast cancer stem-like cells through up-regulating TAZ expression via the non-canonical NF-κB pathway. Sci Rep. (2020) 10:1804. doi: 10.1038/s41598-020-58642-y
86. Sethi, JK, and Hotamisligil, GS. Metabolic messengers: tumour necrosis factor. Nat Metab. (2021) 3:1302–12. doi: 10.1038/s42255-021-00470-z
87. Arcidiacono, B, Iiritano, S, Nocera, A, Possidente, K, Nevolo, MT, Ventura, V, et al. Insulin resistance and Cancer risk: an overview of the Pathogenetic mechanisms. Exp Diabetes Res. (2012) 2012:1–12. doi: 10.1155/2012/789174
88. Petersen, MC, and Shulman, GI. Mechanisms of insulin action and insulin resistance. Physiol Rev. (2018) 98:2133–223. doi: 10.1152/physrev.00063.2017
89. Baker, RG, Hayden, MS, and Ghosh, S. NF-κB, inflammation, and metabolic disease. Cell Metab. (2011) 13:11–22. doi: 10.1016/j.cmet.2010.12.008
90. Wang, X, and Lin, Y. Tumor necrosis factor and cancer, buddies or foes? Acta Pharmacol Sin. (2008) 29:1275–88. doi: 10.1111/j.1745-7254.2008.00889.x
91. Xia, Y, Shen, S, and Verma, IM. NF- B, an active player in human cancers. Cancer Immunol Res. (2014) 2:823–30. doi: 10.1158/2326-6066.cir-14-0112
92. Ribatti, D, Tamma, R, and Annese, T. Epithelial-mesenchymal transition in cancer: A historical overview. Transl Oncol. (2020) 13:100773. doi: 10.1016/j.tranon.2020.100773
93. Rohm, TV, Meier, DT, Olefsky, JM, and Donath, MY. Inflammation in obesity, diabetes, and related disorders. Immunity. (2022) 55:31–55. doi: 10.1016/j.immuni.2021.12.013
94. Arfin, S, Jha, NK, Jha, SK, Kesari, KK, Ruokolainen, J, Roychoudhury, S, et al. Oxidative stress in Cancer cell metabolism. Antioxidants. (2021) 10:642. doi: 10.3390/antiox10050642
95. Wu, Y, and Zhou, BP. TNF-α/NF-κB/snail pathway in cancer cell migration and invasion. Br J Cancer. (2010) 102:639–44. doi: 10.1038/sj.bjc.6605530
96. Li, W, Zhang, X, Sang, H, Zhou, Y, Shang, C, Wang, Y, et al. Effects of hyperglycemia on the progression of tumor diseases. J Exp Clin Cancer Res. (2019) 38:327. doi: 10.1186/s13046-019-1309-6
Keywords: breast cancer, diabetes, transcriptomics, exome analysis and TNF pathway, bioinformatics
Citation: Loganathan T and Doss CGP (2025) Multi-omics insights into biomarkers of breast cancer associated diabetes: a computational approach. Front. Med. 12:1572500. doi: 10.3389/fmed.2025.1572500
Edited by:
HaiHui Huang, Shaoguan University, ChinaReviewed by:
Xuejing Sun, University of Pittsburgh, United StatesAbdullah Al Marzan, Toxicology Society of Bangladesh, Bangladesh
Copyright © 2025 Loganathan and Doss. This is an open-access article distributed under the terms of the Creative Commons Attribution License (CC BY). The use, distribution or reproduction in other forums is permitted, provided the original author(s) and the copyright owner(s) are credited and that the original publication in this journal is cited, in accordance with accepted academic practice. No use, distribution or reproduction is permitted which does not comply with these terms.
*Correspondence: C. George Priya Doss, Z2VvcmdlcHJpeWFkb3NzQHZpdC5hYy5pbg==