 Jing Zhang1†
 Xiaopei Sun
 Jun-Peng Zhang
 Yuehuan Zheng
- 1Department of Radiology, Ruijin Hospital, Shanghai Jiao Tong University School of Medicine, Shanghai, China
- 2Department of Nursing, Ruijin Hospital, Shanghai Jiao Tong University School of Medicine, Shanghai, China
- 3Department of Orthopaedics, Ruijin Hospital, Shanghai Jiao Tong University School of Medicine, Shanghai, China
- 4Department of Rehabilitation, Shanghai Ruijin Rehabilitation Hospital, Shanghai, China
- 5School of Rehabilitation Science, Shanghai University of Traditional Chinese Medicine, Shanghai, China
Background: Spinal diseases related pain represents a critical clinical issue that demands urgent resolution. Current treatment and assessment strategies predominantly focus on peripheral mechanisms. The application of functional magnetic resonance imaging (fMRI) offers a promising approach to identifying potential central targets for intervention.
Methods: We retrospectively included 31 patients with spinal diseases related pain and 32 controls with non-spinal, orthopedic complaints (no chronic neurological or psychiatric disorders). All participants underwent resting-state brain fMRI (eyes closed, awake). We quantified amplitude of low-frequency fluctuations (ALFF) with mean normalization (mALFF) and z-transformation (zALFF), regional homogeneity (ReHo; 27-voxel neighborhood), seed-based functional connectivity (FC; pre/postcentral seeds), and degree centrality (DC; binary and weighted). Between group tests used voxel-wise two-sample t_tests with Gaussian random field (GRF) correction.
Results: Patient group was associated with increased m/zALFF in right cerebellar lobule IX and right Superior Frontal Gyrus, medial part, and lower activity in bilateral postcentral gyri and the cuneus, decreased m/zALFF in bilateral postcentral gyri. ReHo analysis confirmed reduced local synchrony in postcentral regions, spatially overlapping with ALFF findings. FC analyses revealed enhanced cerebellar-thalamic connectivity (Crus1/2, thalamus) but reduced connectivity in sensorimotor and higher-order cortical networks. DC showed hyperconnectivity in left cerebellar Crus I with reduced Superior Frontal Orbital (Frontal_Sup_Orb). All findings survived GRF correction at the pre_specified thresholds.
Conclusion: Resting-state brain fMRI indicates a cerebello-thalamo-cortical alteration pattern in spinal diseases related pain featuring cerebellar involvement, prefrontal subspecialization, and multilevel sensorimotor disruption. These cross-sectional associations may inform hypothesis-generation for future neuromodulation studies and provide candidate biomarkers for monitoring, pending prospective validation.
1 Introduction
Spinal diseases related pain is a leading cause of disability and health-care expenditure worldwide (1, 2). Importantly, the term “spinal diseases” refers to clinically defined conditions (e.g., disc degeneration, spinal stenosis, spondylosis), whereas commonly cited lifetime prevalence figures (e.g., for non-specific low back pain) describe a symptom rather than a diagnosis (3, 4). To avoid conflation, here we focus on patients with symtoms of spinal diseases related pain.
Spinal diseases related pain is traditionally managed through peripheral interventions such as pharmacotherapy (5, 6), physical therapy (7), or surgery (8, 9), etc. However, these approaches often fail to address central nervous system alterations increasingly recognized in chronic pain states (10–12). Resting-state fMRI has emerged as a valuable tool to identify central biomarkers, including ALFF (13–17), ReHo (15, 17, 18), and functional connectivity (10, 11, 19, 20). Recent studies have reported brain network changes (21–26), particularly in sensorimotor, limbic, and thalamo-cortical circuits, highlighting the need for a shift toward centrally focused models of spinal pain pathophysiology.
This study used fMRI to investigate the brain remodeling mechanisms of spinal diseases related pain and to identify the specific brain mapping patterns involved in pain processing pathways. The primary objective was to establish a comprehensive evaluation framework for assessing responsible brain region and connection alterations in patients with spinal diseases related pain. By implementing a central-peripheral integrated assessment system, this research aims to provide a robust scientific foundation for enhancing diagnostic accuracy, optimizing therapeutic interventions, and improving prognostic evaluation in the management of spinal diseases related pain (5–9, 27, 28).
2 Methods
2.1 Study design and participants
This retrospective study enrolled participants who underwent functional magnetic resonance imaging (fMRI) examinations at the Department of Orthopedics, Ruijin Hospital, Shanghai Jiao Tong University School of Medicine, between October 2023 and October 2024. The study protocol was approved by the Institutional Review Board of Ruijin Hospital (Ethical Approval Number: 20240902113233506). This retrospective study included two groups: (i) patients with symptoms of spinal diseases related pain due to clinically diagnosed spinal pathology (e.g., disc degeneration, osteoporotic fracture, stenosis), and (ii) controls who presented with non-spinal orthopedic complaints and no history of chronic neurological or psychiatric disorders. All participants were right-handed and underwent brain fMRI on the same 3.0-T scanner within the same institutional protocol. Major exclusion criteria for both groups were prior spinal surgery, major neurological disease (e.g., stroke, traumatic brain injury, neurodegeneration), major psychiatric illness, claustrophobia, unstable systemic disease, or incomplete records. Pain intensity (VAS) was extracted from clinical records closest to the scan date.
2.2 fMRI acquisition
All data were acquired on a GE 3.0-T system. Participants lay supine, eyes closed, relaxed but awake. Resting-state functional images used gradient-echo EPI with the following parameters: TR/TE = 2000/30 ms, flip angle = 90°, 43 axial slices, interleaved order, slice thickness = 3.2 mm (voxel 3.4 × 3.4 × 3.2 mm3), matrix 64 × 64, FOV 220 × 220 mm2, 240 volumes, parallel acceleration = 2. Anatomical T1-weighted images used a 3D SPGR sequence: TR/TE = 8100/3.1 ms, flip angle = 8°, 176 sagittal slices, isotropic 1 mm3 voxels, FOV 256 × 256 mm2. The first 10 rs-fMRI volumes were discarded to allow signal stabilization.
2.3 Preprocessing and first-level metrics
Preprocessing was performed in RESTplus (29)(SPM12-based) on MATLAB R2013b. Steps included slice-timing correction; rigid-body realignment (subjects with >3 mm translation or >3° rotation were excluded); normalization to MNI152 template; and nuisance regression (24-parameter motion, white matter, CSF). Data were band-pass filtered at 0.01–0.08 Hz. ALFF was computed and expressed as mean-normalized (mALFF) and z-standardized (zALFF) maps within a gray matter mask (30). ReHo (31) was computed using Kendall’s coefficient over a 27-voxel (3 × 3 × 3) neighborhood and then spatially smoothed with a 6 mm FWHM Gaussian kernel.
T1-weighted structural MRI provided the anatomical reference for EPI-anatomical registration, MNI normalization, tissue segmentation (GM/WM/CSF) for nuisance modeling, and ROI/surface definitions.
2.4 Functional connectivity and degree centrality
Seed-based functional connectivity (FC) analyses used bilateral precentral and postcentral gyri as a priori regions of interest due to their established roles in pain-related sensorimotor processing and representations of nociceptive input. Seed time series were correlated with whole-brain voxels and Fisher-z transformed. Degree centrality (DC) was computed in both binary and weighted forms using RESTplus defaults (voxelwise correlation matrix thresholding), providing complementary indices of network hubness. Exact parameter settings are reported to facilitate replication.
2.5 Group-level statistics
Between group comparisons employed voxel-wise two-sample t_tests in SPM 12(32, 33)with age and sex as covariates. Multiple comparisons were controlled with Gaussian Random Field (GRF) correction at the pre-specified thresholds (ALFF/ReHo/FC: voxel p < 0.01, cluster p < 0.01; DC: voxel p < 0.05, cluster p < 0.05, matching the original analysis). Clinical variables were summarized as mean ± SD and compared with t-tests or χ2 tests as appropriate (two-tailed p < 0.05) by SPSS (version 26.0; IBM, Armonk, NY, United States) statistical software.
3 Results
3.1 Participant characteristics
Thirty-one spinal diseases related pain patients (15 males/16 females; 64.52 ± 16.40 years) and 32 controls (9 males/23 females; 47.69 ± 13.45 years) were included after quality control. Groups did not differ in sex distribution (p > 0.05); VAS pain scores were higher in patient group (p < 0.001). Age was included as a covariate in imaging analyses. The demographic and clinical characteristics of patients are shown in Table 1.
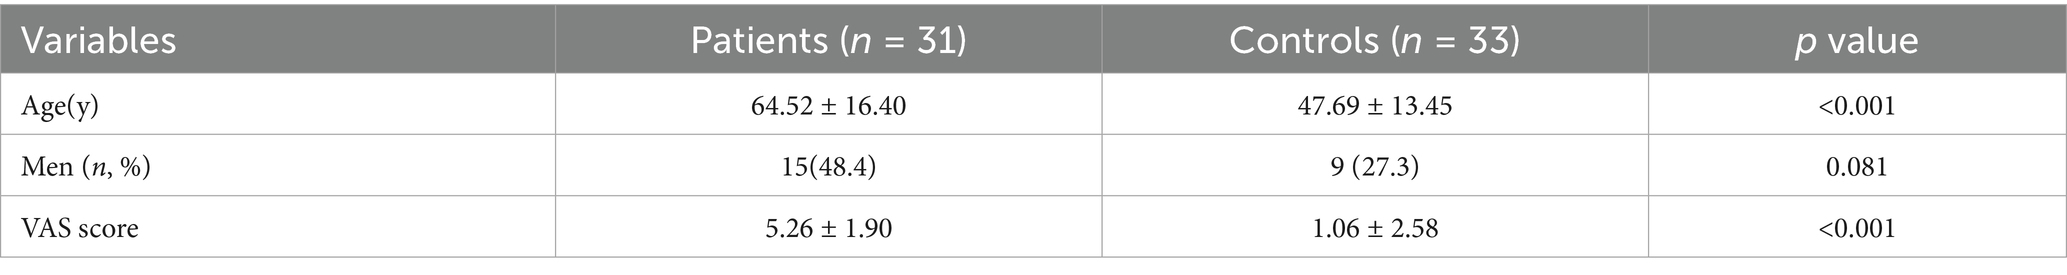
Table 1. Participant characteristics.
3.2 The regional brain change in patient group
Regional spontaneous activity (mALFF / zALFF) (Tables 2, 3; Figures 1, 2): Relative to controls, patients showed higher mALFF in the right cerebellar lobule IX (MNI − 6, −39, −57; cluster = 276; t = 4.8383) and right medial superior frontal gyrus (MNI − 21, 12, 33; cluster = 465; t = 4.2789). Lower mALFF emerged in the bilateral postcentral gyrus [left: MNI − 57, −12, 30; cluster = 501; t = −5.3963; right: MNI 48, −21, 36; cluster = 695; t = −4.957], right cuneus (MNI 0, −84, 27; cluster = 443; t = −4.5173), and right middle temporal gyrus (MNI 57, −57, 6; cluster = 77; t = −3.8437). The zALFF map reproduced this pattern: increased activity in right cerebellar lobule IX (MNI − 6, −39, −57; cluster = 310; t = 4.8195) and right medial superior frontal gyrus (MNI − 6, 39, 54; cluster = 405; t = 4.1027), and decreased activity in the bilateral postcentral gyrus [left: MNI − 57, −12, 30; cluster = 534; t = −5.6379; right: MNI 42, −18, 54; cluster = 730; t = −5.1794] and right cuneus (MNI 0, −84, 27; cluster = 443; t = −4.7479).
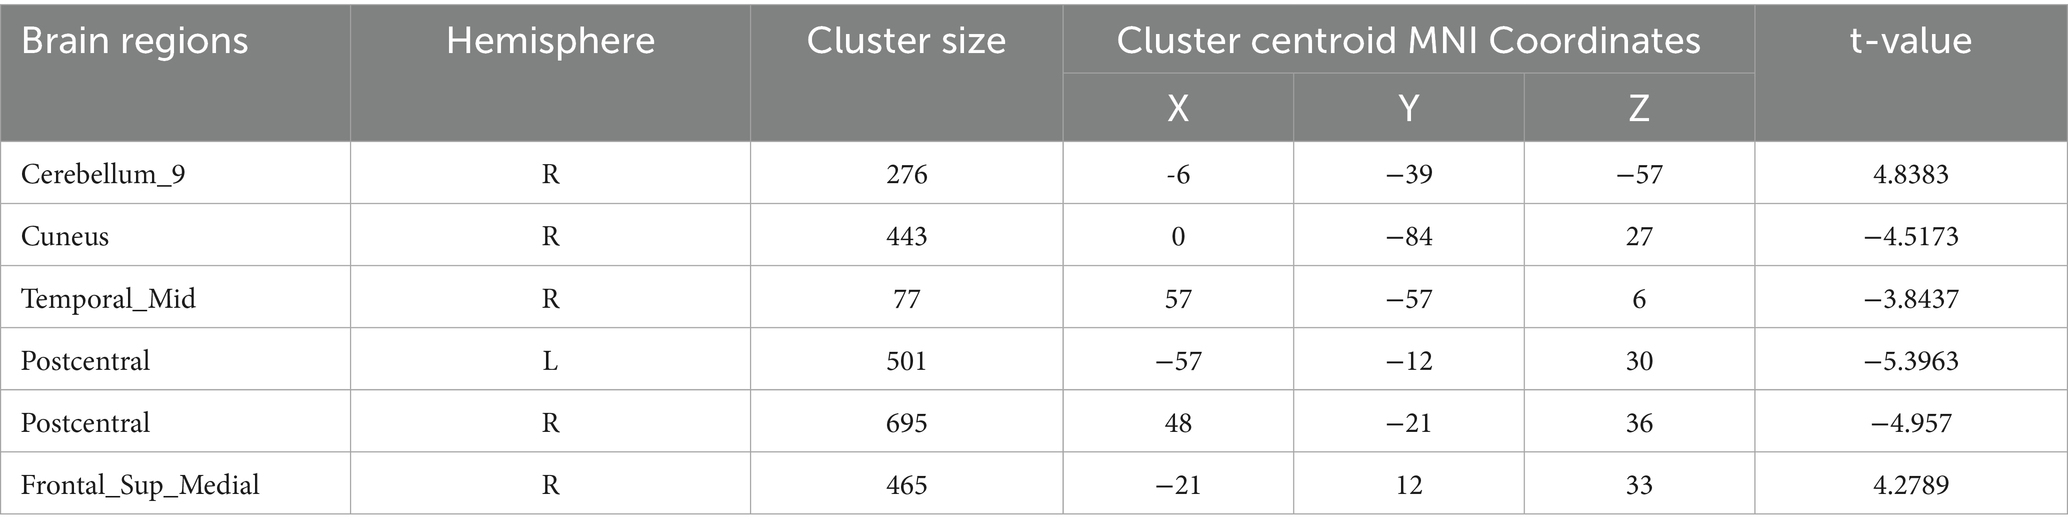
Table 2. mALFF differences.
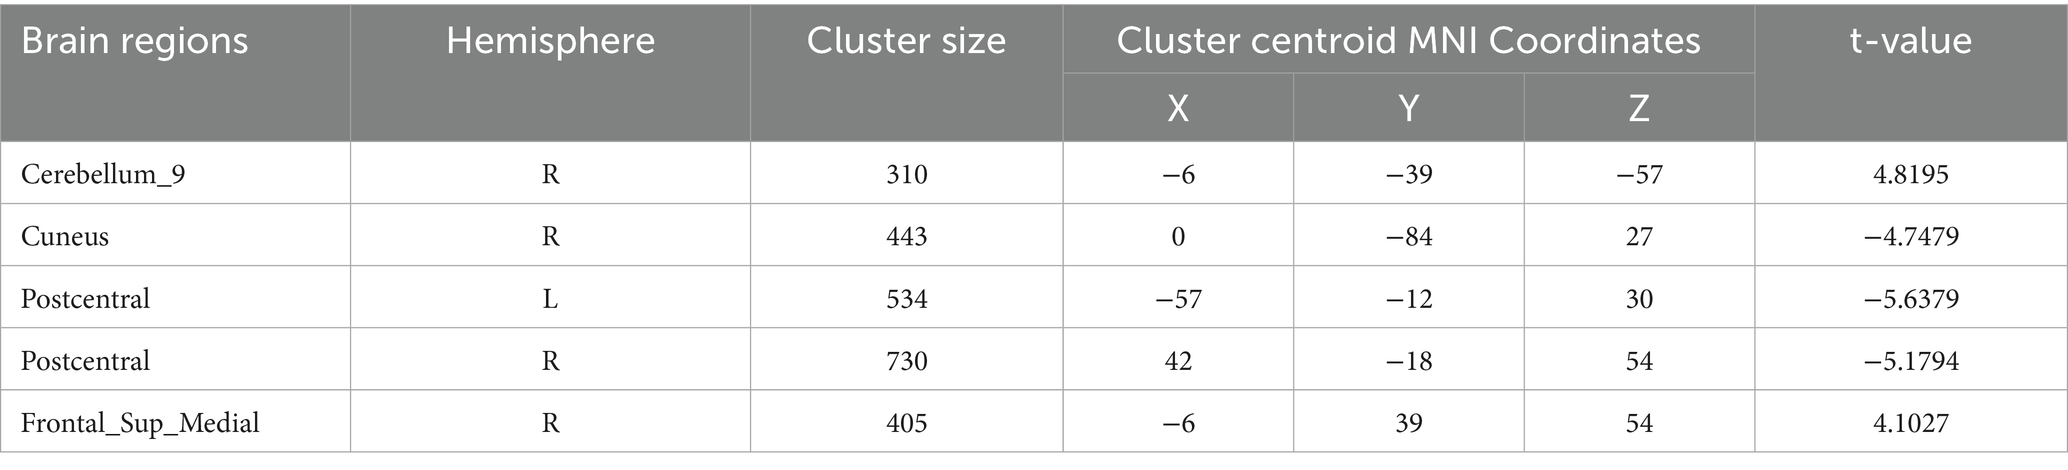
Table 3. zALFF differences.

Figure 1. mALFF analysis. Two-sample t-test results are presented. Areas in red indicate significantly increased mALFF value. Areas in blue indicate significantly decreased mALFF value. In the comparison of mALFF value between patient group compared to control group showed significantly increased mALFF in Cerebellum_9_R and right Frontal_Sup_Medial_R.
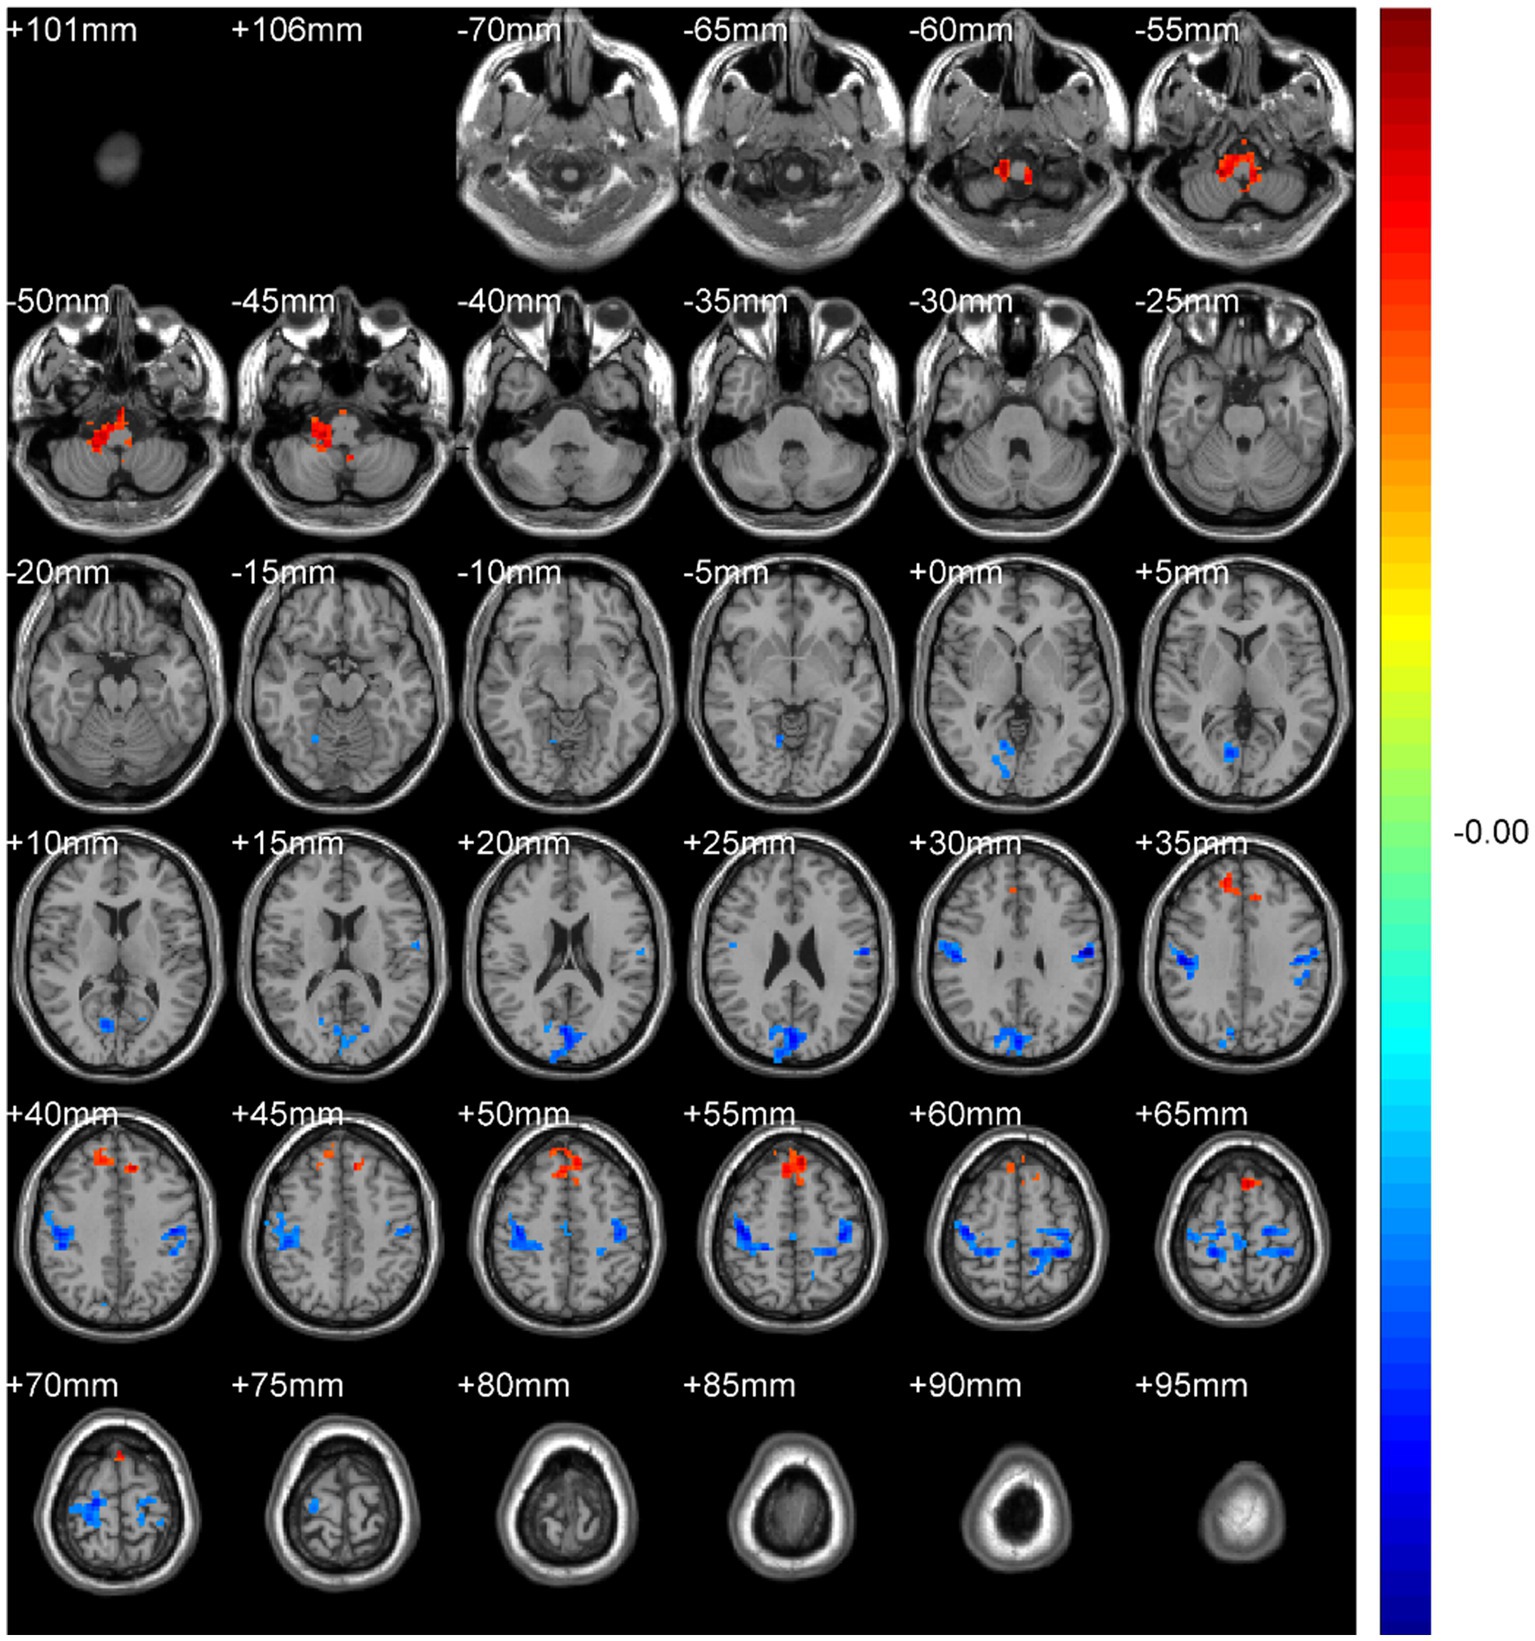
Figure 2. zALFF analysis. Two-sample t-test results are presented. Areas in red indicate significantly increased zALFF value. Areas in blue indicate significantly decreased zALFF value. In the comparison of zALFF value between patient group compared to control group showed significantly increased zALFF in Cerebellum_9_R and right Frontal_Sup_Medial_R.
Regional homogeneity (ReHo) (Table 4; Figure 3): Using the SMKCC method, ReHo decreased in the left postcentral gyrus (MNI − 57, −12, 27; cluster = 641; t = −5.2072) and right postcentral gyrus (MNI 27, −21, 75; cluster = 680; t = −5.5139).
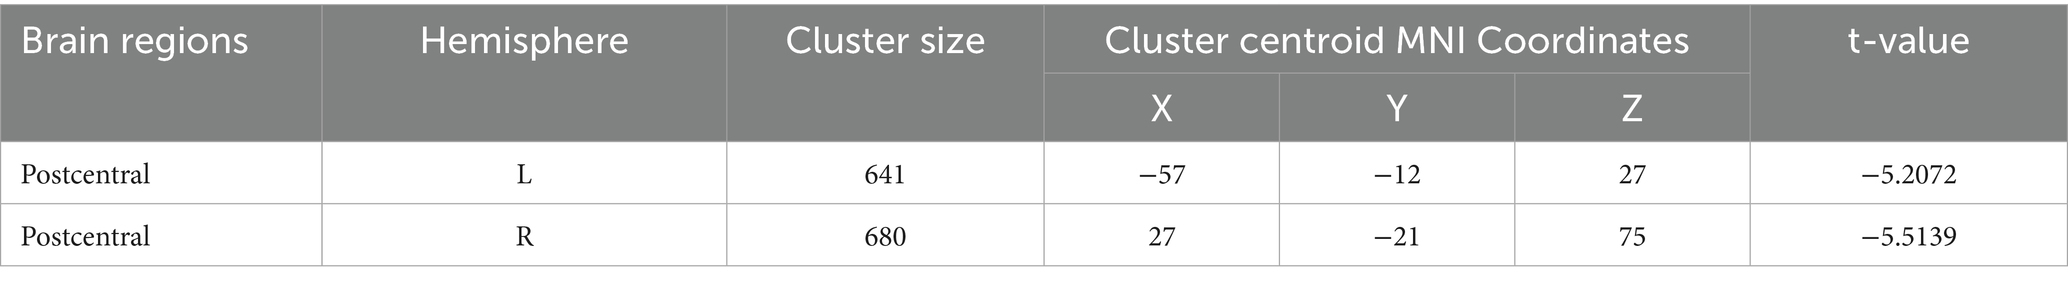
Table 4. ReHo differences (SMKCC method).
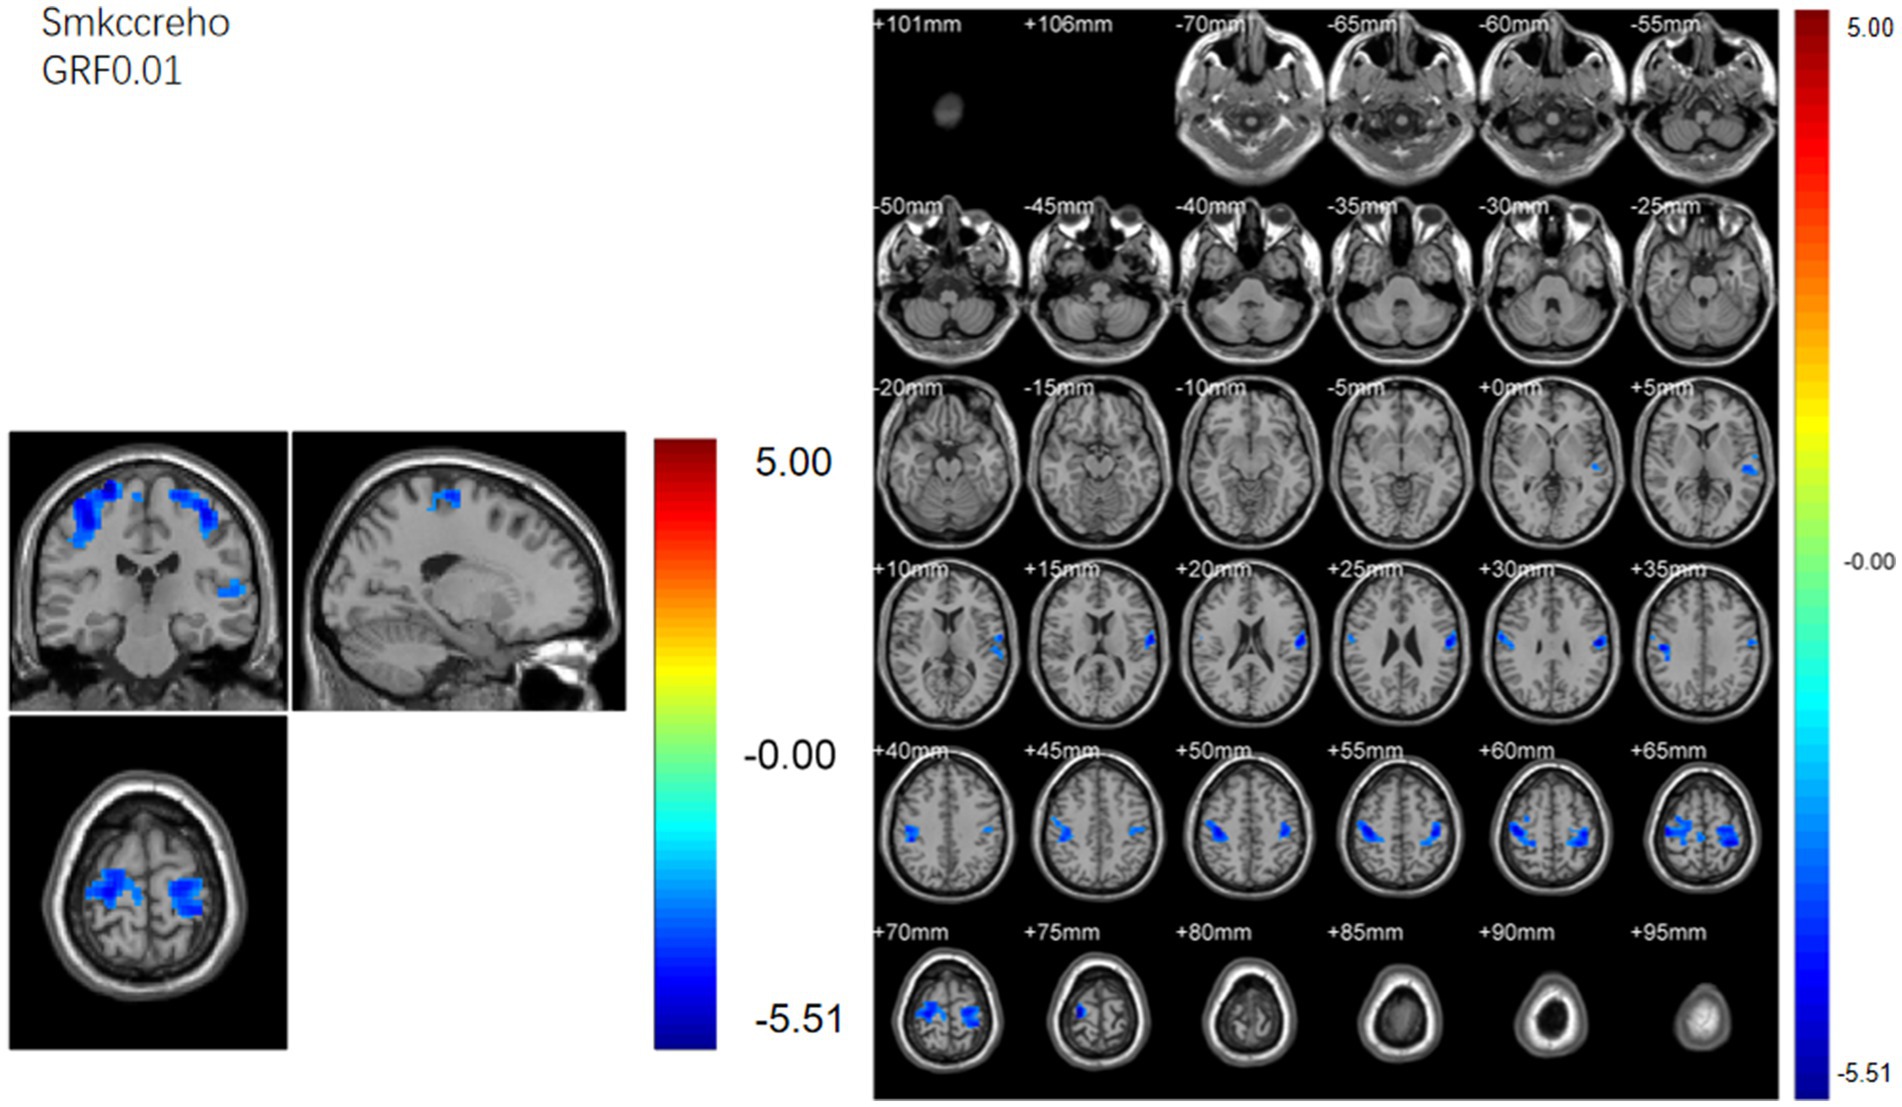
Figure 3. SMKCCREHO analysis. Two-sample t-test results are presented. Areas in blue indicate significantly decreased SMKCCREHO value. In the comparison of SMKCCREHO value between patient group compared to control group showed significantly decreased SMKCCREHO in right and left Postcentral gyus.
3.3 The whole brain changes in patient group
Seed-based functional connectivity (FC) (Tables 5–8; Figures 4–7):
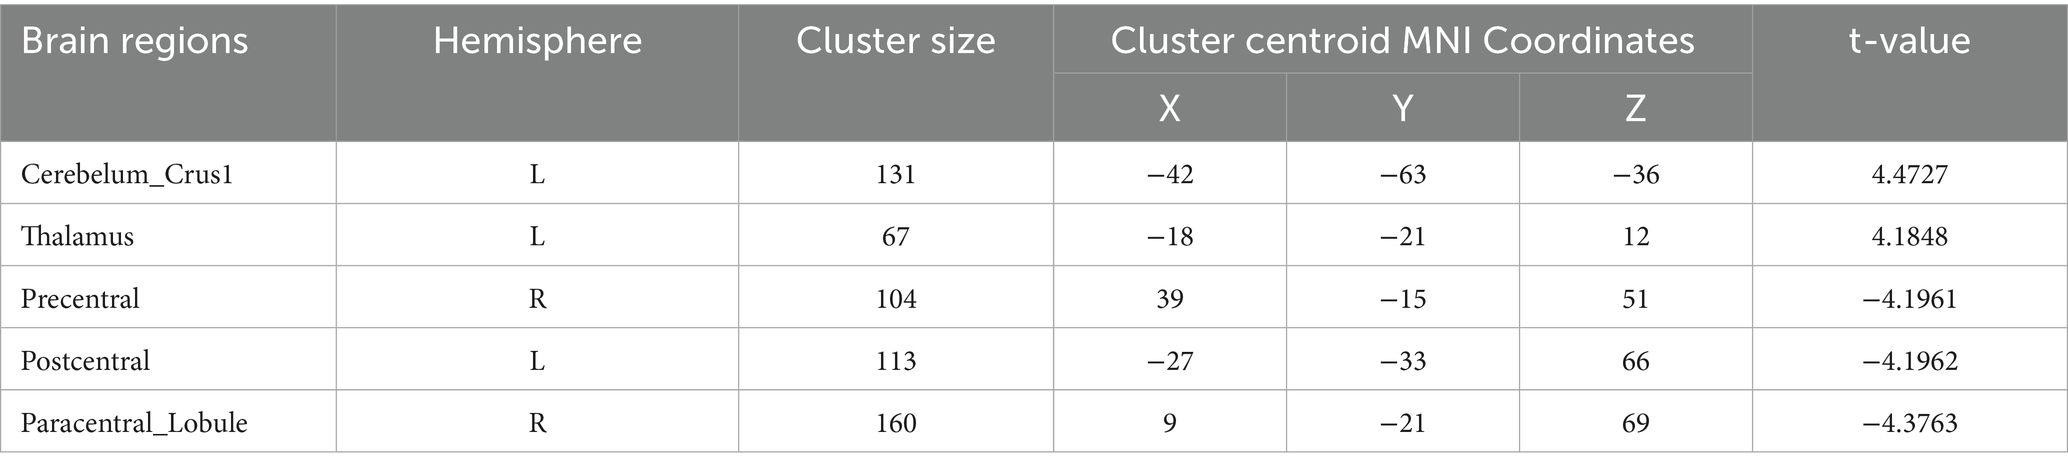
Table 5. Functional connection with the left postcentral gyrus as the seed point for patient group compared to subjects with control group.
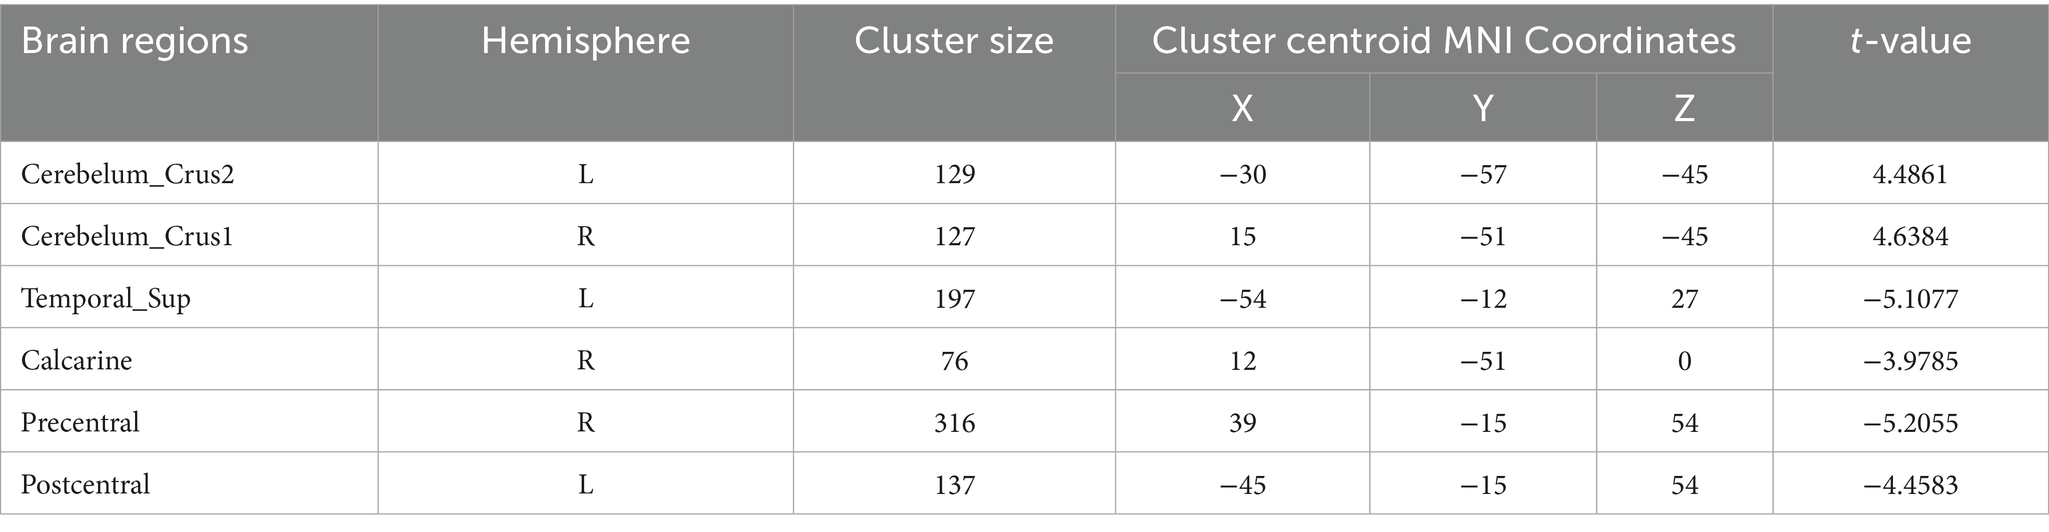
Table 6. Functional connection with the right Postcentral gyrus as the seed point for patient group compared to subjects with control group.
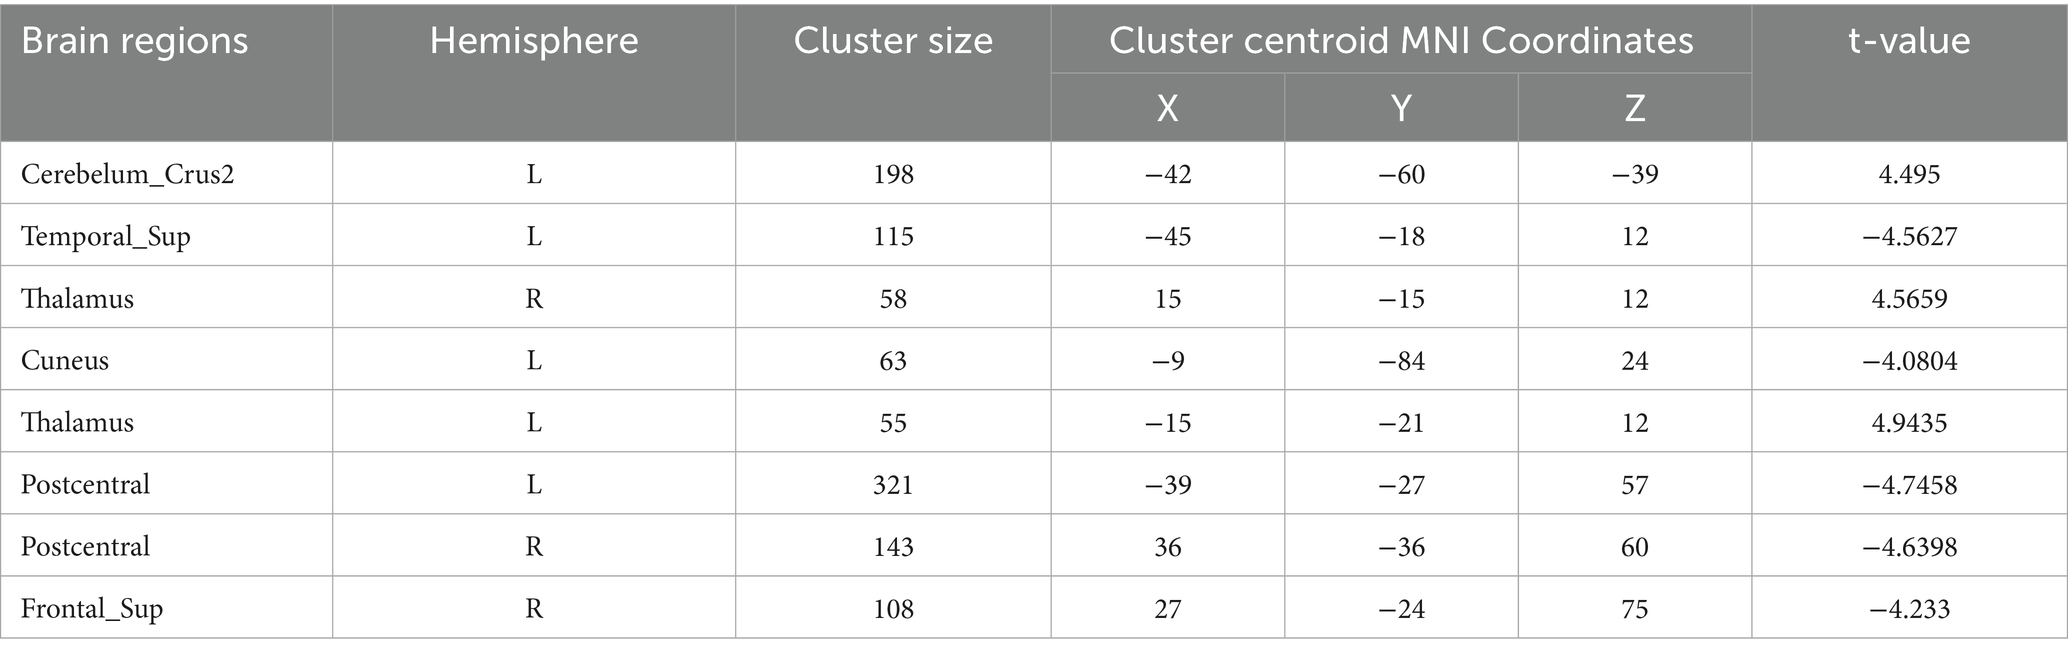
Table 7. Functional connection with the left precentral gyrus as the seed point for patient group compared to control group.
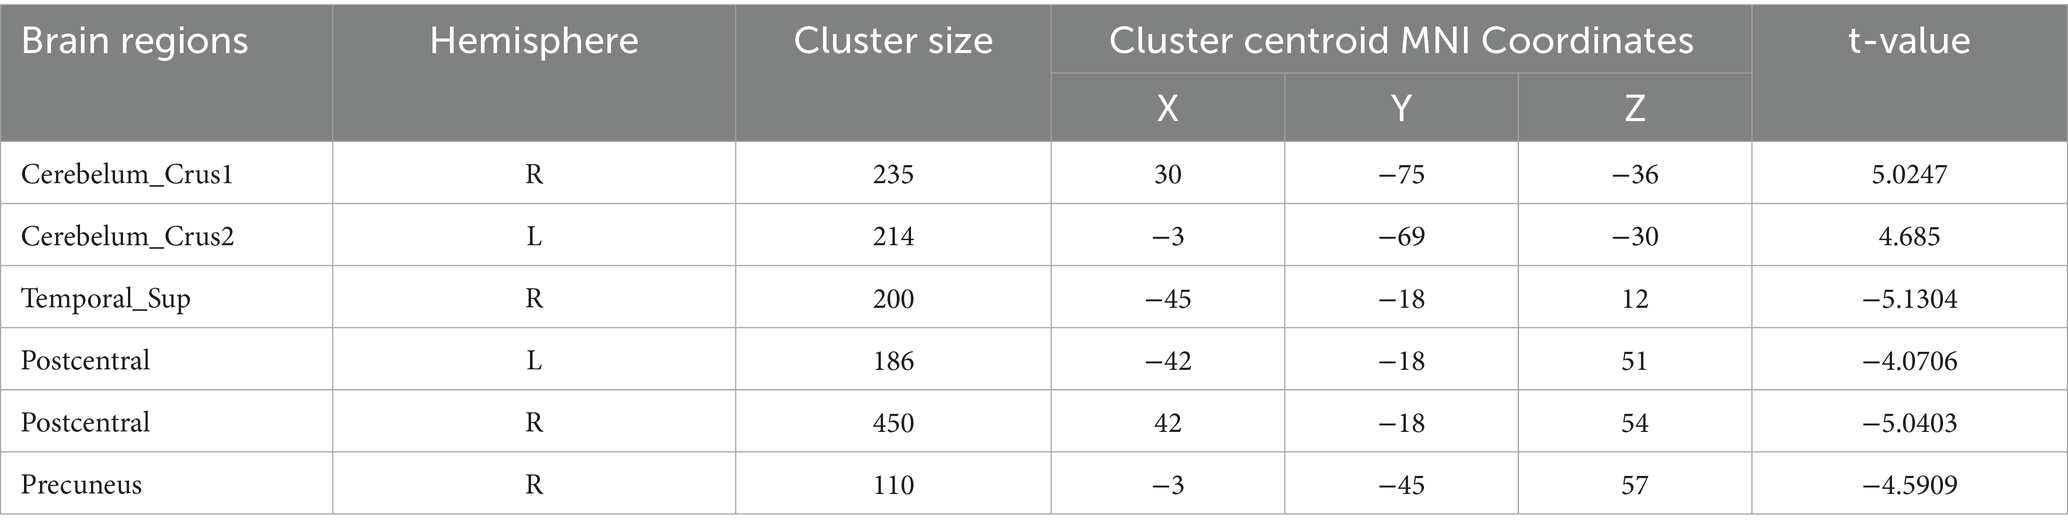
Table 8. Functional connection with the right precentral gyrus as the seed point for patient group compared to control group.
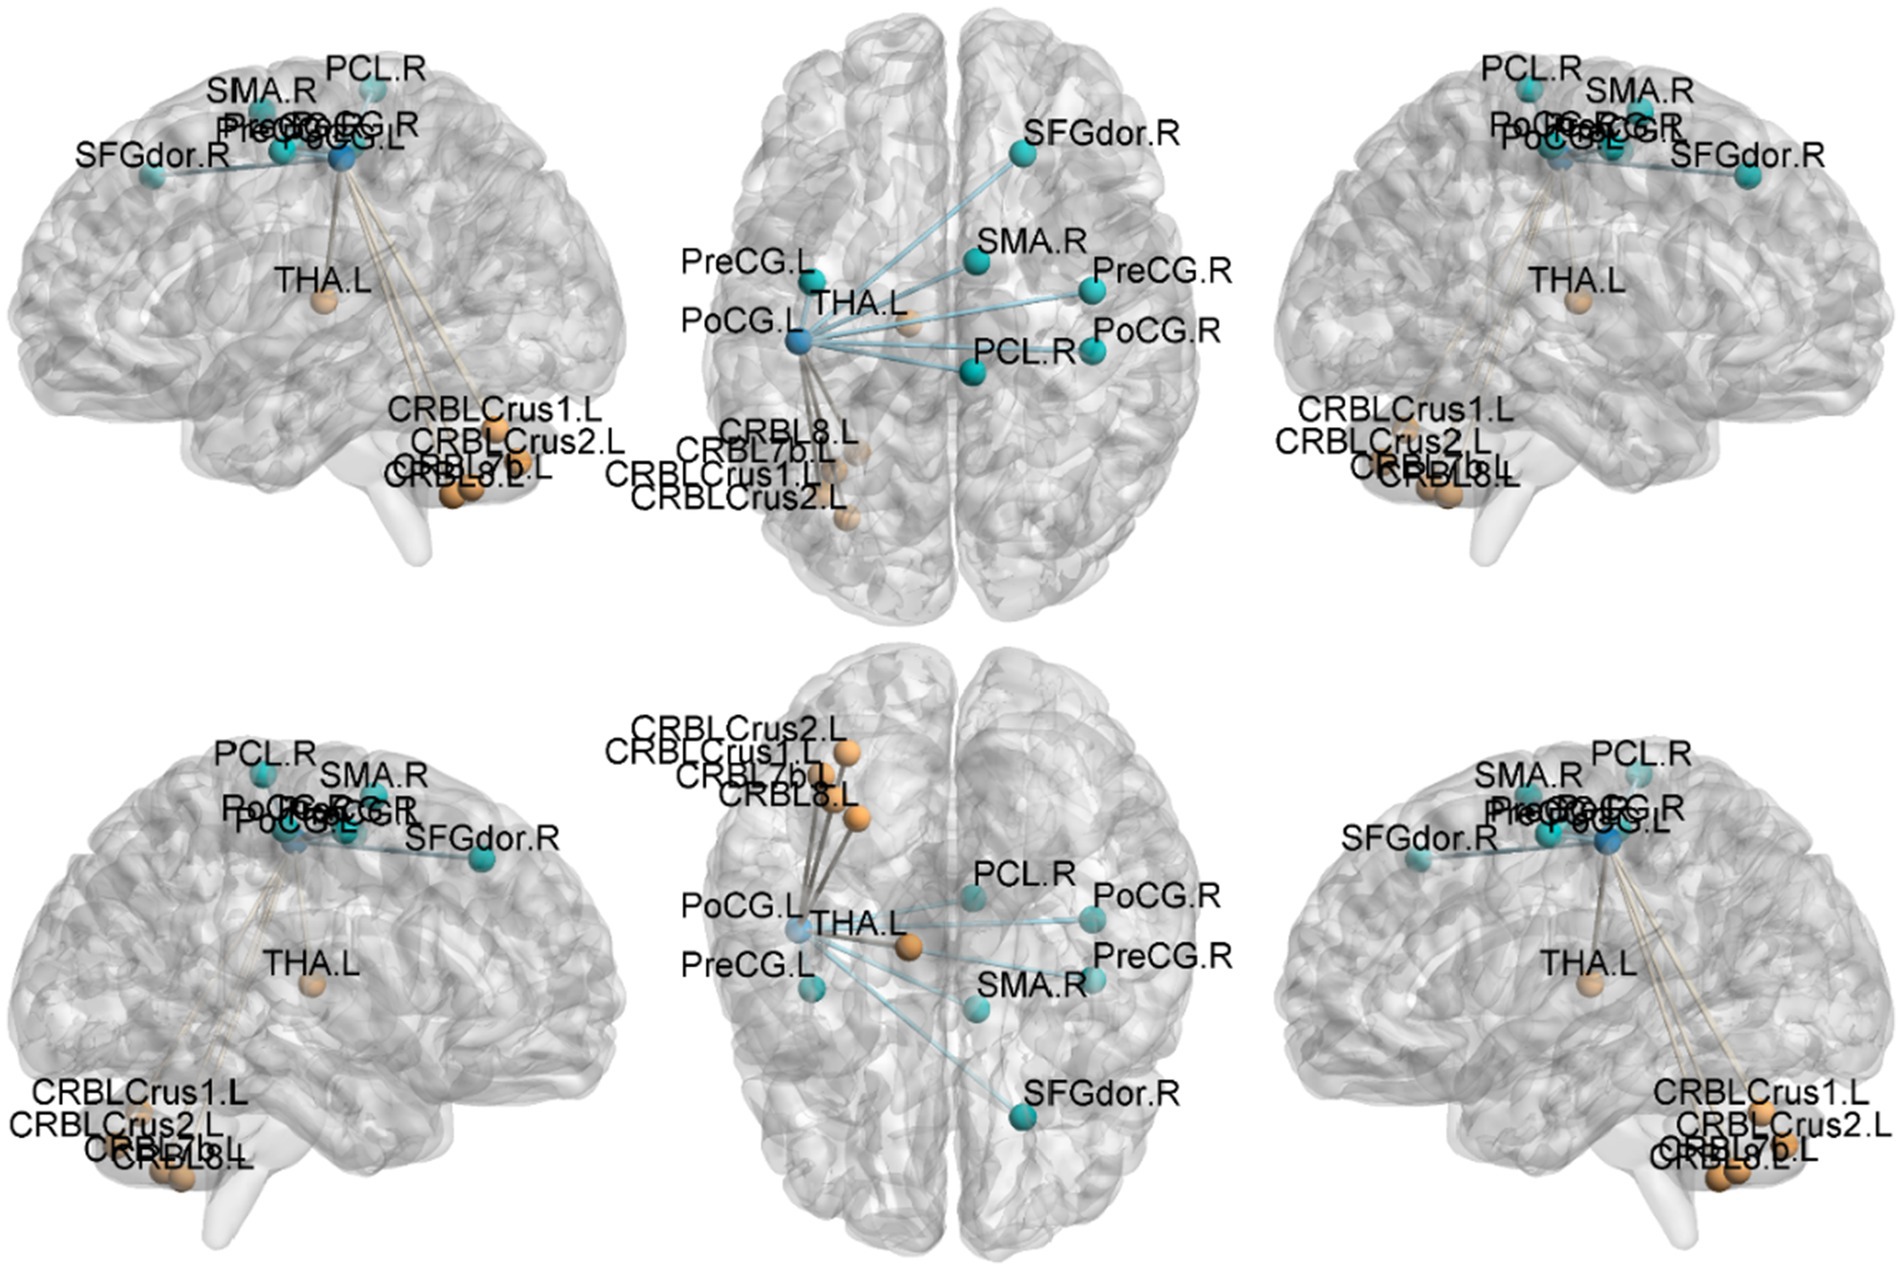
Figure 4. Functional connection with the left Postcentral gyrus as the seed point for patient group compared to control group. The deep blue spheres represent regions of interest, the light blue spheres represent brain regions with decreased functional connectivity to the regions of interest, and the orange spheres represent brain regions with increased functional connectivity to the regions of interest.
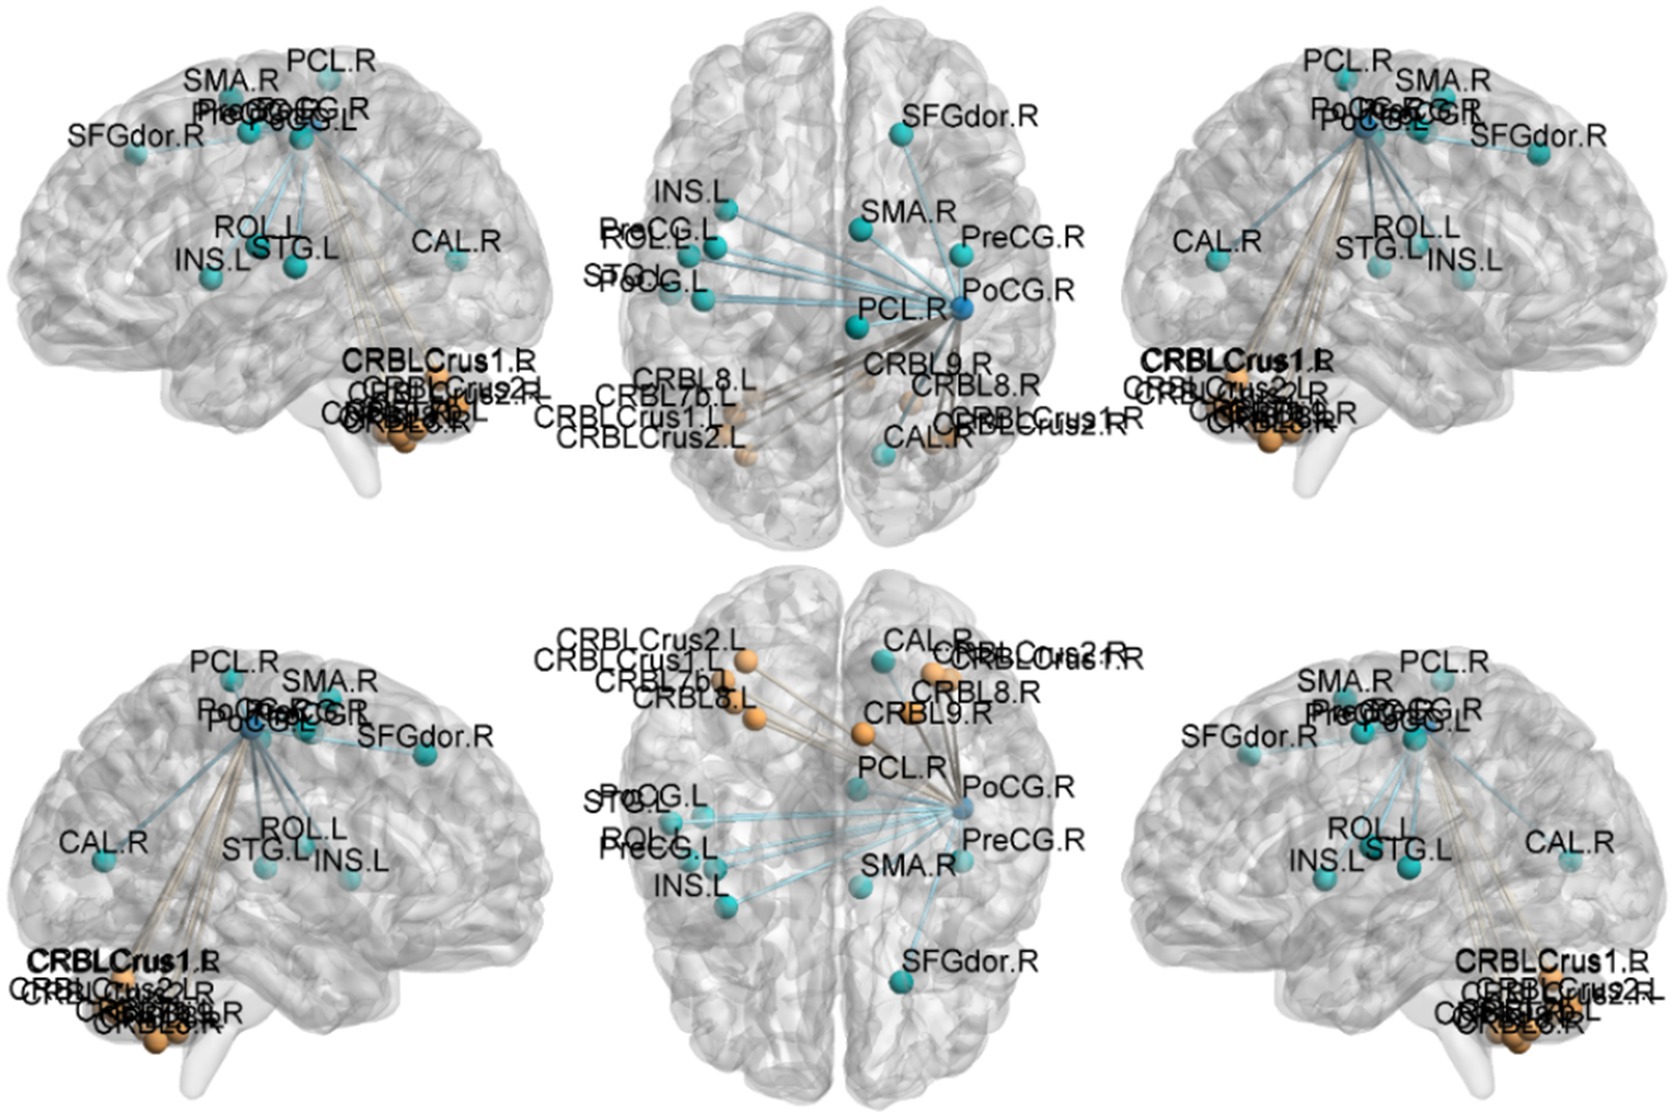
Figure 5. Functional connection with the right Postcentral gyrus as the seed point for patient group compared to control group. The deep blue spheres represent regions of interest, the light blue spheres represent brain regions with decreased functional connectivity to the regions of interest, and the orange spheres represent brain regions with increased functional connectivity to the regions of interest.
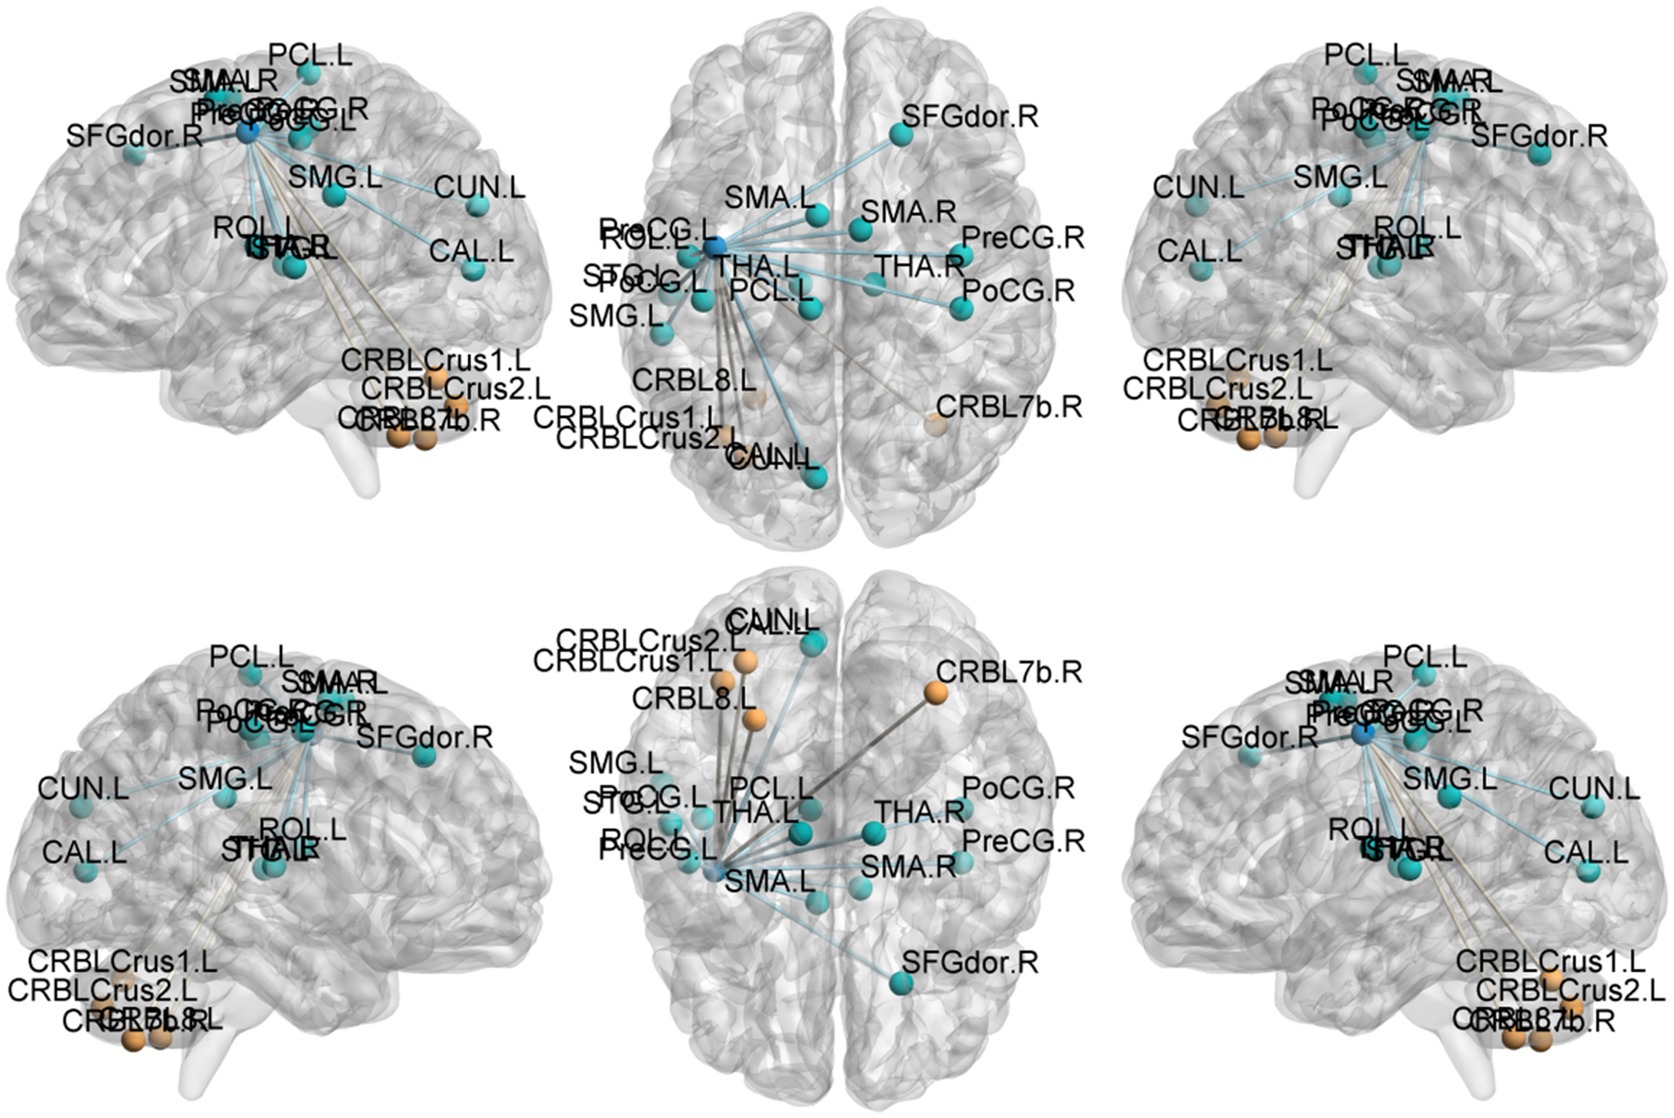
Figure 6. Functional connection with the left Precentral gyrus as the seed point for patient group compared to control group. The deep blue spheres represent regions of interest, the light blue spheres represent brain regions with decreased functional connectivity to the regions of interest, and the orange spheres represent brain regions.
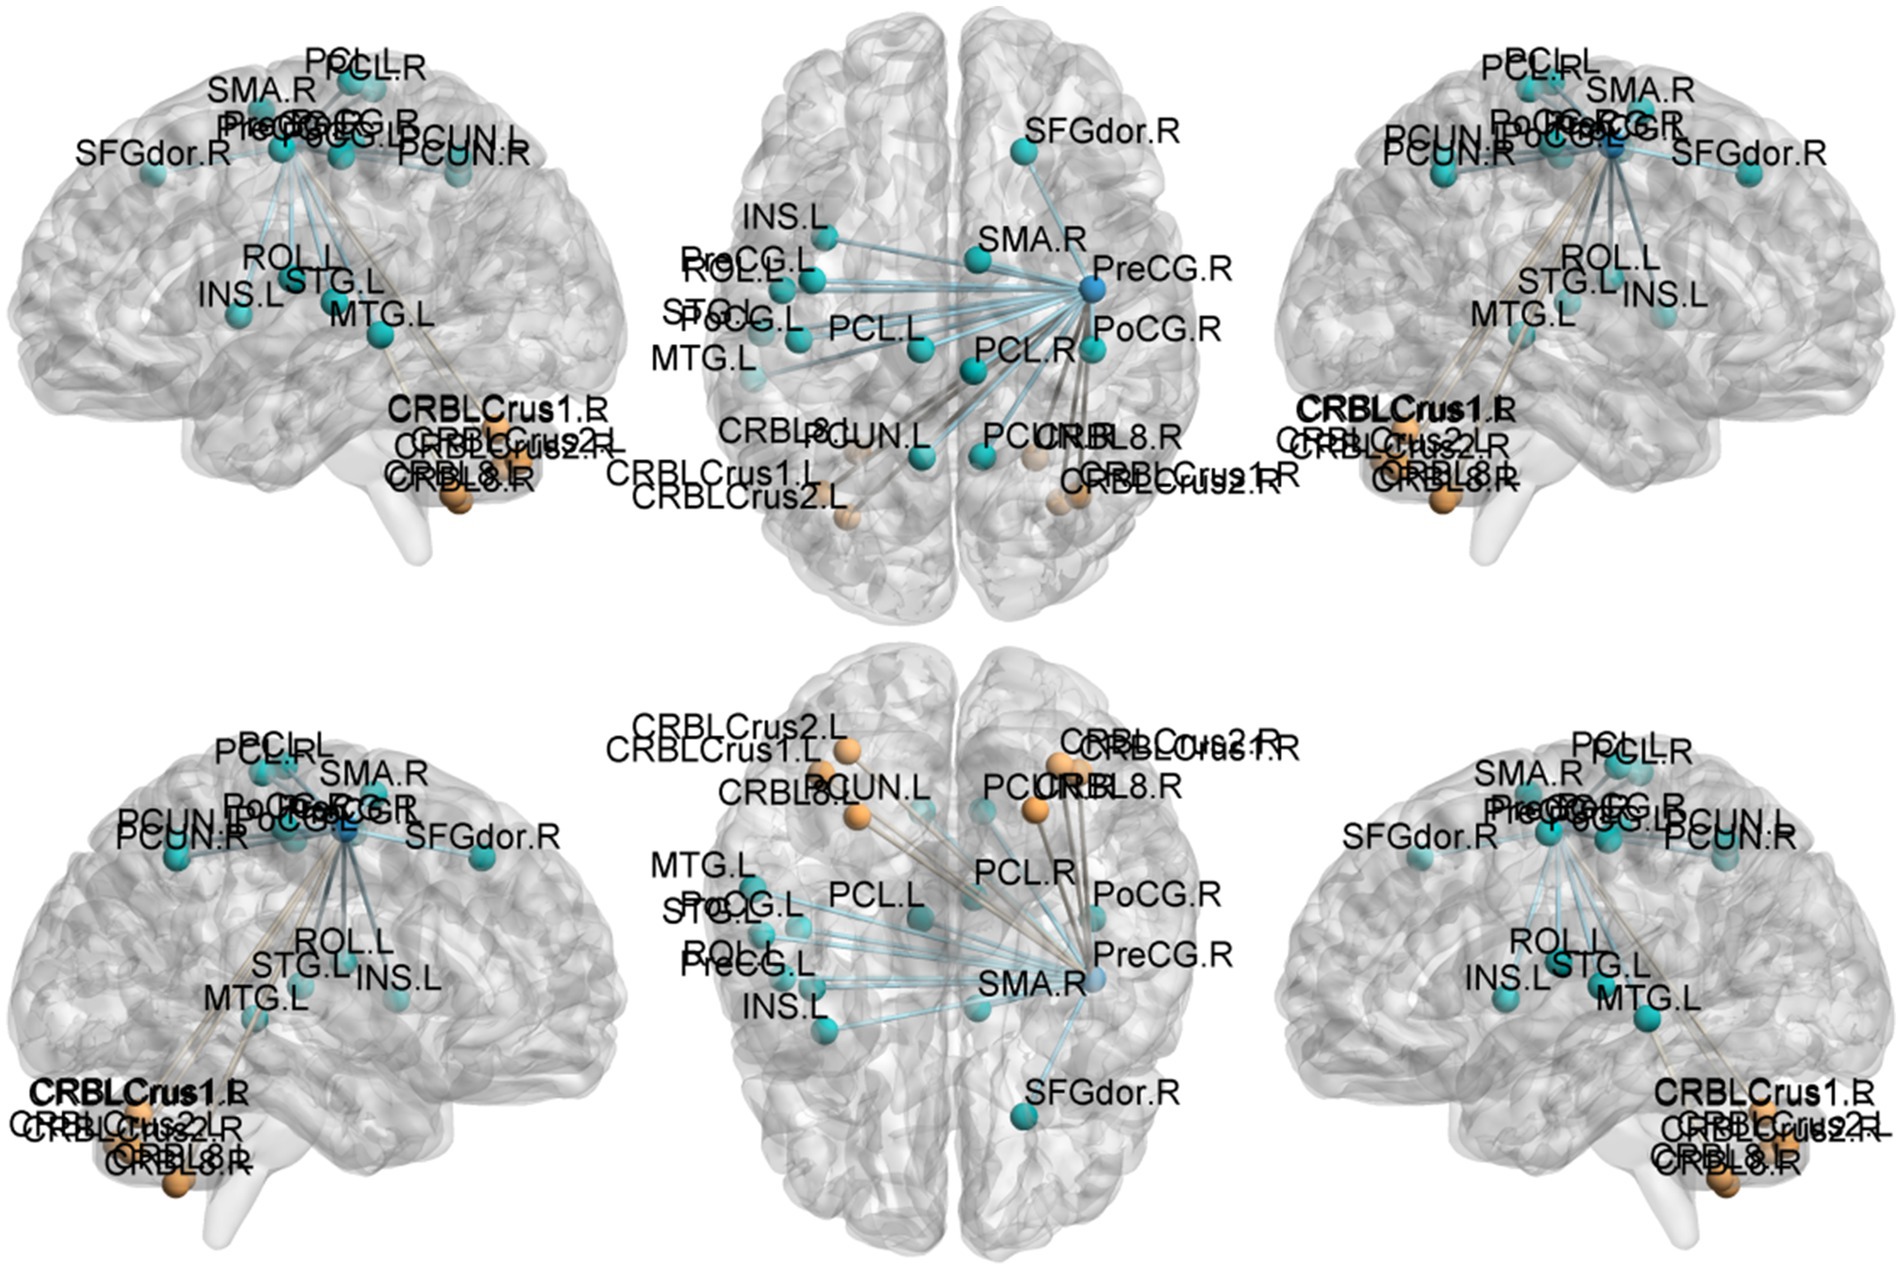
Figure 7. Functional connection with the right Precentral gyrus as the seed point for patient group compared to control group. The deep blue spheres represent regions of interest, the light blue spheres represent brain regions with decreased functional connectivity to the regions of interest, and the orange spheres represent brain regions with increased functional connectivity to the regions of interest.
Postcentral gyrus seeds: Left postcentral seed: showed stronger FC with left cerebellar Crus I (MNI − 42, −63, −36; cluster = 131; t = 4.4727) and left thalamus (MNI − 18, −21, 12; cluster = 67; t = 4.1848); showed weaker FC with right precentral gyrus (MNI 39, −15, 51; cluster = 104; t = −4.1961), left postcentral gyrus (MNI − 27, −33, 66; cluster = 113; t = −4.1962), and right paracentral lobule (MNI 9, −21, 69; cluster = 160; t = −4.3763). Right postcentral seed: showed stronger FC with left cerebellar Crus II (MNI − 30, −57, −45; cluster = 129; t = 4.4861) and right cerebellar Crus I (MNI 15, −51, −45; cluster = 127; t = 4.6384); showed weaker FC with left superior temporal gyrus (MNI − 54, −12, 27; cluster = 197; t = −5.1077), right calcarine cortex (MNI 12, −51, 0; cluster = 76; t = −3.9785), right precentral gyrus (MNI 39, −15, 54; cluster = 316; t = −5.2055), and left postcentral gyrus (MNI − 45, −15, 54; cluster = 137; t = −4.4583).
Precentral gyrus seeds: Left precentral seed: showed stronger FC with left cerebellar Crus II (MNI − 42, 60, −39; cluster = 198; t = 4.495) and with the thalamus bilaterally [right thalamus (MNI 15, −15, 12; cluster = 58; t = 4.5659) and left thalamus (MNI − 15, −21, 12; cluster = 55; t = 4.9435)]; showed weaker FC with left superior temporal gyrus (MNI − 45, 18, 12; cluster = 115; t = −4.5627), left cuneus (MNI − 9, −84, 24; cluster = 63; t = −4.0804), left postcentral gyrus (MNI − 39, −27, 57; cluster = 321; t = −4.7458), right postcentral gyrus (MNI 36, −36, 60; cluster = 143; t = −4.6398), and right superior frontal gyrus (MNI 27, −24, 75; cluster = 108; t = −4.233). Right precentral seed: showed stronger FC with right cerebellar Crus I (MNI 30, −75, −36; cluster = 235; t = 5.0247) and left cerebellar Crus II (MNI − 3, −69, −30; cluster = 214; t = 4.685); showed weaker FC with right superior temporal gyrus (MNI − 45, −18, 12; cluster = 200; t = −5.1304), left postcentral gyrus (MNI − 42, −18, 51; cluster = 186; t = −4.0706), right postcentral gyrus (MNI 42, −18, 54; cluster = 450; t = −5.0403), and right precuneus (MNI − 3, −45, 57; cluster = 110; t = −4.5909).
Degree centrality (DC) (Tables 9–12; Figures 8–11): Across DC variants, cerebellar Crus I/II showed increased degree centrality, whereas motor and orbitofrontal hubs showed decreased degree centrality.
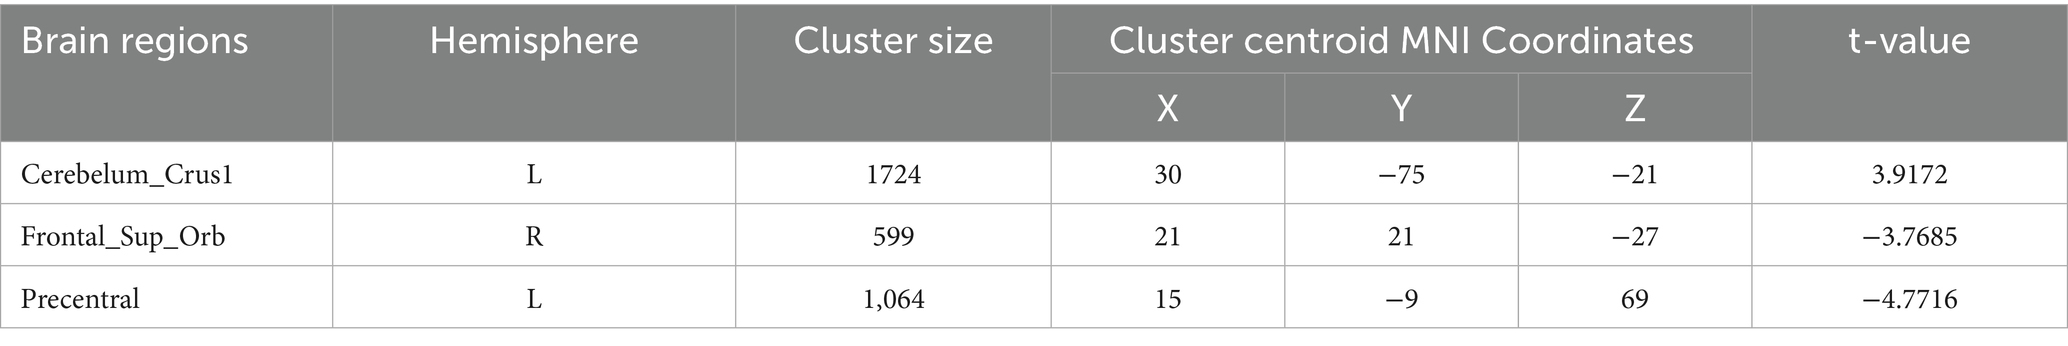
Table 9. DegreeCentrality (Bi-SmDegreeCentrality).
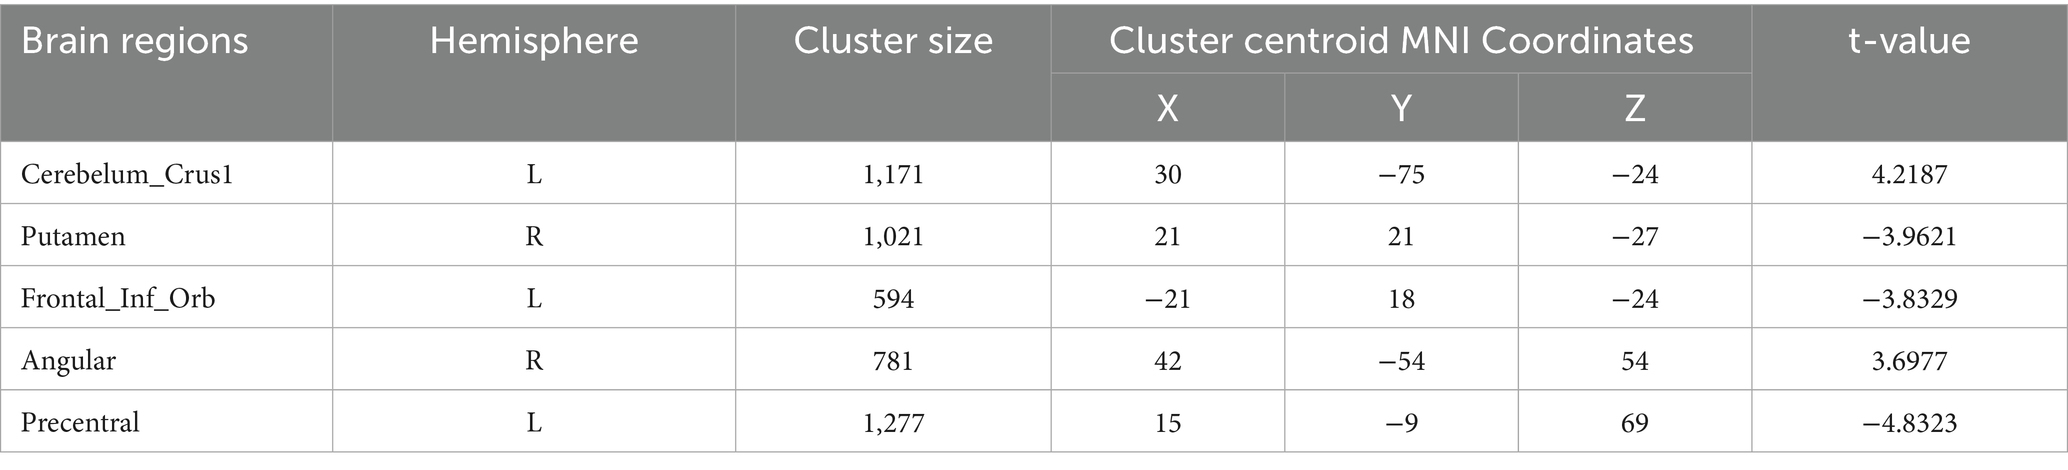
Table 10. DegreeCentrality (Bi-SzDegreeCentrality).
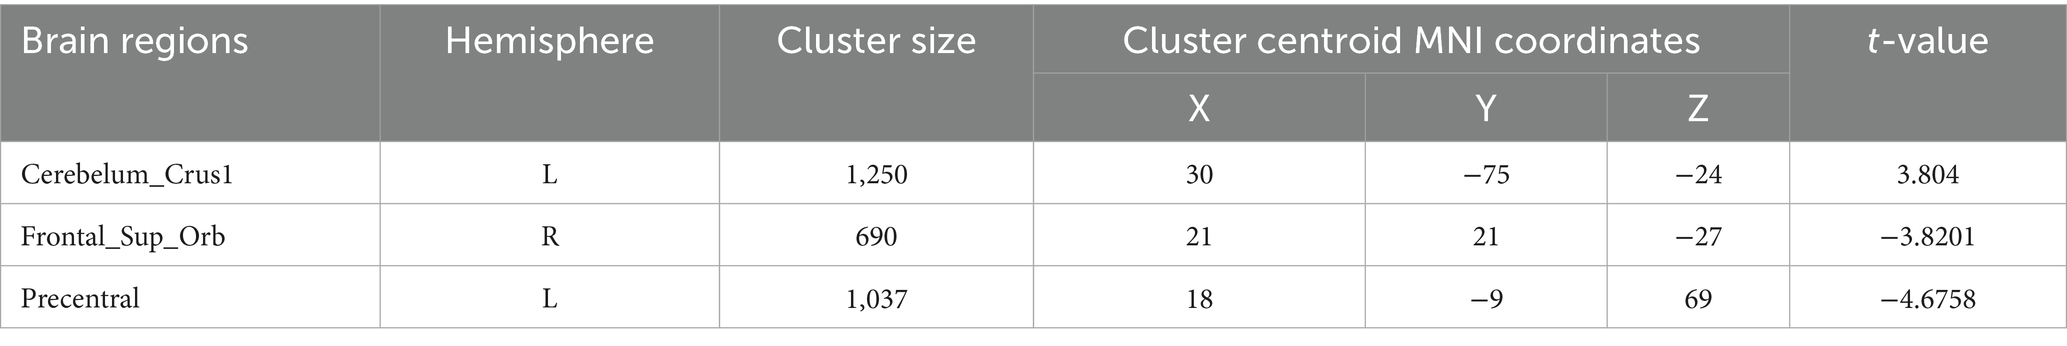
Table 11. DegreeCentrality (weighted-SmDegreeCentrality).
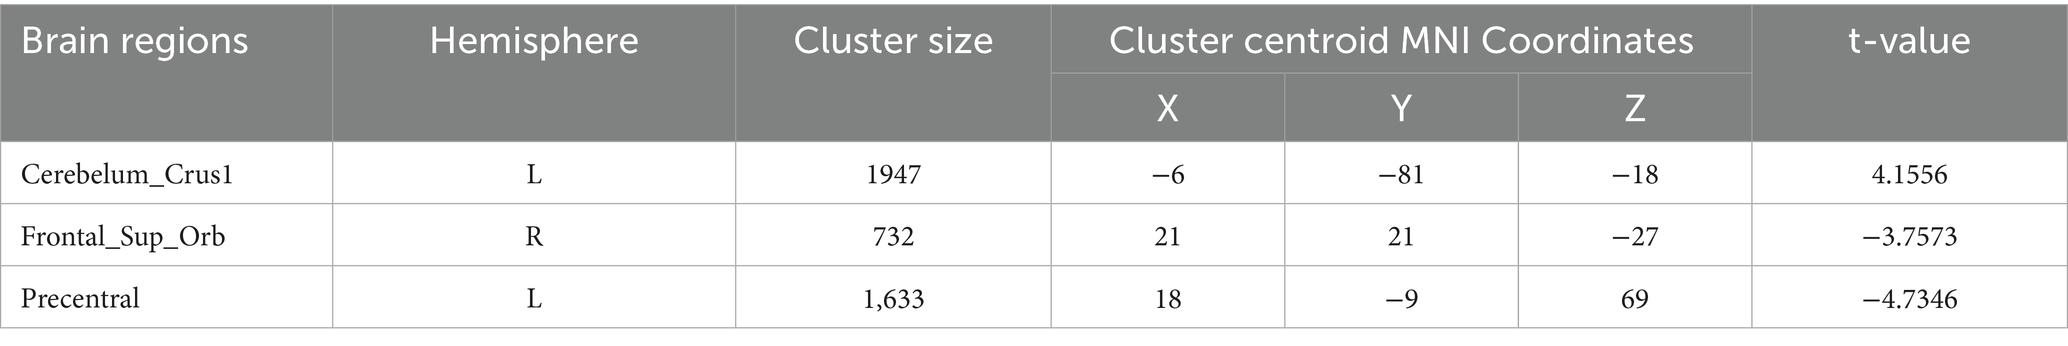
Table 12. DegreeCentrality (weighted-SzDegreeCentrality).
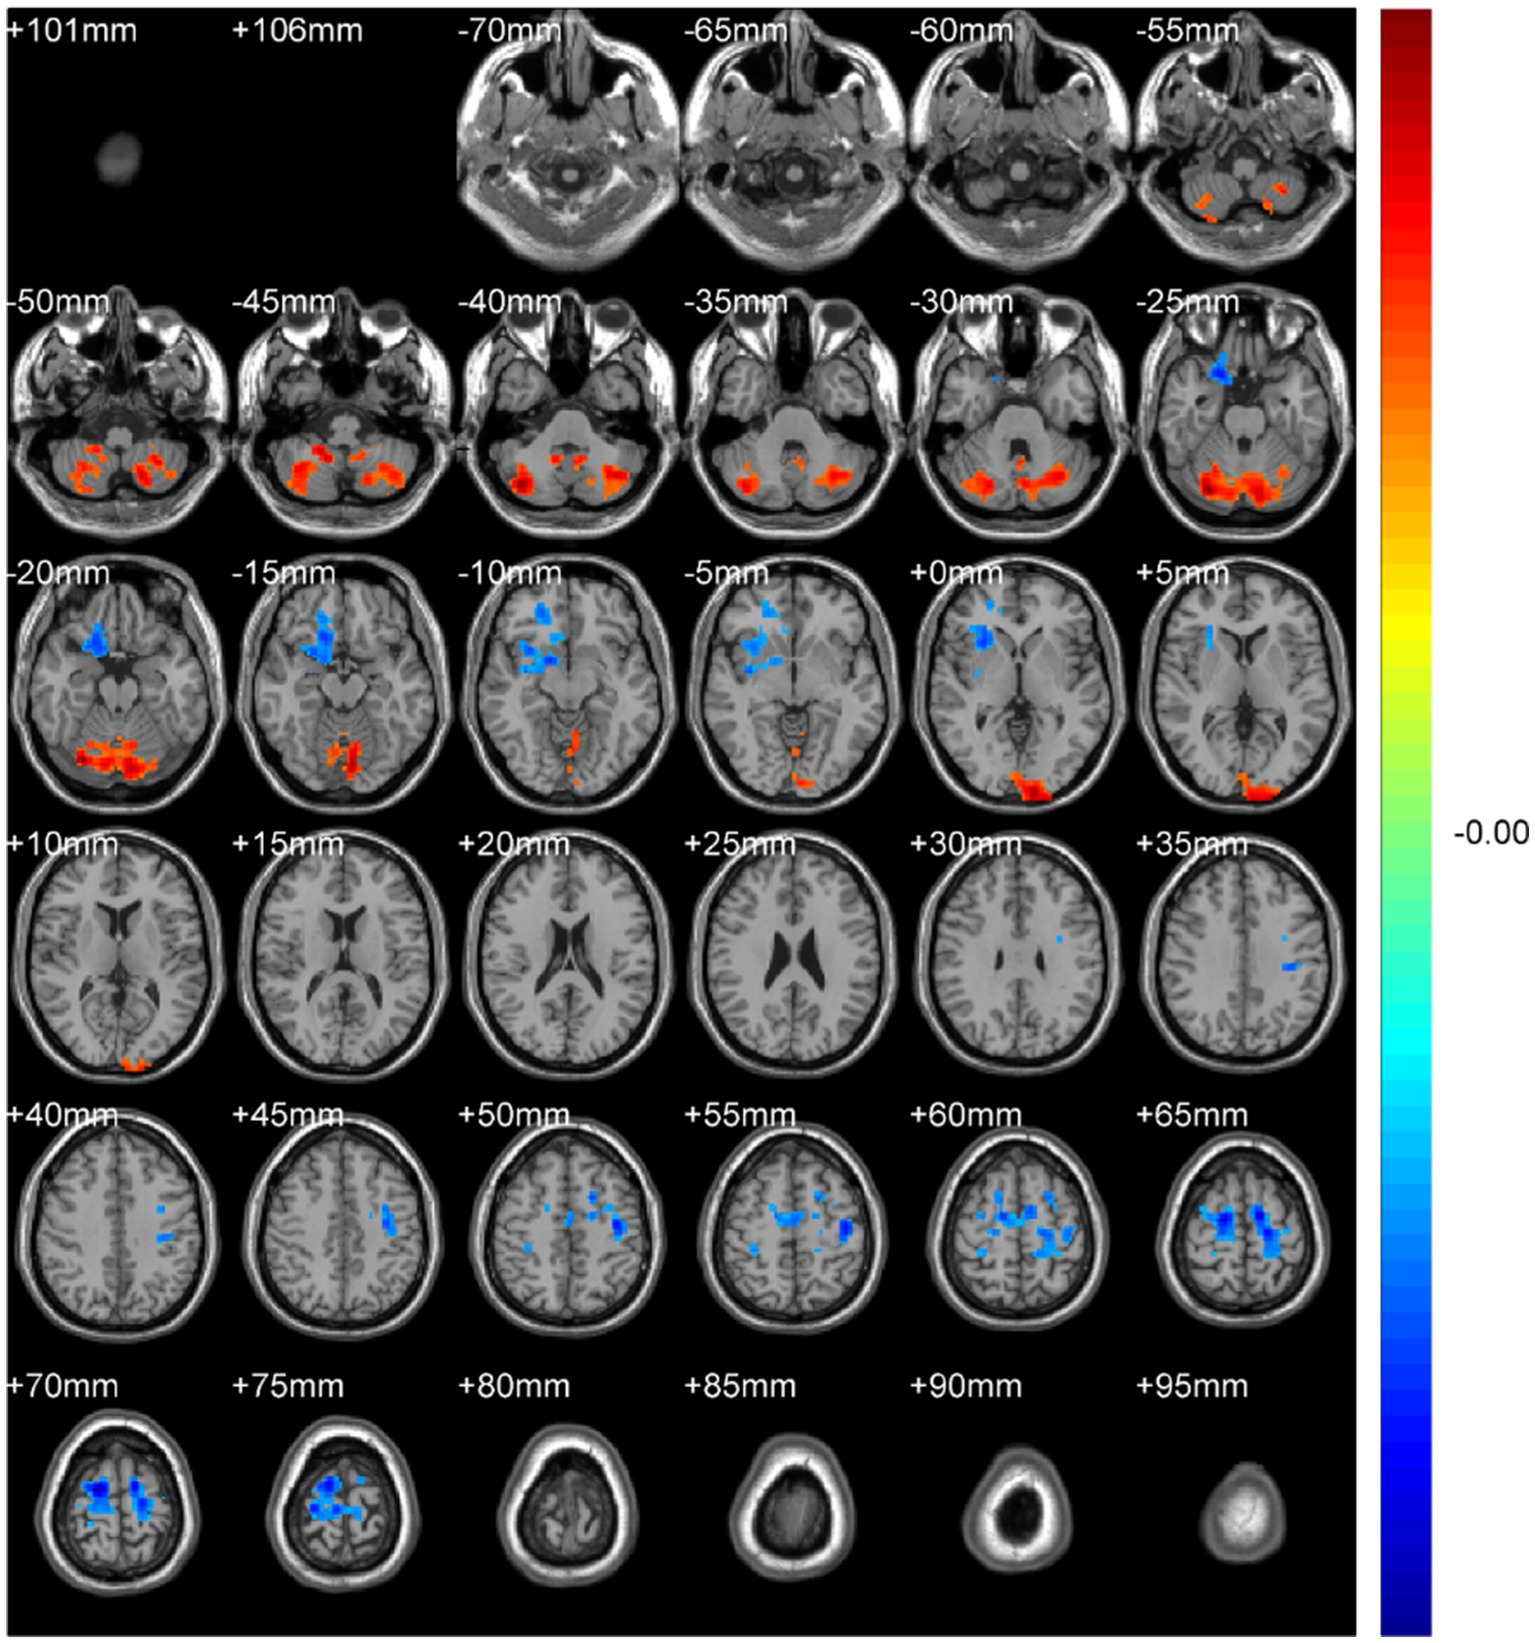
Figure 8. DegreeCentrality(Bi-SmDegreeCentrality). Areas in blue indicate significantly decreased value,areas in red indicate significantly increased value.

Figure 9. DegreeCentrality(Bi-SzDegreeCentrality). Areas in blue indicate significantly decreased value,areas in red indicate significantly increased value.
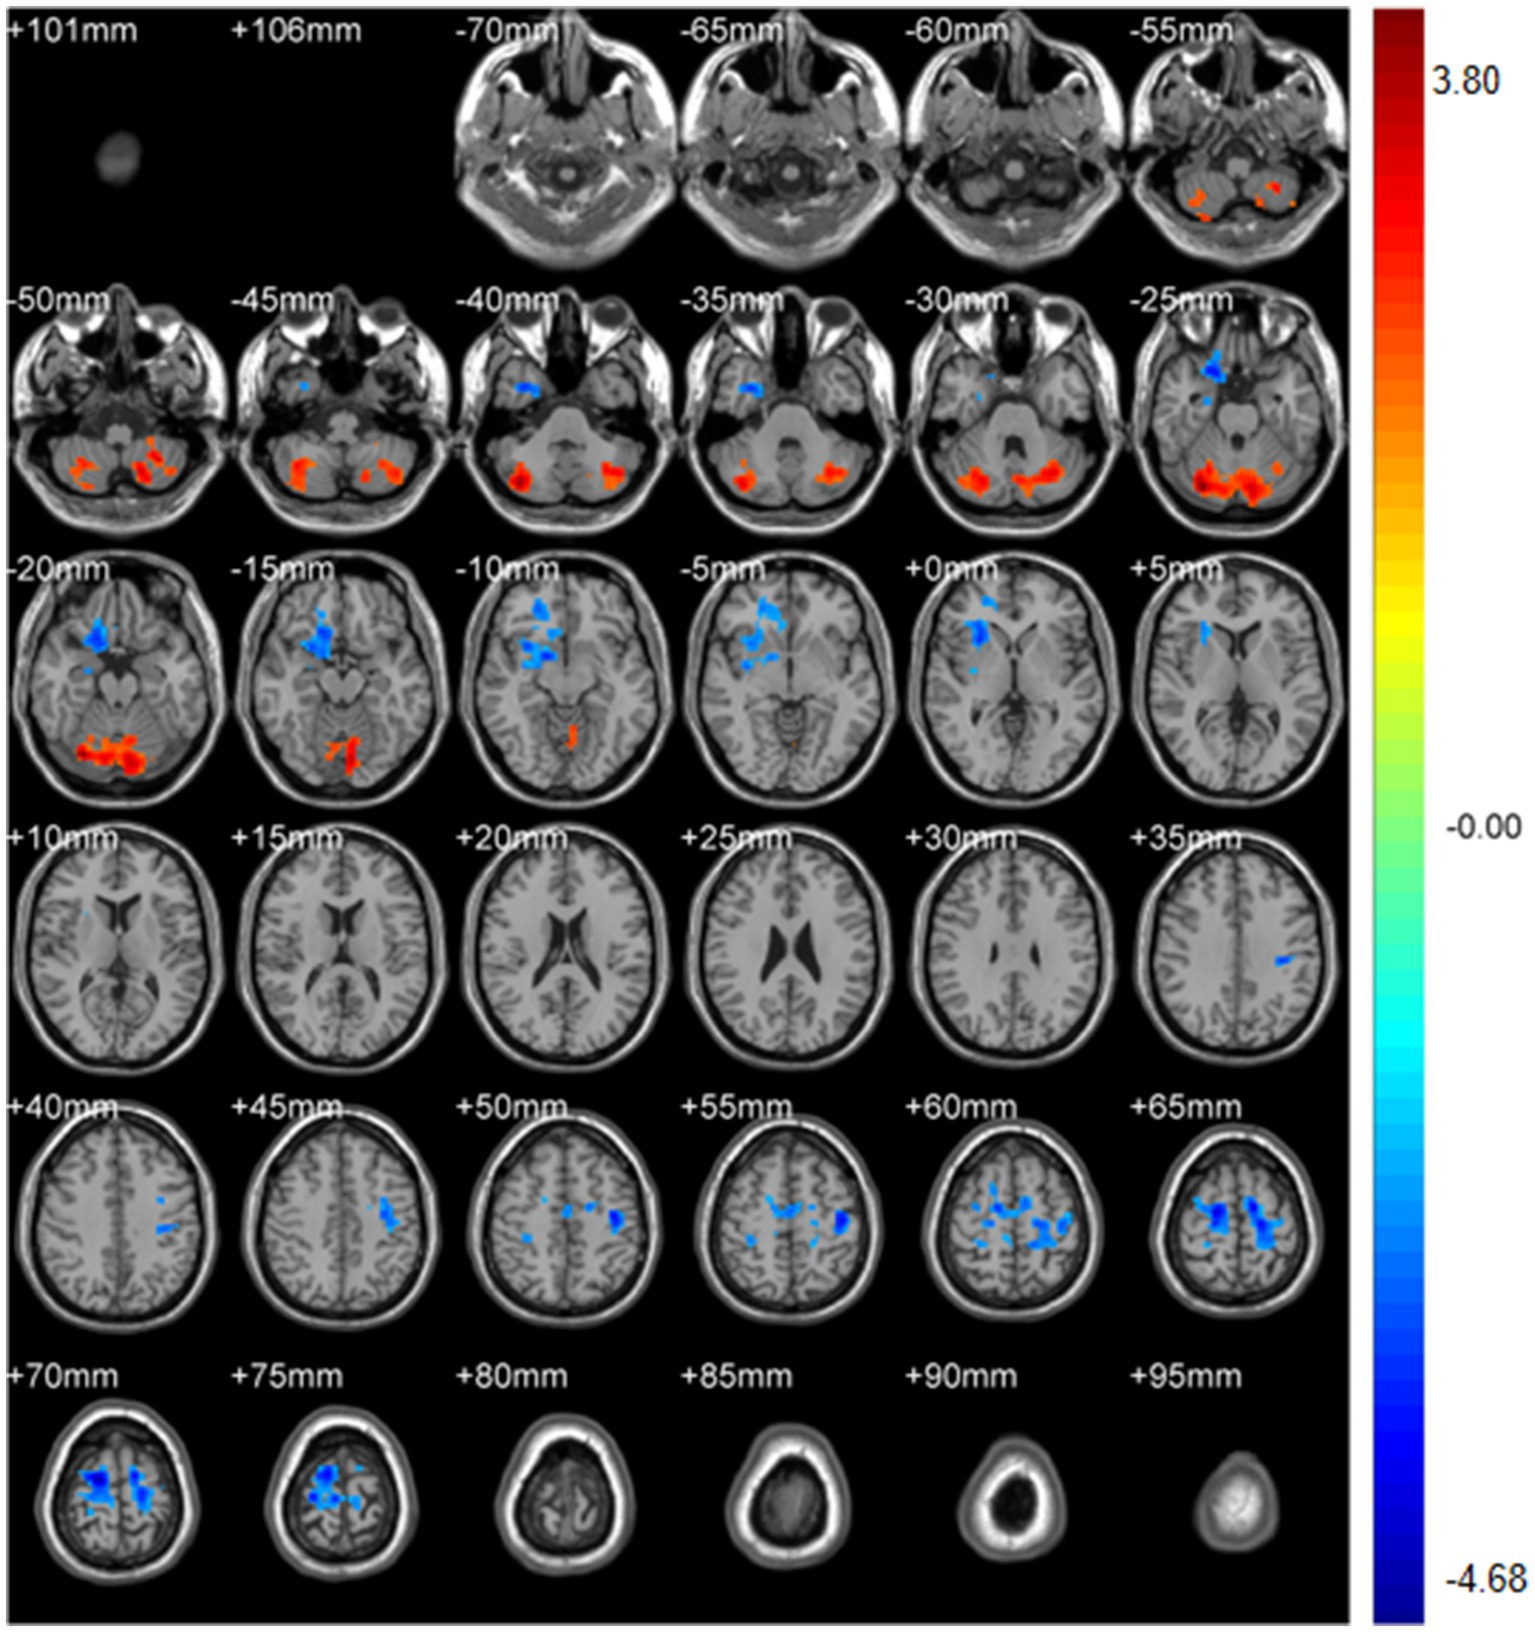
Figure 10. DegreeCentrality(weighted-SmDegreeCentrality). Areas in blue indicate significantly decreased value,areas in red indicate significantly increased value.
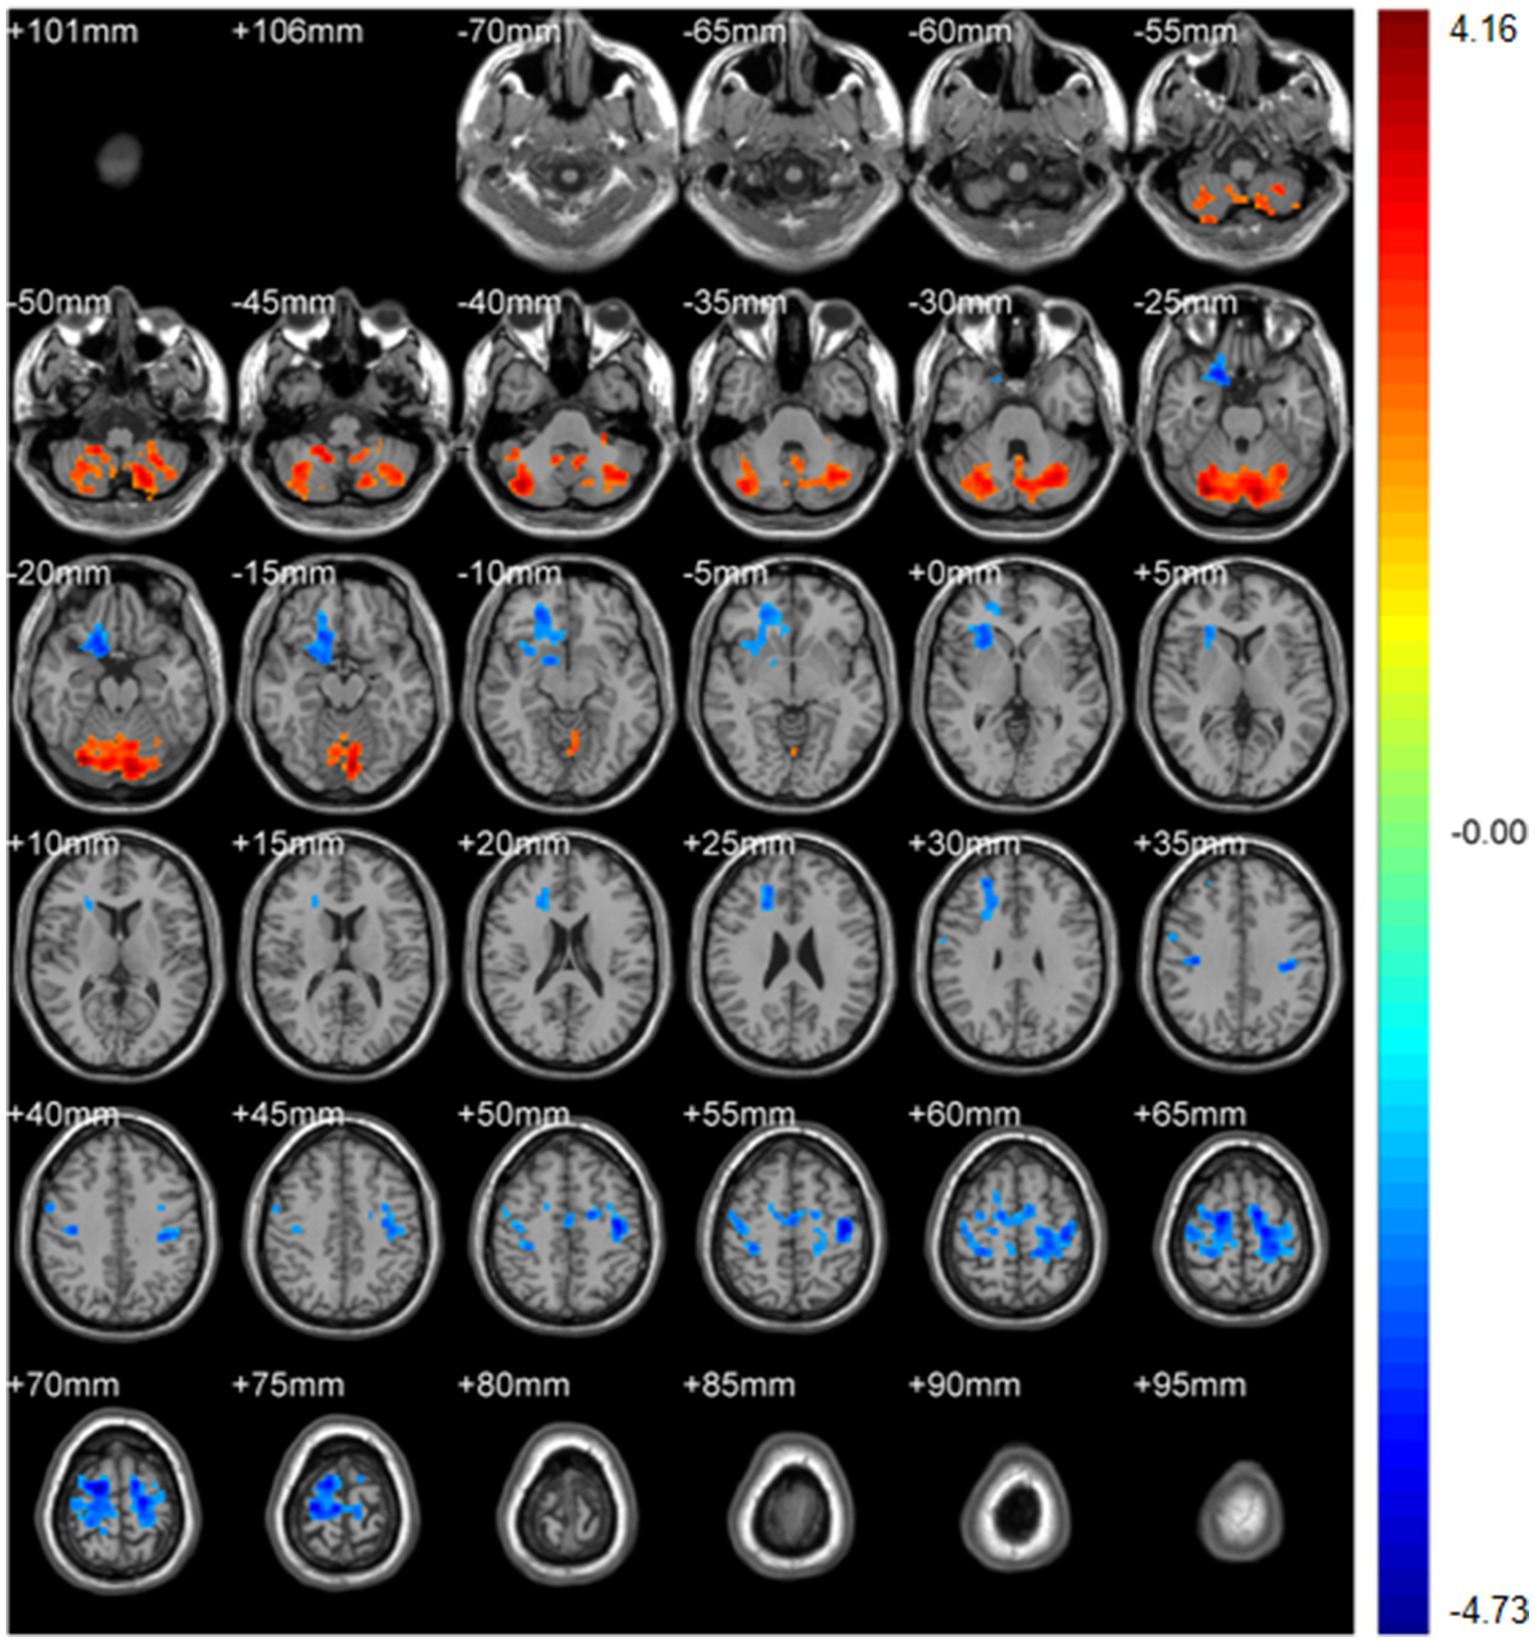
Figure 11. DegreeCentrality(weighted-SzDegreeCentrality). Areas in blue indicate significantly decreased value,areas in red indicate significantly increased value.
Binary-SmDegreeCentrality: left Crus I (MNI 30, −75, −21; cluster = 1,724; t = 3.9172) showed increased degree centrality; right superior orbital frontal gyrus (MNI 21, 21, −27; cluster = 599; t = −3.7685) and left precentral gyrus (MNI 15, −9, 69; cluster = 1,064; t = −4.7716) showed decreased degree centrality.
Binary-SzDegreeCentrality: left Crus I (MNI 30, −75, −24; cluster = 1,171; t = 4.2187) and right Angular gyrus (MNI 42, −54, 54; cluster = 781; t = 3.6977) showed increased degree centrality; right Putamen (MNI 21, 21, −27; cluster = 1,021; t = −3.9621), left inferior orbital frontal gyrus (MNI − 21, 18, −24; cluster = 594; t = −3.8329) and left precentral gyrus (MNI 15, −9, 69; cluster = 1,277; t = −4.8323) showed decreased degree centrality.
Weighted-SmDegreeCentrality: left Crus I (MNI 30, −75, −24; cluster = 1,250; t = 3.8040) showed increased degree centrality; right superior orbital frontal gyrus (MNI 21, 21, −27; cluster = 690; t = −3.8201) and left precentral gyrus (MNI 18, −9, 69; cluster = 1,037; t = −4.6758) showed decreased degree centrality.
WeightedSzDegreeCentrality: left Crus I (MNI − 6, −81, −18; cluster = 1,947; t = 4.1556) showed increased degree centrality; right superior orbital frontal gyrus (MNI 21, 21, −27; cluster = 732; t = −3.7573) and left precentral gyrus (MNI 18, −9, 69; cluster = 1,633; t = −4.7346) showed decreased degree centrality.
4 Discussion
Across complementary resting-state metrics—regional activity (mALFF/zALFF), local synchrony (ReHo), pairwise coupling (seed-based FC), and graph metrics (degree centrality, DC)—patients with spinal diseases–related pain exhibit a coherent reorganization of the sensorimotor–thalamo–cerebellar system. Convergent evidence indicates (i) down-regulation within S1/M1, reflected by lower ALFF/zALFF, reduced ReHo, diminished DC, and weaker intra-sensorimotor FC; and (ii) up-weighting of cerebellar nodes, including increased ALFF/zALFF in Cerebellum lobule IX and consistently elevated DC in Crus I/II across binary and weighted thresholds. Beyond the primary motor system, reduced coupling with superior temporal gyrus, calcarine/cuneus, and precuneus/DMN suggests broader consequences for auditory–temporal integration, early visual processing, and default-mode subsystems. Laterality was modest overall in the network-level synthesis, though the voxelwise analyses highlight pronounced right lobule IX hyperactivity (ALFF t = 4.84) and left Crus I hyperconnectivity (DC peak t = 4.22), nominating postcentral and cerebellar clusters as hubs in a shift from cortical sensorimotor dominance toward cerebellar–subcortical coordination.
The combined pattern is compatible with sensorimotor dysrhythmia and compensatory gating models in chronic pain. The dual-mode cerebellar signature suggests subregional dissociation: lobule IX may contribute to more direct nociceptive integration (34), whereas Crus I appears to participate in compensatory network reorganization via enhanced thalamo-cortical coupling (35). These observations align with literature on cerebellar involvement in pain anticipation (36) and descending modulatory control (37). The prefrontal findings indicate functional segregation within medial PFC, with anterior (t = 4.28) versus posterior (t = 4.10) subregions showing differential activation that plausibly map onto the affective (38) and cognitive-evaluative (39) dimensions of pain, respectively, and thus motivate subregion-specific modulation strategies. Meanwhile, the preserved thalamic coupling (e.g., left thalamus t = 4.94) in the context of cortical hypoactivity is consistent with roles proposed for central sensitization (40) and enhanced nociceptive relay (41). Notably, age effects were negligible in these data, in keeping with reports of minimal association between age and clinical pain perception in similar cohorts (42, 43), suggesting the observed signatures are primarily symptom-related rather than age-driven.
Together, these results nominate cerebellar Crus I/II and sensorimotor–thalamic loops as testable targets for neuromodulation or rehabilitation. In particular, Crus I/II DC and cerebello–S1/M1 FC emerge as plausible network-level readouts for patient stratification and treatment monitoring. The observed prefrontal subspecialization further implies subregion-specific stimulation or neurofeedback protocols tailored to affective versus cognitive pain components.
Limitations: This work is retrospective with a modest sample size, limiting causal inference and external generalizability. Clinical heterogeneity (spinal pathology, medication, pain duration/treatment history) may introduce variance beyond modeled covariates. Results are group-level and not individually predictive. Graph metrics such as DC can be sensitive to thresholding and pipeline parameters; although convergence across binary and weighted thresholds increases confidence, absolute DC values warrant cautious interpretation. Despite stringent motion controls, residual micromovements and state factors (attention, medication) cannot be fully excluded. Finally, the absence of behavioral correlations (sensorimotor performance, detailed pain phenotyping) constrains mechanistic claims.
Future directions: Prospective, phenotype-stratified and longitudinal cohorts with harmonized acquisition and open, standardized pipelines should test the stability, specificity, and prognostic value of these signatures. Interventional designs (neuromodulation, neurofeedback, targeted rehabilitation) can probe causality by tracking Crus I/II DC and cerebello–sensorimotor FC as mechanistic endpoints alongside clinical outcomes. Multimodal integration (structural, diffusion, and task paradigms) and behavioral anchoring will be essential to refine theranostic utility.
5 Conclusion
Patients with spinal diseases–related pain show a reproducible, multimodal reconfiguration of resting-state networks: down-regulation of primary sensorimotor cortices and up-weighting of cerebellar nodes (lobule IX, Crus I/II), with strengthened cerebello–sensorimotor and thalamo-cortical coupling and reduced interactions with temporal, occipital, and precuneus/DMN regions. Prefrontal subspecialization further suggests altered evaluative–affective control. While associative, this coherent signature refines the central phenotype as a shift of network load toward cerebellar–subcortical loops and nominates cerebellar (Crus I/II, lobule IX), thalamic, and S1/M1 circuits as testable targets. Network-level readouts—particularly Crus I/II degree centrality and cerebello–S1/M1 connectivity—warrant prospective evaluation as biomarkers for stratification and treatment monitoring.
Data availability statement
The raw data supporting the conclusions of this article will be made available by the authors, without undue reservation.
Ethics statement
The studies involving humans were approved by Ethical Approval Number: 20240902113233506. The studies were conducted in accordance with the local legislation and institutional requirements. The participants provided their written informed consent to participate in this study. Written informed consent was obtained from the individual(s) for the publication of any potentially identifiable images or data included in this article.
Author contributions
JZ: Data curation, Writing – review & editing. NW: Supervision, Writing – review & editing. L-MR: Investigation, Writing – review & editing. XS: Data curation, Validation, Writing – original draft. J-PZ: Data curation, Formal analysis, Writing – review & editing. YZ: Investigation, Methodology, Project administration, Writing – review & editing.
Funding
The author(s) declare that no financial support was received for the research and/or publication of this article.
Conflict of interest
The authors declare that the research was conducted in the absence of any commercial or financial relationships that could be construed as a potential conflict of interest.
Generative AI statement
The authors declare that no Gen AI was used in the creation of this manuscript.
Any alternative text (alt text) provided alongside figures in this article has been generated by Frontiers with the support of artificial intelligence and reasonable efforts have been made to ensure accuracy, including review by the authors wherever possible. If you identify any issues, please contact us.
Publisher’s note
All claims expressed in this article are solely those of the authors and do not necessarily represent those of their affiliated organizations, or those of the publisher, the editors and the reviewers. Any product that may be evaluated in this article, or claim that may be made by its manufacturer, is not guaranteed or endorsed by the publisher.
References
1. GBD 2017 Disease and Injury Incidence and Prevalence Collaborators. Global, regional, and national incidence, prevalence, and years lived with disability for 354 diseases and injuries for 195 countries and territories, 1990–2017: a systematic analysis for the global burden of disease study 2017. Lancet. (2018) 392:1789–858. doi: 10.1016/S0140-6736(18)32279-7
2. Webers, C, Grimm, S, van Tubergen, A, van Gaalen, F, van der Heijde, D, Joore, M, et al. The value of correctly diagnosing axial spondyloarthritis for patients and society. Semin Arthritis Rheum. (2023) 62:152242. doi: 10.1016/j.semarthrit.2023.152242
3. van Gaalen, FA, and Rudwaleit, M. Challenges in the diagnosis of axial spondyloarthritis. Best Pract Res Clin Rheumatol. (2023) 37:101871. doi: 10.1016/j.berh.2023.101871
4. Knezevic, NN, Candido, KD, Vlaeyen, JWS, Van Zundert, J, and Cohen, SP. Low back pain. Lancet. (2021) 398:78–92. doi: 10.1016/S0140-6736(21)00733-9
5. Mayoral Rojals, V, Canós Verdecho, Á, and Soler López, BThe Team Duo. Assessment of the management of patients with chronic pain referred to a specialized pain unit: a cross-sectional multicenter study (the DUO project). J Clin Med. (2022) 11:3586. doi: 10.3390/jcm11133586
6. Attal, N, Bouhassira, D, and Colvin, L. Advances and challenges in neuropathic pain: a narrative review and future directions. Br J Anaesth. (2023) 131:79–92. doi: 10.1016/j.bja.2023.04.021
7. Kirnaz, S, Capadona, C, Lintz, M, Kim, B, Yerden, R, Goldberg, JL, et al. Pathomechanism and biomechanics of degenerative disc disease: features of healthy and degenerated discs. Int J Spine Surg. (2021) 15:10–25. doi: 10.14444/8052
8. Tang, SN, Walter, BA, Heimann, MK, Gantt, CC, Khan, SN, Kokiko-Cochran, ON, et al. In vivo mouse intervertebral disc degeneration models and their utility as translational models of clinical discogenic back pain: a comparative review. Front Pain Res. (2022) 3:894651. doi: 10.3389/fpain.2022.894651
9. Yan, J, Wu, LG, Zhang, M, Fang, T, Pan, W, Zhao, JL, et al. miR-328-5p induces human intervertebral disc degeneration by targeting WWP2. Oxidative Med Cell Longev. (2022) 2022:3511967. doi: 10.1155/2022/3511967
10. Baliki, MN, Petre, B, Torbey, S, Herrmann, KM, Huang, L, Schnitzer, TJ, et al. Corticostriatal functional connectivity predicts transition to chronic back pain. Nat Neurosci. (2012) 15:1117–9. doi: 10.1038/nn.3153
11. Hashmi, JA, Baliki, MN, Huang, L, Baria, AT, Torbey, S, Hermann, KM, et al. Shape shifting pain: chronification of back pain shifts brain representation from nociceptive to emotional circuits. Brain. (2013) 136:2751–68. doi: 10.1093/brain/awt211
12. Seminowicz, DA, Wideman, TH, Naso, L, Hatami-Khoroushahi, Z, Fallatah, S, Ware, MA, et al. Effective treatment of chronic low back pain in humans reverses abnormal brain anatomy and function. J Neurosci. (2011) 31:7540–50. doi: 10.1523/JNEUROSCI.5280-10.2011
13. Menon, V. 20 years of the default mode network: a review and synthesis. Neuron. (2023) 111:2469–87. doi: 10.1016/j.neuron.2023.04.023
14. Kong, J, Spaeth, RB, Wey, HY, Cheetham, A, Cook, AH, Jensen, K, et al. S1 is associated with chronic low back pain: a functional and structural MRI study. Mol Pain. (2013) 9:43. doi: 10.1186/1744-8069-9-43
15. Worsley, KJ, Liao, CH, Aston, J, Petre, V, Duncan, GH, Morales, F, et al. A general statistical analysis for fMRI data. NeuroImage. (2002) 15:1–15. doi: 10.1006/nimg.2001.0933
16. Calhoun, VD, Adali, T, Pearlson, GD, and Pekar, JJ. A method for making group inferences from functional MRI data using independent component analysis. Hum Brain Mapp. (2001) 14:140–51. doi: 10.1002/hbm.1048
17. Loggia, ML, Chonde, DB, Akeju, O, Arabasz, G, Catana, C, Edwards, RR, et al. Evidence for brain glial activation in chronic pain patients. Brain. (2015) 138:604–15. doi: 10.1093/brain/awu377
18. Uğurbil, K. Development of functional imaging in the human brain (fMRI); the University of Minnesota experience. NeuroImage. (2012) 62:613–9. doi: 10.1016/j.neuroimage.2012.01.135
19. Wang, C, Pan, Y, Zhang, W, Zhao, H, Liu, S, Xu, Y, et al. Positive regulatory domain I-binding factor 1 mediates peripheral nerve injury-induced nociception in mice by repressing Kv4.3 channel expression. Anesthesiology. (2021) 134:435–56. doi: 10.1097/ALN.0000000000003654
20. Edison, P. Brain connectivity: a journal of clinical neurology, neuroscience, & neuroimaging advancing the field of neurology. Brain Connect. (2022) 12:847–9. doi: 10.1089/brain.2022.29043.editorial
21. Wang, Y, and Weng, XC. Progress in functional neuroimaging studies of human skill learning. Adv Psychol Sci. (2003) 11:136–40.
22. Buchbinder, BR. Functional magnetic resonance imaging In: MJ Aminoff, F Boller, and DF Swaab, editors. Handbook of clinical neurology, vol. 135. Amsterdam: Elsevier (2016). 61–92.
23. Zhang, Y, Mao, Z, Pan, L, Ling, Z, Liu, X, Zhang, J, et al. Frequency-specific alterations in cortical rhythms and functional connectivity in trigeminal neuralgia. Brain Imaging Behav. (2019) 13:1497–509. doi: 10.1007/s11682-019-00105-8
24. Fu, Z, Hu, N, Pan, CH, Zhang, J, Wang, XQ, Wang, TH, et al. Advance of functional magnetic resonance imaging in motor function of hand in patients with stroke. Chin J Rehabil Theory Pract. (2015) 21:1277–81.
25. Friston, KJ, Holmes, AP, Poline, JB, Grasby, PJ, Williams, SC, Frackowiak, RS, et al. Analysis of fMRI time-series revisited. NeuroImage. (1995) 2:45–53. doi: 10.1006/nimg.1995.1007
26. Solomon, P, and Davydov, DM. Chronic pain and the brain impairment: introducing a translational neuroscience-based metric. Pain Med. (2016) 17:799–802. doi: 10.1093/pm/pnw024
27. Zou, QH, Zhu, CZ, Yang, Y, Zuo, XN, Long, XY, Cao, QJ, et al. An improved approach to detection of amplitude of low-frequency fluctuation (ALFF) for resting-state fMRI: fractional ALFF. J Neurosci Methods. (2008) 172:137–41. doi: 10.1016/j.jneumeth.2008.04.012
28. Zhao, G, Zhan, Y, Zha, J, Cao, Y, Zhou, F, and He, L. Abnormal intrinsic brain functional network dynamics in patients with cervical spondylotic myelopathy. Cogn Neurodyn. (2023) 17:1201–11. doi: 10.1007/s11571-022-09807-0
29. Jia, XZ, Wang, J, Sun, HY, Zhang, H, Liao, W, Wang, Z, et al. RESTplus: an improved toolkit for resting-state functional magnetic resonance imaging data processing. Sci Bull. (2019) 64:953–4. doi: 10.1016/j.scib.2019.05.008
30. Jia, XZ, Sun, JW, Ji, GJ, Liao, W, Lv, YT, Wang, J, et al. Percent amplitude of fluctuation: a simple measure for resting-state fMRI signal at single voxel level. PLoS One. (2020) 15:e0227021. doi: 10.1371/journal.pone.0227021
31. Zang, Y, Jiang, T, Lu, Y, He, Y, and Tian, L. Regional homogeneity approach to fMRI data analysis. NeuroImage. (2004) 22:394–401. doi: 10.1016/j.neuroimage.2003.12.030
32. Wu, G, Liao, W, Stramaglia, S, Ding, J, Chen, H, and Marinazzo, D. A blind deconvolution approach to recover effective connectivity brain networks from resting-state fMRI data. Med Image Anal. (2013) 17:365–74. doi: 10.1016/j.media.2013.01.003
33. Penny, WD, Friston, KJ, Ashburner, J, Kiebel, S, and Nichols, TE. Statistical parametric mapping: The analysis of functional brain images. Amsterdam: Academic Press (2007).
34. Tedesco, AM, Chiricozzi, FR, Clausi, S, Lupo, M, Molinari, M, and Leggio, MG. The cerebellar cognitive profile. Brain. (2011) 134:3672–86. doi: 10.1093/brain/awr266
35. Dong, F, Yu, L, Lin, F, Feng, P, Wang, C, Zhang, Y, et al. An atlas of neuropathic pain-associated molecular pathological characteristics in the mouse spinal cord. Commun Biol. (2025) 8:70. doi: 10.1038/s42003-025-07506-0
36. Stoodley, CJ, and Schmahmann, JD. Functional topography in the human cerebellum: a meta-analysis of neuroimaging studies. NeuroImage. (2009) 44:489–501. doi: 10.1016/j.neuroimage.2008.08.039
37. Noseda, R, Schain, AJ, and Borsook, D. Cerebro-cerebellar networks in migraine symptoms and headache. Front Pain Res (Lausanne). (2022) 3:1002147. doi: 10.3389/fpain.2022.940923
38. Wiech, K, Kalisch, R, Weiskopf, N, Pleger, B, Stephan, KE, and Dolan, RJ. Anterolateral prefrontal cortex mediates the analgesic effect of expected and perceived control over pain. J Neurosci. (2006) 26:11501–9. doi: 10.1523/JNEUROSCI.2568-06.2006
39. Wiech, K, and Tracey, I. The influence of negative emotions on pain: behavioral effects and neural mechanisms. NeuroImage. (2009) 47:987–94. doi: 10.1016/j.neuroimage.2009.05.059
40. Clarke, S, Rogers, R, Wanigasekera, V, Fardo, F, Pia, H, Nochi, Z, et al. Systematic review and coordinate-based meta-analysis to summarize the utilization of functional brain imaging in conjunction with human models of peripheral and central sensitization. Eur J Pain. (2024) 28:1069–94. doi: 10.1002/ejp.2251
41. Silemek, AC, Chen, H, Sati, P, and Gao, W. The brain’s first “traffic map” through unified structural and functional connectivity (USFC) modeling. Commun Biol. (2024) 7:1477. doi: 10.1038/s42003-024-07160-y
42. Zhou, C, Wang, C, Tian, F, Liu, X, Li, H, Liu, S, et al. The incidence of cervical spondylosis decreases with aging in the elderly, and increases with aging in the young and adult population: a hospital-based clinical analysis. Clin Interv Aging. (2016) 11:47–53. doi: 10.2147/CIA.S93118
Keywords: brain map, spinal diseases related pain, responsible brain region, functional magnetic resonance imaging, brain remodeling
Citation: Zhang J, Wang N, Ren L-M, Sun X, Zhang J-P and Zheng Y (2025) Application of functional magnetic resonance imaging in identifying responsible brain regions associated with spinal diseases related pain. Front. Med. 12:1585799. doi: 10.3389/fmed.2025.1585799
Edited by:
Ashish Diwan, University of New South Wales, AustraliaReviewed by:
Ying Shen, The First Affiliated Hospital of Nanjing Medical University, ChinaPeter Herman, Yale University, United States
Copyright © 2025 Zhang, Wang, Ren, Sun, Zhang and Zheng. This is an open-access article distributed under the terms of the Creative Commons Attribution License (CC BY). The use, distribution or reproduction in other forums is permitted, provided the original author(s) and the copyright owner(s) are credited and that the original publication in this journal is cited, in accordance with accepted academic practice. No use, distribution or reproduction is permitted which does not comply with these terms.
*Correspondence: Xiaopei Sun, c2FyYXBlbm55c3VuQHllYWgubmV0; Jun-Peng Zhang, emhhbmdqdW5wZW5nQHNodXRjbS5lZHUuY24=; Yuehuan Zheng, ZmxpbmdnYWdhQDE2My5jb20=
†ORCID: Xiaopei Sun, orcid.org/0000-0002-3329-0628
Jun-Peng Zhang, orcid.org/0000-0002-1024-9331
Yuehuan Zheng, orcid.org/0000-0002-1811-6111
†These authors have contributed equally to this work