Abstract
Background:
Orofacial clefts (OFCs) are congenital craniofacial malformation caused by embryonic developmental abnormalities, characterized by incomplete fusion of the upper lip and/or palate, leading to feeding difficulties, speech impairments, and other functional challenges. OFCs represent the most prevalent congenital malformations of oral and maxillofacial region. We aim to characterize disease burden of OFCs across regions and countries, analyze temporal trends from 1990 to 2021, examine relationship with Socio-demographic Index (SDI), explore gender disparities and predict future epidemiological patterns.
Methods:
Utilizing GBD 2021 database for 204 countries/regions, we analyzed age-standardized metrics including disability-adjusted life years (DALYs), prevalence, mortality, incidence, using tools like DisMod-MR 2.1 for Bayesian meta-regression. SDI, calculated from educational attainment, per capita income, and fertility rates (range 0–1), stratified nations into quintiles. Statistical analyses included SDI-burden correlations and future projections using Bayesian age-period-cohort (BAPC) modeling, implemented through R software.
Results:
In 2021, there are a total of 4124006.8 cases of OFCs worldwide, with an age-standardized prevalence rate (ASPR) of 53.4 per 100,000 (95% UI: 43–64). The age-standardized incidence rate (ASIR) was 3.0 per 100,000 (95% UI: 2.2–3.9), while age-standardized deaths rate (ASDR) of 0 per 100,000 (95% UI: 0–0.1). Additionally, age-standardized DALYs rate was 5.8 per 100,000 (95% UI: 3.5–9.8). Regionally, low- to middle-SDI regions demonstrated the highest ASPR and ASIR, whereas low-SDI areas showed the most severe ASDR and DALYs rate. In contrast, high-SDI regions consistently exhibited the lowest burden across all metrics. At the subregional level, South Asia recorded the greatest ASPR, while Central Asia had the peak ASIR. Oceania displayed the highest ASDR and DALYs rate. Country-specific analysis identified Palestine with the maximum ASPR, Kazakhstan with the highest ASIR, Papua New Guinea with the greatest ASDR, and Afghanistan with the most elevated DALYs rate.
Conclusion:
The global OFCs burden demonstrated consistent decline from 1990–2021, with persistent male predominance. Regional disparities correlate strongly with SDI, particularly affecting Central Asia, South Asia, and Africa populations.
Introduction
Orofacial clefts (OFCs) is the most prevalent congenital maxillofacial malformation (1), which with both genetic and environmental etiological factors implicated in their pathogenesis. The embryological basis of OFCs formation occurs during critical facial morphogenesis (weeks 4–12 of gestation) (2), when pathogenic genetic variations in multiple genes disrupt essential signaling pathways such as BMP, TGF-β, and WNT, affecting facial development during this stage and causing the occurrence of OFCs. In addition, advanced maternal age or early pregnancy with viral infections, consanguinity, ionizing radiation, and environmental pollutants, deficiencies in folate and vitamins, use of antiepileptic drugs and steroids, maternal metabolic disorders, endocrine abnormalities, parental occupational pesticide exposure, lifestyle factors can increase the likelihood of OFCs (3–12).
OFCs are clinically categorized into two primary subtypes: syndromic forms (co-occurring with additional congenital defects such as cardiac or limb abnormalities) and non-syndromic isolated cases. The treatment of OFCs involves primary lip/palate repair, secondary alveolar bone grafting, orthodontic intervention, orthognathic surgery, respiratory and pronunciation training, otolaryngology treatment, which requires collaboration among disciplinary teams (such as oral and maxillofacial surgery, orthodontics, speech therapists, etc.) (13) and treatment protocols must be carefully staged according to the patient’s developmental stage. A complete treatment requires substantial financial resources and prolonged treatment duration (14).
At the physiological level, patients with OFCs frequently experience oral dysfunction, including impaired sucking ability leading to feeding difficulties, cleft palate leading to coughing and otitis media risks, speech impairments affecting approximately 70% of cases. Psychologically, patients are prone to developing feelings of inferiority due to differences in appearance, while long-term psychological stress may predispose patients to anxiety, depression and other mood disorders. Research further indicates that patients with OFCs have lower average academic achievement, particularly those with cleft palate (15–17). Additionally, the condition imposes socioeconomic constraints by limiting career options (e.g., broadcasting, flight attendant, etc.) and barriers to professional advancement (18).
Previous studies have found that the disease burden of OFCs is related to subject characteristics, such as gender, region, social development level (2, 19), but there is a lack of comprehensive and specific description and analysis. This study analyzes data from GBD database with the aim of obtaining a detailed, quantitative, comprehensive understanding of the disease burden of OFCs, and making predictions on its development trend at the global level. We hope to provide some reference for reducing the disease burden in different regions.
Method
Data sources
Data is sourced from GBD database (2021), which is a global health research platform supported by Institute for Health Metrics and Evaluation (IHME) at the University of Washington, and jointly maintained by World Health Organization (WHO), the World Bank, and other institutions. It covers the health data of 204 nations and territories worldwide since 1990, quantifies 87 risk factors and 371 diseases, meanwhile providing standardized indicators such as age standardized rate (ASR) multi-dimensionally classified such as age, gender, and year. The GBD 2021 study applies complex statistical models such as MR-BRT, DisMod MR 2.1, CODEm, etc. to adjust the collected data from around the world to reduce its heterogeneity. We obtained processed data (prevalence, incidence, deaths, and DALYs) for all regions and countries from the GBD 2021 study for secondary analysis.
SDI
SDI serves as a composite metric for assessing regional socioeconomic development status. This index, ranging from 0 (minimal development) to 1 (optimal development), is derived from three weighted components: gross domestic product per capita, educational attainment (measured by average schooling years), and fertility rates. Based on their SDI scores, geographical units were stratified into five distinct development tiers (high, high-middle, middle, low-middle, low). The focus of this study is on relation between SDI values and various disease burden indicators.
Statistical analyses
Disease burden metrics selected for this study comprise four principal indicators: “Prevalence,” “Incidence,” “Deaths” and “DALYs.” ASR adjusts crude rate (including incidence rate and mortality) by applying a standardized population distribution. This methodological approach effectively eliminates potential biases arising from differences in population age distributions between regions or across time periods. The ASR per 100,000 individual is computed according to equation below: ×100,000 (ai: the ith age category’s rate in specific age range; w: corresponding ith age group’s population size within reference population; A: total count of group). From GBD database, age-standardized death rate (ASDR), age-standardized prevalence rate (ASPR), age-standardized DALYs rate, and age-standardized incidence rate (ASIR).
The temporal trends of ASR were quantified with estimated annual percentage change (EAPC). The computational approach involves fitting the model: ln(yt) = α + βt + ϵ (yt is the natural logarithm of ASR; α is the intercept; β captures the temporal slope coefficient; ϵ accounts for random variation). The EAPC value is subsequently calculated as 100 × [exp(β)−1]. Linear regression model is applied for calculation on 95% confidence interval (CI) of EAPC. If the lower bounds of EAPC with its entire 95%CI are both positive, it indicates a significant upward trend in ASR. On the contrary, if the upper bounds of EAPC and its 95%CI are both negative, it reflects a significant downward trend in ASR. If both conditions are not met, the ASR is defined as stable.
We conducted correlation analysis on the disease burden (ASPR, ASIR, age-standardized DALYs rate, ASDR) and SDI values of all regions and countries, which were performed in R version 4.4.2. We use “cor.test” function from “stats” R package to carry out Pearson correlation analysis. All tests were two-sided with a significance level set at p < 0.05. In addition, we conducted statistical analysis on the disease burden of different genders worldwide using “tbl_summary” function from “gtsummary” R package.
BAPC
The Bayesian age–period–cohort (BAPC) model is an analysis tool based on the Bayesian statistical framework, mainly used to decompose the age, period, and queue effects of disease burden over time, and predict future trends. The statistical principle is based on Bayesian inference, using Markov Chain Monte Carlo (MCMC) or Integrated Nested Laplace Approximation (INLA) algorithms to handle data loss and uncertainty, while introducing prior knowledge to enhance the robustness of small sample data. Compared to traditional models, its advantages lie in the comprehensive analytical ability of multidimensional time effects, robust handling of data sparsity and measurement errors, and flexible integration of multidimensional data. In this study, we applied disease burden data from GBD 2021 and demographic forecast data from the IHME, using the “BAPC” R package to predict the trend of disease burden changes at the global level.
Result
Global level
Global prevalence of OFCs reached 4,124,006.8 cases (95%UI: 3,318,692.5–5,026,199.6) in 2021, representing a 40.3% increase from 1990 (2,937,706.5 cases, 95% UI: 2,389,357.8–3,535,593.7). Despite this substantial growth in case number, ASPR in 2021 remained nearly unchanged at 53.4 per 100,000 (95% UI: 43–65), comparable to the 1990 ASPR of 53.5 (95% UI: 43.4–64.5). EAPC of ASPR was −0.04 (95% CI: −0.05 to −0.02) (Table 1; Figure 1). Global incidence of OFCs in 2021 was 183,302.4 cases (95%UI: 135,255.4–241,690.8), marking a 24.79% decrease from 1990. ASIR declined from 3.8 per 100,000 (95% UI: 2.8–4.8) in 1990 to 3.0 per 100,000 (95% UI: 2.2–3.9) in 2021. EAPC for ASIR was −0.89 (95% CI: −0.94 to −0.83), suggesting a persisting downward trend in incidence (Table 1; Figure 1). OFCs-related deaths were estimated at 1,718.6 cases (95% UI: 484.8–4,409.5) in 2021, reflecting an 86.09% reduction compared to 1990, with an EAPC of −6.17 (95% CI: −6.24 to −6.11) (Table 1; Figure 1). Global DALYs attributed to OFCs reached 408,775.3 (95% UI: 252,320.1–671,119.9) in 2021, showing a 68.32% decrease from 1990. The age-standardized DALYs rate stood at 5.8 per 100,000 (95% UI: 3.5–9.8), with an EAPC of −4.13 (95% CI: −4.28 to −3.98) (Table 1; Figure 1).
Table 1
| Location | 1990 | 2021 | EAPC_95%CI | ||
|---|---|---|---|---|---|
| Number | ASR | Number | ASR | ||
| Prevalence | |||||
| Global | 2937706.5 (2389357.8–3535593.7) | 53.5 (43.4–64.5) | 4124006.8 (3318692.5–5026199.6) | 53.4 (43–65) | −0.04 (−0.05 to −0.02) |
| High SDI | 290059.3 (236919.9–349,088) | 34.5 (28.3–41.3) | 343810.2 (275876.4–419985.2) | 33.6 (27–40.6) | −0.23 (−0.29 to −0.16) |
| High-middle SDI | 421007.6 (343062.6–503601.7) | 40.4 (32.9–48.3) | 436311.1 (356149.1–530335.5) | 36.2 (29.6–43.5) | −0.46 (−0.52 to −0.39) |
| Middle SDI | 865024.7 (699926–1041409.4) | 49 (39.6–59.1) | 1148111.4 (927870.2–1,400,797) | 48.4 (39.2–58.8) | −0.07 (−0.1 to −0.04) |
| Low-middle SDI | 991,187 (790214.7–1209512.2) | 81.7 (64.6–99.9) | 1470278.2 (1169396.5–1805705.6) | 76.3 (60.7–93.6) | −0.23 (−0.25 to −0.22) |
| Low SDI | 368724.4 (296834.5–446,755) | 68.9 (55–83.8) | 722,909 (583611.3–879494.8) | 62.8 (50.5–76.8) | −0.29 (−0.32 to −0.26) |
| Andean Latin America | 17211.4 (13884.4–20618.5) | 42.7 (34.3–51.6) | 33534.4 (27121.2–40,759) | 51.1 (41.4–62) | 0.6 (0.54 to 0.65) |
| Australasia | 6162.6 (5215.5–7250.8) | 31.6 (26.8–37) | 8317.2 (6674.3–10154.6) | 28.6 (22.9–34.6) | −0.28 (−0.31 to −0.24) |
| Caribbean | 11081.1 (8958.3–13239.6) | 30.7 (24.7–36.9) | 21561.2 (17052.5–26,692) | 46.2 (36.6–57) | 1.63 (1.54 to 1.72) |
| Central Asia | 66348.4 (53898.9–78498.1) | 91.7 (74.3–109.5) | 76835.2 (62046.7–92647.7) | 80 (64.6–96.4) | −0.45 (−0.51 to −0.39) |
| Central Europe | 41791.8 (34048.2–49369.6) | 34.9 (28.4–41) | 30463.8 (24477.3–36896.1) | 28.4 (23–34.2) | −0.62 (−0.66 to −0.58) |
| Central Latin America | 80082.1 (65637–95633.8) | 46 (37.8–55.5) | 96,757 (78596.3–117245.7) | 39.1 (31.9–47.3) | −0.52 (−0.55 to −0.48) |
| Central Sub-Saharan Africa | 24064.8 (19126.8–29127.3) | 39.4 (31–48) | 55173.7 (44008.9–68507.1) | 38.3 (30.6–47.8) | −0.03 (−0.06 to 0.01) |
| East Asia | 462829.9 (373116.8–559914.1) | 38.2 (30.8–46.2) | 429540.6 (347839.7–519201.4) | 31.1 (25.5–37.1) | −0.86 (−1.02 to −0.71) |
| Eastern Europe | 69926.1 (56139.6–85059.8) | 32 (25.7–38.8) | 52,313 (41814.6–64112.7) | 26.8 (21.5–32.6) | −0.57 (−0.58 to −0.55) |
| Eastern Sub-Saharan Africa | 110129.2 (88036–132914.8) | 52.5 (41.4–64) | 221976.3 (179210.7–271859.5) | 49.7 (39.8–61.3) | −0.18 (−0.23 to −0.14) |
| High-income Asia Pacific | 91322.8 (74154.6–109,942) | 55.9 (45.3–67) | 90815.2 (71751.2–111736.4) | 52.9 (42.3–64.6) | −0.22 (−0.24 to −0.2) |
| High-income North America | 52229.1 (39822–66060.5) | 19.2 (14.6–24.3) | 68252.3 (52114.7–86705.8) | 19.7 (15.1–24.9) | −0.5 (−0.81 to −0.19) |
| North Africa and Middle East | 317508.8 (256926.6–380861.3) | 89.4 (72–107.5) | 532165.9 (425774.6–646873.5) | 85.2 (68.2–103.5) | −0.11 (−0.15 to −0.08) |
| Oceania | 1764.8 (1396.1–2158.5) | 25.7 (20.3–31.6) | 4786.2 (3804.6–5947.7) | 33.4 (26.3–41.5) | 0.82 (0.78 to 0.86) |
| South Asia | 1134885.4 (893798–1388417.5) | 100.2 (78.7–123.2) | 1633290.6 (1295458.2–2022505.8) | 89.1 (70.7–110.1) | −0.42 (−0.44 to −0.4) |
| Southeast Asia | 137134.4 (110284.9–165525.5) | 28.5 (23–34.6) | 294296.5 (238649.7–359900.3) | 43 (34.9–52.4) | 1.32 (1.24 to 1.4) |
| Southern Latin America | 13501.2 (10784–16292.9) | 27.1 (21.7–32.7) | 16307.1 (12730.3–19984.6) | 25.4 (20–31) | −0.23 (−0.36 to −0.1) |
| Southern Sub-Saharan Africa | 33516.9 (26947.1–40948.2) | 61.1 (48.9–75) | 46724.7 (37840.3–57921.6) | 58.1 (47.1–71.8) | −0.15 (−0.18 to −0.12) |
| Tropical Latin America | 45985.2 (37322.9–55399.5) | 29.7 (24.1–35.8) | 53196.6 (43518.5–63293.2) | 24.1 (19.8–28.7) | −0.64 (−0.82 to −0.47) |
| Western Europe | 110914.7 (92933.7–130198.3) | 30.8 (25.8–35.8) | 106619.5 (86208.2–128179.7) | 26.6 (21.6–31.6) | −0.61 (−0.68 to −0.55) |
| Western Sub-Saharan Africa | 109315.9 (87287.1–132892.3) | 51.6 (41.1–63.4) | 251079.8 (202129.3–306333.6) | 48.2 (38.5–59.2) | −0.16 (−0.2 to −0.12) |
| Incidence | |||||
| Global | 243735.5 (179582.3–309986.2) | 3.8 (2.8–4.8) | 183302.4 (135255.4–241690.8) | 3 (2.2–3.9) | −0.89 (−0.94 to −0.83) |
| High SDI | 19184.2 (14943.5–23,686) | 3.2 (2.5–3.9) | 12250.7 (8958.3–15793.5) | 2.5 (1.8–3.2) | −0.84 (−0.89 to −0.78) |
| High-middle SDI | 35467.7 (27356.6–44190.3) | 4 (3.1–5) | 14891.1 (10856.4–19103.2) | 2.6 (1.9–3.4) | −1.53 (−1.59 to −1.47) |
| Middle SDI | 70,155 (52194.6–89621.5) | 3.5 (2.6–4.5) | 41628.6 (30595.4–54118.8) | 2.7 (2–3.5) | −0.83 (−0.89 to −0.77) |
| Low-middle SDI | 77840.5 (55680.3–103242.8) | 4.2 (3–5.6) | 61922.3 (45962.8–82936.3) | 3.3 (2.5–4.4) | −0.86 (−0.92 to −0.81) |
| Low SDI | 40949.9 (28498.5–53784.9) | 3.9 (2.7–5.1) | 52492.5 (37730.8–70330.4) | 3 (2.2–4.1) | −0.8 (−0.86 to −0.73) |
| Andean Latin America | 2389.1 (1779.9–3030.2) | 4.2 (3.2–5.4) | 2073 (1528.4–2708.1) | 3.5 (2.6–4.6) | −0.86 (−0.95 to −0.77) |
| Australasia | 523.9 (476.5–581.8) | 3.4 (3.1–3.8) | 446 (310.4–596.5) | 2.6 (1.8–3.5) | −0.69 (−0.91 to −0.47) |
| Caribbean | 930.2 (637.9–1,240) | 2.2 (1.5–2.9) | 836.3 (589.8–1178.5) | 2.2 (1.5–3.1) | 0.28 (0.16 to 0.41) |
| Central Asia | 7838.8 (5676.3–9950.7) | 8.3 (6–10.5) | 5026.9 (3489.7–6802.2) | 5.1 (3.6–6.9) | −1.75 (−1.83 to −1.67) |
| Central Europe | 2950.7 (2260.7–3684.6) | 3.6 (2.7–4.5) | 1199.3 (846.9–1582.1) | 2.4 (1.7–3.1) | −1.2 (−1.29 to −1.11) |
| Central Latin America | 9706.6 (7405.6–12225.3) | 4.1 (3.1–5.1) | 4740.3 (3408.8–6221.5) | 2.5 (1.8–3.3) | −1.25 (−1.35 to −1.14) |
| Central Sub-Saharan Africa | 3733.3 (2516.1–4946.6) | 3 (2–4) | 4471.9 (3198.6–6112.9) | 2.1 (1.5–2.9) | −1.27 (−1.33 to −1.21) |
| East Asia | 43150.1 (32544.5–53678.5) | 3.8 (2.8–4.7) | 12,651 (9475.1–16014.8) | 2.3 (1.7–2.9) | −1.72 (−1.92 to −1.52) |
| Eastern Europe | 3774.3 (2719.4–4815.6) | 2.6 (1.9–3.4) | 1586.6 (1121.2–2126.9) | 1.8 (1.3–2.5) | −1.19 (−1.26 to −1.13) |
| Eastern Sub-Saharan Africa | 15197.8 (10377.7–20,427) | 3.5 (2.4–4.7) | 18546.2 (13042.2–25,247) | 2.8 (2–3.8) | −0.66 (−0.8 to −0.52) |
| High-income Asia Pacific | 5042.6 (3779.5–6350.1) | 5.3 (4–6.7) | 2180.6 (1421.8–2947.3) | 3.8 (2.5–5.2) | −1.14 (−1.19 to −1.09) |
| High-income North America | 3937.7 (2830.5–5155.4) | 1.8 (1.3–2.3) | 3367.6 (2357.8–4455.8) | 1.7 (1.2–2.3) | 0.01 (−0.09 to 0.12) |
| North Africa and Middle East | 25886.2 (18883.2–33252.8) | 4.9 (3.6–6.3) | 18033.9 (13630.9–23855.2) | 3.2 (2.4–4.2) | −1.44 (−1.52 to −1.37) |
| Oceania | 138.4 (93.4–197.2) | 1.3 (0.9–1.8) | 299 (211.2–431.2) | 1.5 (1–2.1) | 0.38 (0.3 to 0.46) |
| South Asia | 74558.2 (53276.1–102626.7) | 4.5 (3.2–6.2) | 57043.1 (41548.6–77685.2) | 3.8 (2.7–5.1) | −0.77 (−0.82 to −0.72) |
| Southeast Asia | 13065.7 (9327–17114.9) | 2.2 (1.6–2.9) | 14629.7 (10515.7–19032.5) | 2.7 (1.9–3.5) | 0.67 (0.62 to 0.73) |
| Southern Latin America | 1444.9 (1080.2–1872.5) | 2.8 (2.1–3.7) | 764.4 (519.4–1013.9) | 2.1 (1.4–2.7) | −1.08 (−1.47 to −0.69) |
| Southern Sub-Saharan Africa | 2960.6 (2068.9–4,011) | 3.8 (2.7–5.2) | 2587.4 (1853.9–3470.3) | 3.3 (2.4–4.4) | −0.41 (−0.47 to −0.35) |
| Tropical Latin America | 3782.9 (2986.2–4683.2) | 2.3 (1.9–2.9) | 3344.2 (2530–4235.2) | 2 (1.5–2.6) | −0.18 (−0.3 to −0.05) |
| Western Europe | 7394.4 (6172.4–8535.2) | 3.3 (2.8–3.8) | 4963.5 (3699.8–6228.8) | 2.5 (1.9–3.2) | −0.9 (−0.95 to −0.85) |
| Western Sub-Saharan Africa | 15329.2 (10349.3–20589.2) | 3.6 (2.4–4.8) | 24511.6 (17346.4–33092.8) | 2.9 (2–3.9) | −0.61 (−0.68 to −0.53) |
| Deaths | |||||
| Global | 12353.8 (4489.9–22,917) | 0.2 (0.1–0.4) | 1718.6 (484.8–4409.5) | 0 (0–0.1) | −6.17 (−6.24 to −6.11) |
| High SDI | 140.1 (53.3–265.1) | 0 (0–0) | 6.6 (3.1–11.4) | 0 (0–0) | −8.59 (−8.81 to −8.37) |
| High-middle SDI | 2818.1 (1099.6–5607.2) | 0.3 (0.1–0.6) | 57.2 (30.9–90.8) | 0 (0–0) | −11.62 (−12.12 to −11.11) |
| Middle SDI | 5,193 (2311.3–8942.5) | 0.3 (0.1–0.4) | 238.3 (141.5–360.4) | 0 (0–0) | −9.04 (−9.21 to −8.86) |
| Low-middle SDI | 2952.8 (850.8–7563.3) | 0.2 (0–0.4) | 496.7 (176.9–1068.9) | 0 (0–0.1) | −5.45 (−5.63 to −5.28) |
| Low SDI | 1243.7 (102.7–4732.9) | 0.1 (0–0.5) | 917.2 (110.9–3315.9) | 0.1 (0–0.2) | −2.1 (−2.36 to −1.85) |
| Andean Latin America | 182.6 (87.2–307.8) | 0.3 (0.2–0.6) | 12.6 (7.1–20.1) | 0 (0–0) | −8.73 (−9.03 to −8.43) |
| Australasia | 0.3 (0.2–0.5) | 0 (0–0) | 0.2 (0–0.5) | 0 (0–0) | −3.93 (−9.13 to 1.56) |
| Caribbean | 20.5 (5.1–53) | 0 (0–0.1) | 8.1 (1.7–20.1) | 0 (0–0.1) | −2.45 (−2.56 to −2.34) |
| Central Asia | 27.2 (14.8–51) | 0 (0–0.1) | 9.6 (5.7–16.6) | 0 (0–0) | −4.15 (−4.93 to −3.37) |
| Central Europe | 19.1 (12.2–29.1) | 0 (0–0) | 0.3 (0.1–0.6) | 0 (0–0) | −11.81 (−12.75 to −10.86) |
| Central Latin America | 288.9 (171.3–369.1) | 0.1 (0.1–0.2) | 41.2 (24.2–60.2) | 0 (0–0) | −5.67 (−5.87 to −5.47) |
| Central Sub-Saharan Africa | 80.9 (8–357.2) | 0.1 (0–0.3) | 58.5 (7.2–239.7) | 0 (0–0.1) | −2.33 (−2.9 to −1.76) |
| East Asia | 5997.5 (1999–11610.8) | 0.5 (0.2–1) | 103 (52.1–169.7) | 0 (0–0) | −11.52 (−12.21 to −10.81) |
| Eastern Europe | 29.8 (18.4–43.2) | 0 (0–0) | 2.1 (0.8–3.5) | 0 (0–0) | −7.48 (−8.21 to −6.75) |
| Eastern Sub-Saharan Africa | 455 (44.4–2,137) | 0.1 (0–0.5) | 257 (26.7–1121.5) | 0 (0–0.2) | −2.84 (−3.05 to −2.63) |
| High-income Asia Pacific | 16.6 (6–36.6) | 0 (0–0) | 0.1 (0–0.1) | 0 (0–0) | −16.54 (−17.79 to −15.26) |
| High-income North America | 13.9 (10.3–16.4) | 0 (0–0) | 0.7 (0.3–1) | 0 (0–0) | −7.62 (−8.57 to −6.65) |
| North Africa and Middle East | 1524.4 (517.8–3596.5) | 0.3 (0.1–0.7) | 288.2 (95.3–1051.9) | 0 (0–0.2) | −4.67 (−5.06 to −4.27) |
| Oceania | 37.3 (6.4–101.6) | 0.4 (0.1–1) | 35.1 (6.4–90.6) | 0.2 (0–0.4) | −1.94 (−2.09 to −1.78) |
| South Asia | 2080.2 (252.2–6408.8) | 0.1 (0–0.4) | 252 (41.7–862.6) | 0 (0–0.1) | −6.18 (−6.35 to −6.01) |
| Southeast Asia | 975.2 (444.6–1913.4) | 0.2 (0.1–0.3) | 191.1 (82.8–363.2) | 0 (0–0.1) | −4.98 (−5.05 to −4.91) |
| Southern Latin America | 4 (1.9–8.5) | 0 (0–0) | 0.8 (0.3–1.4) | 0 (0–0) | −5.09 (−5.99 to −4.18) |
| Southern Sub-Saharan Africa | 62.2 (29.5–99.3) | 0.1 (0–0.1) | 36.2 (14.9–65.7) | 0 (0–0.1) | −1.06 (−1.41 to −0.71) |
| Tropical Latin America | 161.1 (112.8–198.6) | 0.1 (0.1–0.1) | 17.9 (11.1–25.3) | 0 (0–0) | −6.17 (−6.65 to −5.68) |
| Western Europe | 27.2 (19.9–33.1) | 0 (0–0) | 1.3 (0.6–2) | 0 (0–0) | −8.76 (−9.84 to −7.68) |
| Western Sub-Saharan Africa | 350 (25.1–1981.4) | 0.1 (0–0.5) | 402.8 (45.7–1900.4) | 0 (0–0.2) | −1.32 (−1.56 to −1.07) |
| DALYs | |||||
| Global | 1290532.6 (590788.8–2246406.8) | 20.8 (9.7–35.8) | 408775.3 (252320.1–671119.9) | 5.8 (3.5–9.8) | −4.13 (−4.28 to −3.98) |
| High SDI | 30744.8 (18908.9–44317.2) | 4.3 (2.5–6.3) | 22030.9 (13635.6–33496.9) | 2.2 (1.4–3.4) | −2.09 (−2.31 to −1.87) |
| High-middle SDI | 279207.1 (124269.2–527212.6) | 31.1 (13.6–59.3) | 32495.7 (21979.2–48008.9) | 3.2 (2.2–4.5) | −8.17 (−8.57 to −7.76) |
| Middle SDI | 519928.6 (260467.9–850007.8) | 26.4 (13.4–42.9) | 92289.2 (65013.8–129542.5) | 4.4 (3.1–6.1) | −6 (−6.22 to −5.79) |
| Low-middle SDI | 325981.7 (132397.4–734145.2) | 19.5 (8.7–42.2) | 134879.5 (88416.2–201658.2) | 7.1 (4.6–10.6) | −3.19 (−3.25 to −3.14) |
| Low SDI | 134026.9 (30708.7–446529.9) | 15.2 (4.7–46.7) | 126685.1 (49746.3–344500.6) | 8.6 (3.9–21.7) | −1.47 (−1.64 to −1.31) |
| Andean Latin America | 17436.4 (9006.3–28478.7) | 32.3 (17.1–52) | 3210.6 (2335.8–4508.4) | 5.1 (3.7–7.1) | −6.01 (−6.44 to −5.59) |
| Australasia | 421 (270.9–627.5) | 2.2 (1.4–3.3) | 550.9 (348.8–839.2) | 1.9 (1.2–2.9) | −0.36 (−0.45 to −0.26) |
| Caribbean | 2,540 (1079.4–5389.4) | 6.2 (2.8–12.9) | 2049.2 (1218–3,329) | 4.7 (2.7–8) | −0.66 (−0.75 to −0.56) |
| Central Asia | 6537.1 (4575.6–9347.1) | 8.2 (5.8–11.8) | 5597.1 (3769.2–8351.8) | 5.8 (3.9–8.6) | −1.34 (−1.51 to −1.17) |
| Central Europe | 4336.3 (3101.5–5967.2) | 4.2 (3–5.8) | 1941 (1198.8–2954.3) | 1.8 (1.2–2.8) | −2.66 (−2.82 to −2.5) |
| Central Latin America | 30895.5 (19981.1–38687.1) | 13.7 (9–17.1) | 9694.7 (6999.8–13400.7) | 4.4 (3.2–5.9) | −3.8 (−3.98 to −3.63) |
| Central Sub-Saharan Africa | 8727.1 (2202.8–33257.7) | 8.5 (2.8–29.6) | 8642.3 (3613.9–24278.8) | 4.8 (2.2–12.1) | −1.52 (−1.88 to −1.17) |
| East Asia | 567452.8 (210661.3–1071789.9) | 49.3 (18.2–93.3) | 36,372 (24862.6–52967.5) | 3.6 (2.4–5.2) | −9.41 (−9.93 to −8.88) |
| Eastern Europe | 7,111 (4966.3–9801.3) | 3.8 (2.6–5.3) | 3537.9 (2200.8–5391.7) | 1.9 (1.3–2.9) | −2.64 (−2.83 to −2.45) |
| Eastern Sub-Saharan Africa | 47522.3 (10182.3–198395.6) | 13.2 (3.8–50.4) | 36,757 (14299.3–113,593) | 6.6 (2.9–18.4) | −1.94 (−2.07 to −1.81) |
| High-income Asia Pacific | 7122.9 (4645.9–10,330) | 5 (3.2–7.6) | 5517.1 (3380.1–8453.6) | 3.3 (2–5.1) | −1.22 (−1.41 to −1.02) |
| High-income North America | 4601.7 (3223.7–6497.1) | 1.8 (1.3–2.5) | 4438.1 (2676.2–6902.9) | 1.3 (0.8–2) | −1.53 (−1.89 to −1.16) |
| North Africa and Middle East | 156136.9 (66577.3–340261.1) | 31.8 (14.5–67.4) | 58524.5 (34890.2–125071.9) | 9.7 (5.7–21.2) | −3.13 (−3.41 to −2.85) |
| Oceania | 3455.6 (674.2–9259.6) | 33.1 (6.9–87.9) | 3446.5 (859–8439.7) | 17.5 (4.8–42.2) | −1.73 (−1.87 to −1.59) |
| South Asia | 256415.1 (82364.5–641525.1) | 17.6 (6.6–41.4) | 122621.6 (76631.1–193338.1) | 6.9 (4.2–11) | −2.99 (−3.07 to −2.92) |
| Southeast Asia | 96169.7 (48892.7–181342.7) | 16.7 (8.7–31.3) | 35296.7 (23249.2–53115.9) | 5.8 (3.7–9) | −3.49 (−3.61 to −3.37) |
| Southern Latin America | 1225.7 (822.3–1797.4) | 2.4 (1.6–3.6) | 1114.1 (711.8–1711.8) | 1.8 (1.2–2.7) | −1.07 (−1.16 to −0.98) |
| Southern Sub-Saharan Africa | 7652.6 (4591.1–10780.2) | 11 (6.9–15.2) | 6,098 (3886.3–8970.3) | 7.7 (4.9–11.4) | −0.7 (−0.92 to −0.48) |
| Tropical Latin America | 17356.4 (12612.5–21039.9) | 10.8 (7.9–13.1) | 4984.9 (3585.1–7008.7) | 2.5 (1.8–3.4) | −4.22 (−4.65 to −3.78) |
| Western Europe | 9400.7 (6764.6–13053.4) | 3 (2.2–4) | 6841.7 (4201.1–10342.1) | 1.7 (1.1–2.6) | −1.57 (−1.82 to −1.32) |
| Western Sub-Saharan Africa | 38015.8 (8145.1–184706.9) | 10.9 (3.2–47.2) | 51539.5 (18210.1–184528.5) | 7.3 (3–23.3) | −0.92 (−1.09 to −0.75) |
Trends in global and regional impact of OFCs: disability-adjusted life years, mortality, incidence, and prevalence (1990–2021).
Figure 1
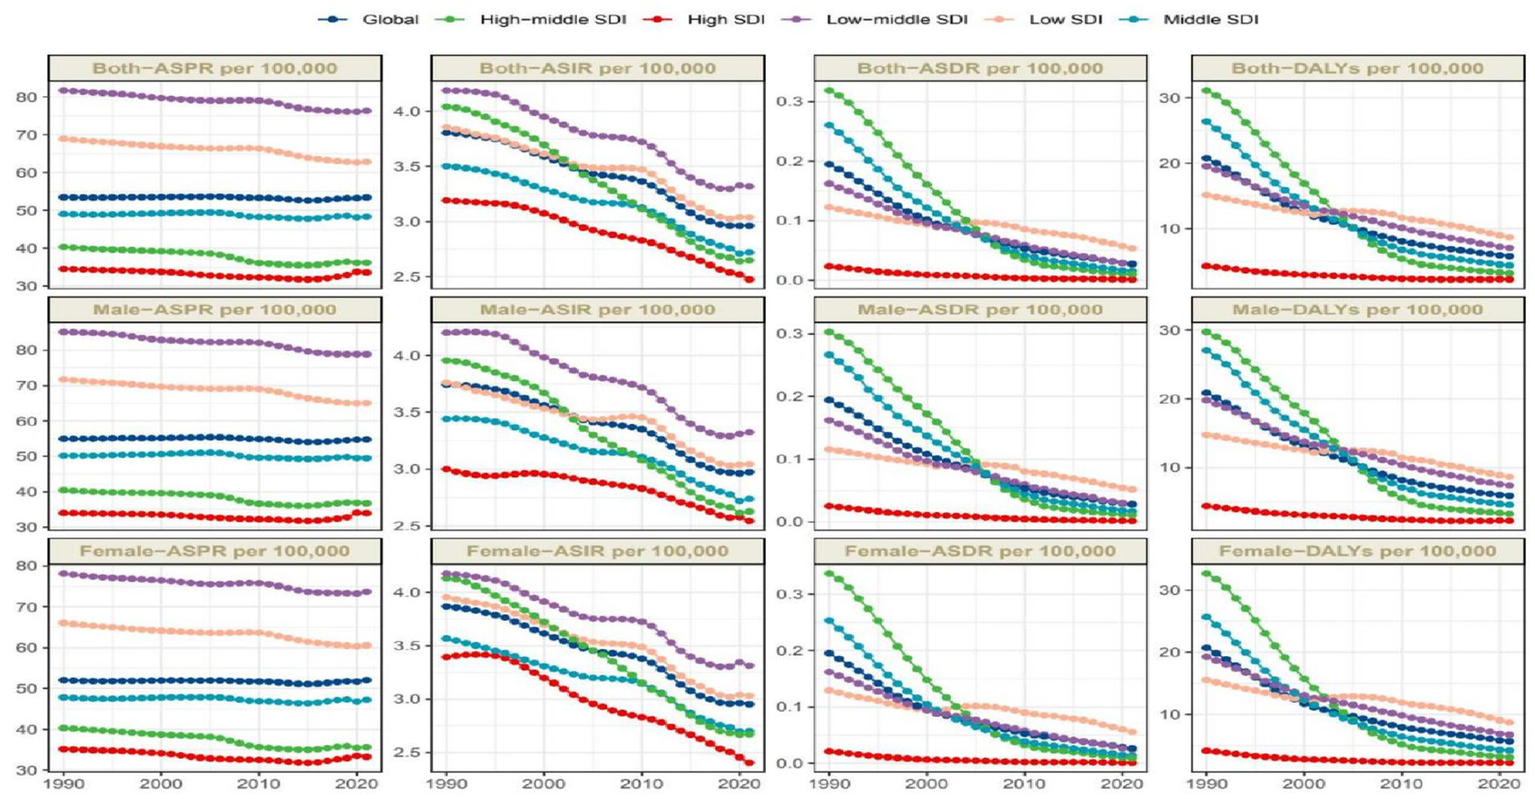
Trends in OFCs disability-adjusted life-years, OFCs prevalence, deaths, and incidence (1990–2021).
Regional level
From the perspective of social development level, OFCs burden worldwide shows notable regional differences, and the disease burden indicators vary greatly among different SDI regions. The ASPR in low-middle SDI regions represented to be the highest, of 76.3 per 100,000 (95% UI: 60.7–93.6), and regions with high SDI reported the lowest, of 33.6 per 100,000 (95% UI: 27–40.6). The EAPC of the two regions is similar, with the former being −0.23 (95% CI: −0.29 to −0.16) and the latter being −0.23 (95% CI: −0.25 to −0.22). ASPR dropped in all regions, with the middle-high SDI region showing the most notable drop, showing EAPC of −0.46 (95% CI: −0.52 to −0.39). ASPR has decreased from 40.4 per 100,000 (95% UI: 32.9–48.3) in 1990 to 36.2 per 100,000 (95% UI: 29.6–43.5) in 2021, indicating more significant progress in the prevention and treatment of OFCs in these regions compared to other areas. The EAPC of the low SDI region is −0.29 (95% CI: −0.32 to −0.26), and its ASPR has decreased from 68.9 per 100,000 (95% UI: 55–83.8) in 1990 to 62.8 per 100,000 (95% UI: 50.5–76.8). The EAPC within middle-SDI region is −0.07 (95% CI: −0.1 to 0.04), which is almost the same as the ASPR in 1990 and 2021 (Table 1; Figure 1).
ASIR also shows regional differences. High SDI regions exhibited the lowest ASIR at 2.5 per 100,000 (95% UI: 1.8–3.2), and middle-low SDI regions showed the highest at 3.3 per 100,000 (95% UI: 2.5–4.4). The analysis of the ASIR reveals notable trends. The EAPC in the high-middle SDI regions is the highest, reaching −1.53 (95% CI: −1.59 to −1.47), while other regions exhibit a more uniform EAPC of around −0.85 (Table 1; Figure 1). The ASDR in low SDI areas is the highest, reaching 0.1 per 100,000 (95% UI: 0–0.2), whereas other regions are nearly at zero. Similarly, the EAPC for high-middle SDI areas is the highest, at −11.62 (95% CI: −12.12 to −11.11) (Table 1; Figure 1). The age-standardized DALYs rate further revealed regional differences. Low SDI regions have the highest DALYs rate at 8.6 per 100,000 (95% UI: 3.9–21.7), while high SDI regions have the lowest at 2.2 per 100,000 (95% UI: 1.4–3.4). Notably, high-middle SDI regions show the most significant decrease in age-standardized DALYs rate, with an EAPC of −8.17 (95% CI: −8.57 to −7.76) (Table 1; Figure 1).
Global data demonstrate a substantial 31-year decline (1990–2021) in OFCs disease burden, primarily attributable to advancements in medical technology and socioeconomic development. High-middle SDI regions exhibited particularly notable progress, reflecting accelerated improvement in therapeutic and preventive capability once society reaches this developmental threshold. Indicators of disease burden in high-SDI regions maintained the lowest level over three decades, due to their well-established superior healthcare infrastructure and social conditions since 1990. Conversely, the paradoxically lower prevalence and incidence rates observed in low-SDI regions are likely attributable to severe underreporting primarily driven by neonatal mortality among untreated cases and systemic gaps in health surveillance systems (20). Despite incremental advancements in low- and low-middle SDI regions, OFCs continues to impose disproportionately heavy health burden in these areas.
From the perspective of geography, the top three regions with the highest ASPR in 2021 are South Asia, North Africa and Middle East, Central Asia, the values are, respectively, 89.1 per 100,000 (95% UI: 70.7–110.1), 85.2 per 100,000 (95% UI: 68.2–103.5), and 80 per 100,000 (95% UI: 64.6–96.4). In contrast, high-income North America had the lowest ASPR at 19.7 per 100,000 (95% UI: 15.1–24.9). ASPR in the Australasia and Europe are significantly lower than those in Asia and Africa. Almost all regions experience a decline in prevalence between 1990 and 2021, except for the four regions: Andean Latin America, East Asia, Caribbean, Southeast Asia, with EAPCs of 1.63 (95% CI: 1.54 to 1.72), 1.32 (95% CI: 1.24 to 1.4), 0.82 (95% CI: 0.78 to 0.86), and 0.6 (95% CI: 0.54 to 0.65), respectively (Table 1). Additionally, we conducted a correlation analysis between ASPR and SDI across varying areas, incorporating changes in SDI from 1990 to 2021. The results are shown in Figure 2. We used distinct shapes and colors to represent different regions and plotted 21 lines based on their SDI changes over this period. The computation outputted negative relation between ASPR and SDI, with a correlation coefficient of −0.34 (95% CI: −0.41 to −0.28) and p-value < 0.001 (Figure 2).
Figure 2
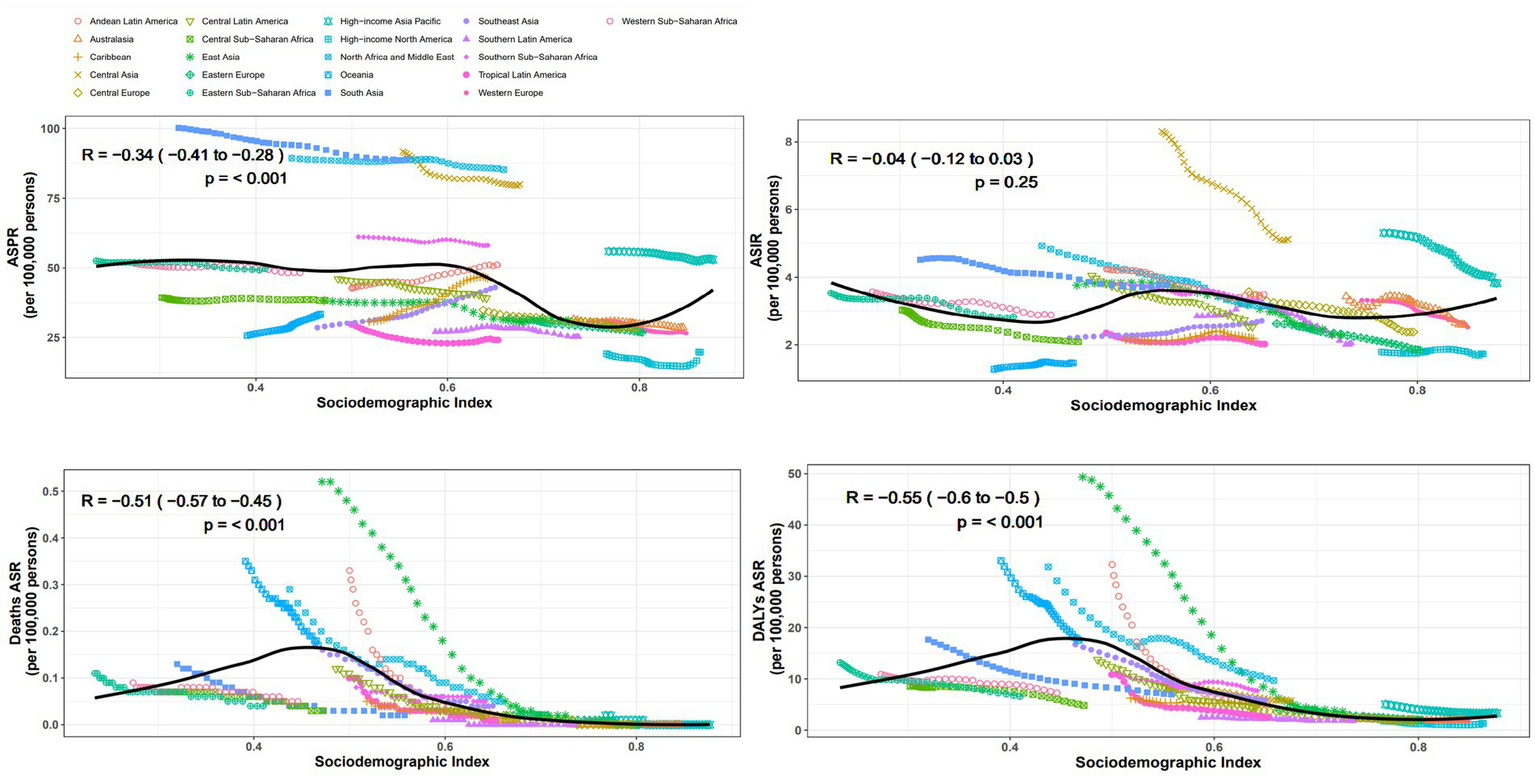
Association between SDI and disease burden indicators for OFCs in 21 regions.
Despite the most significant decline in ASIR in Central Asia over the past 32 years, with an EAPC of −1.75 (95% CI: −1.83 to −1.67), its ASIR still ranks highest at 5.1 per 100,000 (95% UI: 3.6–6.9). South Asia and high-income Asia Pacific follows closely, with rates of 3.8 per 100,000 (95% UI: 2.7–5.1) and 3.8 per 100,000 (95% UI: 2.5–5.2), respectively. The region with the lowest ASIR is Oceania, at 1.5 per 100,000 (95% UI: 1.0–2.1). The regions with positive EAPC values include Southeast Asia Oceania, Caribbean, high-income North America, with values of 0.67 (95% CI: 0.62 to 0.73), 0.38 (95% CI: 0.3 to 0.46), 0.28 (95% CI: 0.16 to 0.41), and 0.01 (95% CI: −0.09 to 0.12), respectively (Table 1). The correlation coefficient between SDI values and ASIR across different regions is −0.04 (95% CI: −0.12 to 0.03), with a p-value of 0.25, indicating no significant correlation (Figure 2).
Oceania has the highest ASDR at 0.2 per 100,000 (95% UI: 0–0.4), while in other regions the value is around zero. During the 32 years, ASDR has significantly decreased in all regions (Table 1). The correlation coefficient between SDI values and ASDR is −0.51 (95% CI: −0.57 to −0.45), with a p-value of<0.001, indicating a significant correlation (Figure 2).
The top three rates of age-standardized DALYs in 2021 are Oceania, North Africa and Middle East, Southern Sub-Saharan Africa, at 17.5 per 100,000 (95% UI: 4.8–42.2), 9.7 per 100,000 (95% UI: 5.7–21.2), and 7.7 per 100,000 (95% UI: 4.9–11.4), respectively. High-income North America has the lowest rate at 1.3 per 100,000 (95% UI: 0.8–2.0). Rates of age-standardized DALYs have dropped within all regions, with East Asia showing the most notable decline, at an EAPC of −9.41 (95% CI: −9.93 to −8.88) (Table 1). The SDI value of each region shows negative relation with rate of age-standardized DALYs, with a correlation coefficient of −0.55 (95% CI: −0.60 to −0.50), p-value < 0.001 (Figure 2).
National level
In 2021, countries with the top three high ASPR were Palestine (147.15 per 100,000, 95% UI: 119.61–176.54), State of Qatar (140.47 per 100,000, 95% UI: 111.24–173.15), and Islamic Republic of Pakistan (136.06 per 100,000, 95% UI: 107.62–169.11), all of which are in Asia. The country with the lowest ASPR is Canada (9.07 per 100,000, 95% UI: 7.15–11.05). Puerto Rico is the country with the most notable elevation in ASPR (EAPC: 2.05, 95% CI: 1.93 to 2.18), while Italy has the most notable decline in ASPR (EAPC: −1.36, 95% CI: −1.55 to −1.17) (Supplementary Table S1; Figure 3A). The fastest elevation in case number is in Qatar, with a 534.2% elevation in case number in 2021, compared to 1990 (Figure 4A). We conducted several correlation analyses between these disease burden indicators and SDI values across different countries. Correlation coefficient between SDI and ASPR is −0.23, showing a negative correlation, with a 95% CI of −0.36 to −0.10 and a p-value < 0.05 (Figure 5).
Figure 3
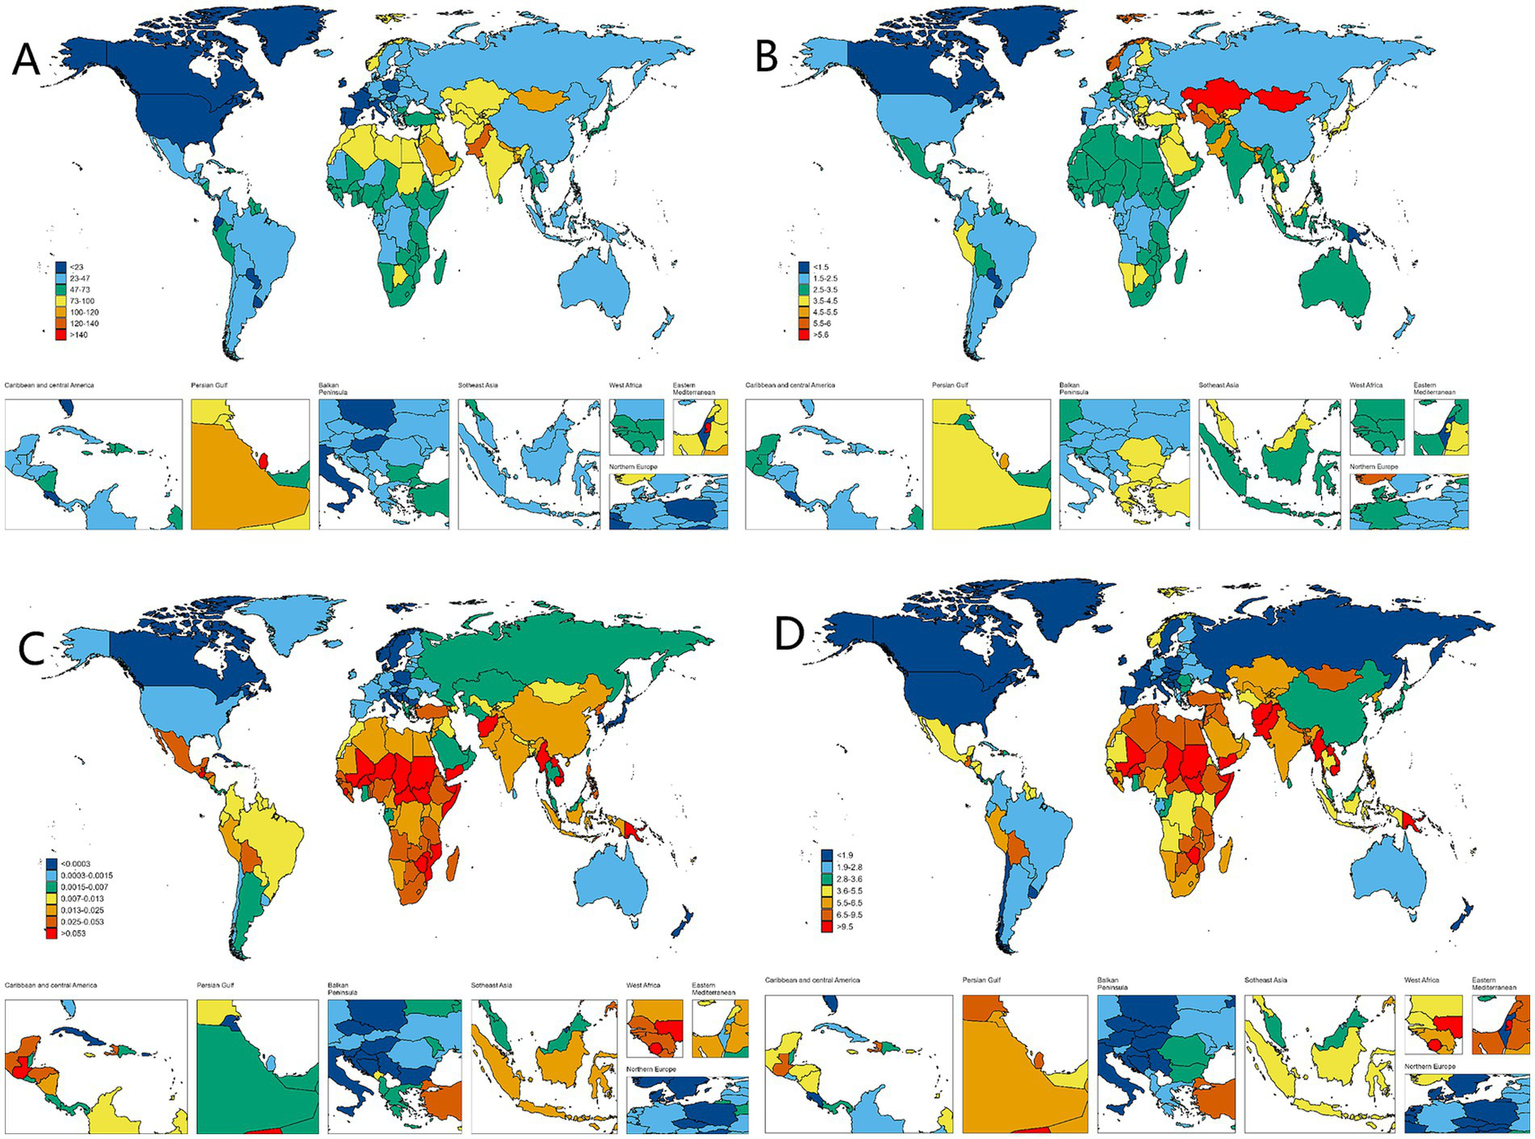
Worldwide health impact of OFCs among both genders across 204 nations and regions. (A) Prevalence rate. (B) Incidence rate. (C) Death rate. (D) DALYs rate.
Figure 4
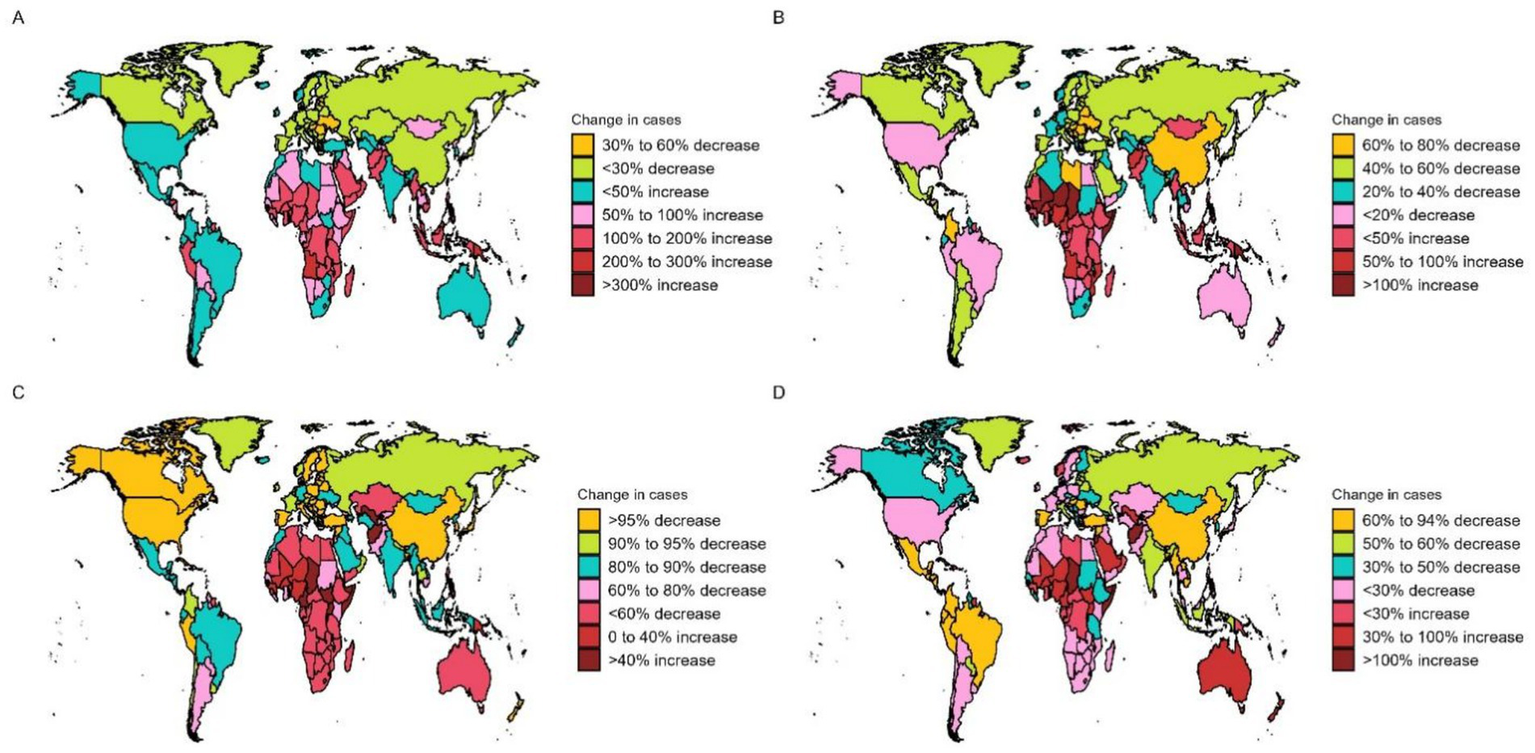
OFCs cases for both genders across 204 nations and regions. (A) Change prevalence cases. (B) Change incidence cases. (C) Change deaths cases. (D) Change DALYs.
Figure 5
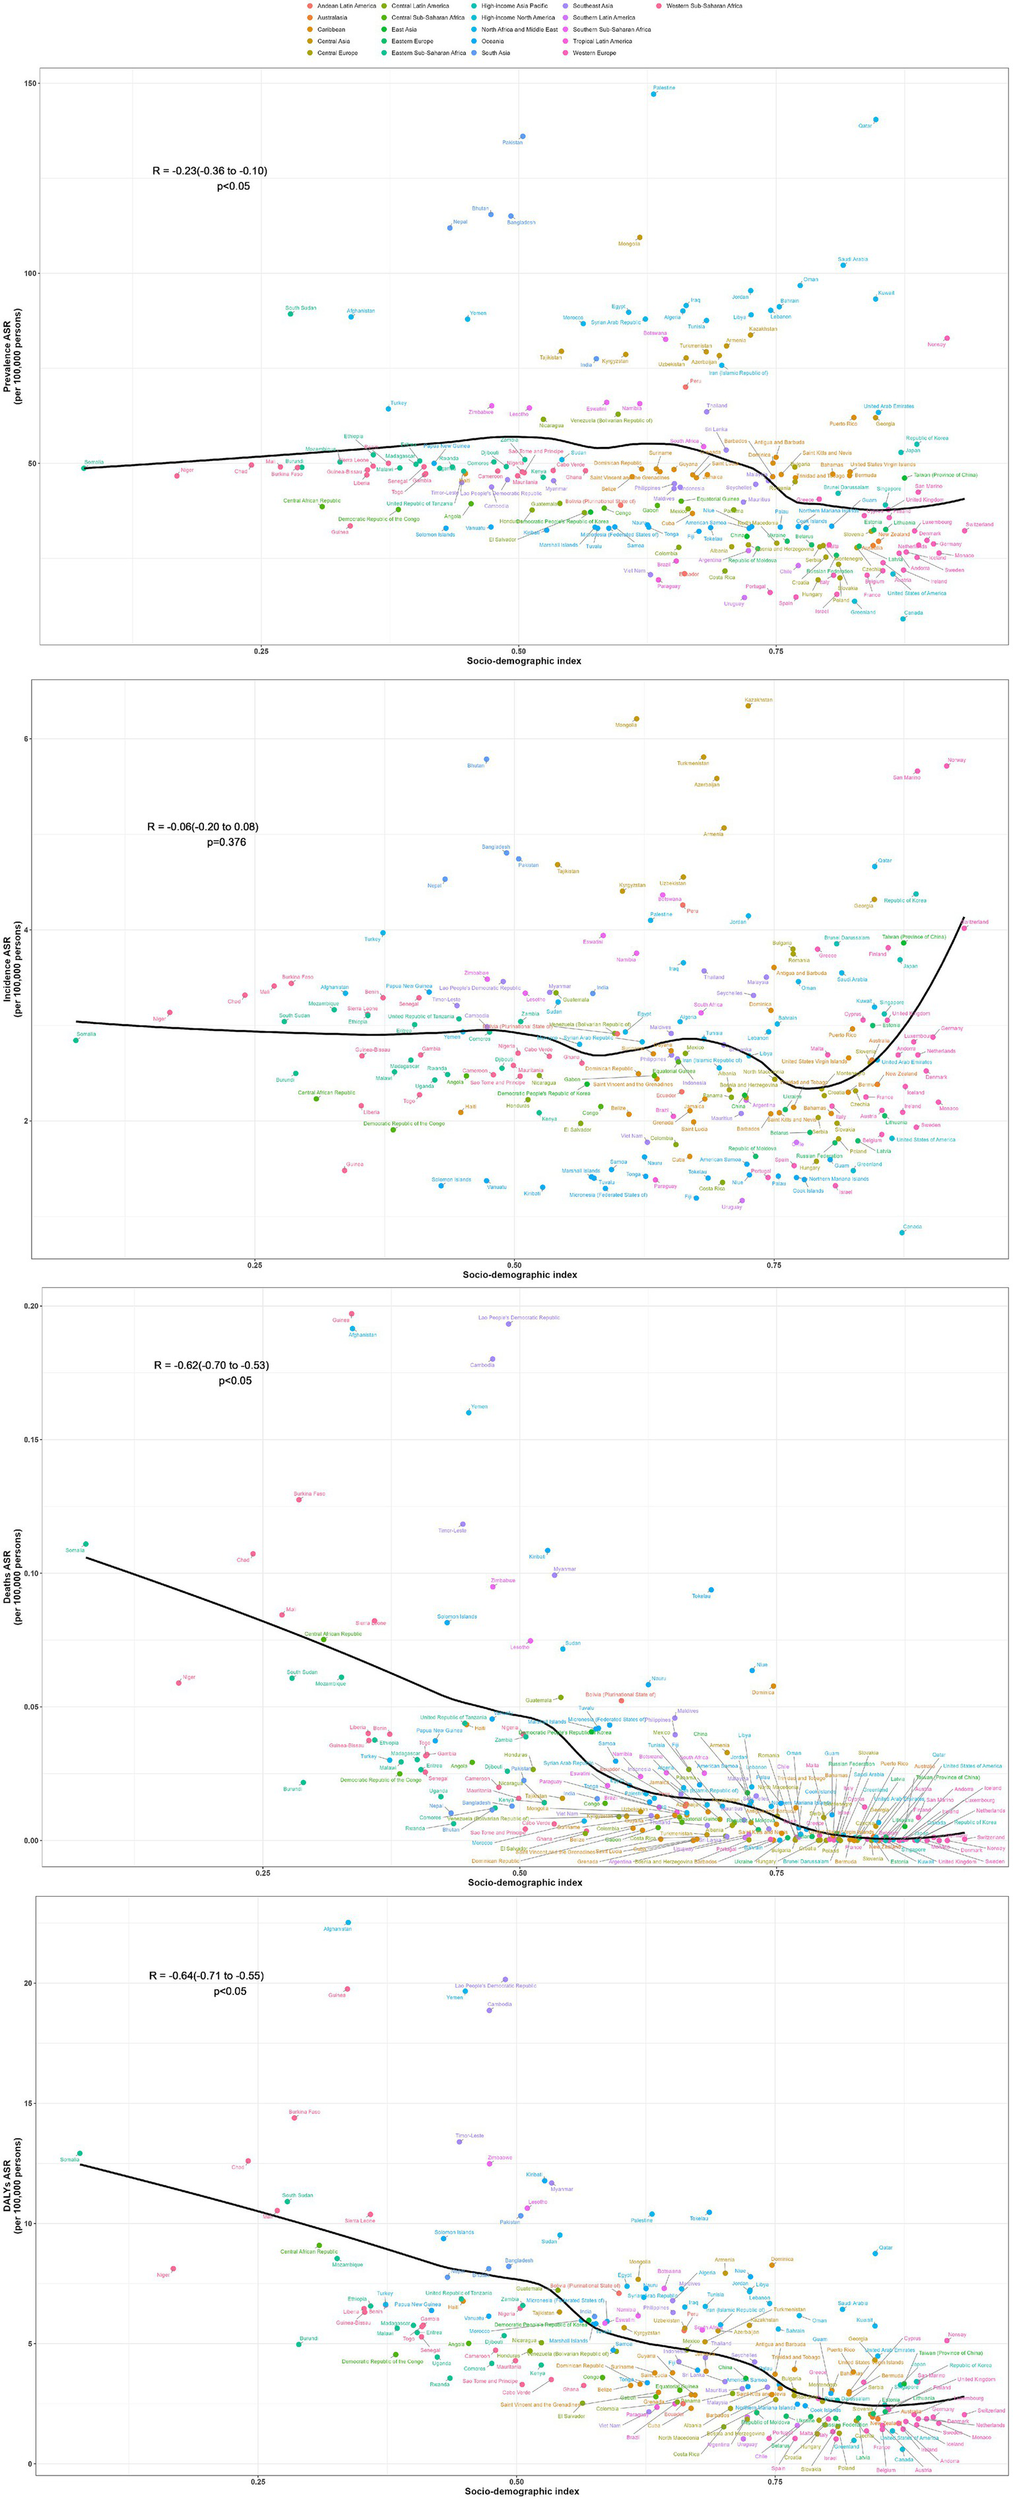
Association between SDI and disease burden indicators for OFCs in 204 countries.
In terms of ASIR, the top-ranked countries are Kazakhstan (6.34 per 100,000, 95% UI: 4.33–8.64), Mongolia (6.21 per 100,000, 95% UI: 4.00–9.25), and Turkey (5.81 per 100,000, 95% UI: 4.09–7.76), all situated in Central Asia. Conversely, Canada has the lowest ASIR at 0.83 per 100,000 (95% UI: 0.58–1.13). The ASIR of Taiwan (Province of China) has seen the most significant increase (EAPC: 2.95% CI: 1.73 to 2.28) (Supplementary Table S2; Figure 3B). Countries experiencing a rapid surge in the number of cases include Qatar, Papua New Guinea, Chad, Niger, Mali, and Somalia, with their incidence rates in 2021 more than doubling compared to 1990 (Figure 4B). The correlation coefficient between SDI values and ASIR is −0.06 (95% CI: −0.20 to 0.08), with a p-value of 0.376, indicating no clear correlation between the two (Figure 5).
Papua New Guinea has the highest ASDR (0.19 per 100,000, 95% UI: 0.04–0.52) (Supplementary Table S3; Figure 3C). Except for a few regions and countries with an increase in ASDR globally (e.g., Afghanistan, Trinidad, and Tobago), there has been significant decreases in ASDR in all others. It can be observed that countries with increased deaths, such as Afghanistan, Chad, Somalia, etc., are mainly located in Sub Saharan Africa and Central Asia (Figure 4C). The correlation coefficient between the SDI values and ASDR is −0.62 (95% CI: −0.70 to −0.53), with p-value <0.05, indicating a significant correlation (Figure 5).
The age-standardized DALYs rate is highest in Afghanistan (22.53 per 100,000, 95% UI: 5.8–104). The fastest decline is in China, with an EAPC of −9.59 and a 95% CI: −10.13 to −9.03 (Supplementary Table S4; Figure 3D). Likewise, the nations experiencing the most substantial increases are predominantly in Sub Saharan Africa and Central Asia (Figure 4D). The correlation coefficient between the SDI values and ASDR is −0.64 (95% CI: −0.71 to −0.55), p-value <0.05(Figure 5).
Gender differences in disease burden
Between 1990 and 2021, trends of OFCs disease burden showed nearly identical patterns between two genders. Male population exhibited higher ASDR, age-standardized DALYs rate, ASPR compared to females, while females exhibited higher ASIR. The disparity in ASPR between genders remained stable, with males maintaining higher ASPR values by 2021. In contrast, ASDR, age-standardized DALYs rate, and ASIR reached comparable levels between males and females by 2021 (Figure 6). Among the four disease burden indicators, only ASPR showed statistically significant gender differences (p < 0.001).
Figure 6
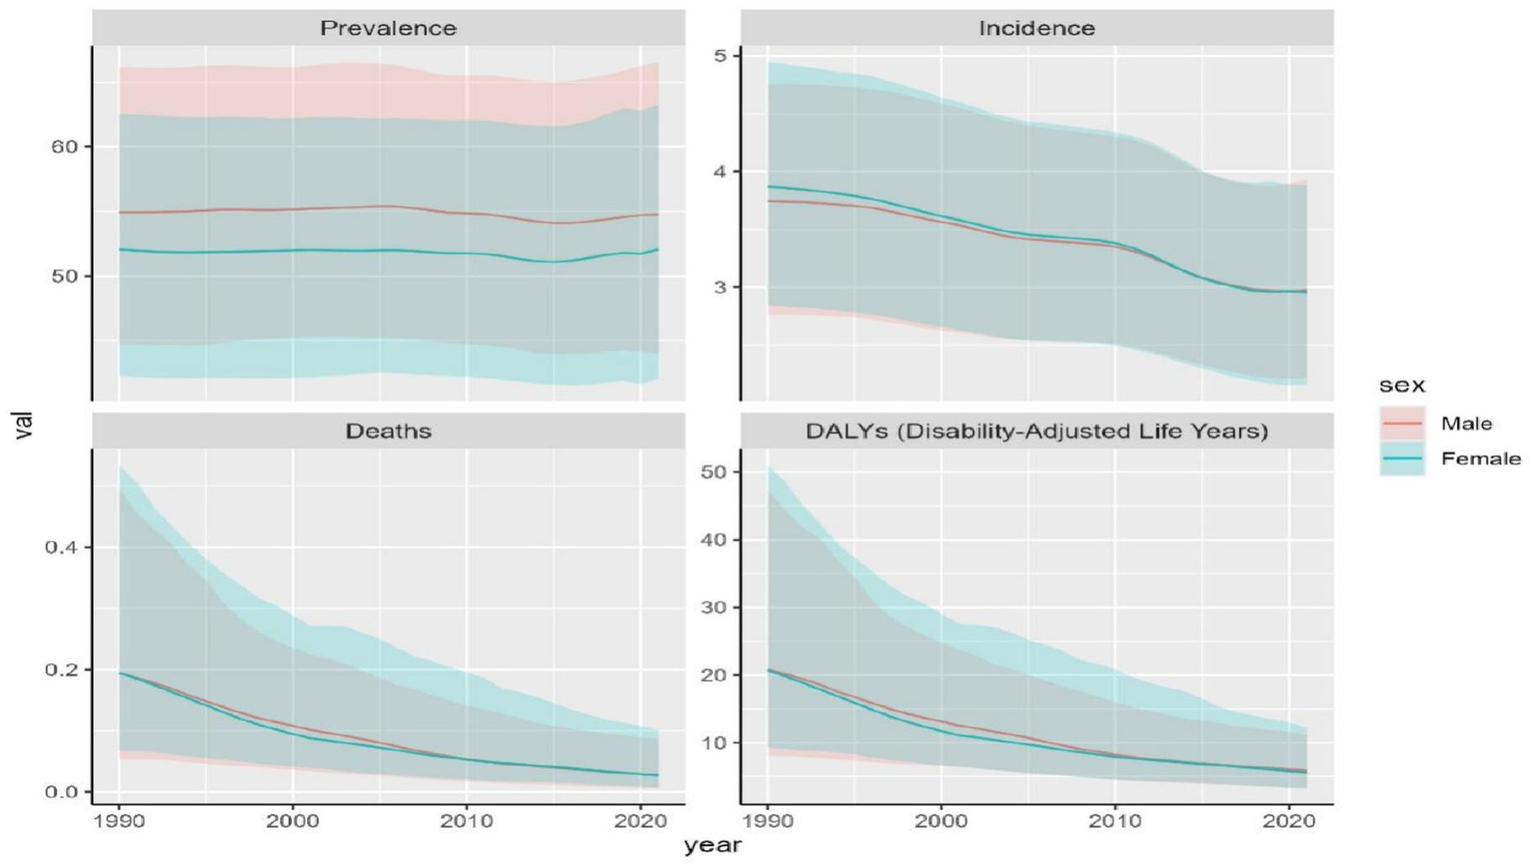
disease burden indicators for OFCs in males and females from 1990 to 2021.
Projections of the global impact of OFCs
We predict the trajectory of OFCs burden from 2022 to 2050. The combined ASPR for both sexes is anticipated to decline globally, falling from roughly 53.4 per 100,000 in 2021 to about 51.4 per 100,000 by 2050, which equates to a nearly 3.7% reduction over 30 years. Expected prevalence in male population is fairly constant, with minor rise from around 54.7 per 100,000 to 51.5 per 100,000, from 2021 to 2050. For females, a comparable decline is anticipated, with the prevalence rate falling from around 52.0 per 100,000 in 2021 to 51.5 per 100,000 by 2050. The global incidence of OFCs is also expected to experience a slight downward trend for both genders combined. ASIR is projected to decrease from approximately 2.81 per 100,000 in 2021 to about 1.78 per 100,000 by 2050. Additionally, ASDR for OFCs is expected to decline for both sexes combined, from roughly 0.026 per 100,000 in 2021 to around 0.003 per 100,000 by 2050. Moreover, rate of age-standardized DALYs for OFCs is expected to see a significant decline for the sum of both gender groups, falling from 5.8 per 100,000 to approximately 2.0 per 100,000, 2021 to 2050. In all, the decrease in the ASPR is relatively modest, and the data differences between males and females are minimal (Figure 7).
Figure 7
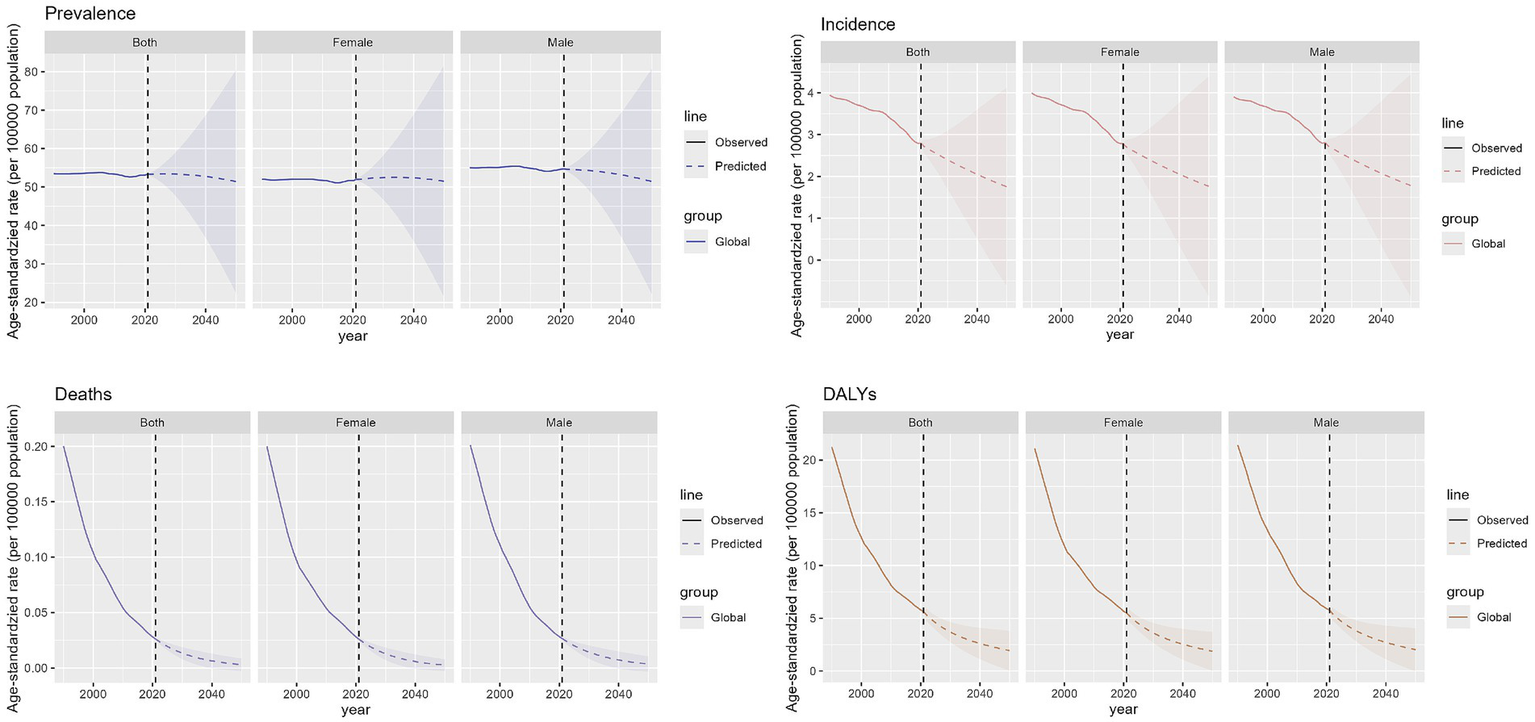
Future forecasts of global burden of OFCs.
Discussion
We investigated the trend of the disease burden of OFCs over time, as well as its relationship with factors (e.g., social development level and gender). Globally, notable reductions were seen in age-standardized DALYs rate, ASDR, ASIR, demonstrating enhanced capabilities in both preventive strategies and clinical management of OFCs. However, the disease burden of OFCs exhibits strikingly inequitable distribution and is inversely associated with the socio-demographic index. Regions with high SDI consistently demonstrate superior healthcare capabilities. Over the past three decades, three key indicators (ASPR, ASDR, and age-standardized DALYs rate) have remained stable and consistently lower than other regions, while only ASIR shows variability. This suggests that high-SDI regions not only deliver comprehensive, high-quality therapeutic interventions but have also achieved measurable advancements in primary prevention strategies for OFCs. In regions with high-middle SDI, rapid economic growth has been accompanied by the most significant reduction in disease burden. Notably, ASPR and ASIR in low-SDI areas are lower than those in low-middle SDI regions, potentially attributable to incomplete data-reporting system, inconsistencies in case definitions, or model-based misinterpretations of epidemiological patterns in resource-limited settings. Furthermore, correlation analyses across 21 geographical regions revealed that SDI values exhibited negative associations with ASPR, ASDR, and age-standardized DALYs rate, while no significant correlation was observed with ASIR.
Drawing on comprehensive analysis of the GBD 2021 data, our calculations indicate a global prevalence of OFCs in approximately 1 per 731 live births, statistically aligning with existing literatures (21). Central Asia stands out with a notably high incidence rate. Environmental pressures such as intense solar irradiance and significant diurnal temperature differences between day and night in Central Asia, may trigger abnormal gene expression during embryonic development (22, 23). Moreover, the traditional diet mainly consists of meat and dairy products, may lead to insufficient intake of vegetables and a consequent lack of key nutrients like folate among pregnant women (24). Additionally, exposure to secondhand smoke and the drinking habits of pregnant women are also known to contribute to the occurrence of OFCs (25). However, the age-standardized DALYs rate in Central Asian countries remain relatively low, which can attributed to the humanitarian activities of voluntary surgeons (26).
South Asia is characterized by high ASPR. The region has a large population base, and medical expenditure generally constitutes a low proportion of GDP (27). Meanwhile, some countries have received support from the WHO and have implemented measures to enhance prenatal care and early screening, leading to more cases being documented (28). The medical resources in this region are extremely scarce, with a severe shortage of surgeons, dentists, and nurses (29). This makes it challenging for patients to receive satisfactory treatment. Even when patients do receive treatment, their psychosocial trauma remains significant (30).
it’s the overall disease burden of Southeast Asia is lower than that of Central and South Asia, there are significant disparities among individual countries within the region. Vietnamese women generally consume less tobacco and alcohol, and their nutritional intake and infection prevention during pregnancy are relatively well-maintained, ensuring that children can receive timely and effective treatment (31). On the contrary, Laos faces a much heavier disease burden, with the second highest rate of age standardized DALYs worldwide in 2021, almost ten times that of Vietnam, with ASDR also ranking second in the world. In Laos, Indonesia, and the Philippines, the majority of OFCs patients are unable to receive timely and effective treatment (32–35).
East Asia has the lowest burden of OFCs disease in Asia. As the world’s second most populous country, China has witnessed rapid development, implemented policies related to eugenics and child rearing, and widely promoted prenatal checkups (36). Among high SDI region, high-income Asia Pacific exhibits the heaviest disease burden. Despite having extremely low birth rates in recent years, Japan and South Korea still exhibit relatively high ASIR of OFCs, second only to Central Asia. The elevated incidence may be linked to advanced maternal age and specific dietary patterns. Some scholars have found that excessive intake of multiple vitamins in the early stage of pregnancy can also lead to the occurrence of OFCs (37). Moreover, the high aesthetic standards in Korean society may impose greater psychological stress on individuals with OFCs in their daily lives (38).
OFCs disease burden remains relatively high in Middle East and North Africa. The traditional diet in these areas mainly consists of meat and cereals, women of childbearing age and pregnant women significantly lack folate intake (39). High proportion in women population used hookah during pregnancy, and the number of people with gestational diabetes is larges (40). Some communities still practice consanguineous marriages (41). Moreover, the unstable political situation is also one of the major challenges, such as Afghanistan, whose age-standardized DALYs rate ranks first among all countries, indicating that patients are unable to receive ideal treatment (42).
Sub Saharan Africa experiences rapid population growth, with approximately 1/778 of newborns affected by OFCs. This is significantly different from the previously ratio of 1/2500 in African newborns (43). This may be due to the previous excessive scarcity of medical resources in Africa, coupled with cultural superstitions that led to the discrimination against OFCs patients (44, 45). As a result, many children did not have the opportunity to seek medical treatment and were not recorded (46). Africa’s medical resources remain extremely limited, with low medical insurance coverage and a heavy reliance on international funding and policy support. Many children with OFCs miss out on surgical opportunities due to insufficient nutritional intake and feeding difficulties caused by cleft lip and palate. Their weight often fails to meet the requirements for surgery, causing them to miss the optimal treatment window (47–49).
In Oceania, the impact caused by OFCs is significant, which is primarily due to the overwhelming disease burden in Papua New Guinea. The country has a notably high rate of teenage pregnancy (50). Meanwhile, tropical climate and poor hygiene conditions exacerbate the risk of infections during pregnancy (51). Papua New Guinea is also home to numerous volcanoes, and the volcanic ash emissions contain cadmium, a heavy metal linked to a higher risk of OFCs (52). Medical resources in the country are extremely scarce and unevenly distributed. Although international medical aid teams provide free surgeries, coverage remains low due to inadequate transportation and postoperative rehabilitation resources (53).
Thanks to sufficient medical resources and effective perinatal management (54), the disease burden in Australasia and Europe remains quite low. High-income North America has the lowest disease burden. The disease burden in Latin America and the Caribbean region is roughly at a moderate level, OFCs distribution in Latin American and Caribbean countries presented to be heterogeneous, with no geographic pattern (55). Brazil has a relatively high rate of tobacco and alcohol exposure during pregnancy, a higher risk of infections, and a high prevalence of hypertension, along with lower coverage rate of surgical procedures (56, 57). In addition, some studies suggest that the abuse of cannabis and other drugs in Latin America is also associated with OFCs occurrence (58).
From a global perspective, the disease burden of men is slightly higher than that of women. This phenomenon may be the result of the combined effects of genetics and embryonic development (59). From a genetic perspective, some genes exhibit stronger dominant effects in male embryos (60). In terms of embryonic development, the critical period of facial fusion in male embryos is more sensitive to external interference (19). In addition, male patients are more likely to be detected in statistics due to a higher proportion of bilateral complete cleft lip and palate, while female embryos have lower tolerance for severe deformities, which may lead to a higher rate of early natural elimination (61).
We predict that the disease burden of OFCs will continue to decrease in the future, and in order to accelerate this process, tailored interventions should be implemented based on country-specific disease burden profile. In areas with relatively low SDI, the disease burden is significantly heavier. For congenital disorders such as OFCs, prevention and early treatment are crucial in these areas. It requires implementing prenatal and eugenic policies to prohibit consanguineous marriages, enhancing prenatal screenings during pregnancy, ensuring adequate nutrition supply, preventing infections, getting rid of superstition, and avoiding medication misuse (62–65). For the care of newborns with OFCs, it is essential to ensure prompt feeding care, prevent lower respiratory tract infections, manage psychomotor retardation, and treat of comorbidities (66–69).
Strengthening horizontal health systems is likely the optimal long-term strategy compared to vertical, disease-specific interventions for addressing cleft-related disabilities (20). Ensuring timely and effective access to basic surgical care for patients is the most cost-effective approach (43, 70, 71). It not only reduces the need for subsequent corrective treatments but also effectively alleviates the disease burden and prevents the waste of medical resources (72). For instance, prenatal intrauterine surgical repair can achieve nearly scar-free healing (73). Meanwhile, it is also crucial to establish effective disease surveillance and reporting systems in these regions to provide reliable epidemiological data.
Developed regions with high SDI have made sufficient efforts in many aspects, and their disease burden of OFCs is relatively light. Their main problem is delayed childbearing age, as parental age may be related to the occurrence and severity of OFCs (74). These regions should take the lead in establishing a global epidemiological surveillance system and initiating international support projects to assist underdeveloped areas (26), simultaneously conducting more high-quality multicenter studies to clarify the epidemiological characteristics and etiology of OFCs.
Limitation
The GBD data rely on model estimates, which may introduce information bias due to variations in disease definitions, diagnostic criteria, and data collection methods (e.g., inconsistent reporting standards across national health departments). These factors can lead to overestimation or underestimation of disease burdens in specific regions, particularly in countries/regions with underdeveloped healthcare systems or weak data reporting mechanisms. Additionally, the database lacks detailed granular data (e.g., race/ethnicity, disease subtypes), limiting in-depth analyses for specific populations.
Conclusion
Globally, the disease burden of OFCs has shown a decline from 1990 to 2021. Males have experienced a slightly higher disease burden compared to females, although the gap remains relatively narrow. The distribution exhibits significant regional disparities correlated with SDI values. The heaviest disease burden occurs in Central Asia, South Asia, and Africa. In these regions, it is crucial to strengthen three-tier prevention (preconception screening, prenatal diagnosis), enhancing primary healthcare sequential treatment capacity, integrating public welfare programs to offer free surgeries, collaborating with multidisciplinary teams for full-cycle rehabilitation, and promoting preventive knowledge through community education. Developed regions with lighter disease burdens should conduct research on cleft lip and palate, establish efficient and reliable epidemiological surveillance systems, and provide support to other regions.
Statements
Data availability statement
Publicly available datasets were analyzed in this study. This data can be found here: GBD study 2021 data resources were available online, the website is as follows: https://vizhub.healthdata.org/gbd-results/.
Author contributions
ZW: Writing – original draft. WQ: Software, Visualization, Writing – original draft. YC: Software, Visualization, Writing – original draft. FN: Validation, Writing – review & editing.
Funding
The author(s) declare that financial support was received for the research and/or publication of this article. This study was funded by CAMS Innovation Fund for Medical Sciences (2021-I2M-1-068).
Conflict of interest
The authors declare that the research was conducted in the absence of any commercial or financial relationships that could be construed as a potential conflict of interest.
Generative AI statement
The author(s) declare that no Gen AI was used in the creation of this manuscript.
Publisher’s note
All claims expressed in this article are solely those of the authors and do not necessarily represent those of their affiliated organizations, or those of the publisher, the editors and the reviewers. Any product that may be evaluated in this article, or claim that may be made by its manufacturer, is not guaranteed or endorsed by the publisher.
Supplementary material
The Supplementary material for this article can be found online at: https://www.frontiersin.org/articles/10.3389/fmed.2025.1609700/full#supplementary-material
References
1.
Merritt L . Part 1. Understanding the embryology and genetics of cleft lip and palate. Adv Neonatal Care. (2005) 5:64–71. doi: 10.1016/j.adnc.2004.12.006
2.
Nasreddine G El Hajj J Ghassibe-Sabbagh M . Orofacial clefts embryology, classification, epidemiology, and genetics. Mutat Res Mutat Res. (2021) 787:108373. doi: 10.1016/j.mrrev.2021.108373
3.
Munger RG Tamura T Johnston KE Feldkamp ML Pfister R Cutler R et al . Oral clefts and maternal biomarkers of folate-dependent one-carbon metabolism in Utah. Birt Defects Res A Clin Mol Teratol. (2011) 91:153–61. doi: 10.1002/bdra.20762
4.
Wang M Yuan Y Wang Z Liu D Wang Z Sun F et al . Prevalence of orofacial clefts among live births in China: a systematic review and meta-analysis. Birth Defects Res. (2017) 109:1011–9. doi: 10.1002/bdr2.1043
5.
Shi M Wehby GL Murray JC . Review on genetic variants and maternal smoking in the etiology of oral clefts and other birth defects. Birth Defects Res Part C Embryo Today Rev. (2008) 84:16–29. doi: 10.1002/bdrc.20117
6.
Little J Cardy A Munger RG . Tobacco smoking and oral clefts: A meta-analysis. Bull World Health Organ. (2004) 82:213–8.
7.
Sun B Reynolds KS Garland MA McMahon M Saha SK Zhou CJ . Epigenetic implications in maternal diabetes and metabolic syndrome-associated risk of orofacial clefts. Birth Defects Res. (2023) 115:1835–50. doi: 10.1002/bdr2.2226
8.
Shapira Y Blum I Haklai Z Shpack N Amitai Y . Nonsyndromic orofacial clefts among Jews and non-Jews born in 13 hospitals in Israel during 1993-2005. Community Dent Oral Epidemiol. (2018) 46:586–91. doi: 10.1111/cdoe.12395
9.
Suhl J Romitti PA Rocheleau C Cao Y Burns TL Conway K et al . Parental occupational pesticide exposure and nonsyndromic orofacial clefts. J Occup Environ Hyg. (2018) 15:641–53. doi: 10.1080/15459624.2018.1484127
10.
Navarro Sanchez ML Swartz MD Langlois PH Canfield MA Agopian AJ . Epidemiology of nonsyndromic, orofacial clefts in Texas: differences by cleft type and presence of additional defects. Cleft Palate Craniofacial J. (2023) 60:789–803. doi: 10.1177/10556656221080932
11.
Kaul B Rajput S Gulbar S Gupta A Kashani RN Kaul A . Orofacial cleft and its association with consanguineous marriage and other risk factors: a case-control study from a tertiary care hospital in Jammu province. Int J Clin Pediatr Dent. (2024) 17:1258–64. doi: 10.5005/jp-journals-10005-3004
12.
Pisek A McKinney CM Muktabhant B Pitiphat W . Maternal metabolic status and orofacial cleft risk: a case-control study in Thailand. Int Dent J. (2024) 74:1413–23. doi: 10.1016/j.identj.2024.02.005
13.
Eldesouky R Elbarbary A . Definitive rhinoplasty and orthognathic surgery for patients with cleft lip palate. Oral Maxillofac Surg Clin N Am. (2023) 35:127–37. doi: 10.1016/j.coms.2022.06.011
14.
Bell J Nassar N Turner R Bower C Gillett D McBain W et al . Hospitalisations up to adulthood for children born with orofacial clefts. J Paediatr Child Health. (2016) 52:441–8. doi: 10.1111/jpc.13024
15.
Constantin J Wehby GL . Academic outcomes of children with orofacial clefts: a review of the literature and recommendations for future research. Oral Dis. (2022) 28:1387–99. doi: 10.1111/odi.14137
16.
Bell J Raynes-Greenow C Turner R Bower C Dodson A Hancock K et al . School absence and its effect on school performance for children born with orofacial clefts. Birth Defects Res. (2017) 109:1048–56. doi: 10.1002/bdr2.1041
17.
Bell JC Raynes-Greenow C Turner R Bower C Dodson A Nicholls W et al . School performance for children with cleft lip and palate a population-based study. Child Care Health Dev. (2017) 43:222–31. doi: 10.1111/cch.12388
18.
Wehby G Cassell C . The impact of orofacial clefts on quality of life and healthcare use and costs. Qual Life Oral Dis. (2010) 16:3–10. doi: 10.1111/j.1601-0825.2009.01588.x
19.
Van Der Lek LM Pool SMW De Jong K Vermeij-Keers C Mouës-Vink CM . Seasonal influence on the numbers of gender-related orofacial cleft conceptions in the Netherlands. Cleft Palate Craniofacial J. (2021) 58:1422–9. doi: 10.1177/1055665620987693
20.
Swanson JW . Discussion: global burden of orofacial clefts and the world surgical workforce. Plast Reconstr Surg. (2021) 148:581e–2e. doi: 10.1097/PRS.0000000000008335
21.
Wang D Zhang B Zhang Q Wu Y . Global, regional and national burden of orofacial clefts from 1990 to 2019: an analysis of the global burden of disease study 2019. Ann Med. (2023) 55:2215540. doi: 10.1080/07853890.2023.2215540
22.
Fang K Chen F Sen AK Davi N Huang W Li J et al . Hydroclimate variations in central and monsoonal asia over the past 700 years. LiangE, ed. PLoS One. (2014) 9:e102751. doi: 10.1371/journal.pone.0102751
23.
Sternberg T Edwards M . Desert dust and health: a central asian review and steppe case study. Int J Environ Res Public Health. (2017) 14:1342. doi: 10.3390/ijerph14111342
24.
Akilzhanova A Takamura N Zhaojia Y Aoyagi K Karazhanova L Yamashita S . Kazakhstan: A folate-deficient area?Eur J Clin Nutr. (2006) 60:1141–3. doi: 10.1038/sj.ejcn.1602428
25.
Stanaway JD Afshin A Gakidou E Lim SS Abate D Abate KH et al . Global, regional, and national comparative risk assessment of 84 behavioural, environmental and occupational, and metabolic risks or clusters of risks for 195 countries and territories, 1990–2017: a systematic analysis for the global burden of disease study 2017. Lancet. (2018) 392:1923–94. doi: 10.1016/S0140-6736(18)32225-6
26.
Calis M Aral AM Sencan A Kanbak M Vargel İ Ozgur F et al . Humanitarian activities of interplast Turkiye: 6 years of experience in Uzbekistan for surgical treatment of cleft patients and related secondary deformities. Ann Plast Surg. (2016) 77:494–8. doi: 10.1097/SAP.0000000000000821
27.
Irfan FB Telford B Hollon N Dehghani A Schukow C Syed AY et al . Coronavirus pandemic in the south asia region: health policy and economy trade-off. J Glob Health. (2023) 13:06014. doi: 10.7189/jogh.13.06014
28.
Tobgyel K Rai P Choden K Gyeltshen T . Epidemiology of cleft lip and palate in Bhutan, 2015–2022. BMC Oral Health. (2024) 24:1385. doi: 10.1186/s12903-024-05177-7
29.
Haakenstad A Irvine CMS Knight M Bintz C Aravkin AY Zheng P et al . Measuring the availability of human resources for health and its relationship to universal health coverage for 204 countries and territories from 1990 to 2019: a systematic analysis for the global burden of disease study 2019. Lancet. (2022) 399:2129–54. doi: 10.1016/S0140-6736(22)00532-3
30.
Gowda M Pai N Vella SL . A pilot study of mental health and quality-of-life of caregivers of children with cleft lip/palate in India. Indian J Psychiatry. (2013) 55:167–9. doi: 10.4103/0019-5545.111456
31.
Nguyen VT Persson M Jagomägi T . Application of a new patient-reported outcome measure in orofacial clefts: An exploratory study in two countries. Stomatologija. (2019) 21:72–78.
32.
Sarilita E Rafisa A Desai P Mossey PA . Age at primary surgery among orofacial cleft individuals in Indonesia. Orthod Craniofac Res. (2024) 27:62–9. doi: 10.1111/ocr.12751
33.
Muntz HR Meier JD . The financial impact of unrepaired cleft lip and palate in the Philippines. Int J Pediatr Otorhinolaryngol. (2013) 77:1925–8. doi: 10.1016/j.ijporl.2013.08.023
34.
Bangun K Halim J Tania V Kreshanti P Pancawati J Atmodiwirjo P . Limited access to alveolar bone graft surgery following primary cleft lip and palate repair in Indonesia: a questionnaire-based qualitative study. J Craniofac Surg. (2023) 34:544–7. doi: 10.1097/SCS.0000000000009063
35.
Panthavong N Msn SP Luvira V Khansoulivong K Chowcheun B . Outcome of patients with cleft lip and cleft palate operated at mahosoth, mitthaphab and setthathirath hospitals in lao people’s democratic republic. J Med Assoc Thai. 96:S98–106. doi: 10.1016/j.coms.2018.12.002
36.
Gai S Wang L Zheng W . Comparison of prenatal ultrasound with MRI in the evaluation and prediction of fetal orofacial clefts. BMC Med Imaging. (2022) 22:213. doi: 10.1186/s12880-022-00929-9
37.
Yoshida S Takeuchi M Kawakami C Kawakami K Ito S . Maternal multivitamin intake and orofacial clefts in offspring: Japan environment and children’s study (JECS) cohort study. BMJ Open. (2020) 10:e035817. doi: 10.1136/bmjopen-2019-035817
38.
Hwang K . Why cosmetic surgery is prevalent in Korea: a perspective grounded in basic values. J Craniofac Surg. (2025) 36:383–6. doi: 10.1097/SCS.0000000000010940
39.
Hwalla N Al Dhaheri A Radwan H Alfawaz HA Fouda MA Al-Daghri NM et al . The prevalence of micronutrient deficiencies and inadequacies in the middle east and approaches to interventions. Nutrients. (2017) 9:229. doi: 10.3390/nu9030229
40.
Wang H Li N Chivese T Werfalli M Sun H Yuen L et al . IDF diabetes atlas: estimation of global and regional gestational diabetes mellitus prevalence for 2021 by international association of diabetes in pregnancy study group’s criteria. Diabetes Res Clin Pract. (2022) 183:109050. doi: 10.1016/j.diabres.2021.109050
41.
Albalawi F Alsaeed S Alalola B Alotaib GS Kalagi S . Prevalence and patterns of orofacial clefts among children from different regions of Saudi Arabia: a systematic review. Int. J Clin Pediatr Dent. (2023) 16:124–30. doi: 10.5005/jp-journals-10005-2507
42.
Saif-Nijat J Pakravan-Charvadeh MR Gholamrezai S et al . The association of the quality of life with afghan households’ food insecurity before and after the recent political change in Afghanistan: a comparative analysis. BMC Public Health. (2023) 23:2066. doi: 10.1186/s12889-023-16967-z
43.
Yang TY Chang TY . Prenatal ultrasound imaging of orofacial clefts: a pictorial essay. J Med Ultrasound. (2024) 32:8–13. doi: 10.4103/jmu.jmu_123_23
44.
Nwanze HO Sowemimo GO . Maternal stress, superstition and communicative behaviour with nigerian cleft lip and palate children. Scand J Plast Reconstr Surg. (1987) 21:15–8. doi: 10.3109/02844318709083573
45.
Mzezewa S Muchemwa FC . Reaction to the birth of a child with cleft lip or cleft palate in Zimbabwe. Trop Dr. (2010) 40:138–40. doi: 10.1258/td.2010.090329
46.
Conway JC Taub PJ Kling R Oberoi K Doucette J Jabs EW . Ten-year experience of more than 35,000 orofacial clefts in africa. BMC Pediatr. (2015) 15:8. doi: 10.1186/s12887-015-0328-5
47.
Oladayo AM Prochaska S Busch T Adeyemo WL Gowans LJJ Eshete M et al . Parents and provider perspectives on the return of genomic findings for cleft families in africa. AJOB Empir Bioeth. (2024) 15:133–46. doi: 10.1080/23294515.2024.2302993
48.
Rhodes IJ Alston CC Zhang A Arbuiso S Medina SJ Liao M et al . The pattern and profile of orofacial clefts in somaliland: a review of 40 consecutive cleft lip and palate surgical camps. J Craniofac Surg. (2024) 35:1407–10. doi: 10.1097/SCS.0000000000010340
49.
Kanmodi KK Atteya SM Elwan AH Adewole I Akinsolu FT Abodunrin OR et al . Nutrition and diet in children with orofacial clefts in africa: a scoping review. BMC Oral Health. (2024) 24:1341. doi: 10.1186/s12903-024-05130-8
50.
Li H Pu Y Li Z Jin Z Jiang Y . Socioeconomic inequality in teenage pregnancy in Papua New guinea: a decomposition analysis. BMC Public Health. (2023) 23:2184. doi: 10.1186/s12889-023-17067-8
51.
Robbers G Vogel JP Mola G Bolgna J Homer CSE . Maternal and newborn health indicators in Papua New guinea – 2008–2018. Sex Reprod Health Matters. (2019) 27:52–68. doi: 10.1080/26410397.2019.1686199
52.
Toti A Vetuna B Kalit V Duke T . Birth defects in a rural province in Papua New guinea. Arch Dis Child. (2024) 109:702–6. doi: 10.1136/archdischild-2024-327200
53.
Jeong WS Lee JY Choi JW . Large-scale study of long-term anteroposterior stability in a surgery-first Orthognathic approach without Presurgical orthodontic treatment. J Craniofac Surg. (2017) 28:2016–20. doi: 10.1097/SCS.0000000000003853
54.
Moreira T Dias M Von Hafe M Curval AR Ramalho C Maia AM et al . Orofacial clefts: reflections on prenatal diagnosis and family history based on a series of cases of a tertiary children hospital. Congenit Anom. (2023) 63:195–9. doi: 10.1111/cga.12538
55.
Zuluaga-Morales JS Herrera-Serna BY López-Soto OP Sandoval-Llanos GM Martínez-Nieto J . Prevalencia de fisuras orofaciales en latinoamérica y el caribe: Tendencias entre 2000 y 2020. Rev Peru Med Exp Salud Pública. 41:220–2. doi: 10.17843/rpmesp.2024.412.13558
56.
Sousa GFTD Roncalli AG . Orofacial clefts in Brazil and surgical rehabilitation under the brazilian national health system. Braz Oral Res. (2017) 31:e23-e33 doi: 10.1590/1807-3107bor-2017.vol31.0023
57.
Silva HPVD Arruda TTS Souza KSCD Bezerra JF Leite GCP Brito MEF et al . Risk factors and comorbidities in brazilian patients with orofacial clefts. Braz Oral Res. (2018) 32:e24. doi: 10.1590/1807-3107bor-2018.vol32.0024
58.
Reece AS Hulse GK . Canadian Cannabis Consumption and Patterns of Congenital Anomalies: An Ecological Geospatial Analysis. J Addict Med. (2020) 14:e195–e210. doi: 10.1097/ADM.0000000000000638
59.
Marazita ML . The evolution of human genetic studies of cleft lip and cleft palate. Annu Rev Genomics Hum Genet. (2012) 13:263–83. doi: 10.1146/annurev-genom-090711-163729
60.
Awotoye W Comnick C Pendleton C Zeng E Alade A Mossey PA et al . Genome-wide gene-by-sex interaction studies identify novel nonsyndromic orofacial clefts risk locus. J Dent Res. (2022) 101:465–72. doi: 10.1177/00220345211046614
61.
Robinson K Parrish R Adeyemo WL Beaty TH Butali A Buxó CJ . Genome-wide study of gene-by-sex interactions identifies risks for cleft palate. Hum Genet. (2024) 143:1341–52. doi: 10.1007/s00439-024-02704-y
62.
Jiang L Jiang C Wang Y Song T Yin N . Heterogeneity of orofacial clefts and associated anomalies in China. J Craniofac Surg Published online August. (2023) 17:e698–e701. doi: 10.1097/SCS.0000000000009611
63.
Talal AlSharif M Abdullah Alamoudi R Jafar SH . Maternal stress as a risk factor for non-syndromic orofacial clefts: systematic review and meta-analysis. Saudi Dent J. (2023) 35:207–19. doi: 10.1016/j.sdentj.2023.02.004
64.
Beaty TH Marazita ML Leslie EJ . Genetic factors influencing risk to orofacial clefts: today’s challenges and tomorrow’s opportunities. F1000Research. (2016) 5:2800. doi: 10.12688/f1000research.9503.1
65.
Huang Z Wu J Qiu Y Lin J Huang W Ma X et al . Association between gestational exposure and risk of orofacial clefts: a systematic review and meta-analysis. BMC Pregnancy Childbirth. (2023) 23:829. doi: 10.1186/s12884-023-06104-4
66.
Sato Y Yoshioka E Saijo Y Miyamoto T Azuma H Tanahashi Y et al . Lower respiratory tract infections and orofacial clefts: a prospective cohort study from the Japan environment and children’s study. J Epidemiol. (2022) 32:270–6. doi: 10.2188/jea.JE20200438
67.
Sato Y Yoshioka E Saijo Y Kato Y Nagaya K Takahashi S et al . Associated congenital anomalies and syndromes of 248 infants with orofacial clefts born between 2011 and 2014 in the Japan environment and children’s study. Congenit Anom. (2023) 63:9–15. doi: 10.1111/cga.12496
68.
Espinosa AS Martinez JC Molina Y Gordillo MAB Hernández DR Rivera DZ et al . Clinical and Descriptive Study of Orofacial Clefts in Colombia: 2069 Patients From Operation Smile Foundation. Cleft Palate Craniofac J. (2022) 59:200–208. doi: 10.1177/10556656211000551
69.
Delage B Stieber E Sheeran P . Prevalence of malnutrition among children at primary cleft surgery: a cross-sectional analysis of a global database. J Glob Health. (2022) 12:04012. doi: 10.7189/jogh.12.04012
70.
Salman Aminwala M Jaffar Abbas Zaidi S Ashraf Ganatra M Taqi M Hamid D Aminwala Z . Evaluating quality of life changes in patients with cleft lip or palate: a mixed method pre- and postsurgical analysis in Karachi. BMC Oral Health. (2024) 24:1509. doi: 10.1186/s12903-024-05293-4
71.
Seidel CL Percivalle E Tschaftari M Weider M Strobel K Willershausen I et al . Orofacial clefts lead to increased pro-inflammatory cytokine levels on neonatal oral mucosa. Front Immunol. (2022) 13:1044249. doi: 10.3389/fimmu.2022.1044249
72.
Mossey P Little J . Addressing the challenges of cleft lip and palate research in India. Indian J Plast Surg. 42 Suppl:S9–S18. doi: 10.4103/0970-0358.57182
73.
Oliver JD Turner EC Halpern LR Jia S Schneider P D’Souza RN . Molecular diagnostics and in utero therapeutics for orofacial clefts. J Dent Res. (2020) 99:1221–7. doi: 10.1177/0022034520936245
74.
Hermann NV Darvann TA Munch A Kreiborg S . Parental age in relation to the severity of cleft lip and/or palate. Orthod Craniofac Res. (2018) 21:236–41. doi: 10.1111/ocr.12241
Summary
Keywords
cleft lip and palate, GBD (2021) database, disease burden analysis, prevalence, incidence, DALY (disability-adjusted life years)
Citation
Wang Z, Qi W, Chen Y and Niu F (2025) Global, regional, and national burden of orofacial clefts, 1990–2021: an analysis of data from the global burden of disease study 2021. Front. Med. 12:1609700. doi: 10.3389/fmed.2025.1609700
Received
11 April 2025
Accepted
26 May 2025
Published
11 June 2025
Volume
12 - 2025
Edited by
Dhelfeson Willya Douglas-de-Oliveira, Federal University of Jequitinhonha and Mucuri Valleys, Brazil
Reviewed by
Tshewang Gyeltshen, The University of Tokyo, Japan
Fabio Antonio Venancio, Centro Universitário de Adamantina (UNIFAI), Brazil
Updates
Copyright
© 2025 Wang, Qi, Chen and Niu.
This is an open-access article distributed under the terms of the Creative Commons Attribution License (CC BY). The use, distribution or reproduction in other forums is permitted, provided the original author(s) and the copyright owner(s) are credited and that the original publication in this journal is cited, in accordance with accepted academic practice. No use, distribution or reproduction is permitted which does not comply with these terms.
*Correspondence: Feng Niu, niufeng@psh.pumc.edu.cn
Disclaimer
All claims expressed in this article are solely those of the authors and do not necessarily represent those of their affiliated organizations, or those of the publisher, the editors and the reviewers. Any product that may be evaluated in this article or claim that may be made by its manufacturer is not guaranteed or endorsed by the publisher.