Abstract
Introduction:
Cardiovascular aging starts early in life due to the glycation of critical proteins, though its progression remains undetected in the formative years. The glycation reaction affects all tissues by the same non enzymatic irreversible reaction. The variables are the pH, temperature, glucose concentration, and the specific protein. This relationship implies that glycated blood biomarkers could potentially be used as a proxy for assessing in situ myocardial changes.
Methods:
Laboratory tests for troponin I (cTnI), hemoglobin A1c (A1c), fructosamine, and low-density lipoprotein (LDL), were chosen to calculate the proxy for in situ glycation. An algorithm was developed incorporating these variables as individual measurements and as calculated metrics of glycation. This data was obtained from previous large group studies of variables and outcomes.
Results:
Modeling of glycation was determined for each variable. Using metrics from multiple studies, theoretical rates of glycation of LDL and troponin I were calculated. The glycated changes in LDL and troponin I were used to determine the increases above optimal physiological rates.
Conclusion:
Laboratory results of LDL, cTnI, A1c and fructosamine could be used sequentially to derive a cost-effective proxy for assessing in situ aging and deterioration of cardiovascular tissue. This model could theoretically predict the rate of cardiovascular aging by integrating four blood biomarkers into a dedicated algorithm guiding proactive diagnostics and treatment.
1 Introduction
In 2021 cardiovascular disease caused over 21 million deaths worldwide, which is one third of all deaths globally. While this is commonly thought to be a disease of developed countries it is now known that over three quarters of the deaths are in low- and middle-income countries. Ischemic heart disease (IHD), specifically, stands as the leading cause of premature death in 146 countries for men and 98 countries for women (1). While the classic myocardial infarction (MI) symptoms of chest pain and shortness of breath are often mentioned, they are in the minority of cases. Seventy to 80% of transient episodes of cardiac ischemia are not associated with any symptoms (2). In asymptomatic middle-aged adults, 12.5% had evidence of silent myocardial ischemia when actively monitored during normal activity (3). Additional data suggests 20–60% of all myocardial infarctions are silent (4, 5). For decades IHD progresses in adults without obvious symptoms. Frequently the initial presentation is cardiac arrest which affects over 350,000 individuals per year in the USA (6). The ability to determine the progression of heart disease is a significant challenge. Algorithms such as the Framingham heart model which began in 1948 have limited use as the risk is only based on a 10-year projection (7). Of those in the lowest risk quartile, 58% have subclinical and 36% significant atherosclerotic cardiovascular disease (8). Artificial intelligence (AI) rare data predictive modeling improves the diagnosis of heart disease but requires analysis of unstable or abnormal cardiac and metabolic factors (9). Present diagnostic methods require CT, MRI or PET scans, stress tests or cardiac catheterization to determine clinical heart disease; however they have difficulty in predicting it during the silent phase of development. A multinational study of 13,540 adults using 4,963 plasma protein concentrations showed only modest improvement when polygenic risk score was added to standard risk evaluation (10). The polygenic data analysis required complex and expensive testing of 60 genetic variants. Certain population groups have a significantly greater risk of silent heart disease. Women often do not develop the classic symptoms of ischemia and are therefore underdiagnosed. In women with IHD, only 30% have chest pain as a prodrome for a MI (11, 12). Minority populations have greater rate of heart disease and cardiac mortality due to a marked prevalence of hypertension, diabetes, lipid disorders and metabolic syndrome (13). For decades the standard of care has been to evaluate apparently healthy individuals using resting electrocardiogram (EKG), lipid concentrations, blood pressure, blood glucose, smoking and family history and then decide a plan of action. However, this approach cannot determine the rate of cardiovascular deterioration. There are two overlooked facts about heart disease. (1) If an algorithm estimates a 20% risk of a cardiac event within 10 years, it has predicted that one of five identical individuals will develop significant heart disease, but it cannot determine which specific individual will be affected. (2) The reported data on cardiac risk is error prone due to the significant number of silent events that are not detected. Present diagnostic evaluations are expensive, time consuming, and frequently invasive. They also only determine cardiac disease once it is clinically evident. Frequent testing by these methods is not feasible. Using the USA as an example, over 10,000,000 cardiac stress tests are done yearly at cost of an average of $1,000 per test (14, 15). Over 40% of all Medicare part B medical imaging expenditures each year are spent on nuclear cardiac stress tests, a cost of $17 billion annually (16). An estimated 32–48% of all stress tests done each year may not be needed (17). This does not include costs of outpatient care, hospitalizations, heart catheterizations and medications. The cost of cardiovascular disease in the USA alone for 2020 was greater than $300 billion and estimated to increase to over $1 trillion by 2050 (18). The costs worldwide are difficult to estimate (1). To sequentially determine the progression of asymptomatic heart disease would require a testing methodology that is cost effective, noninvasive, automated and correlates with in situ cardiovascular aging. The glycation reaction plays a crucial role in triggering the catabolic cascade, making its understanding essential for developing the proposed testing system.
2 Methods
2.1 Risk analysis and present algorithms
The described algorithm is based on analysis from available data in numerous studies. It does not use original data. Risk analysis for LDL, troponin, A1c and fructosamine has been detailed in multiple large studies from one or more countries. The data reveals increased risk of cardiac events with increase in each analyte concentration over a fixed period of time (19–23). These are discussed in the sections on “glycation.” However, the proposed model does not evaluate group risk. Standard analysis of group risk compares changes in a control group and comparative group over time but cannot evaluate each individual. An analogous test to this model is dual energy X-ray absorptiometry (DEXA) testing of bone density (24). Bone density is measured by DEXA scanning and represented as age related (Z-score) and young adult comparison (T-score) scores. While group risk analysis can be determined, the evaluation of each individual is based on their previous and present results. Treatment options are based on each individual’s density changes and their specific situation. Risk analysis and prediction patterns may not be useful as individuals have unique patterns of change and variable treatment options.
Present algorithms for cardiovascular disease have inadequate predictive abilities. The sensitivities and specificities are 69%/62% for the Framingham model (FRS-CVD), 34%/ 85% for the European CVD model (SCORE) and 46%/82% for the Scottish Heart Health model (ASSIGN). These models do not use biomarkers of glycation or A1c in their calculations. Only the ASSIGN model uses diabetic status (25).
2.2 Glycation overview
Glycation is caused by the contact of glucose with a protein, lipid or nucleic acid and adducts to the substrate. The variables in this reaction are temperature, pH, glucose concentration and the physical characteristics of the substrate. These physical characteristics include half-life, turnover rate and molecular structure. It is an irreversible reaction with an early phase of Schiff base and later phase of Amadori product and advanced glycation end products (AGE) formation. While the early phase may be linear, the overall reaction is complex and probably has nonlinear characteristics (26). We have postulated linear kinetics for the initial conceptual modeling as non-enzymatic reactions are primarily linear (27). Further studies will be required to clarify the actual kinetics. Glycation initiates a cascade of factors which accelerate aging in the body (28). The final result is the production of AGE. AGE are inflammatory compounds which form even during normoglycemia. However, dysglycemia increases the rate of reaction in a pathological manner. The specifics of glycation in cardiovascular tissues and circulating biomarkers are discussed in the next sections.
2.3 Glycation of cardiovascular tissue
The AGE produced by glycation have catabolic effects on the myocardium and vascular endothelium as noted in Figure 1. AGE induce protein cross-linking with increased trapping of low-density lipoprotein (LDL) in the arterial wall (29, 30). They also reduce protective nitric oxide production causing endothelial dysfunction (31) and accelerate telomere attrition by inducing inflammatory mediators (32). AGE have been causally related to oxidation and lipooxidation in the pathogenesis of atherosclerosis. AGE produced by glycation amplify reactive oxidation. The deleterious effects of AGE have been correlated with coronary artery disease and cardiac event risk. Myocardial turnover is only 1% per year at age 25 declining to 0.45% per year at age 75 (33–39). Because myocardial tissue has a low turnover rate, even a marginal increase in blood glucose concentrations and the resultant AGE production would have a significant detrimental effect over a lifetime. Myocardial troponin is used as the critical biomarker of cardiovascular tissue deterioration in this model.
Figure 1

Schematic drawing of the glycation reaction.
2.4 Glycation of circulating biomarkers
2.4.1 Hemoglobin A1c (A1c) and fructosamine
Glycation occurs in blood biomarkers with the same reaction dynamics as in cardiovascular tissues. The two most commonly glycated blood proteins measured in clinical practice are A1c and fructosamine, the later consisting of plasma proteins primarily albumin (40–44). The glycation rate of circulating proteins is related to their exposed lysine residues (45). There is an inverse relationship between the number of lysine residues which bind glucose and the substrate half-life. The normal percent of hemoglobin glycated is 4–6% while fructosamine is 10–15%. The half-life of fructosamine is proportionally shorter than A1c (46). The result is an equivalent amount in glycation of these blood proteins (47, 48). The risk of developing heart disease is positively correlated with A1c, fructosamine and AGE (49–51). Increasing A1c concentrations correlate with increases in AGE (52–55). An increase in A1c from 39 to 46 mmol/mol (5.7–6.4%) correlates with a change in AGE of 48% (56). Early diastolic echocardiographic deterioration correlates with increase in AGE and A1c in the prediabetic range (57). Deterioration in cardiac, lipid, and glucose metabolism has been shown to correlate with increasing A1c in prediabetic individuals (58).
2.4.2 Troponin I (cTnI)
Contraction of the heart is controlled by the enzymatic protein troponin which has 3 subunits. Troponin I (cTnI) is the subunit which controls the relaxation phase (59, 60). Troponin I concentrations have a greater accuracy than troponin T in determining mortality risk in the general population (61, 62). The presently used highly sensitive troponin I assay can detect a measurable quantity in the blood of >99% of healthy adults (63). Troponin I increases from age 20 and has been shown to be a predictive biomarker of silent heart disease in healthy adults (64–66). It has also been shown to be correlated with cardiac mortality independent of the number of obstructive coronary artery lesions as well as in those without significant lesions (67). Troponin I concentrations in adults without heart disease between ages 40–60 were persistently lower in women than in men but with women exhibiting a relatively larger increase with advancing age. The median change in cTnI concentration was a 4.4% increase per year in women and a 3.5% increase per year in men beginning at age 45 (68). Receiver Operating Characteristic (ROC) optimal cut off in adults for diagnostic accuracy of heart disease was determined to be 5.1–5.2 ng/ L regardless of number of coronary arteries involved. One study was done in the USA on a mixed population while the other was done in the UK predominately in men. This illustrates a common range in dissimilar groups (67, 69). Some studies have suggested different sex related troponin risk concentrations (70) with a ROC cut off for women of 4.5–4.7 ng/L and men 5–7 ng/L (65, 67, 69). This difference is postulated to be in part from the smaller left ventricular size in women (71). At a median age 54 years, 13% of a healthy cohort (10% of women and 20% of men) had cTnI >5 ng/L. At a median age 62 years, 25% of a healthy cohort (15% of women and 35% of men) had cTnI of > 5 ng/L (72). Of those age 18–29, 9% had troponin concentrations above the upper limits of normal (73). In those <40 years of age, a majority of the abnormalities were from conditions such as myocarditis, pulmonary embolism and cardiomyopathy (74, 75). The presence of troponin in the blood of healthy adults can be related to multiple myocardial cellular functions but even concentrations in the normal range for age appear to be from subclinical myocardial necrosis (39, 76, 77). The effects of glycation and resultant AGE production cause irreversible modifications to the structure and function of all troponin subunits (78, 79).
2.4.3 Low-density lipoprotein (LDL)
Native LDL is relatively inactive until glycated under the same conditions as for other proteins. It then initiates the cascade of catabolic and inflammatory effects by producing AGE. The AGE induce oxidation, foam cell formation, and endothelial dysfunction with reduction of nitric oxide. The AGE also increase vascular permeability, procoagulant activity, and atherogenesis (80–84). LDL concentrations are positively correlated with the development of atherosclerotic cardiovascular disease and mortality from < 100 mg/dL to >190 mg/dL (85). The process is markedly reduced at 60–80 mg/dL (86).
2.5 Modeling of biomarkers and biomarker metrics
2.5.1 Introduction
The information presented illustrates the effects of glycation on proteins in situ and in blood. The integration of the blood biomarkers into metrics which act as a proxy for the in-situ process is the focus of this article. In the modeling derivation, certain assumptions are used.(1) A1c concentrations in venous and capillary blood are highly correlated with a Pearson correlation coefficient (r) > 0.94 equating glucose concentrations in venous and myocardial blood (87). Therefore, myocardial troponin is exposed to the same blood glucose concentrations as circulating hemoglobin and plasma protein. (2) The irreversible non enzymatic reaction for glycation of troponin I and LDL is the same as for hemoglobin A1c and fructosamine. It is characterized by half-life, turnover rate, structure and concentration of each variable (26). This was discussed in the previous section on “glycation.” (3) Glycation is a physiologic process and has a rate which allows for optimal tissue function. It cannot be modified without intervention. Increased rates of glycation are pathological (88). (4) The rate of glycation for an individual can be expressed proportionally to the calculated optimal glycation rate of troponin I and LDL and expressed as a ratio exceeding that level. This is discussed in the next section. (5) There is a steady state between concentrations of troponin I released from the myocardium and in the peripheral circulation of healthy adults. An increase in blood troponin I is proportional to the amount released from cardiac tissue (60). (6) Protein/lipid/nucleic acid structures of an individual are genetically coded and do not change. Therefore, the glycation of a specific individual substrate is not altered over time due to molecular modification (89). (7) Glycation of LDL is an essential mechanism in the pathogenesis of atherosclerosis and cardiovascular injury: LDL is relatively inactive without glycation (80–84). (8) The assay of circulating troponin I uses a highly specific monoclonal antibody to native troponin I. This suggests the molecular structure of circulating and in situ troponin I are equivalent (90) and would have the same glycation.
The eight assumptions above are referenced but the data available is limited. These are assumptions and additional data and analysis are necessary to verify their accuracy.
The next sections explain the model used as a proxy for in situ glycation and aging of the myocardium and vascular endothelium.
2.5.2 Mathematical model: variable physical characteristics
The variables in the irreversible glycation reaction in humans are (1) pH (2) temperature (3) duration (4) the glucose concentration which can be determined by hemoglobin A1c and fructosamine, and (5) the protein substrate. The protein substrate is characterized by the concentration, half-life, and molecular structure. In the healthy adult, pH and temperature are relatively constant at 7.35–7.45 and 37°C, respectively. The duration of the reaction is the life span of the individual. Over a lifetime, the continuous reaction in each healthy individual is assumed to be at physiological pH and temperature (91, 92). The half-lives of each protein have been given constant values based on known data. Half-lives of hemoglobin A1c and fructosamine are 28.7 and 16.5 days, respectively (93). These are stable in healthy adults absent of interfering conditions (94, 95). Using the same constants for pH, temperature, and half-lives of hemoglobin A1c and fructosamine allow for individual sequential analysis. Troponin I has a half-life calculated as short as 2–4 h and as long as 3.2 days dependent on ischemic or stable conditions (96–98). In this model a half-life constant of 1 day has been used in all cTnI calculations. The half-life of LDL has been determined to be 2–4 days and in these calculations 3 days has been used as the half-life constant (99, 100). These could be adjusted within the formulas for specific subsets and indications.
2.5.3 Mathematical model: formula calculations
Glycation is a physiological reaction which has an optimal rate. Using A1c as a reference, the optimum is approximated at 31 mmol/mol (5.0%). Values above and below 31 mmol/ mol have an increasing cardiac mortality risk (101). While glycation could be reduced by lowering the glucose concentration to an A1c < 31 mmol/mol, the available glucose for critical metabolic functions would also be reduced. There is a linear correlation between A1c and fructosamine. A fructosamine concentration of 200 umol/L has been calculated to be equivalent to an A1c of 31 mmol/mol (102). This value is also used in the calculations as the optimal glycation rate of plasma protein. Calculation of the relative increase in glycation for an individual is based on the optimal value of 1.0 and expressed as a ratio. Calculation of a glycation rate requires the use of the slope-intercept equation with the formula m = (Y2 − Y1)/(X2 − X1); b = Y1 − m∗X1 (103). The half-lives of A1c, fructosamine, LDL and troponin I (28.7, 16.5, 3, and 1 day(s), respectively) are the X variables (93–100). The ratios of individual glycation rates to the optimal are the Y variables. The following example illustrates the calculations for an individual with an A1c of 39 mmol/L (5.7%) and fructosamine of 240 umol/L.
Calculation for relative troponin I glycation rate (TGR)
A1c 5.7% (39 mmol/mol)/5.0 (31 mmol/mol) = 126% (1.26).
Fructosamine 240 umol/L/200 umol/L = 120% (1.20).
Plotting the slope-intercept formula:
(A1c) X1 = 28.7, Y1 = 1.26.
(fructosamine) X2 = 16.5, Y2 = 1.20.
(troponin I) X3 = 1: Y3 =?
Y3 = m(X3) + b.
m = 0.0049 b = 1.12.
Y3 = troponin glycation rate (TGR) = 1.12 (12% above optimum).
Calculation for relative LDL glycation rate (LGR).
(A1c) X1 = 28.7, Y1 = 1.26.
(fructosamine) X2 = 16.5, Y2 = 1.20.
(LDL) X3 = 3, Y3 =?
Y3 = m(X3) + b.
m = 0.0049 b = 1.12.
Y3 = LDL glycation rate (LGR) = 1.13 (13% above optimum).
2.5.4 Mathematical model: biomarker metrics
Troponin glycation rate (TGR): the relative rate of glycation for troponin I expressed as a ratio to the optimum of 1.0.
Troponin glycation index (TGI): the calculation of the total troponin glycated cTnI × TGR = TGI.
LDL glycation rate (LGR): the relative rate of glycation for LDL expressed as a ratio to the optimum of 1.0.
LDL glycation index (LGI): the calculation of the total LDL glycated LDL × LGR = LGI.
2.5.5 Mathematical model: calculated range of TGI and LGI
Glycated troponin (TGI)
Lowest troponin glycation index (TGI) is A1c 31 mmol/mol and fructosamine 200 umol/L (relative value of 1.0) X troponin I 1.6 ng/L [limit of detection] (104) = 1.0 × 1.6 = 1.6.
Highest troponin index (TGI) is 48 mmol/mol and fructosamine 285 umol/L (relative value of 1.5) X troponin I 4.5 ng/L for women = 6.75 and 1.5 × 5 ng/L for men = 7.5.
Glycated LDL (LGI)
Lowest LDL glycation index is A1c 31 mmol/mol and fructosamine 200 umol/L (relative value of 1.0) X LDL 60 mg/dL = 1.0 × 60 = 60.
Highest LDL glycation index is A1c 48 mmol/mol and/ructosamine 285 umol/L (relative value of 1.5) × 180 = 270.
Limiting and exclusionary factors: A1c > 46 mmol/mol (>6.4%) suggests diabetes mellitus (105): LDL > 180 mg/dL suggests severe hyperlipidemia (106): troponin I > 4.5 ng/L for women and > 5 ng/L for men suggests cardiac ischemia or injury (65, 67, 69). These are the exclusionary limits used for the above calculations but can be modified.
Calculated ranges for:
TGI: 1.6–6.75 (women): 1.6–7.5 (men).
LGI: 80–270.
TGR and LGR 1.0–1.5.
Quartile ranges in Table 1 are determined from the above data. The upper limit cTnI concentration of exclusion for men could use values between 5–7 ng/L (65, 67, 69, 70, 107) by adjusting the ROC curve. The present calculations have used 5 ng/L to improve sensitivity.
Table 1
| Quartiles | Troponin I (ng/L) | Troponin glycation rate (TGR) | Troponin glycation index (TGI) | LDL (mg/dl) | LDL glycation rate (LGR) | LDL glycation index (LGI) |
|---|---|---|---|---|---|---|
| 1 | 1.6–2.4a | 1.0–1.15 | 1.6–2.8 | 60–90d | 1.0–1.15 | 60–104 |
| 2 | 2.5–3.3 | 1.16–1.31 | 2.9–4.3 | 91–121 | 1.16–1.31 | 105–160 |
| 3 | 3.4–4.5/5.0b | 1.32–1.50 | 4.4–6.75/7.5c | 122–152 | 1.32–1.50 | 161–228 |
| 4 | >4.5: femaleb | >1.50e | >6.75c | 153–180 | >1.50e | 229–270 |
| 4 | >5.0: maleb | >1.50e | >7.5c | 153–180 | >1.50e | 229–270 |
Quartiles for biomarkers and metrics.
Upper allowable limits for the calculations are: LDL: 180 mg/dl. A1c: 48 mmol/mol (6.5%). Fructosamine: 285 umol/L. Troponin I: 4.5 ng/L for females and 5 ng/L for males. a1.6 ng/L is the limit of detection (LOD) for troponin I assay (104). bROC risk cut off for females >4.5 ng/L and males >5 ng/L (65, 67, 69). cTGI >6.75 for females: > 7.5 for males. d60–80 mg/dL is concentration limiting atherosclerosis development (86). e>1.5 requires exclusionary value of A1c > 48 mmol/mol (>6.5%).
3 Application of the model to evaluate a simulated healthy adult
Algorithm analysis and report: the results of the algorithm calculations are shown in this section. The accuracy of this algorithm is dependent on the repetitive use of monitoring from age 20–30 to age 60. It requires sequential annual use or proposed timeline. A single determination is inadequate. Infrequent and delayed monitoring can lead to inaccuracies.
Table 1 illustrates quartiles for biomarkers and metrics as calculated from the data noted in the previous section. These limits can be adjusted as needed. An example would be the lower limit of detection (LOD) for cTnI. If the assay improves and has a lower LOD the new value could be substituted. In addition, the upper limit of cTnI for exclusion could be adjusted independently to adjust the specificity and sensitivity. Quartiles could also be adjusted for specific data analysis.
Table 2 illustrates a spreadsheet for a simulated individual at annual intervals for 4 years. The 4 biomarker and 4 calculated metrics are entered in the specified columns. The predicted values for the next year (2026) are calculated by a linear regression equation (108). In this example the individual progresses from normal to prediabetic classification as determined by A1c (105). This data can be formatted into a final report using Table 1.
Figure 2 illustrates glycation of troponin I (TGI) in two simulated individuals. One pattern demonstrates a normal individual while the other an individual who develops prediabetes. The baseline point of reference for both is the optimum value of 1.6 as noted in the previous section. Over 30 years the normal and the prediabetic individuals have increased TGR from 1.0 to 1.11 and 1.0 to 1.24, respectively. In the same amount of time the cTnI value for the normal individual increased to 2.6 ng/L and the prediabetic individual to 3.4 ng/L. The greater TGR in the prediabetic individual produced a proportionally higher cTnI (44). The prediabetic individual produced twice the amount of glycated troponin I (TGI) over 30 years calculated by area under the curve (AUC) (109). This would cause increased myocardial aging.
Figure 3 illustrates glycation of LDL (LGI) over a 30-year span using the same data as for the previous TGI calculation. The LGR for the normal individual increased from 1.0 to 1.11 and for the prediabetic individual from 1.0 to 1.25. The LDL increased from 60 mg/dL to 100 mg/dL and from 60 mg/dL to 140 mg/dL in the normal and the prediabetic individuals, respectively. Altered metabolic effects in prediabetic individuals cause proportionately higher LDL concentrations (110). The changes noted in the prediabetic individual produced more than a doubling in the amount of LDL glycated (LGI) compared to the normal. The doubling of LDL and troponin I glycated in individuals with prediabetes increases the rate in deterioration of cardiovascular tissue. This is significant as prediabetes affects 38–46% of the general population (111, 112).
Sequential changes in biomarker and metric patterns.
Table 2
| DATE | A1c (%) | A1c mmol/mol | Fructosamine (umol/L) | Troponin I (ng/L) cTnI | Troponin glycation rate (TGR) | Troponin glycation index (TGI) TGR X cTnI | LDL (mg/dl) | LDL glycation rate (LGR) | LDL glycation index (LGI) LGR X LDL |
|---|---|---|---|---|---|---|---|---|---|
| 2022 | 5.5 | 37 | 230 | 2.6 | 1.1 | 2.9 | 110 | 1.1 | 121 |
| 2023 | 5.5 | 37 | 230 | 3.0 | 1.1 | 3.3 | 120 | 1.1 | 132 |
| 2024 | 5.7 | 39 | 240 | 3.2 | 1.12 | 3.6 | 125 | 1.14 | 143 |
| 2025 | 6.0 | 42 | 262 | 3.4 | 1.26 | 4.3 | 130 | 1.27 | 165 |
| 2026a | 6.1 | 43 | 267 | 3.7 | 1.25 | 4.6 | 137 | 1.33 | 176 |
Representative report.
Representative annual report for biomarkers and metrics of a simulated individual. aRepresents predicted 2026 results.
Figure 2
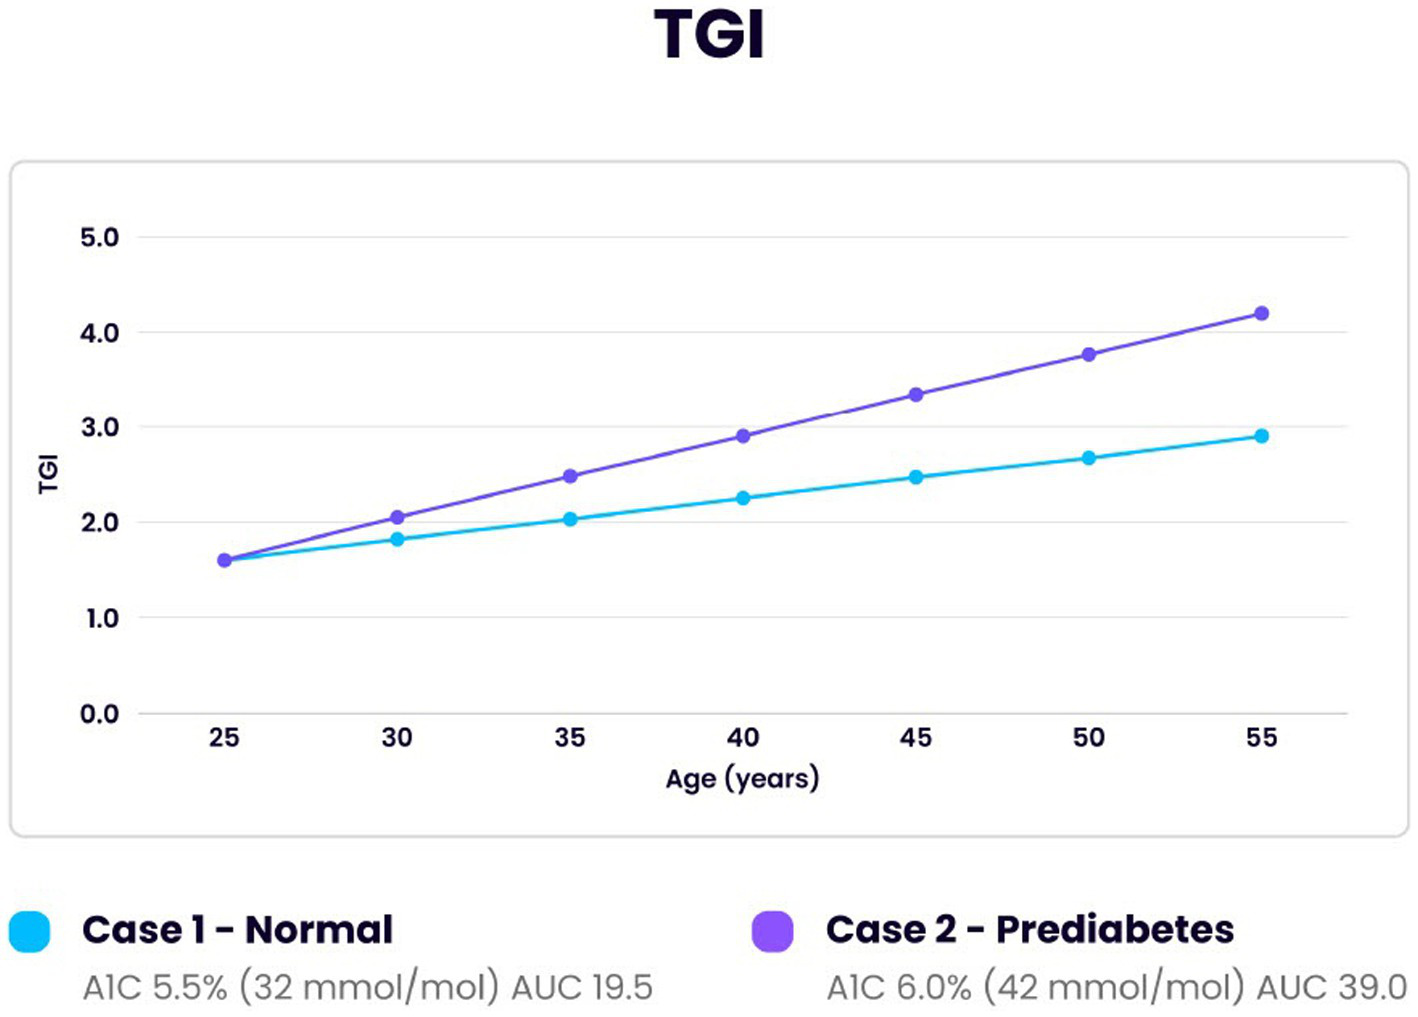
Comparison of Troponin I glycation index (TGI) over 30 years for one individual developing prediabetes and one normal individual. Initial reference point at age 25 for both was with the same optimal reference TGI of 1.6, A1c 31 mmol/mol (5.0%), TGR 1.0 and cTnI 1.6 ng/L. Area under the curve (AUC) revealed a doubling of the amount of myocardial tissue glycated in the prediabetic individual compared to the normal (39/19.5).
Figure 3
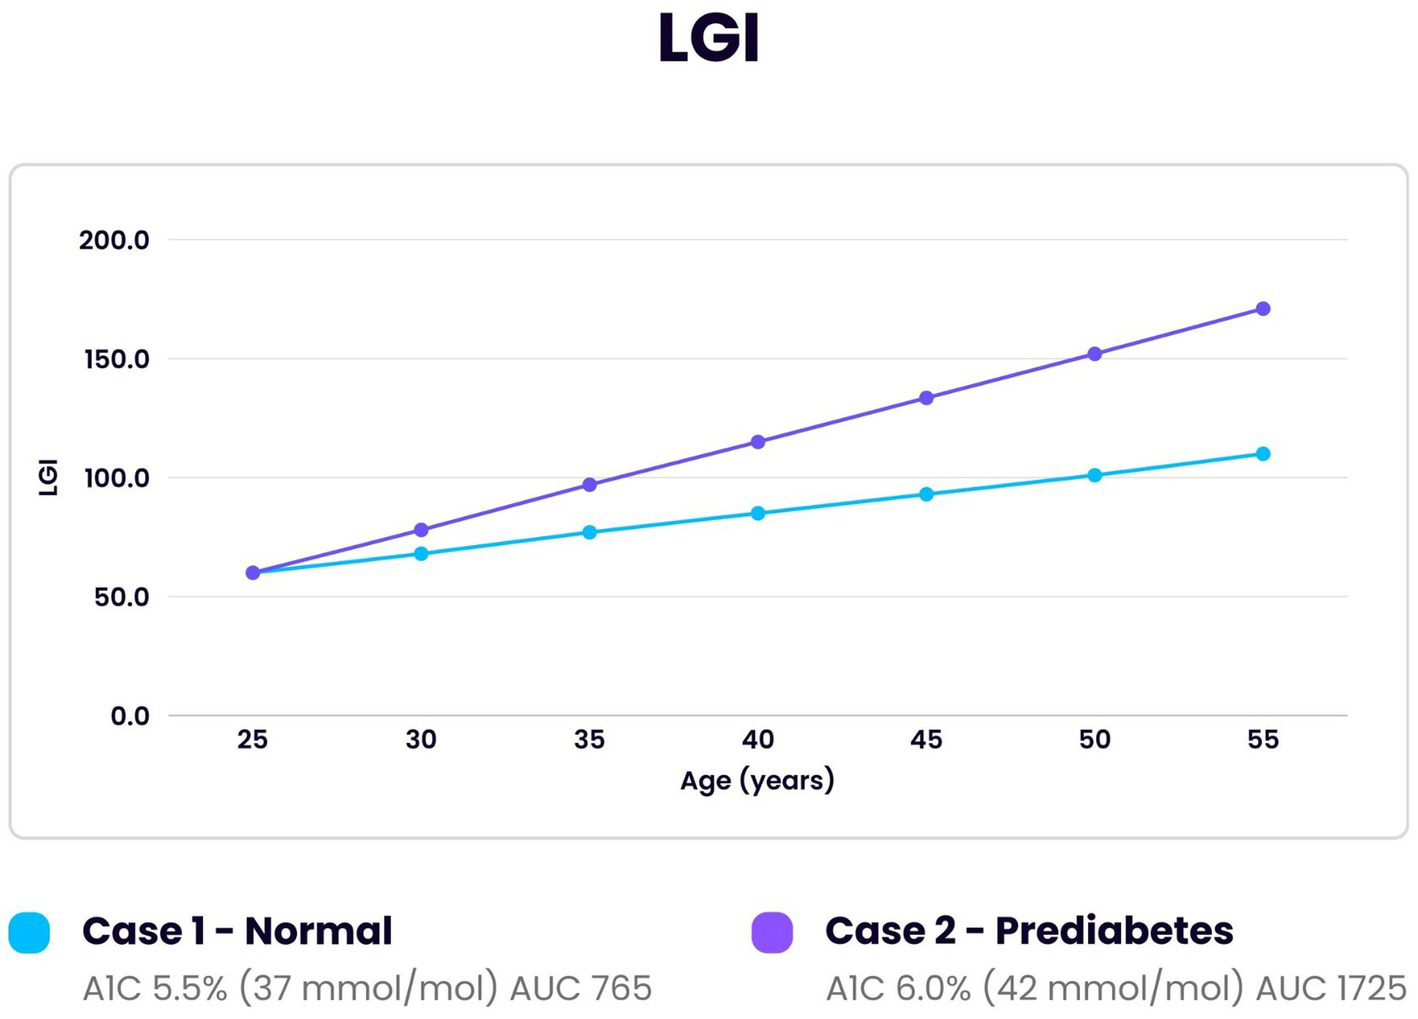
Comparison of LDL glycation index (LGI) over 30 years in an individual developing prediabetes and one normal individual. Initial reference point at age 25 for both was LGI 60, A1c 31 mmol/mol (5.0%), LGR 1.0 and LDL 60 mg/dL. The area under the curve (AUC) for the individual with prediabetes demonstrated greater than twice the amount of LDL glycated compared to the normal individual (1725/765).
Table 2 illustrates an example of an increase in cTnI concentrations over a 4-year period. Group data has shown an increase of cTnI over longer periods of time (68, 70). This was well documented in the large MORGAM/BiomarCaRE study of individuals from ages 30–60 (65). Circulating troponin in healthy adults represents release into the blood because of marginal ischemia or remodeling with the circulating concentration proportional to the release rate (39, 76, 77, 79, 113). Evaluation of the biomarkers and their metrics could determine possible causes of changes of cTnI. A parallel increase of TGR with cTnI increase would suggest glycation as the cause of the change: if TGR did not increase at a proportional rate then other factors such as hypertension could be a cause (74). Declines in cTnI concentrations can occur with medications such as statins (69). Statins lower cTnI and LDL, but do not lower glucose (114). The lowering of LDL by statins reduces the substrate of the glycation reaction. This would reduce AGE production, and the troponin release would decline. This pattern was seen in the SPRINT trial correlating improved blood pressure control with lowered troponin concentrations and cardiac risk independent of lipids or glucose (114, 115). Lifestyle changes such as diet and exercise also can lower LDL, troponin and glycation (116–118). Each individual would have a biomarker pattern dependent on their own lifestyle, genetics, and metabolism. Glycation is a major determinant in the biomarker variations. The age-related increase in cTnI is due in part to the parallel increase in A1c and resultant glycation. The prevalence of prediabetes with A1c 39–46 mmol/mol has increased 3-fold in adolescents ages 12–19 between 1999–2020 (119, 120). This creates a greater degree of glycation before 20 years of age (120, 121). The effect of glycation is further magnified by LDL which increases in men by 64% from age 20–49 and in women by 42% from age 35–59 (122). The increase in these biomarkers and their metrics with advancing age (61–63, 69) adds to the complexity of the sequential patterns. Because of the individual variability of the biomarkers and metrics due to age, health and medication adjustments, predictive analysis over the long term would be difficult and often inaccurate.
4 Discussion
Cardiovascular disease is the most common cause of death in both men and women in the USA. The mortality rate exceeds that of cancer and accidents combined (123). While treatment advances have reduced the mortality rate over the last 25 years it has continued to be the most common cause of death (124). Glycation is a non-enzymatic irreversible reaction which has a significant impact on cardiovascular disease. It occurs universally with any adduct of a carbohydrate and a substrate of protein, lipid or nucleic acid (26). It was originally described by a French chemist and chef Louis-Camille Maillard in 1912 during food preparation (125) and has been used in diverse applications. The physical properties of the substrate as well as the carbohydrate concentration are primary factors in determining the glycation rate (26, 27). Glycation in humans by glucose is an integral determinant of aging (28, 32, 126). The effect on tissue is permanent: only regeneration or replacement can repair it. The myocardium has a minimal turnover and repair rate of 1% or less per year (35–39). Therefore, critical myocardial tissues are significantly affected by marginal increases in glycation over a lifetime due to the production of catabolic and inflammatory AGE. Each individual has a unique genetic, environmental and metabolic signature (88, 127). As a result, the analysis of group data has not been shown to be effective in reducing cardiac risk (7, 128, 129). A dedicated algorithm is needed to calculate the changes in glycation rate using an individual’s sequential data. Specific blood biomarkers can be used to calculate the needed data by acting as a proxy for the in-situ process. Glycation of hemoglobin (A1c) and plasma protein (fructosamine) have the same reaction determinants as troponin I and LDL (27–30). Previous sections detailed the specifics involved in the modeling of the algorithm using the results of available blood tests. The specific laboratory tests required (troponin I, fructosamine, A1c and lipid profile with direct LDL) are available at commercial laboratories for a modest cost. The Center for Medicare and Medicaid Services (CMS) reimbursement rate for the 4 laboratory tests in 2024 was $54.08 (130). These rates are used as guidelines for commercial insurance. The prevalence of heart disease before age 40 is 0.9% (131) which allows the initial values to be used as a baseline for an individual during the years of heart disease progression. Those with initial values outside the targeted range as determined by the provider or guidelines would be referred for evaluation. Increased rates of glycation can counter genetically coded protective mechanisms such as collateral circulation and altered AGE binding on receptors (RAGE) (132–134). The effects of glycation can be demonstrated visually in the aging of skin and connective tissues due to loss of elasticity and irreversible cross linking of collagen. These AGE-induced effects correlate with the rate of aging in cardiovascular tissue (135–139). Software integrating data from multiple organs and tissues could develop an algorithm of human aging. The effects of glycation are magnified by the long reaction time. As seen in Figures 2, 3 a doubling in the amount of cTnI and LDL glycated can occur over 30 years with only a modest increase in A1c from 37 to 42 mmol/mol (5.5–6.0%). An increase in A1c from 39 to 46 mmol/mol (5.7–6.4%) correlates with an increase in AGE of 48% (56). While the glycation reaction can be slowed it is continuous and irreversible (26). Therefore, it is essential to begin sequential testing in early adulthood. Data from the United Kingdom (UK) National Health Service (NHS) shows increase in primary care cost per individual of $450 and hospital cost of $5,000 in the year following a myocardial infarction. This does not include cost of medications or invasive procedures. The 7.6 million living in the UK with heart disease have twice the annual cost of care (140). Preventative care with the laboratory tests and modeling discussed could significantly reduce costs and mortality. Another potential use of the algorithm could be in clinical drug trials as an objective measure comparing placebo and treatment groups. Glucagon-like peptide 1(GLP -1) drugs have been approved for use in individuals with significant heart failure, sleep apnea, or heart disease in type 2 diabetes (141–144). They have been proposed to extend life expectancy (145). Clinical trials of these and other drugs comparing placebo and treatment groups of healthy adults using the data from the algorithm could lead to new treatments in the prevention of heart disease and related conditions. The comparative data could be used to define an endpoint in addition to risk reduction. Groups divided by sex, age and ethnicity could evaluate specific outcomes for each subgroup. The development of new drugs could advance the treatment of those most affected by this silent disease. IHD has wide range in prevalence-based factors such as ethnicity, genetics and race (13). It is especially prevalent in African American women where it affects 47% (146, 147). The use of the developed algorithm could significantly reduce cardiovascular disease in these populations.
5 Limitations
Active smokers have a greater risk of heart disease but have lower troponin I concentrations (148). This could cause erroneous results. Unstable glucose concentrations due to rapid weight gain/ loss or recent medication change could produce discrepancy in A1c and fructosamine correlation and lead to inaccuracies. This could be evaluated by calculating the glycation gap which determines glucose stability (149, 150). Intercurrent conditions such as anemia, as well as acute and chronic illnesses can alter the test results. The testing should be done under direction of medical professionals after history and physical examination supported with routine laboratory tests such as complete blood count (CBC) and comprehensive metabolic profile (CMP). The needed frequency of testing is unknown. Annual testing is postulated to concur with an annual medical examination. More frequent testing could be done to determine changes with additive treatment. Tests results which seem inaccurate or unusual should be repeated. However, the frequency of studies would need to be based on data and consensus. Accurate analysis requires sequential data on a regular timeline such as at annual examinations. It also requires initiation of testing in early adulthood. The ages and intervals for testing would be at the direction of the medical provider and with guidelines from professional associations. Laboratory analysis should be done using the same methodology. Troponin I measurements are often done on different equipment systems which have inter-assay variability (151). It is important to note that the correct manner of use is as a monitoring device and not for diagnostic or treatment recommendations. Single values give only one point of reference, but sequential data can be an effective tool in the prevention of cardiovascular disease. This model and the algorithm are based on theoretical calculations. No clinical trial or original human data is included in the calculations. The algorithm is an adjunctive device for the evaluation of possible cardiovascular disease. Such a tool could be added to the clinical management of every individual. Additional data will need to be assessed with clinical studies.
6 Conclusion
Sequential data from this algorithm could act as a proxy for the process of in situ aging in cardiovascular tissue. The calculations can be done rapidly using the algorithm and 4 commonly used blood biomarkers. Combining presently available laboratory tests with dedicated software provides the clinician an inexpensive noninvasive tool to monitor the development of cardiovascular disease specific for each individual. It could predict individual cardiovascular changes and allow proactive management. This noninvasive monitoring system could be a significant advance in the prevention of cardiovascular disease. Once further investigation determines the usefulness of the algorithm, it should be made available to everyone to counter the global burden of heart disease.
Statements
Data availability statement
The original contributions presented in the study are included in the article/supplementary material, further inquiries can be directed to the corresponding author.
Author contributions
TV: Validation, Methodology, Formal analysis, Supervision, Investigation, Conceptualization, Writing – review & editing, Writing – original draft. CM: Writing – original draft, Formal analysis, Visualization, Methodology, Conceptualization, Writing – review & editing.
Funding
The author(s) declare that no financial support was received for the research and/or publication of this article.
Acknowledgments
We acknowledge Glenn Robertelli in coordinating the research project and article submission.
Conflict of interest
The authors declare that the research was conducted in the absence of any commercial or financial relationships that could be construed as a potential conflict of interest.
Generative AI statement
The authors declare that no Gen AI was used in the creation of this manuscript.
Publisher’s note
All claims expressed in this article are solely those of the authors and do not necessarily represent those of their affiliated organizations, or those of the publisher, the editors and the reviewers. Any product that may be evaluated in this article, or claim that may be made by its manufacturer, is not guaranteed or endorsed by the publisher.
References
1.
Di Cesare M Perel P Taylor S Kabudula C Bixby H Gaziano TA et al . The heart of the world. Glob Heart. (2024) 19:11. doi: 10.5334/gh.1288
2.
Parmley WW . Prevalence and clinical significance of silent myocardial ischemia. Circulation. (1989) 80:IV68–73.
3.
Sajadieh A Nielsen OW Rasmussen V Hein HO Hansen JF . Prevalence and prognostic significance of daily-life silent myocardial ischaemia in middle-aged and elderly subjects with no apparent heart disease. Eur Heart J. (2005) 26:1402–9. doi: 10.1093/eurheartj/ehi169
4.
Pride YB Piccirillo BJ Gibson CM . Prevalence, consequences, and implications for clinical trials of unrecognized myocardial infarction. Am J Cardiol. (2013) 111:914–8. doi: 10.1016/j.amjcard.2012.11.042
5.
Zhang ZM Rautaharju PM Prineas RJ Rodriguez CJ Loehr L Rosamond WD et al . Race and sex differences in the incidence and prognostic significance of silent myocardial infarction in the atherosclerosis risk in communities (ARIC) study. Circulation. (2016) 133:2141–8. doi: 10.1161/CIRCULATIONAHA.115.021177
6.
Tsao CW Aday AW Almarzooq ZI Alonso A Beaton AZ Bittencourt MS et al . Heart disease and stroke Statistics-2022 update: a report from the American Heart Association. Circulation. (2022) 145:e153–639. doi: 10.1161/CIR.0000000000001052
7.
Andersson C Nayor M Tsao CW Levy D Vasan RS . Framingham heart study: JACC focus seminar, 1/8. J Am Coll Cardiol. (2021) 77:2680–92. doi: 10.1016/j.jacc.2021.01.059
8.
Fernández-Friera L Peñalvo JL Fernández-Ortiz A Ibañez B López-Melgar B Laclaustra M et al . Prevalence, vascular distribution, and multiterritorial extent of subclinical atherosclerosis in a middle-aged cohort: the PESA (progression of early subclinical atherosclerosis) study. Circulation. (2015) 131:2104–13. doi: 10.1161/CIRCULATIONAHA.114.014310
9.
Darrab S Broneske D Saake G . Exploring the predictive factors of heart disease using rare association rule mining. Sci Rep. (2024) 14:18178. doi: 10.1038/s41598-024-69071-6
10.
Helgason H Eiriksdottir T Ulfarsson MO Choudhary A Lund SH Ivarsdottir EV et al . Evaluation of large-scale proteomics for prediction of cardiovascular events. JAMA. (2023) 330:725–35. doi: 10.1001/jama.2023.13258
11.
McSweeney JC Cody M O'Sullivan P Elberson K Moser DK Garvin BJ . Women's early warning symptoms of acute myocardial infarction. Circulation. (2003) 108:2619–23. doi: 10.1161/01.CIR.0000097116.29625.7C
12.
Roy R Aldiwani H Darouian N Sharma S Torbati T Wei J et al . Ambulatory and silent myocardial ischemia in women with coronary microvascular dysfunction: results from the cardiac autonomic nervous system study (CANS). Int J Cardiol. (2020) 316:1–6. doi: 10.1016/j.ijcard.2020.04.030
13.
Leigh JA Alvarez M Rodriguez CJ . Ethnic minorities and coronary heart disease: an update and future directions. Curr Atheroscler Rep. (2016) 18:9. doi: 10.1007/s11883-016-0559-4
14.
Arbab-Zadeh A . Stress testing and non-invasive coronary angiography in patients with suspected coronary artery disease: time for a new paradigm. Heart Int. (2012) 7:e2. doi: 10.4081/hi.2012.e2
15.
Oseran AS Ati S Feldman WB Gondi S Yeh RW Wadhera RK . Assessment of prices for cardiovascular tests and procedures at top-ranked US hospitals. JAMA Intern Med. (2022) 182:996–9. doi: 10.1001/jamainternmed.2022.2602
16.
Centers for Medicare and Medicaid Services (2024). Medicare utilization for part B. Available online at: http://www.cms.gov/Research-Statistics-Data-and-Systems/Statistics-Trends-and-Reports/MedicareFeeforSvcPartsAB/MedicareUtilizationforPartB.html (accessed September 24, 2024).
17.
Fonseca R Negishi K Otahal P Marwick TH . Temporal changes in appropriateness of cardiac imaging. J Am Coll Cardiol. (2015) 65:763–73. doi: 10.1016/j.jacc.2014.11.057
18.
Kazi DS Elkind MSV Deutsch A Dowd WN Heidenreich P Khavjou O et al . Forecasting the economic burden of cardiovascular disease and stroke in the United States through 2050: a presidential advisory from the American Heart Association. Circulation. (2024) 150:e89:–e101. doi: 10.1161/CIR.0000000000001258
19.
Blankenberg S Salomaa V Makarova N Ojeda F Wild P Lackner KJ et al . Troponin I and cardiovascular risk prediction in the general population: the BiomarCaRE consortium. Eur Heart J. (2016) 37:2428–37. doi: 10.1093/eurheartj/ehw172
20.
Sze J Mooney J Barzi F Hillis GS Chow CK . Cardiac troponin and its relationship to cardiovascular outcomes in community populations - a systematic review and Meta-analysis. Heart Lung Circ. (2016) 25:217–28. doi: 10.1016/j.hlc.2015.09.001
21.
Ference BA Ginsberg HN Graham I Ray KK Packard CJ Bruckert E et al . Low-density lipoproteins cause atherosclerotic cardiovascular disease. 1. Evidence from genetic, epidemiologic, and clinical studies. A consensus statement from the European atherosclerosis society consensus panel. Eur Heart J. (2017) 38:2459–72. doi: 10.1093/eurheartj/ehx144
22.
Pai JK Cahill LE Hu FB Rexrode KM Manson JE Rimm EB . Hemoglobin a1c is associated with increased risk of incident coronary heart disease among apparently healthy, nondiabetic men and women. J Am Heart Assoc. (2013) 2:e000077. doi: 10.1161/JAHA.112.000077
23.
Warren B Rawlings AM Lee AK Grams M Coresh J Selvin E . Increases in biomarkers of hyperglycemia with age in the atherosclerosis risk in communities (ARIC) study. Diabetes Care. (2017) 40:e96–7. doi: 10.2337/dc17-0075
24.
Blake GM Fogelman I . The role of DXA bone density scans in the diagnosis and treatment of osteoporosis. Postgrad Med J. (2007) 83:509–17. doi: 10.1136/pgmj.2007.057505
25.
Bhuiyan A Govindaiah A Smith RT . External validation of four cardiovascular risk predication models. J Clin Cardiol. (2024) 5:73–80. doi: 10.33696/cardiology.5.057
26.
Rabbani N Thornalley PJ . Protein glycation - biomarkers of metabolic dysfunction and early-stage decline in health in the era of precision medicine. Redox Biol. (2021) 42:101920. doi: 10.1016/j.redox.2021.101920
27.
Jakubowski H Flatt P . Chapter 6.2: kinetics without enzymes In: JainJL, editor. Fundamentals of biochemistry. Davis, CA: Libre Text Biology (2022)
28.
Chaudhuri J Bains Y Guha S Kahn A Hall D Bose N et al . The role of advanced glycation end products in aging and metabolic diseases: bridging association and causality. Cell Metab. (2018) 28:337–52. doi: 10.1016/j.cmet.2018.08.014
29.
Lindsey JB Cipollone F Abdullah SM McGuire DK . Receptor for advanced glycation end-products (RAGE) and soluble RAGE (sRAGE): cardiovascular implications. Diab Vasc Dis Res. (2009) 6:7–14. doi: 10.3132/dvdr.2009.002
30.
Uceda AB Mariño L Casasnovas R Adrover M . An overview on glycation: molecular mechanisms, impact on proteins, pathogenesis, and inhibition. Biophys Rev. (2024) 16:189–218. doi: 10.1007/s12551-024-01188-4
31.
de la Cruz-Ares S Cardelo MP Gutiérrez-Mariscal FM Torres-Peña JD García-Rios A Katsiki N et al . Endothelial dysfunction and advanced glycation end products in patients with newly diagnosed versus established diabetes: from the CORDIOPREV study. Nutrients. (2020) 12:238. doi: 10.3390/nu12010238
32.
Deo P Dhillon VS Lim WM Jaunay EL Donnellan L Peake B et al . Advanced glycation end-products accelerate telomere attrition and increase pro-inflammatory mediators in human WIL2-NS cells. Mutagenesis. (2020) 35:291–7. doi: 10.1093/mutage/geaa012
33.
Lyons TJ . Glycation and oxidation: a role in the pathogenesis of atherosclerosis. Am J Cardiol. (1993) 71:B26–31. doi: 10.1016/0002-9149(93)90142-y
34.
Bucala R Makita Z Koschinsky T Cerami A Vlassara H . Lipid advanced glycosylation: pathway for lipid oxidation in vivo. Proc Natl Acad Sci USA. (1993) 90:6434–8. doi: 10.1073/pnas.90.14.6434
35.
Falcone C Emanuele E D'Angelo A Buzzi MP Belvito C Cuccia M et al . Plasma levels of soluble receptor for advanced glycation end products and coronary artery disease in nondiabetic men. Arterioscler Thromb Vasc Biol. (2005) 25:1032–7. doi: 10.1161/01.ATV.0000160342.20342.00
36.
Kosmopoulos M Drekolias D Zavras PD Piperi C Papavassiliou AG . Impact of advanced glycation end products (AGEs) signaling in coronary artery disease. Biochim Biophys Acta Mol basis Dis. (2019) 1865:611–9. doi: 10.1016/j.bbadis.2019.01.006
37.
Robles-Rivera K Rivera-Paredez B Quezada-Sanchéz AD Velázquez-Cruz R Salmerón J . Advanced glycation end products are associated with cardiovascular risk in the Mexican population. Nutr Metab Cardiovasc Dis. (2023) 33:826–34. doi: 10.1016/j.numecd.2022.12.028
38.
Lamprea-Montealegre JA Arnold AM McCLelland RL Mukamal KJ Djousse L Biggs ML et al . Plasma levels of advanced glycation end products and risk of cardiovascular events: findings from 2 prospective cohorts. J Am Heart Assoc. (2022) 11:e024012. doi: 10.1161/JAHA.121.024012
39.
Parmacek MS Epstein JA . Cardiomyocyte renewal. N Engl J Med. (2009) 361:86–8. doi: 10.1056/NEJMcibr0903347
40.
Bunn HF Haney DN Kamin S Gabbay KH Gallop PM . The biosynthesis of human hemoglobin A1c. Slow glycosylation of hemoglobin in vivo. J Clin Invest. (1976) 57:1652–9. doi: 10.1172/JCI108436
41.
Malka R Nathan DM Higgins JM . Mechanistic modeling of hemoglobin glycation and red blood cell kinetics enables personalized diabetes monitoring. Sci Transl Med. (2016) 8:359ra130. doi: 10.1126/scitranslmed.aaf9304
42.
Freeman VS . Glucose and hemoglobin A1c. Lab Med. (2014) 45:e21–4. doi: 10.1309/LMNSU432YJWCWZKX
43.
Ribeiro RT Macedo MP Raposo JF . HbA1c, fructosamine, and glycated albumin in the detection of dysglycaemic conditions. Curr Diabetes Rev. (2016) 12:14–9. doi: 10.2174/1573399811666150701143112
44.
Selvin E Rawlings AM Lutsey PL Maruthur N Pankow JS Steffes M et al . Fructosamine and glycated albumin and the risk of cardiovascular outcomes and death. Circulation. (2015) 132:269–77. doi: 10.1161/CIRCULATIONAHA.115.015415
45.
Shin A Vazmitsel Y Connolly S Kabytaev K . Comprehensive profiling and kinetic studies of glycated lysine residues in human serum albumin. Anal Bioanal Chem. (2022) 414:4861–75. doi: 10.1007/s00216-022-04108-1
46.
Arasteh A Farahi S Habibi-Rezaei M Moosavi-Movahedi AA . Glycated albumin: an overview of the in vitro models of an in vivo potential disease marker. J Diabetes Metab Disord. (2014) 13:49. doi: 10.1186/2251-6581-13-49
47.
Soboleva A Mavropulo-Stolyarenko G Karonova T Thieme D Hoehenwarter W Ihling C et al . Multiple glycation sites in blood plasma proteins as an integrated biomarker of type 2 diabetes mellitus. Int J Mol Sci. (2019) 20:2329. doi: 10.3390/ijms20092329
48.
Jagadeeshaprasad MG Venkatasubramani V Unnikrishnan AG Kulkami MJ . Albumin abundance and its glycation status determine hemoglobin glycation. ACS Omega. (2018) 3:12999–3008. doi: 10.1021/acsomega.8b01702
49.
de Jong M Woodward M Peters SAE . Diabetes, glycated hemoglobin, and the risk of myocardial infarction in women and men: a prospective cohort study of the UK biobank. Diabetes Care. (2020) 43:2050–9. doi: 10.2337/dc19-2363
50.
Malmström H Walldius G Grill V Jungner I Hammar N . Fructosamine is a risk factor for myocardial infarction and all-cause mortality - longitudinal experience from the AMORIS cohort. Nutr Metab Cardiovasc Dis. (2015) 25:943–50. doi: 10.1016/j.numecd.2015.07.002
51.
Rossello X Raposeiras-Roubin S Oliva B Sánchez-Cabo F García-Ruíz JM Caimari F et al . Glycated hemoglobin and subclinical atherosclerosis in people without diabetes. J Am Coll Cardiol. (2021) 77:2777–91. doi: 10.1016/j.jacc.2021.03.335
52.
Welsh KJ Kirkman MS Sacks DB . Role of glycated proteins in the diagnosis and management of diabetes: research gaps and future directions. Diabetes Care. (2016) 39:1299–306. doi: 10.2337/dc15-2727
53.
Hirai T Fujiyoshi K Yamada S Matsumoto T Kikuchi J Ishida K et al . Advanced glycation end products are associated with diabetes status and physical functions in patients with cardiovascular disease. Nutrients. (2022) 14:3032. doi: 10.3390/nu14153032
54.
Wolffenbuttel BH Giordano D Founds HW Bucala R . Long-term assessment of glucose control by haemoglobin-AGE measurement. Lancet. (1996) 347:513–5. doi: 10.1016/s0140-6736(96)91141-1
55.
Di Pino A Scicali R Calanna S Urbano F Mantegna C Rabuazzo AM et al . Cardiovascular risk profile in subjects with prediabetes and new-onset type 2 diabetes identified by HbA(1c) according to American Diabetes Association criteria. Diabetes Care. (2014) 37:1447–53. doi: 10.2337/dc13-2357
56.
Di Pino A Urbano F Zagami RM Filippello A Di Mauro S Piro S et al . Low endogenous secretory receptor for advanced glycation end-products levels are associated with inflammation and carotid atherosclerosis in prediabetes. J Clin Endocrinol Metab. (2016) 101:1701–9. doi: 10.1210/jc.2015-4069
57.
Di Pino A Mangiafico S Urbano F Scicali R Scandura S D'Agate V et al . HbA1c identifies subjects with prediabetes and subclinical left ventricular diastolic dysfunction. J Clin Endocrinol Metab. (2017) 102:3756–64. doi: 10.1210/jc.2017-00954
58.
de Wit-Verheggen VHW van de Weijer T . Changes in cardiac metabolism in prediabetes. Biomol Ther. (2021) 11:1680. doi: 10.3390/biom11111680
59.
Takeda S Yamashita A Maeda K Maéda Y . Structure of the core domain of human cardiac troponin in the ca (2+)-saturated form. Nature. (2003) 424:35–41. doi: 10.1038/nature01780
60.
Marston S Zamora JE . Troponin structure and function: a view of recent progress. J Muscle Res Cell Motil. (2020) 41:71–89. doi: 10.1007/s10974-019-09513-1
61.
McEvoy JW Daya N Tang O Fang M Ndumele CE Coresh J et al . High-sensitivity troponins and mortality in the general population. Eur Heart J. (2023) 44:2595–605. doi: 10.1093/eurheartj/ehad328
62.
Welsh P Preiss D Hayward C Shah ASV McAllister D Briggs A et al . Cardiac troponin T and troponin I in the general population. Circulation. (2019) 139:2754–64. doi: 10.1161/CIRCULATIONAHA.118.038529
63.
Aeschbacher S Schoen T Bossard M van der Lely S Glättli K Todd J et al . Relationship between high-sensitivity cardiac troponin I and blood pressure among young and healthy adults. Am J Hypertens. (2015) 28:789–96. doi: 10.1093/ajh/hpu226
64.
Zeller T Tunstall-Pedoe H Saarela O Ojeda F Schnabel RB Tuovinen T et al . High population prevalence of cardiac troponin I measured by a high-sensitivity assay and cardiovascular risk estimation: the MORGAM biomarker project Scottish cohort. Eur Heart J. (2014) 35:271–81. doi: 10.1093/eurheartj/eht406
65.
Hughes MF Ojeda F Saarela O Jørgensen T Zeller T Palosaari T et al . Association of repeatedly measured high-sensitivity-assayed troponin I with cardiovascular disease events in a general population from the MORGAM/BiomarCaRE study. Clin Chem. (2017) 63:334–42. doi: 10.1373/clinchem.2016.261172
66.
Lyngbakken MN Røsjø H Holmen OL Nygård S Dalen H Hveem K et al . Gender, high-sensitivity troponin I, and the risk of cardiovascular events (from the Nord-Trøndelag health study). Am J Cardiol. (2016) 118:816–21. doi: 10.1016/j.amjcard.2016.06.043
67.
Samman Tahhan A Sandesara P Hayek SS Hammadah M Alkhoder A Kelli HM et al . High-sensitivity troponin I levels and coronary artery disease severity, progression, and long-term outcomes. J Am Heart Assoc. (2018) 7:e007914. doi: 10.1161/JAHA.117.007914
68.
de Bakker M Anand A Shipley M Fujisawa T Shah ASV Kardys I et al . Sex differences in cardiac troponin trajectories over the life course. Circulation. (2023) 147:1798–808. doi: 10.1161/CIRCULATIONAHA.123.064386
69.
Ford I Shah AS Zhang R McAllister DA Strachan FE Caslake M et al . High-sensitivity cardiac troponin, statin therapy, and risk of coronary heart disease. J Am Coll Cardiol. (2016) 68:2719–28. doi: 10.1016/j.jacc.2016.10.020
70.
Kimenai DM Shah ASV McAllister DA Lee KK Tsanas A Meex SJR et al . Sex differences in cardiac troponin I and T and the prediction of cardiovascular events in the general population. Clin Chem. (2021) 67:1351–60. doi: 10.1093/clinchem/hvab109
71.
Salton CJ Chuang ML O'Donnell CJ Kupka MJ Larson MG Kissinger KV et al . Gender differences and normal left ventricular anatomy in an adult population free of hypertension. A cardiovascular magnetic resonance study of the Framingham heart study offspring cohort. J Am Coll Cardiol. (2002) 39:1055–60. doi: 10.1016/s0735-1097(02)01712-6
72.
McKie PM Heublein DM Scott CG Gantzer ML Mehta RA Rodeheffer RJ et al . Defining high-sensitivity cardiac troponin concentrations in the community. Clin Chem. (2013) 59:1099–107. doi: 10.1373/clinchem.2012.198614
73.
Kaura A Panoulas V Glampson B Davies J Mulla A Woods K et al . Association of troponin level and age with mortality in 250 000 patients: cohort study across five UK acute care centres. BMJ. (2019) 367:l6055. doi: 10.1136/bmj.m2225
74.
Jeremias A Gibson CM . Narrative review: alternative causes for elevated cardiac troponin levels when acute coronary syndromes are excluded. Ann Intern Med. (2005) 142:786–91. doi: 10.7326/0003-4819-142-9-200505030-00015
75.
Wu C Singh A Collins B Fatima A Qamar A Gupta A et al . Causes of troponin elevation and associated mortality in young patients. Am J Med. (2018) 131:284–92. doi: 10.1016/j.amjmed.2017.10.026
76.
Hammarsten O Mair J Möckel M Lindahl B Jaffe AS . Possible mechanisms behind cardiac troponin elevations. Biomarkers. (2018) 23:725–34. doi: 10.1080/1354750X.2018.1490969
77.
Chaulin AM . The metabolic pathway of cardiac troponins release: mechanisms and diagnostic role. Cardiol Res. (2022) 13:190–205. doi: 10.14740/cr1351
78.
Janssens JV Ma B Brimble MA Van Eyk JE Delbridge LMD Mellor KM . Cardiac troponins may be irreversibly modified by glycation: novel potential mechanisms of cardiac performance modulation. Sci Rep. (2018) 8:16084. doi: 10.1038/s41598-018-33886-x
79.
Delligatti CE Kirk JA . Glycation in the cardiomyocyte. Vitam Horm. (2024) 125:47–88. doi: 10.1016/bs.vh.2024.04.005
80.
Poznyak AV Sukhorukov VN Surkova R Orekhov NA Orekhov AN . Glycation of LDL: AGEs, impact on lipoprotein function, and involvement in atherosclerosis. Front Cardiovasc Med. (2023) 10:1094188. doi: 10.3389/fcvm.2023.1094188
81.
Younis N Soran H Sharma R Pemberton P Charlt-on-Menys V France M et al . Glycation of LDL is an important atherogenic modification and opposed by paraoxonase-rich HDL. Atherosclerosis. (2009) 207:306. doi: 10.1016/j.atherosclerosis.2009.07.004
82.
Sobal G Menzel J Sinzinger H . Why is glycated LDL more sensitive to oxidation than native LDL? A comparative study. Prostaglandins Leukot Essent Fatty Acids. (2000) 63:177–86. doi: 10.1054/plef.2000.0204
83.
Toma L Stancu CS Botez GM Sima AV Simionescu M . Irreversibly glycated LDL induce oxidative and inflammatory state in human endothelial cells; added effect of high glucose. Biochem Biophys Res Commun. (2009) 390:877–82. doi: 10.1016/j.bbrc.2009.10.066
84.
Knott HM Brown BE Davies MJ Dean RT . Glycation and glycoxidation of low-density lipoproteins by glucose and low-molecular mass aldehydes. Formation of modified and oxidized particles. Eur J Biochem. (2003) 270:3572–82. doi: 10.1046/j.1432-1033.2003.03742.x
85.
Abdullah SM Defina LF Leonard D Barlow CE Radford NB Willis BL et al . Long-term association of low-density lipoprotein cholesterol with cardiovascular mortality in individuals at low 10-year risk of atherosclerotic cardiovascular disease. Circulation. (2018) 138:2315–25. doi: 10.1161/CIRCULATIONAHA.118.034273
86.
O'Keefe JH Jr Cordain L Harris WH Moe RM Vogel R . Optimal low-density lipoprotein is 50 to 70 mg/dl: lower is better and physiologically normal. J Am Coll Cardiol. (2004) 43:2142–6. doi: 10.1016/j.jacc.2004.03.046
87.
Keramati T Razi F Tootee A Larijani B . Comparability of hemoglobin A1c level measured in capillary versus venous blood sample applying two point-of-care instruments. J Diabetes Metab Disord. (2014) 13:94. doi: 10.1186/s40200-014-0094-1
88.
Fournet M Bonté F Desmoulière A . Glycation damage: a possible hub for major pathophysiological disorders and aging. Aging Dis. (2018) 9:880–900. doi: 10.14336/AD.2017.1121
89.
National Research Council . (1988). Washington, DC: National Academies Press (US) doi: 10.17226/1097
90.
Hyytiä H Järvenpää ML Ristiniemi N Lövgren T Pettersson K . A comparison of capture antibody fragments in cardiac troponin I immunoassay. Clin Biochem. (2013) 46:963–8. doi: 10.1016/j.clinbiochem.2013.01.012
91.
Hopkins E Sanvictores T Sharma S . Physiology, acid base balance. Treasure Island, FL: StatPearls Publishing (2025).
92.
Cuzzo B Fazili T Javaid W . Normal body temperature: a systematic review. Open Forum Infect Dis. (2019) 6:ofz032. doi: 10.1093/ofid/ofz032
93.
Allgrove J Cockrill BL . Fructosamine or glycated haemoglobin as a measure of diabetic control?Arch Dis Child. (1988) 63:418–22. doi: 10.1136/adc.63.4.418
94.
WHO . Use of glycated haemoglobin (HbA1c) in the diagnosis of diabetes mellitus: Abbreviated report of a WHO consultation. Geneva: World Health Organization (2011).
95.
Danese E Montagnana M Nouvenne A Lippi G . Advantages and pitfalls of fructosamine and glycated albumin in the diagnosis and treatment of diabetes. J Diabetes Sci Technol. (2015) 9:169–76. doi: 10.1177/1932296814567227
96.
Martin AF . Turnover of cardiac troponin subunits. Kinetic evidence for a precursor pool of troponin-I. J Biol Chem. (1981) 256:964–8. doi: 10.1016/S0021-9258(19)70073-8
97.
Chaulin AM . Cardiac troponins metabolism: from biochemical mechanisms to clinical practice (literature review). Int J Mol Sci. (2021) 22:10928. doi: 10.3390/ijms222010928
98.
Kristensen JH Hasselbalch RB Strandkjær N Jørgensen N Østergaard M Møller-Sørensen PH et al . Half-life and clearance of cardiac troponin I and troponin T in humans. Circulation. (2024) 150:1187–98. doi: 10.1161/CIRCULATIONAHA.123.066565
99.
Tames FJ Mackness MI Arrol S Laing I Durrington PN . Non-enzymatic glycation of apolipoprotein B in the sera of diabetic and non-diabetic subjects. Atherosclerosis. (1992) 93:237–44. doi: 10.1016/0021-9150(92)90260-n
100.
Daniels TF Killinger KM Michal JJ Wright RW Jr Jiang Z . Lipoproteins, cholesterol homeostasis and cardiac health. Int J Biol Sci. (2009) 5:474–88. doi: 10.7150/ijbs.5.474
101.
Selvin E Steffes MW Zhu H Matsushita K Wagenknecht L Pankow J et al . Glycated hemoglobin, diabetes, and cardiovascular risk in nondiabetic adults. N Engl J Med. (2010) 362:800–11. doi: 10.1056/NEJMoa0908359
102.
Cohen RM Holmes YR Chenier TC Joiner CH . Discordance between HbA1c and fructosamine: evidence for a glycosylation gap and its relation to diabetic nephropathy. Diabetes Care. (2003) 26:163–7. doi: 10.2337/diacare.26.1.163
103.
Burzynski D Ellis W Jr . The slope intercept form of a line. Elementary algebra: Chapter 7.5. Reno: College of Southern Nevada (2018).
104.
Chapman AR Fujisawa T Lee KK Andrews JP Anand A Sandeman D et al . Novel high-sensitivity cardiac troponin I assay in patients with suspected acute coronary syndrome. Heart. (2019) 105:616–22. doi: 10.1136/heartjnl-2018-314093
105.
American Diabetes Association professional practice committee; 2. Diagnosis and classification of diabetes: standards of Care in Diabetes—2024. Diabetes Care. (2024) 47:S20–42. doi: 10.2337/dc24-S002
106.
Gold ME Nanna MG Doerfler SM Schibler T Wojdyla D Peterson ED et al . Prevalence, treatment, and control of severe hyperlipidemia. Am J Prev Cardiol. (2020) 3:100079. doi: 10.1016/j.ajpc.2020.100079
107.
Kavsak PA Xu L Yusuf S McQueen MJ . High-sensitivity cardiac troponin I measurement for risk stratification in a stable high-risk population. Clin Chem. (2011) 57:1146–53. doi: 10.1373/clinchem.2011.164574
108.
Schneider A Hommel G Blettner M . Linear regression analysis: part 14 of a series on evaluation of scientific publications. Dtsch Arztebl Int. (2010) 107:776–82. doi: 10.3238/arztebl.2010.0776
109.
Tai MM . A mathematical model for the determination of total area under glucose tolerance and other metabolic curves. Diabetes Care. (1994) 17:152–4. doi: 10.2337/diacare.17.2.152
110.
Kuang M Peng N Qiu J Zhong Y Zou Y Sheng G . Association of LDL:HDL ratio with prediabetes risk: a longitudinal observational study based on Chinese adults. Lipids Health Dis. (2022) 21:44. doi: 10.1186/s12944-022-01655-5
111.
Babey SH Wolstein J Diamant AL Goldstein H . Prediabetes in California: nearly half of California adults on path to diabetes. Policy Brief UCLA Cent Health Policy Res. (2016) 1:1–8.
112.
Fan J Yao M Ma Y . Prevalence, trends, and subsequent outcomes of prediabetes in the United States, 1999–2018. Endocr Pract. (2024) 30:1126–33. doi: 10.1016/j.eprac.2024.09.008
113.
Weil BR Young RF Shen X Suzuki G Qu J Malhotra S et al . Brief myocardial ischemia produces cardiac troponin I release and focal myocyte apoptosis in the absence of pathological infarction in swine. JACC Basic Transl Sci. (2017) 2:105–14. doi: 10.1016/j.jacbts.2017.01.006
114.
Kim J Lee HS Lee KY . Effect of statins on fasting glucose in non-diabetic individuals: nationwide population-based health examination in Korea. Cardiovasc Diabetol. (2018) 17:155. doi: 10.1186/s12933-018-0799-4
115.
Berry JD Nambi V Ambrosius WT Chen H Killeen AA Taylor A et al . Associations of high-sensitivity troponin and natriuretic peptide levels with outcomes after intensive blood pressure lowering: findings from the SPRINT randomized clinical trial. JAMA Cardiol. (2021) 6:1397–405. doi: 10.1001/jamacardio.2021.3187
116.
Shetty NS Gaonkar M Patel N Yerabolu K Patel KV Arira G et al . Change in troponin I levels with intensive blood pressure control. A post-hoc analysis of SPRINT. JACC Adv. (2023) 3:100775. doi: 10.1016/j.jacadv.2023.100775
117.
Gutierrez-Mariscal FM Cardelo MP de la Cruz S Alcala-Diaz JF Roncero-Ramos I Guler I et al . Reduction in circulating advanced glycation end products by mediterranean diet is associated with increased likelihood of type 2 diabetes remission in patients with coronary heart disease: from the Cordioprev study. Mol Nutr Food Res. (2021) 65:e1901290. doi: 10.1002/mnfr.201901290
118.
Kovell LC Yeung EH Miller ER 3rd Appel LJ Christenson RH Rebuck H et al . Healthy diet reduces markers of cardiac injury and inflammation regardless of macronutrients: results from the OmniHeart trial. Int J Cardiol. (2020) 299:282–8. doi: 10.1016/j.ijcard.2019.07.102
119.
Ouyang A Hu K Chen L . Trends and risk factors of diabetes and prediabetes in US adolescents, 1999-2020. Diabetes Res Clin Pract. (2024) 207:111022. doi: 10.1016/j.diabres.2023.111022
120.
Pani LN Korenda L Meigs JB Driver C Chamany S Fox CS et al . Effect of aging on A1C levels in individuals without diabetes: evidence from the Framingham offspring study and the National Health and nutrition examination survey 2001–2004. Diabetes Care. (2008) 31:1991–6. doi: 10.2337/dc08-0577
121.
Xia P-F Tian Y-X Geng T-T Yue L Tu Z-Z Zhang Y-B et al . Trends in prevalence and awareness of prediabetes among adults in the U.S. 2005–2020. Diabetes Care. (2022) 45:e21–3. doi: 10.2337/dc21-2100
122.
Balder JW de Vries JK Nolte IM Lansberg PJ Kuivenhoven JA Kamphuisen PW . Lipid and lipoprotein reference values from 133,450 Dutch lifelines participants: age- and gender-specific baseline lipid values and percentiles. J Clin Lipidol. (2017) 11:1055–64. doi: 10.1016/j.jacl.2017.05.007
123.
Martin SS Aday AW Allen NB Almarzooq ZI Anderson CAM Arora P et al . 2025 heart disease and stroke statistics: a report of US and global data from the American Heart Association. Circulation. (2025). doi: 10.1161/CIR.0000000000001303
124.
Dimala CA Reggio C Khalife W Donato A . Heart disease and heart failure: trends and disparities in mortality rates in the United States from 2000 to 2020. Am Heart J Plus. (2024) 46:100459. doi: 10.1016/j.ahjo.2024.100459
125.
Tamanna N Mahmood N . Food processing and Maillard reaction products: effect on human health and nutrition. Int J Food Sci. (2015) 2015:526762. doi: 10.1155/2015/526762
126.
Semba RD Nicklett EJ Ferrucci L . Does accumulation of advanced glycation end products contribute to the aging phenotype?J Gerontol A Biol Sci Med Sci. (2010) 65:963–75. doi: 10.1093/gerona/glq074
127.
Salsman J Dellaire G . Precision genome editing in the CRISPR era. Biochem Cell Biol. (2017) 95:187–201. doi: 10.1139/bcb-2016-0137
128.
Fleg JL Strait J . Age-associated changes in cardiovascular structure and function: a fertile milieu for future disease. Heart Fail Rev. (2012) 17:545–54. doi: 10.1007/s10741-011-9270-2
129.
Talha I Elkhoudri N Hilali A . Major limitations of cardiovascular risk scores. Cardiovasc Ther. (2024) 2024:4133365. doi: 10.1155/2024/4133365
130.
Center for Medicare and Medicaid Services (CMS) clinical laboratory fee schedule (2024). Available online at: https://www.cms.gov/medicare/payment/fee-schedules/clinical-laboratory-fee-schedule-clfs
131.
Woodall AM Han N . Percentage of adults aged ≥18 years with diagnosed heart disease, by urbanization level and age group — National Health Interview Survey, United States, 2020. MMWR Morb Mortal Wkly Rep. (2022) 71:778. doi: 10.15585/mmwr.mm7123a4
132.
Hansen LM Gupta D Joseph G Weiss D Taylor WR . The receptor for advanced glycation end products impairs collateral formation in both diabetic and non-diabetic mice. Lab Investig. (2017) 97:34–42. doi: 10.1038/labinvest.2016.113
133.
Teunissen PF Horrevoets AJ van Royen N . The coronary collateral circulation: genetic and environmental determinants in experimental models and humans. J Mol Cell Cardiol. (2012) 52:897–904. doi: 10.1016/j.yjmcc.2011.09.010
134.
Prakash J Pichchadze G Trofimov S Livshits G . Age and genetic determinants of variation of circulating levels of the receptor for advanced glycation end products (RAGE) in the general human population. Mech Aging Dev. (2015) 145:18–25. doi: 10.1016/j.mad.2015.01.001
135.
Zheng W Li H Go Y Chan XHF Huang Q Wu J . Research advances on the damage mechanism of skin glycation and related inhibitors. Nutrients. (2022) 14:4588. doi: 10.3390/nu14214588
136.
Bansode S Bashtanova U Li R Clark J Müller KH Puszkarska A et al . Glycation changes molecular organization and charge distribution in type I collagen fibrils. Sci Rep. (2020) 10:3397. doi: 10.1038/s41598-020-60250-9
137.
Corstjens H Dicanio D Muizzuddin N Neven A Sparacio R Declercq L et al . Glycation associated skin autofluorescence and skin elasticity are related to chronological age and body mass index of healthy subjects. Exp Gerontol. (2008) 43:663–7. doi: 10.1016/j.exger.2008.01.012
138.
Christoffersen M Tybjærg-Hansen A . Visible aging signs as risk markers for ischemic heart disease: epidemiology, pathogenesis and clinical implications. Ageing Res Rev. (2016) 25:24–41. doi: 10.1016/j.arr.2015.11.002
139.
Chen J Arshi B Waqas K Lu T Bos D Ikram MA et al . Advanced glycation end products measured by skin autofluorescence and subclinical cardiovascular disease: the Rotterdam study. Cardiovasc Diabetol. (2023) 22:326. doi: 10.1186/s12933-023-02052-7
140.
Zhou J Wu R Williams C Emberson J Reith C Keech A et al . Prediction models for individual-level healthcare costs associated with cardiovascular events in the UK. PharmacoEconomics. (2023) 41:547–59. doi: 10.1007/s40273-022-01219-6
141.
Malhotra A Grunstein RR Fietze I Weaver TE Redline S Azarbarzin A et al . Tirzepatide for the treatment of obstructive sleep apnea and obesity. N Engl J Med. (2024) 391:1193–205. doi: 10.1056/NEJMoa2404881
142.
Nesti L Trico D . Cardioprotective effects of glucagon-like peptide 1 receptor agonists in heart failure: myth or truth?World J Diabetes. (2024) 15:818–22. doi: 10.4239/wjd.v15.i5.818
143.
Einvik G Røsjø H Randby A Namtvedt SK Hrubos-Strøm H Brynildsen J et al . Severity of obstructive sleep apnea is associated with cardiac troponin I concentrations in a community-based sample: data from the Akershus sleep apnea project. Sleep. (2014) 37:1111–6. doi: 10.5665/sleep.3772
144.
Marx N Husain M Lehrke M Verma S Sattar N . GLP-1 receptor agonists for the reduction of atherosclerotic cardiovascular risk in patients with type 2 diabetes. Circulation. (2022) 146:1882–94. doi: 10.1161/CIRCULATIONAHA.122.059595
145.
Kreiner FF von Scholten BJ Kurtzhals P Gough SCL . Glucagon-like peptide-1 receptor agonists to expand the healthy lifespan: current and future potentials. Aging Cell. (2023) 22:e13818. doi: 10.1111/acel.13818
146.
Ebong I Breathett K . The cardiovascular disease epidemic in African American women: recognizing and tackling a persistent problem. J Womens Health. (2020) 29:891–3. doi: 10.1089/jwh.2019.8125
147.
Sun F Yao J Du S Qian F Appleton AA Tao C et al . Social determinants, cardiovascular disease, and health care cost: a Nationwide study in the United States using machine learning. J Am Heart Assoc. (2023) 12:e027919. doi: 10.1161/JAHA.122.027919
148.
Skranes JB Lyngbakken MN Hveem K Røsjø H Omland T . Tobacco consumption and high-sensitivity cardiac troponin I in the general population: the HUNT study. J Am Heart Assoc. (2022) 11:e021776. doi: 10.1161/JAHA.121.021776
149.
Rodríguez-Segade S Rodríguez J García Lopez JM Casanueva FF Camiña F . Estimation of the glycation gap in diabetic patients with stable glycemic control. Diabetes Care. (2012) 35:2447–50. doi: 10.2337/dc11-2450
150.
Zafon C Ciudin A Valladares S Mesa J Simó R . Variables involved in the discordance between HbA1c and fructosamine: the glycation gap revisited. PLoS One. (2013) 8:e66696. doi: 10.1371/journal.pone.0066696
151.
Masotti S Musetti V Prontera C Storti S Passino C Clerico A . Evaluation and comparison with other high-sensitivity methods of analytical performance and measured values of a new laboratory test for cardiac troponin I assay. J Appl Lab Med. (2021) 6:1237–50. doi: 10.1093/jalm/jfab017
Summary
Keywords
glycation, biomarkers, algorithm, cardiovascular disease, prevention
Citation
Valk T and McMorrow C (2025) A proposed model using glycation metrics and circulating biomarkers for the prevention of cardiovascular disease. Front. Med. 12:1624682. doi: 10.3389/fmed.2025.1624682
Received
07 May 2025
Accepted
30 June 2025
Published
12 August 2025
Volume
12 - 2025
Edited by
Hammad Nazeer, Air University, Pakistan
Reviewed by
Mohammad Chand Jamali, Liwa University, United Arab Emirates
Çağrı Zorlu, Gaziosmanpaşa University, Türkiye
Updates
Copyright
© 2025 Valk and McMorrow.
This is an open-access article distributed under the terms of the Creative Commons Attribution License (CC BY). The use, distribution or reproduction in other forums is permitted, provided the original author(s) and the copyright owner(s) are credited and that the original publication in this journal is cited, in accordance with accepted academic practice. No use, distribution or reproduction is permitted which does not comply with these terms.
*Correspondence: Timothy Valk, tim@cardiacdataanalytics.com
Disclaimer
All claims expressed in this article are solely those of the authors and do not necessarily represent those of their affiliated organizations, or those of the publisher, the editors and the reviewers. Any product that may be evaluated in this article or claim that may be made by its manufacturer is not guaranteed or endorsed by the publisher.