Abstract
Renal fibrosis is the central pathological pathway by which various primary and secondary kidney diseases progress to end-stage renal disease. It is characterized by excessive extracellular matrix deposition and destruction of the native renal parenchyma, ultimately leading to irreversible loss of nephrons. Currently, percutaneous renal biopsy with histopathological evaluation remains the diagnostic gold standard for renal fibrosis, allowing semiquantitative scoring of renal interstitial fibrosis and glomerulosclerosis (e.g., Banff grading). However, this invasive procedure carries a risk of bleeding and is limited by sampling error and inter-observer variability, making it impractical for dynamic disease monitoring. In recent years, significant advances have been made in noninvasive diagnostic techniques. These include: (1) blood and urine biomarkers such as markers of ECM metabolism, inflammatory factors, tubular injury markers, and extracellular vesicles; (2) imaging modalities including novel ultrasound techniques, shear wave elastography, functional magnetic resonance imaging (MRI) methods such as diffusion-weighted imaging, blood oxygen level-dependent MRI, magnetic resonance elastography, and positron emission tomography/computed tomography using radiotracers targeting fibrosis-associated molecules such as 68Ga-FAPI. This review systematically summarizes the latest evidence on the above biomarkers and advanced imaging modalities, with an emphasis on their diagnostic performance (sensitivity/specificity), utility for dynamic monitoring, and bottlenecks in clinical translation. The aim is to develop a multimodal, noninvasive assessment system to enable earlier fibrosis detection, stratified disease management, and precise intervention targeting fibrogenic pathways, ultimately improving renal disease outcomes.
1 Introduction
Chronic kidney disease (CKD) is defined as structural or functional kidney damage, manifesting as an estimated glomerular filtration rate (eGFR) below 60 mL/min/1.73 m2 or urinary protein ≥30 mg/day for over 3 months (1, 2), in 2017, approximately 843.6 million people worldwide were affected by CKD. Although the mortality of patients with end-stage renal disease has declined, the Global Burden of Disease study showed that CKD has become one of the leading global causes of death (3).
Renal fibrosis (RF) is characterized by excessive extracellular matrix (ECM) deposition leading to scar formation, representing the common outcome of various CKD (4–6) (Figure 1). Currently, clinical evaluation of CKD relies mainly on eGFR and proteinuria. However, these indicators have significant limitations: due to the kidney’s functional reserve, eGFR cannot detect early renal fibrosis and cannot assess the extent of interstitial fibrosis (7). In addition, kidney biopsy is the diagnostic gold standard for renal fibrosis, but its clinical use faces many challenges: it is invasive, allows only limited tissue sampling, has low repeatability, and provides limited accuracy in grading fibrosis severity. In recent years, blood and urine biomarker assays combined with advanced imaging techniques-such as ultrasound and magnetic resonance imaging (MRI), and especially positron emission tomography/computed tomography (PET/CT) (Figure 2) have emerged as important noninvasive means to evaluate renal fibrosis. These technologies offer the promise of early and accurate fibrosis detection, and they support dynamic monitoring of disease progression and timely interventions to slow CKD progression.
Figure 1

Renal fibrosis is the final common pathophysiological pathway of CKD.
Figure 2
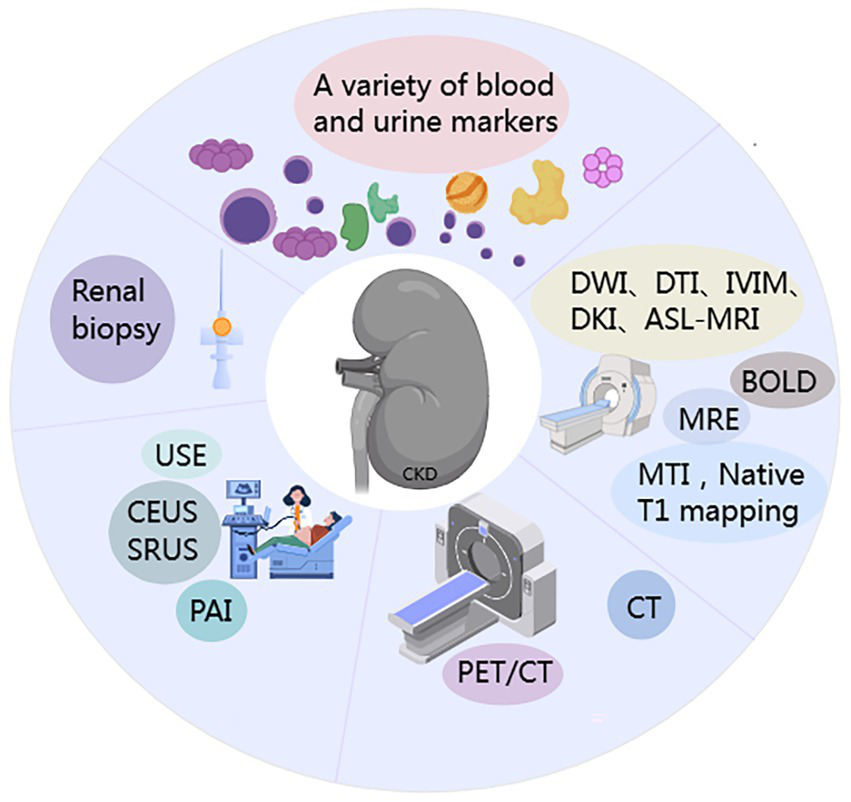
Schematic of methodological approaches for renal fibrosis (RF) assessment.
We reviewed the literature on blood/urine biomarkers and imaging modalities for the noninvasive diagnosis of renal fibrosis in the past 5 years, to evaluate CKD progression and fibrosis severity in comparison with traditional indicators like eGFR and proteinuria, with a focus on clinical applicability.
2 Blood and urine biomarkers of renal fibrosis
Persistent tubular injury, inflammatory activation, and collagen/ECM deposition are considered major drivers of renal fibrosis. Based on these key pathological events, an increasing number of serum and urine biomarkers have been identified, providing new avenues for the clinical assessment of renal fibrosis.
2.1 Extracellular matrix
2.1.1 Procollagen type III N-terminal propeptide and procollagen type VI N-terminal propeptide; C1M and C3M
Procollagen type III N-terminal propeptide (PRO-C3) and procollagen type VI N-terminal propeptide (PRO-C6) are biomarkers reflecting the formation of type III and VI collagen, whereas C1M and C3M are fragments generated by matrix metalloproteinase (MMP) degradation of type I and III collagen during ECM remodelling. Studies have found, for example, that ELISA measurement of urinary DKK-3, PRO-C6, and C3M levels in patients with ANCA-associated vasculitis (AAV) versus healthy controls showed that uPRO-C6, uC3M, and uDKK-3 were elevated in AAV patients, and uPRO-C6 and uDKK-3 levels were significantly correlated with the degree of renal fibrosis (8); in patients with lupus nephritis (LN), serum and urine PRO-C3 and PRO-C6 are significantly elevated and associate with interstitial fibrosis and tubular atrophy (9). Among IgA nephropathy (IgAN) patients, sPRO-C3 and sC3M correlate with fibrosis extent on biopsy, while urinary C3M/creatinine is inversely correlated with fibrosis. Another study found that uC3M levels decline with increasing CKD stage and are independently and negatively associated with 12-month and 30-month CKD progression and development of end-stage renal disease (10). However, a separate prospective observational study reported that in type 2 diabetic (T2DM) patients with microalbuminuria, higher sC3M was a risk factor for CKD progression and was associated with inflammatory markers (11). Therefore, molecules related to collagen synthesis and degradation are potential biomarkers of renal fibrosis (Table 1). Notably, some studies indicate that blood biomarkers lack specificity, whereas urinary C3M and C1M may have greater diagnostic and prognostic value (12).
Table 1
| Marker | Secretory cells/mechanism | Type of molecule | Function association |
|---|---|---|---|
| PRO-C3 | Fibroblast; myofibroblast | Protein fragment | Metabolites of type III collagen precursors |
| PRO-C6 | Mesangial cells; fibroblasts | Protein fragment | VI type collagen synthesis marker |
| C1M | MMPs degrade type I collagen | Polypeptide | Degradation marker of type I collagen |
| C3M | MMPs degrade type III collagen | Polypeptide | Type III collagen degradation marker |
The key biomarkers reflecting the synthesis and degradation of ECM during the process of renal fibrosis.
2.1.2 Matrix metalloproteinases
Matrix metalloproteinases (MMPs) are secreted by glomerular cells, renal tubular epithelial cells, and macrophages to degrade the ECM, while TIMPs (tissue inhibitors of metalloproteinases) specifically inhibit MMPs by forming complexes, thus regulating ECM degradation and remodelling (13). Enoksen et al. (14) measured baseline serum levels of eGFR, MMP-2, MMP-7 and TIMP-1 in 1,627 subjects without diabetes, kidney, or cardiovascular disease and re-evaluated them after a median of 5.6 years; they found that the profibrotic biomarker sMMP-7 was associated with accelerated GFR decline and increased risk of incident CKD in middle-aged individuals from the general population. Similarly, in a cohort of 1,181 T2DM patients followed over time, the risk of renal function decline increased with higher baseline sMMP-7 levels (15), in hypertensive patients, those with CKD had significantly elevated urinary MMP-7 (16). Multiple studies have demonstrated that CKD patients, including those with diabetic kidney disease (DKD) and IgAN, have significantly higher MMP-7 levels in blood and urine compared to healthy individuals, and that urinary MMP-7 is an independent predictor of IgAN progression and correlates with RF (17, 18). These findings suggest that elevated MMP-7 in blood or urine is associated not only with current renal function but also with future decline, and that increases in MMP-7 could serve as a potential early noninvasive indicator of CKD development in the context of hypertension and diabetes, enabling earlier therapeutic intervention.
2.2 Biomarkers associated with inflammatory activation
2.2.1 Transforming growth factor-β1
Transforming growth factor-β1 (TGF-β1) is a growth factor secreted by many cell types, including inflammatory cells, tubular epithelial cells, and fibroblasts (19). TGF-β1 is considered the most potent profibrotic cytokine and a central mediator of RF, involved in fibroblast transdifferentiation and activation (20, 21). In patients with IgAN, serum TGF-β1 levels are elevated and associate with lower eGFR and higher tubular atrophy/interstitial fibrosis (T) scores on biopsy (22). DKD leads 40% of patients who are diabetic and is the leading cause of CKD worldwide (23, 24). Likewise, patients with DKD show significantly increased TGF-β1 levels (25). Furthermore, in LN patients, urinary TGF-β1 correlates positively with the degree of tubulointerstitial fibrosis (12), suggesting that TGF-β1 in blood or urine may serve as a noninvasive biomarker of renal fibrosis. However, since TGFβ1 broadly participates in fibrosis of other organs and lacks kidney-specificity, further large-scale clinical validation is necessary.
2.2.2 Monocyte chemoattractant protein-1
Monocyte chemoattractant protein-1 (MCP-1), also known as C-C motif chemokine ligand 2 (CCL2), is a chemokine produced by injured tubular epithelial cells and monocytes/macrophages. By inducing inflammatory cell activation and recruiting monocytes/macrophages, MCP-1 mediates and promotes RF (26). Research shows that the measurement of MCP-1 in the urine of DKD patients is higher compared to healthy controls, and it is significantly associated with the progression of CKD, as well as related to changes in urinary albumin levels and eGFR, indicating that uMCP-1 is an important biomarker for assessing the progression of DKD (27, 28). In the SPRINT trial of 2,253 CKD patients, Miller et al. (29) found that uMCP-1 was a marker of tubulointerstitial fibrosis. Research in LN patients likewise showed that uMCP-1 levels are significantly elevated, with biopsy samples revealing marked RF (30). Thus, although MCP-1 is an inflammatory marker, its significant increase at the initiation stage of fibrosis and its correlation with TIF in CKD suggests it has potential utility as a fibrosis biomarker.
2.2.3 Interleukins
Interleukins (ILs) are a group of cytokine proteins produced by various cells (including immune cells) in the body. They can be classified as pro-inflammatory, anti-inflammatory, or dual-effect cytokines based on their biological roles in inflammation (31).
Single-cell RNA sequencing of kidney tissues from CKD patients versus healthy controls found that IL-6, IL-18, and IL-33 expression levels positively correlated with fibrosis severity and negatively with eGFR (32). In patients with DKD, plasma IL-6 concentrations were significantly higher than in controls and were associated with higher proteinuria (33). A cross-sectional study of renal transplant recipients showed that urinary IL-8 was elevated in patients with rejection; thus, urinary IL-8 mRNA may be used as a diagnostic tool for fibrosis (34).
Deng et al. (35) measured plasma IL-7 in IgAN patients and controls, finding that IgAN patients had significantly lower IL-7 levels; IL-7 levels differed between presentation and follow-up, suggesting that sIL-7 may be a noninvasive biomarker for predicting IgAN.
In summary, the interleukin family plays a key role in both promoting and alleviating fibrosis. Interleukins may be potential therapeutic targets and biomarkers, but factors such as IL-6 increase in autoimmune diseases and infections, showing low specificity and making it difficult to distinguish RF from other inflammations. Therefore, there is insufficient evidence for using inflammatory factors in the clinical diagnosis of renal fibrosis.
2.3 Tubular injury biomarkers
2.3.1 Kidney injury molecule-1
Kidney injury molecule-1 (KIM-1) is a transmembrane glycoprotein that is highly expressed in injured proximal tubular epithelial cells and can be detected in plasma and urine (36, 37). Studies show that KIM-1 expression in renal tubules correlates with kidney inflammation and fibrosis, and it is considered an early, sensitive, and specific urinary biomarker of kidney injury. KIM-1 can also be used to quantify the severity of tubular cell injury (28, 38). Birnlland et al. (39) evaluated KIM-1 levels in patients with ANCA-associated vasculitis and glomerulonephritis (ANCA-GN) at diagnosis and after treatment. They found that KIM-1 was elevated at diagnosis but decreased after induction of remission therapy, suggesting that KIM-1 may be a biomarker of acute kidney injury (AKI) and tubulointerstitial damage in ANCA-GN. These findings indicate that persistently elevated KIM-1 could serve as an indicator of ongoing renal fibrosis.
2.3.2 Neutrophil gelatinase-associated lipocalin
Neutrophil gelatinase-associated lipocalin (NGAL), also known as lipocalin-2 (LCN-2), is a 25 kDa protein of the lipocalin family. During kidney injury, NGAL is specifically released into the bloodstream and urine (40). In a population-based cohort, higher plasma NGAL concentrations were associated with an increased risk of developing CKD, indicating the potential utility of NGAL as a biomarker for incident CKD risk (41). Research findings indicate that urinary NGAL levels are elevated in T2DM patients compared to healthy controls, and are associated with urine protein levels (36). Using ELISA to quantify urinary NGAL, patients with chronic tubulointerstitial nephritis (D-CTIN), primary membranous nephropathy (PMN), and membranoproliferative glomerulonephritis (MPGN) all showed significantly higher uNGAL levels than healthy controls, and uNGAL was directly proportional to the degree of proteinuria and inversely proportional to residual renal function (42) (Table 1).
2.3.3 N-acetyl-β-D-glucosaminidase
N-acetyl-β-D-glucosaminidase (NAG) is a lysosomal enzyme predominantly present in proximal tubular cells of the kidney; it is not filtered by the glomerulus. Increased urinary NAG excretion is caused entirely by proximal tubular cell injury (43). One study found that uNAG levels were higher in DN patients than in T2DM patients, suggesting that urinary NAG may be an early indicator of disease progression from T2DM to DN (44), KIM-1, MCP-1, and NAG have been identified as the most promising urinary biomarkers for early diagnosis of renal involvement in IgA vasculitis (45).
Nevertheless, Hsu et al. (46) conducted a prospective cohort study and found that after adjusting for known CKD progression risk factors including eGFR and ACR, tubular injury biomarkers such as KIM-1, NGAL, and NAG did not improve prediction of CKD progression. These markers can also be influenced by non-fibrotic conditions like infections; hence, their role as specific indicators of renal fibrosis remains controversial.
2.3.4 Dickkopf-related protein 3
Dickkopf-related protein 3 (DKK-3) is a secreted glycoprotein synthesized by renal tubular epithelial cells under stress conditions (47). ELISA-based measurement of DKK-3 in serum and urine of CKD patients revealed that urinary DKK-3 (uDKK-3) levels were closely correlated with the severity of tubular atrophy (TA) and interstitial fibrosis (IF) observed on kidney biopsy (48). Urinary DKK-3 levels are significantly elevated in renal transplant recipients compared to healthy controls (49). Moreover, uDKK-3 levels increase progressively with advancing CKD stage and correlate inversely with eGFR (47, 50). Elevated DKK-3 also helps identify patients on peritoneal dialysis who are at risk of faster decline in residual renal function (51). Therefore, uDKK-3 has great potential as a biomarker for monitoring renal disease progression, large-scale cohort validation remains necessary.
2.3.5 Vascular cell adhesion molecule 1
Vascular cell adhesion molecule 1 (VCAM1), mainly expressed by activated endothelial cells, shows minimal expression in normal tissue but is highly expressed in fibrotic tissue and involved in cell adhesion (52). Single-cell transcriptomic and LC-MS proteomic analyses revealed significantly elevated VCAM-1 expression in CKD tissues, with higher levels in proliferative LN (PLN) compared to membranous LN (MLN) (53, 54). Serum VCAM-1 measured by ELISA showed significant elevation in CKD patients, correlating with CKD risk in T2DM patients, suggesting its potential for CKD risk stratification in this population (55). Similarly, elevated serum VCAM-1 levels effectively distinguished active LN from healthy controls, remission-phase LN, active non-renal SLE, and non-lupus CKD, correlating positively with proteinuria, Scr, anti-dsDNA antibodies, and negatively with complement C3. Thus, serum VCAM-1 may aid in early detection of LN flares (56). Additionally, integrated GEO database analysis using ML identified VCAM1 as a promising biomarker for renal fibrosis in tissues and serum (57). However, its elevation in conditions such as atherosclerosis and infection reduces kidney-specificity.
2.4 Biomarkers in the urine
2.4.1 Extracellular vesicles
Extracellular vesicles (EVs) are membrane-bound vesicles released by cells, mainly originating from renal and other urinary tract cells; they include exosomes, microvesicles, and apoptotic bodies. These vesicles contain proteins, lipids, DNA, mRNA, and microRNAs (miRNAs), reflecting the physiological state of the source cells. EVs thus have potential as novel diagnostic biomarkers (58). Research indicates that urinary release of podocyte-derived exosomal CD2AP mRNA is negatively correlated with the extent of renal fibrosis and glomerulosclerosis, suggesting that CD2AP mRNA could serve as a noninvasive tool to detect renal fibrosis (59). Proteomic analysis of urinary EVs from kidney transplant recipients identified urinary vitronectin (VTN) as a potential independent biomarker for monitoring fibrotic changes in allograft kidneys (60).
miRNAs are small non-coding single-stranded RNAs that regulate gene expression by mRNA degradation or translational inhibition. Cao et al. (61) compared the expression of hsa_circ_0036649 in exosomes from fibrotic versus non-fibrotic patients and found it was correlated with the tubulointerstitial fibrosis (TIF) score and glomerulosclerosis score. Urinary exosomal miRNAs (including miR-21, miR-29, miR-146, and miR-200) may serve as potential biomarkers for early detection of renal fibrosis (62). Zhang et al. (63) measured miR-451a in 40 IgAN patients and found it significantly upregulated, distinguishing patients with mild versus severe tubular atrophy/interstitial fibrosis. Although EVs originate from renal and urinary tract cells and offer advantages in diagnosing and treating renal fibrosis, the lack of standardization in urine collection, processing, and storage for EV analysis, as well as the high inter-individual variability in EV profiles, has hindered the discovery of reliable biomarker candidates (64).
2.4.2 Urine sediment and urinary exfoliated cell
Increasing evidence supports non-invasive urine sediment and urinary exfoliated cell detection for early CKD diagnosis and prognosis (65). Urine sediment examination in DKD patients revealing renal tubular epithelial cells or casts correlated significantly with higher proteinuria and Scr, indicating more severe kidney damage and worse renal outcomes, thus offering potential non-invasive prognostic biomarkers (66). Additionally, presence of urinary isomorphic erythrocytes in ANCA-MPO vasculitis correlated with lower eGFR and more severe clinical presentations, suggesting utility as biomarkers for severity and progression (67). Single-cell sequencing or transcriptomics of urine sediment also shows diagnostic potential in CKD, though large prospective studies are required for validation (68, 69). Nevertheless, increased urinary tubular epithelial cells occur in acute tubular necrosis and interstitial nephritis as well, limiting specificity for renal fibrosis diagnosis.
2.5 Metabolites from the gut
Notably, the kidney and the gut microbiota have a complex bidirectional relationship. In CKD, dysbiosis is characterized by a decrease in beneficial bacteria (e.g., Lactobacillus, Prevotella, and Bifidobacterium) and an increase in pathogenic or opportunistic bacteria (including Proteobacteria and Enterococcus). Therefore, gut-derived metabolites can serve as biomarkers for CKD (70, 71). For example, measurement of p-cresyl sulfate (pCS) and indoxyl sulfate (IXS) in the plasma of CKD patients by LC/MS/MS showed that CKD patients had significantly higher plasma pCS and IXS, and levels were inversely correlated with eGFR. This indicates that both protein-bound solutes could serve as surrogate markers of renal function (72, 73). In a mouse model of membranous nephropathy (MN), the relative abundances of five probiotic strains (Lactobacillus johnsonii, L. murinus, L. vaginalis, L. reuteri, and Bifidobacterium animalis) in feces were reduced, and serum levels of indole-3-propionic acid, indole-3-aldehyde, and tryptamine were decreased (74); additionally, Cao et al. found that CKD (stages 1–5) patients exhibited gut microbiome dysbiosis, with L. johnsonii abundance positively correlated with eGFR, and significantly lower serum levels of indole-3-aldehyde (IAld) and 5-methoxytryptophan. Treatment of an adenine-induced CKD rat model with L. johnsonii and IAld improved renal injury and fibrosis, suggesting that tryptophan-derived indole metabolites may serve as predictive biomarkers in CKD (75).
Trimethylamine N-oxide (TMAO) is a dietary metabolite from choline, L-carnitine, and betaine, and the majority (>95%) of TMAO is excreted in urine (76). Multiple studies have found that when plasma TMAO levels are measured by UPLC-MS/MS or LC-MS/MS in healthy controls versus CKD patients (including DKD), CKD patients have significantly higher plasma TMAO than healthy individuals or T2DM patients. Patients on hemodialysis (HD) or peritoneal dialysis (PD) have higher TMAO levels than non-dialysis CKD patients (stages 3–5). TMAO levels correlate positively with serum creatinine, blood urea nitrogen (BUN), and uACR, and negatively with eGFR (77–81). Moreover, higher circulating TMAO levels are associated with increased mortality risk in CKD patients (82, 83). In a large 2-year cross-sectional study of healthy individuals and CKD patients, those with elevated TMAO had a higher risk of CKD, and TMAO showed moderate ability to distinguish CKD cases from non-CKD (84), therefore, TMAO has been identified as a promising biomarker; however, age, sex, body mass index (BMI), and diet may influence TMAO levels (85), and a lack of studies in CKD stages 1–3 means its sensitivity in early CKD is unclear. Large-scale studies in diverse populations are needed for validation. Additionally, plasma TMAO correlates with atherosclerosis risk (86), hence lacking specificity for renal fibrosis diagnosis.
2.6 Emerging technologies in noninvasive diagnosis of renal fibrosis
Advances in multi-omics approaches (including genomics, proteomics, and metabolomics) have provided new insights for the noninvasive diagnosis of renal fibrosis. Metabolomics, the study of metabolites (such as lipids, amino acids, and sugars), can reflect the metabolic state of the body at a given time, enabling early diagnosis and risk stratification (87, 88). CKD animal models induced by adenine and by unilateral ureteral obstruction (UUO), ultra-performance liquid chromatography coupled to high-definition mass spectrometry (UPLC-HDMS) revealed dysregulation of phosphatidylcholine (PC) metabolism and identified 1-methoxyphenanthrene (MP) as being associated with CKD (89), targeted analysis of blood and urine samples from healthy controls and CKD patients found that serum L-phenylalanine, L-methionine, arginine, kynurenic acid, and indoxyl sulfate, as well as urinary L-acetylcarnitine, could serve as potential biomarkers for early CKD diagnosis (90). Hong et al. (91) performed liquid chromatography-mass spectrometry (LC-MS) analysis on plasma samples from CKD stages 1–4 patients and healthy controls, and found that asymmetric dimethylarginine (ADMA), D-ornithine, L-kynurenine, kynurenic acid, 5-hydroxyindoleacetic acid, and gluconic acid were potential early biomarkers for CKD progression. Wu et al. (92) used gas chromatography-mass spectrometry (GC-MS) to analyze urinary metabolites in patients with different IgAN grades. The study found that, compared to IgAN grade 0, four volatile organic compounds (VOCs) were significantly elevated in grade 1; and compared to grade 1, two additional VOCs were upregulated in grades ≥2. These results suggest that urinary VOCs might serve as noninvasive biomarkers reflecting the dynamic progression of CKD via fibrotic changes. Additionally, Peters et al. (93) conducted proteomic analysis of urine samples from IgAN patients and identified a proteomic classifier called “IgAN237” that has predictive value for disease progression. This classifier provides a promising biomarker for risk stratification and longitudinal monitoring in IgAN.
Furthermore, Doke et al. (32) applied single-cell RNA sequencing (scRNA-seq) to kidney tissues from CKD patients and healthy controls, finding increased basophil infiltration in fibrotic kidneys and showing that IL-6, IL-18, and IL-33 expression in the kidney correlated with CKD severity. At the same time, comparative serum proteomic analysis showed that levels of heat shock protein 90β family member 2 (HSP90B2) and α1-antitrypsin (AAT) were elevated in CKD patients compared to healthy individuals, and these levels correlated positively with known clinical markers, suggesting that they could serve as novel CKD biomarkers (94).
Machine learning (ML) has become a key artificial intelligence tool in microbiome research. Metabolomic analysis combined with ML can reveal metabolic differences between CKD patients and healthy controls and validate those differences, providing new possibilities for CKD management (95). Chen et al. (96) performed metabolomic profiling on serum samples from 703 CKD stages 1–5 patients. They found that 5-methoxytryptophan (5-MTP), adrenosterol succinate, tiglylcarnitine, and taurine were negatively correlated with CKD progression, whereas acetylcarnitine was positively correlated. Validation with ML showed that this panel of five metabolites could effectively distinguish CKD stages 1–5 patients, indicating that these metabolites could serve as early CKD biomarkers. In a retrospective cross-sectional study using LC-MS/MS-based metabolomics, plasma levels of tryptophan (Trp) derivatives were quantified in healthy controls and CKD patients (including IgAN). The study found that plasma melatonin had >95% accuracy in diagnosing early-stage CKD (stages I–II); furthermore, indole-3-lactic acid showed excellent ability to distinguish IgAN among CKD patients (97). Wu et al. (98) performed full-length 16S rRNA gene sequencing on fecal samples from healthy controls, T2DM patients, CKD patients, and diabetic kidney disease (DKD) patients, combined with ML analysis. They found that levels of L-valine, L-leucine, and L-isoleucine, and their precursor L-glutamate, were significantly increased in DM and DKD patients, suggesting these may serve as potential diagnostic biomarkers for DKD. Hirakawa et al. (99) integrated untargeted metabolomic profiles of plasma and urine from DKD patients with ML and found that systolic blood pressure, urine albumin-to-creatinine ratio (uACR), and certain metabolites (such as urinary N-methylproline, NMP) could serve as candidate biomarkers; however, these metabolites still require external validation.
2.7 Combined use of biomarkers
In CKD stages 2–5, simultaneous measurement of an inflammatory marker (IL-6), lipid markers, and kidney injury indices revealed that IL-6, BUN, and hemoglobin (Hb) levels differed significantly across stages, and these markers were risk factors for disease progression. This suggests that combining serum biomarkers can enable dynamic monitoring of CKD progression, aid in risk stratification, and guide early therapeutic intervention (100). Using a combination of serum and urinary biomarkers can improve diagnostic accuracy, provide a more comprehensive overview of renal health, and allow better risk stratification and personalized treatment planning.
2.8 Other biomarkers
Studies have shown that angiopoietin-like protein 4 (ANGPTL4) expression is significantly upregulated in CKD rats and patients, suggesting ANGPTL4 may be a novel noninvasive marker of renal fibrosis (101, 102). In one cohort study, plasma TNFR-1, YKL-40, and KIM-1 were associated with the risk of requiring kidney failure replacement therapy (KFRT) in diabetic patients (103).
Additionally, other molecules—including CDH11, SERPINF1 (also known as PEDF), SMOC2, HNF4A, NELL1; soluble lymphatic endothelial hyaluronan receptor 1 (sLYVE1); and markers such as CD44, nicotinamide N-methyltransferase (NNMT), and galactosylceramidase A-9—have shown significant associations with interstitial fibrosis/tubular atrophy (IFTA). These molecules have been identified as biomarkers of renal fibrosis (104–109). However, more and larger clinical sample data are needed to support these findings. Creatinine measured in fingernails correlates with serum creatinine in CKD patients (110). Retinal fundus examination (111) and retinal imaging combined with deep learning (112, 113) have been applied to CKD and T2DM detection and risk stratification. However, these methods also require larger clinical samples and external validation.
3 Imaging techniques
3.1 Ultrasound
Conventional renal ultrasound is primarily used to evaluate nephrolithiasis and mass lesions. However, due to factors such as anatomical position, respiratory motion, and limited resolution, traditional ultrasound is not sensitive for detecting renal fibrosis. With advances in ultrasound imaging, techniques like elastography and photoacoustic imaging have emerged, providing new methods for diagnosing renal fibrosis.
3.1.1 Ultrasound elastography
Ultrasound elastography (USE) assesses renal fibrosis by measuring changes in tissue elasticity. There are two main approaches: (1) strain elastography (SE), which analyzes tissue deformation (strain) under external pressure; and (2) shear wave elastography (SWE), which evaluates tissue stiffness by measuring the velocity of ultrasound-induced shear waves (shear wave velocity, SWV) (114). The measurement of SWE between CKD patients and health showed that the cortical hardness of CKD patients was significantly increased, which was positively correlated with serum urea/creatinine levels and negatively correlated with GFR (115). A prospective study demonstrated that SWE-based Young’s modulus measurements had high sensitivity and specificity for diagnosing interstitial fibrosis in IgAN patients (116). In 162 CKD patients who underwent 2D-SWE and kidney biopsy, the use of machine learning algorithms (XGBoost and MLP models) enabled differentiation between severe and mild renal fibrosis (117, 118). Logistic regression analysis showed that combining eGFR with SWE values improved diagnostic accuracy for mild, moderate, and severe fibrosis in CKD patients (118). Similarly, Zhu et al. (119) found that combining SWE with a support vector machine (SVM) model enhanced the ultrasound diagnosis of different grades of tubulointerstitial fibrosis in CKD patients.
3.1.2 Photoacoustic imaging
Photoacoustic imaging (PAI) is a noninvasive technique that combines ultrasound and laser light, using optical absorption to generate image contrast. Because different tissue components have distinct optical absorption properties, PAI can quantify renal collagen content and reflect the progression of fibrosis (120). Photoacoustic collagen imaging has been used to rapidly and noninvasively quantify renal fibrosis burden in isolated mouse and pig kidneys, as well as cortical fibrosis in ex vivo human kidneys (121). Multiple studies in animal models of renal fibrosis have shown that the use of nanoparticles in conjunction with PAI provides potential for longitudinal staging in clinical fibrosis assessment (122, 123). Although PAI is very promising for quantifying collagen content and evaluating fibrosis, its application in human renal fibrosis has been seldom studied due to issues such as suboptimal biocompatibility, limited penetration depth, and low resolution.
3.1.3 Contrast-enhanced ultrasound and super-resolution ultrasound
Microbubble contrast agents, not excreted through kidneys, can safely be used in renal impairment. Contrast-enhanced ultrasound (CEUS) monitors arterial microbubble arrival, cortical enhancement, and subsequent medullary filling, while super-resolution ultrasound (SRUS) reveals microvasculature with high-resolution imaging of microbubble trajectories (124–126). Studies using CEUS in CKD found significantly reduced cortical microperfusion correlating with eGFR, although differences among CKD subgroups were not observed (127–129). SRUS precisely quantified progressive pathological changes, including reduced renal size, cortical thickness, and altered microvascular structure in mouse models (130). SRUS also identified decreased vascular density in CKD patients and accurately depicted renal transplant microvasculature (131–133). Zhao et al. (134, 135) developed a hybrid PA/SRUS imaging method for simultaneous monitoring of renal oxygenation and hemodynamics. Both CEUS and SRUS have potential as diagnostic tools for progressive kidney disease monitoring but face clinical limitations such as motion artifacts and imaging speed, requiring further validation.
3.1.4 Superb microvascular imaging
Superb microvascular imaging (SMI), a novel vascular imaging technique without contrast agents, detects slow blood flow in small vessels with high frame rate, reduced motion artifacts, and high resolution. CKD stage 2–5 patients (including T2DM and hypertension) exhibited significantly lower SMI vascular indices compared to controls, correlating moderately with SCr and eGFR and aligning with histological changes and CKD stages (136). Thus, SMI can assess morphological renal changes and stage differentiation in CKD patients.
3.1.5 Artificial intelligence and ultrasound
Artificial intelligence (AI) leverages non-invasive data to predict pathological outcomes. Chang et al. (137) integrated ultrasound images and biomarkers (creatinine, age, gender, and proteinuria) of CKD patients into ML models, accurately predicting IFTA and providing a powerful non-invasive early CKD assessment tool. DL models based on SMI were superior to ultrasound radiomics and CDUS models in determining IF severity in CKD (138). Qin et al. (139) demonstrated excellent accuracy of a DL model combining grayscale US, SMI, and SE for early prediction of chronic renal fibrosis.
Ultrasound, widely utilized for non-invasive CKD assessment, has yet to clinically integrate CEUS and SMI fully due to renal position, motion artifacts, and cost. Nevertheless, SMI and ultrasound combined with AI exhibit substantial potential for renal fibrosis diagnosis.
3.2 Magnetic resonance imaging
Magnetic resonance imaging (MRI) is a powerful tool for assessing the structure and function of both kidneys. Renal fibrosis alters water diffusion patterns, oxygenation, perfusion, and tissue stiffness. Accordingly, MRI can evaluate renal fibrosis through various imaging techniques. Functional MRI modalities such as diffusion-weighted imaging (DWI), diffusion tensor imaging (DTI), intravoxel incoherent motion (IVIM) imaging, diffusion kurtosis imaging (DKI), blood oxygen level-dependent MRI (BOLD-MRI), and arterial spin labeling (ASL) have garnered increasing attention in CKD research. These methods allow dynamic monitoring of microstructural and functional changes in the kidneys and can quantitatively assess diffusion, fibrosis, and oxygenation without the need for exogenous contrast agents (140).
3.2.1 Diffusion MRI
In fibrotic kidneys, ECM deposition and tubular atrophy limit water diffusion, so diffusion MRI based on the pattern of water molecule diffusion in renal tissue can reflect the structure and spatial organization of the kidney.
3.2.1.1 DWI
DWI detects the random diffusional motion of water molecules and quantifies this process via the apparent diffusion coefficient (ADC). Renal fibrosis restricts water molecule diffusion, leading to a decrease in ADC values in the kidney (120, 141). Some studies have noted that in animal models of diabetic nephropathy and in patients with renal artery stenosis, renal ADC values are reduced and show a negative correlation with the degree of interstitial fibrosis (142–144).
3.2.1.2 DTI
DTI is an extension of DWI that evaluates the directional movement of water molecules and quantifies it using fractional anisotropy (FA). Renal fibrosis can lead to interstitial fibrosis, glomerulosclerosis, and inflammatory infiltrates, all of which can affect FA values. Studies in transplant kidneys have shown that medullary FA and ADC are significantly reduced, with both FA and ADC correlating positively with eGFR and negatively with fibrosis extent (145).
Moreover, the AUC of DTI was greater than that of ASL in accurately identifying allograft fibrosis (146). Other research has shown that in CKD patients of various etiologies (such as lupus nephritis) versus healthy controls, cortical FA values are significantly higher while ADC values are significantly lower in the patient group, indicating that DTI is a valuable noninvasive tool for assessing renal dysfunction and fibrosis (147). In addition, in CKD patients, cortical FA and ADC may help distinguish DN patients from healthy individuals and assess fibrosis severity (148). Therefore, DTI is a promising noninvasive method for evaluating renal dysfunction and fibrosis.
3.2.1.3 IVIM
IVIM-DWI can simultaneously assess the diffusion coefficient (D) of water molecules, the perfusion-related pseudo-diffusion coefficient (D*), and the perfusion fraction (f) (149). Mao et al. (149) compared IVIM parameters (D, D*, f) between CKD patients and healthy volunteers and found that all IVIM parameters were significantly lower in CKD patients than in controls. Additionally, renal parenchymal IVIM parameters were negatively correlated with fibrosis scores. In patients with DN, IgAN, and non-diabetic renal disease (NDRD), MRI parameters were significantly associated with interstitial fibrosis/tubular atrophy scores, suggesting that IVIM-DWI can aid in noninvasively evaluating renal function, fibrosis extent, and prognostic risk in DN and IgAN (150, 151), however, in a study by Ichikawa of CKD patients with varying disease severity, cortical D* values were lower in moderate-to-severe CKD than in mild CKD, whereas cortical f did not differ significantly between groups (152). Thus, IVIM shows promise for noninvasive assessment, but its utility in grading fibrosis severity requires further validation.
3.2.1.4 DKI
DKI is an extension of DTI that quantifies the non-Gaussian distribution of water molecule diffusion in tissue; it provides metrics such as the kurtosis (K) index, an apparent kurtosis coefficient (K), and a diffusion coefficient (D) analogous to ADC. Liu et al. (153) used DKI to evaluate renal fibrosis in IgAN and CKD patients and found that the kurtosis (K) value was significantly correlated with fibrosis scores, and it performed better in identifying severe IF/TA. This suggests that DKI can serve as a noninvasive method for detecting renal fibrosis in IgAN and CKD patients. In CKD patients, a histogram analysis of DKI-derived D and K values showed that the 90th percentile of cortical K and D had the strongest correlations with fibrosis scores. This histogram analysis demonstrated feasibility in assessing changes in renal function and fibrosis in CKD patients (154). Furthermore, in patients with primary kidney diseases, hypertension, or diabetes, DKI metrics such as mean diffusivity (MD) and interstitial fibrosis are negatively correlated, while axial kurtosis (K_a) is positively correlated with interstitial fibrosis. This suggests that DKI has potential applications in monitoring renal interstitial fibrosis (155).
3.2.2 BOLD-MRI
BOLD imaging uses the transverse relaxation time (T2* = 1/R2*) to assess tissue oxygenation. In fibrotic kidneys, deoxyhemoglobin levels are elevated and T2* relaxation time is shortened (156). In CKD patients, including those with non-diabetic renal disease (NDRD), the rate of eGFR decline is significantly associated with both cortical and medullary T2* values, suggesting that BOLD-MRI may provide a noninvasive method to assess the severity of renal injury (157). In CKD patients, including those with non-diabetic renal disease (NDRD), the rate of eGFR decline is significantly associated with both cortical and medullary T2* values, suggesting that BOLD-MRI may provide a noninvasive method to assess the severity of renal injury (158–161). However, in DN patients, renal T2* did not correlate with eGFR (162). Researchers have shown that factors such as the type and severity of kidney disease, plasma sodium concentration, fluid intake, hematocrit, microvascular density, and renal blood volume can influence T2* values, indicating that the effectiveness of BOLD-MRI in assessing renal fibrosis remains a subject of debate (163, 164).
3.2.3 ASL MRI
Arterial spin labeling (ASL) is a quantitative MRI technique based on tissue perfusion; it uses magnetically labeled arterial blood water as an endogenous tracer to measure renal perfusion (reported in mL/100 g/min) (165). In an allograft transplant model, renal perfusion was decreased and was inversely correlated with fibronectin expression. ASL-MRI studies comparing transplant recipients to healthy controls found that peritubular capillary density was significantly reduced in transplanted kidneys, and that cortical renal blood flow (RBF) decreased with increasing fibrosis, with a moderate negative correlation to Banff fibrosis scores (166, 167). Additionally, in CKD patients (including those with DN and IgAN), RBF declines as interstitial fibrosis worsens. Morra-Gutierrez reported a significant difference in cortical perfusion when IF exceeded 30%, while Mao et al. (168) reported that the ROC AUCs for ASL-derived RBF were 0.93 and 0.90 in distinguishing ≤25% vs. >25% IF and ≤50% vs. >50% IF, respectively (169, 170). Therefore, ASL can serve as a predictor of DKD progression and fibrosis; however, due to low signal-to-noise ratio and resolution limitations, larger longitudinal studies are needed to evaluate its potential for CKD and fibrosis stratification. Therefore, ASL can serve as a predictor of DKD progression and fibrosis; however, due to low signal-to-noise ratio and resolution limitations, larger longitudinal studies are needed to evaluate its potential for CKD and fibrosis stratification.
3.2.4 Magnetic resonance elastography
Similar to SWE, magnetic resonance elastography (MRE) can be used to assess tissue stiffness. In an adenine-induced rat model of renal fibrosis, MRE showed significantly increased shear wave speed (SWS) in fibrotic kidneys, and this SWS was positively correlated with the collagen area fraction (CAF) (171). In kidney transplant patients with biopsy-confirmed fibrosis, renal stiffness measured by MRE correlated positively with Banff fibrosis scores (172). However, a study by Chauveau et al. (173) found no significant correlation between MRE-derived stiffness and Banff fibrosis scores, nor an inverse correlation between stiffness and cortical glomerulosclerosis rate, suggesting that reduced renal blood flow might explain these discrepancies. Similarly, mixed results have been observed in patients with DN, IgAN, and LN. Brown reported that renal stiffness gradually decreased as DN progressed, while renal blood flow measured by ASL also declined significantly; the latter showed a strong positive correlation with both eGFR and MRE-derived shear stiffness (170). Furthermore, healthy individuals exhibited increased renal stiffness after water loading, indicating that increased renal perfusion pressure can raise tissue stiffness (174). Thus, while MRE does reflect the presence of renal fibrosis, factors such as renal perfusion contribute to variability in measurements.
3.2.5 Other novel MR techniques
In patients with chronic glomerulonephritis (CGN), native T1 relaxation times are significantly elevated, closely correlating with CKD stage. ROC analysis showed that the optimal T1 threshold for predicting renal fibrosis was 1,695 ms (specificity 0.778, sensitivity 0.625). Therefore, native T1 mapping can be an effective, noninvasive method for detecting renal fibrosis in CGN patients (175). MPI is an innovative functional imaging modality exploiting SPION nonlinear responses to achieve three-dimensional lesion localization. Its high sensitivity, temporal resolution, and quantitative measurement capabilities make it highly suitable for preclinical molecular imaging applications (176).
Additionally, as noted above, fibroblast activation protein (FAP) can serve as a fibrosis biomarker. Combining MRI with a FAP-targeted fluorescent probe enabled highly sensitive imaging of fibrotic kidneys in a UUO mouse model, demonstrating potential for early RF diagnosis and guidance of FAP-targeted therapy (177). Using amide proton transfer-weighted MRI (APTw) in bilateral renal ischemia-reperfusion (IRI) and UUO models, researchers found that cortical APT (cAPT) and medullary APT (mAPT) values were positively correlated with the extent of renal fibrosis; in early-stage fibrosis, APT values had better diagnostic performance than ADC values (178). Gd-OA, a probe targeting collagen side chains designed by Chen et al. (179), and newly synthesized gadolinium oxide nanoparticles (Gd₂O₃ NPs) by Ashouri et al. (180), have been shown in combination with MRI to be important tools for detecting and staging renal fibrosis in animal models. However, further research is needed to determine their clinical applicability.
In summary, diffusion-based MRI techniques—including DWI, DTI, IVIM, and DKI—have shown potential value for noninvasive diagnosis of renal fibrosis. Studies have found significant differences in parameters such as ADC, D, D*, f_p, mean kurtosis (MK), and MD between CKD stages 1–2 and 3–5 in patients and healthy volunteers. Moreover, renal MD, D, and medullary FA are negatively correlated with injury scores. Thus, IVIM appears to have higher diagnostic value than DWI in CKD patients. However, another study noted that DKI and medullary DTI outperformed DWI and IVIM in evaluating the severity of renal pathology and dysfunction in CKD (181, 182). Additionally, in IgAN patients and healthy volunteers, multiple MRI parameters (cortical and medullary T2*, ADC, D, D*, and f) decreased with declining eGFR. Except for cortical and medullary D*, all MRI parameters were significantly correlated with interstitial fibrosis scores, with cortical D* showing the strongest correlation. Therefore, IVIM-DWI and BOLD-MRI can aid in further assessing renal function, Oxford classification lesions, and prognostic risk in IgAN patients (150).
3.3 Computed tomography and positron emission tomography/computed tomography
3.3.1 CT
Because iodinated contrast agents may worsen renal insufficiency, contrast-enhanced computed tomography (CT) is rarely used in the clinical diagnosis of kidney diseases (183). Radiomics employs advanced algorithms to convert standard medical images into high-dimensional data arrays, capturing subtle renal structural changes. CT combined with ML demonstrated higher diagnostic accuracy (AUC) in differentiating CKD stages 1–3 from healthy controls compared to radiologists (184). A CNN model developed by Chantaduly et al. (185) differentiated mild/moderate from severe renal fibrosis similarly to renal biopsy. Ren et al. (186) reported superior performance of combined radiomics models in predicting IF grading (mild–moderate vs. severe).
3.3.2 PET/CT
PET/CT offers high specificity and sensitivity by using molecular probes that target specific biological processes or molecules to quantitatively assess radiotracer accumulation in fibrotic tissue, thereby elucidating disease mechanisms (187). In normal organs, FAP is barely detectable, but it is significantly upregulated in areas of tissue remodeling, including renal and pulmonary fibrosis (188). Huang et al. (189) employed PET/CT with FAP-targeted tracers ([18F]FAPI-42 and [18F]AlF-NOTA-FAPI) to image kidneys on day 2 after acute kidney injury (AKI). They found that AKI was associated with renal fibrosis by day 14, and that FAP-specific PET/CT imaging was able to dynamically observe the maladaptive repair process after AKI and predict the development of renal fibrosis. The radiolabeled FAP inhibitor [68Ga]Ga-FAPI-04 has been demonstrated as an imaging tracer for PET/CT. Our team was the first to perform [68Ga]Ga-FAPI-04 PET/CT in an adenine-induced CKD model, reporting increased renal FAPI uptake that rose over time and correlated with the extent of renal fibrosis (190). We subsequently applied this imaging in CKD patients undergoing biopsy, and the results showed that nearly all patients with renal fibrosis exhibited tracer uptake, which increased with fibrosis severity, indicating that [68Ga]Ga-FAPI-04 PET/CT can sensitively detect renal fibrosis at early stages (191). Additionally, a peritoneal fibrosis (PF) rat model showed significantly increased 68Ga tracer uptake compared to controls (192). PET/CT imaging with [68Ga]Ga-FAPI-04 was also performed in LN patients and healthy individuals. The study found that renal uptake of 68Ga-FAPI-04 was positively correlated with disease progression, serum creatinine, chronicity index, and the degree of tubulointerstitial fibrosis. LN patients had significantly higher renal 68Ga-FAPI-04 uptake than healthy controls, suggesting that 68Ga-FAPI-04 PET/CT can be used for noninvasive assessment of tubulointerstitial fibrosis in active lupus nephritis (193). Conen et al. (194) conducted a retrospective analysis of patients who underwent [68Ga]Ga-FAPI PET/CT and reported that renal parenchymal FAPI uptake was significantly inversely correlated with eGFR, indicating that [68Ga]Ga-FAPI has potential as a noninvasive tool for CKD staging and quantitative assessment. Furthermore, in a trial of 14 patients with histologically confirmed Erdheim–Chester disease (ECD), 68Ga-FAPI PET/CT outperformed 18F-FDG PET/CT, including showing enhanced image contrast and higher lesion SUV max across multiple organs (kidneys, heart, lungs) (195). Wang et al. (196–198) reported the use of 18F-AlF-NOTA-FAPI-04 PET/CT in a patient with multiple myeloma and renal interstitial fibrosis. The scan showed markedly increased FAPI uptake in both kidneys. In a comparison with healthy individuals, patients with IgAN, MN, or DN had significantly higher renal uptake on 18F-AlF-NOTA-FAPI-04 PET/CT. Moreover, renal SUV_max correlated positively with interstitial fibrosis, tubular atrophy, and tubulointerstitial inflammation scores on biopsy, suggesting that 18F-AlF-NOTA-FAPI-04 PET/CT may be valuable for noninvasive evaluation of renal interstitial fibrosis and for monitoring disease progression. The authors proposed that 18F-AlF-NOTA-FAPI-04 could serve as an alternative to [68Ga]Ga-FAPI. If FAPI-targeted imaging is validated in larger dedicated studies and proven to be specific for fibrosis, it may represent the first direct noninvasive imaging approach for renal fibrosis (199).
Cardiorenal syndrome is defined as a pathophysiological disorder including both heart and kidneys (200). Brown has suggested that 13N-ammonia PET/CT can simultaneously evaluate myocardial and renal perfusion. In his study, resting PET-measured renal blood flow was strongly negatively correlated with histological interstitial fibrosis, opening a potential new avenue to investigate therapies that confer overlapping benefits to the heart and kidneys (201). In summary, PET/CT provides a comprehensive assessment of renal structure and function, effectively monitors CKD and renal fibrosis progression, and offers opportunities for early detection, accurate diagnosis, and personalized therapeutic strategies.
3.4 Radiomics
With technological advancements, radiomics holds promise for providing more reliable and accurate information on diagnosis, treatment, and prognosis. Lu et al. (202) developed a multimodal molecular imaging system integrating PET, SPECT, FMI, and CT to obtain comprehensive small animal imaging data. The kidney imaging project (KIP) initiated by Zhou et al. (203) aims to advance precision nephrology through multimodal, multi-scale renal imaging atlases.
4 Discussion and conclusions
In conclusion, despite renal biopsy remaining the diagnostic gold standard for renal fibrosis, it is limited by invasiveness, bleeding risks, and sampling inadequacies. Various serum and urinary biomarkers are crucial for early diagnosis, dynamic monitoring, and therapeutic evaluation (Table 2). Biomarkers like TGFβ1 reflect fibrosis and inflammation activation; pro-fibrotic cytokines (e.g., IL-6) correlate with renal dysfunction and fibrosis progression. Urinary biomarkers (KIM-1, NGAL) directly reflect local pathology and ongoing tubular injury; collagen metabolites, exosome-derived miRNAs (miR-21, miR-29), and TIMPs relate to abnormal ECM deposition (Figure 3). However, due to limited assay standardization (e.g., ELISA) and insufficient specificity, combined use of biomarkers with multi-omics (proteomics, metabolomics) and ML has gained attention. Clinical translation remains challenged by assay standardization and pathology correlations. Integration of biomarkers with radiomics and AI may enhance fibrosis assessment precision in the future.
Table 2
| Classification | Biomarker | Type of disease (person) | Sample type | Advantage | Disadvantage |
|---|---|---|---|---|---|
| ECM | PRO-C3, PRO-C6 and C1M, C3M | AAV kidney involvement (8) LN (9), IgAN (10), T2DM (11) |
Blood, urine | Related to collagen synthesis/degradation | Interfered with by fibrosis of other organs |
| MMPs | T2DM (15) Hypertension (16) DKD and IgAN (17, 18) |
Blood, urine | Hypertension and T2DM are early indicators of CKD progression Related to RF | Thresholds are not uniform | |
| Biomarkers associated with inflammation activation | TGFβ1 | IgAN (22), DKD (25), LN (12) | Blood, urine | Direct involvement in the fibrosis process correlated with eGFR and TIF | Extensive involvement in fibrosis of other organs Not specific |
| MCP-1 | DKD (27, 28), CKD with hypertension (29), LN (30) | Blood, urine | Increased significantly at the initiation stage of fibrosis | Interfered by urinary tract infection | |
| ILs | CKD with hypertension or T2DM (IL-6, IL-18 and IL-33) (32), DKD (IL-6) (33) Kidney transplant (IL-8 mRNA) (34), IgAN (IL-7) (35) DKD (IL-22) |
Blood, urine | Increased in CKD Related to eGFR and degree of fibrosis |
Does not increase the predicted risk of disease progression | |
| Tubular injury markers | KIM-1 | ANCA-GN (39) | Blood, urine | Indicates tubular injury and CKD severity | Does not increase the predicted risk of disease progression Factors such as infection and ischemia interfere |
| NGAL | CTIN, MN (42), T2DM (36) | Blood, urine | |||
| NAG | DKD (44) | Blood, urine | |||
| DKK-3 | CKD (48) kidney transplant (49) PD (51) | Urine | Increased in CKD Related to eGFR and degree of fibrosis |
Lack of large-scale queue validation | |
| VCAM1 | MLN, PLN (53, 54) T2DM, DKD (55) LN (56) | Blood | Associated with the degree of renal interstitial inflammation and fibrosis score | Elevated in AS and infection Low specific |
|
| EVs | mRNA | DKD, FSGS, IgAN, MN (CD2AP mRNA) (59) Kidney transplant (VTN) (60) |
Urine | Reflects the physiological state of the source cell | Lack of consensus on standardization of urine collection, processing and storage and on uEV separation and downstream analysis |
| miRNA | Peritoneal dialysis (miR-21) (62) IgAN (miR-451a) (63) |
Urine | |||
| Urine sediment and urinary exfoliated cell | Renal tubular epithelial cells or casts urinary isomorphic erythrocytes | DKD (66) ANCA-MPO vasculitis (67) |
Urine | Directly reflects the core link of tubular injury | Impossible to distinguish between AKI and CKD |
| Metabolites from the gut | Pcs, IXS, indole-3-propionic acid, indole-3-aldehyde, and tryptamine | CKD (72) MN (74) |
Blood | Associated with the fibrosis score | Interfered by liver function and protein intake |
| TMAO | T2DM, CKD (77–84) | Positively correlated with Scr, BUN and UACR, and negatively correlated with eGFR | Affected by age, sex, BMI, and diet Correlated with AS Low specific |
Blood or urine markers for diagnosing kidney fibrosis.
Biomarkers: PRO-C3, procollagen III N-terminal propeptide; PRO-C6, procollagen VI C-terminal propeptide; C1M, collagen type I degradation marker; C3M, collagen type III degradation marker; MMPs, matrix metalloproteinases; TGFβ1, transforming growth factor beta-1; MCP-1, monocyte chemoattractant protein-1; ILs, interleukins; DKK-3, Dickkopf-related protein 3; VCAM1, vascular cell adhesion molecule 1; TMAO, trimethylamine N-oxide; KIM-1, kidney injury molecule-1; NGAL, neutrophil gelatinase-associated lipocalin; NAG, N-acetyl-β-D-glucosaminidase; VTN, von Willebrand factor-associated nephropathy. Diseases and pathology: LN, lupus nephritis; IgAN, immunoglobulin A nephropathy; T2DM, type 2 diabetes mellitus; ANCA-GN, ANCA-associated glomerulonephritis; D-CTIN, drug-induced chronic tubulointerstitial nephritis; MN, membranous nephropathy; PD, peritoneal dialysis; MLN, membranous lupus nephritis; PLN, primary lipoprotein glomerulopathy; FSGS, focal segmental glomerulosclerosis; ANCA-MPO, vasculitis, myeloperoxidase-ANCA vasculitis; AAV, ANCA-associated vasculitis. Others: TIF, tubulointerstitial fibrosis; AS, atherosclerosis; BMI, body mass index.
Figure 3
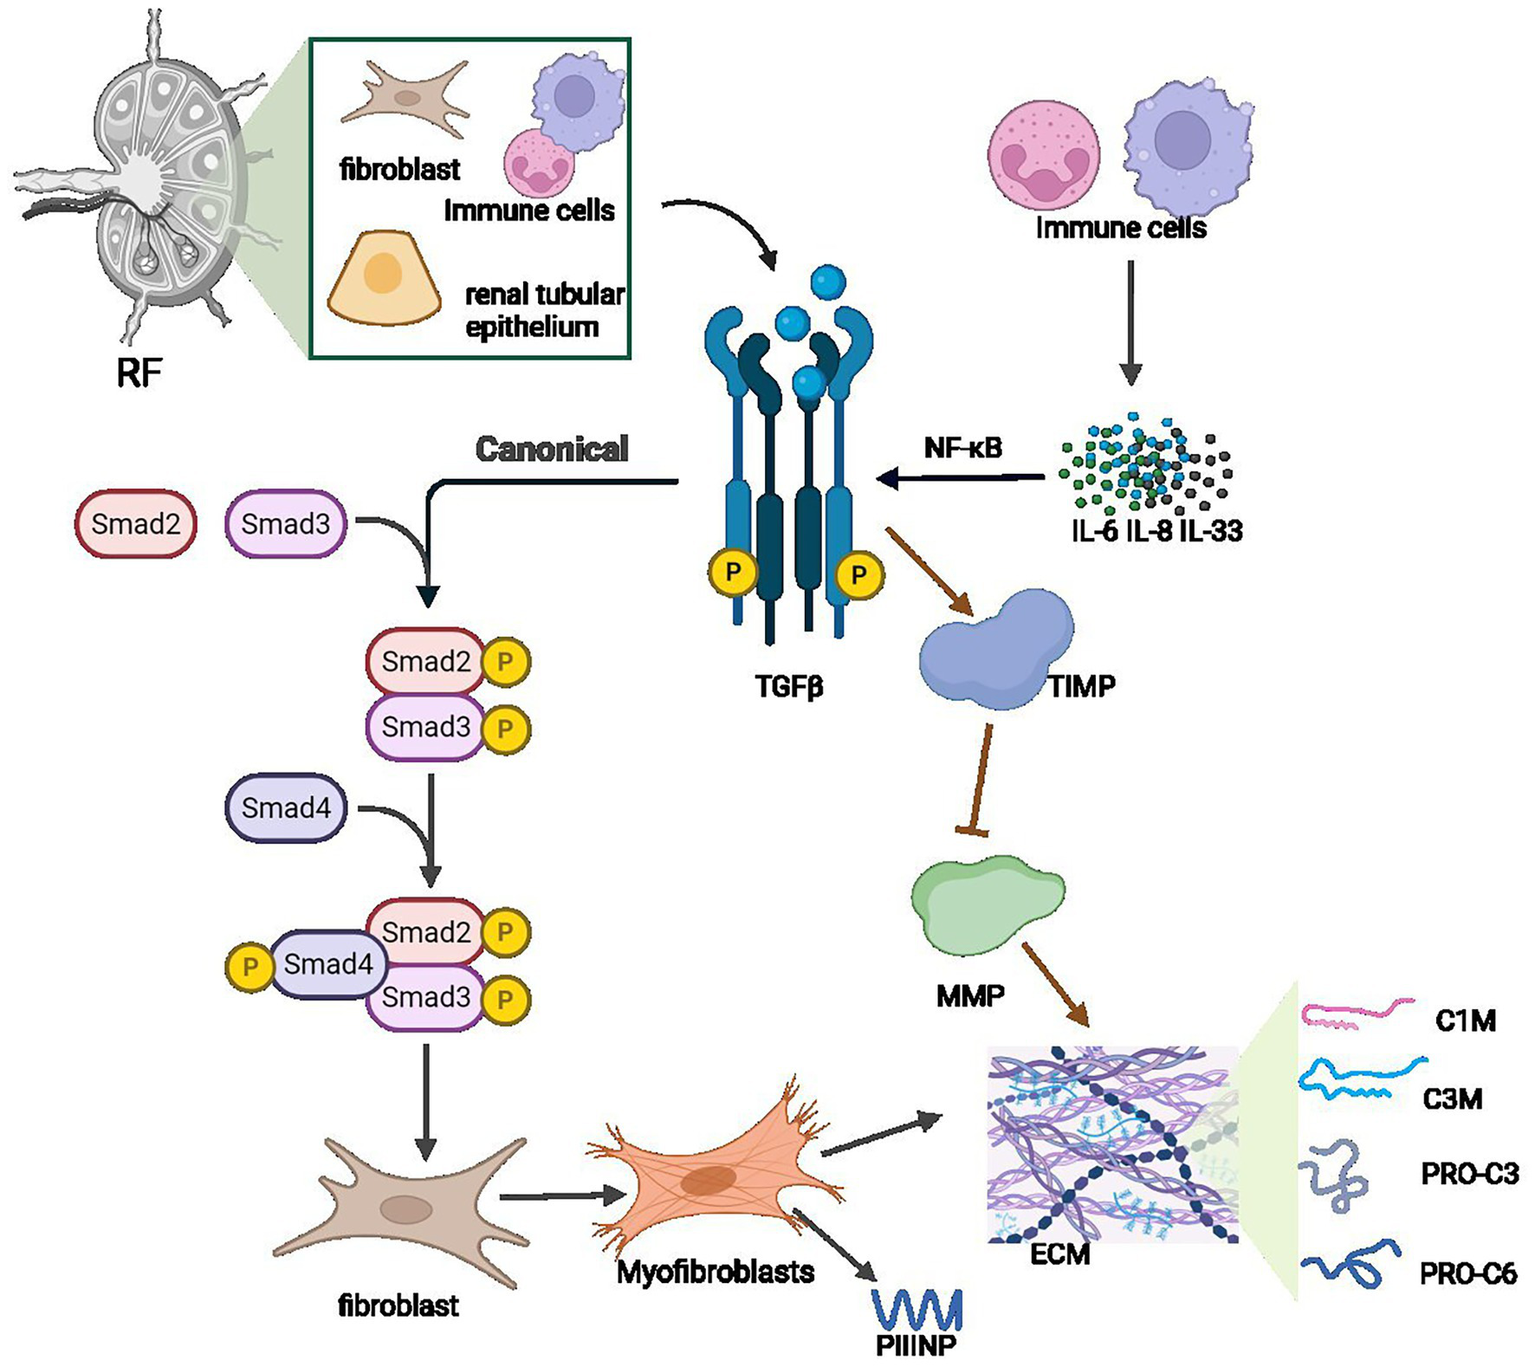
Key hematological biomarkers for noninvasive diagnosis of renal fibrosis.
Advancements in ultrasound technologies (SRUS, SMI) are transitioning renal fibrosis diagnostics from macroscopic to microcirculatory, molecular, and functional multidimensional assessments. Despite limitations, multimodal imaging with AI may eventually replace biopsies. Imaging methods (DWI, DTI, IVIM) show inconsistent correlations with fibrosis. Enhanced CT and MRI pose risks; radiomics and AI may improve diagnostic accuracy but need further clinical validation. PET/CT combined with FAPI shows high specificity and sensitivity, offering promising quantitative diagnostic potential for renal fibrosis (Table 3).
Table 3
| Detection | Method | Advantage | Disadvantage | Clinical application | Diagnostic value |
|---|---|---|---|---|---|
| Tissue stiffness | USE | Non-invasive, real-time imaging, low cost, no radiation | Dependent on the operator’s experience, sensitive to obesity or gas interference, with limited depth | Initial screening and dynamic monitoring of fibrosis p regression | Dependent on the operator’s experience, sensitive to obesity or gas interference, with limited depth |
| MRE | Quantifiable, high accuracy, unaffected by operator influence | High equipment requirements and low adoption rate | During the research phase, potential non-invasive evaluation tools | The reflection of kidney fibrosis by MRE remains controversial due to factors such as renal perfusion | |
| Diffusion of water molecules | DWI | Noninvasive, no contrast agent | It is susceptible to respiratory motion artifacts and has low resolution | Auxiliary diagnosis of fibrosis and differentiation of other kidney diseases (such as inflammation) | It needs to be combined with other sequences, and its sensitivity and specificity need to be improved |
| DTI | Assess structural disorder caused by fibrosis | The scanning time is long, the motion is sensitive, and the clinical application is limited | Conducted to assess early fibrosis in DN or hypertensive kidney damage | Lack of standardized parameter threshold, the research is mostly in the experimental stage | |
| IVIM | Distinguish between perfusion and diffusion | Post-processing is complex | Early microcirculation assessment | The severity of renal fibrosis needs to be further verified | |
| DKI | Sensitive detection of heterogeneity | High equipment requirements | Research evaluates complex fibrosis | Potential applications in renal interstitial fibrosis | |
| The collagen content | PAI | Molecular targeting potential | Poor biocompatibility, limited detection depth and low resolution | Experimental studies or targeted therapy evaluation | Few studies on its application in clinic |
| Tissue oxygenation | BOLD MRI | Noninvasive assessment of hypoxia | Specificity is low, factors such as plasma sodium concentration, water intake, renal blood volume were affected | Monitor chronic hypoxia injury | Indirect indicator |
| Tissue perfusion | ASL-MRI | No contrast agent is required and it can be repeated | The signal-to-noise ratio is low, the motion is sensitive, and the technology has not been fully standardized | Monitor ischemic changes associated with fibrosis | Indirectly reflects the degree of fibrosis (related to renal function) |
| Radioactive concentration accumulated in fibrotic tissues | PET/CT | Functional imaging, high specificity and sensitivity reflecting pathophysiological changes | Radiation exposure, low resolution and high cost | Research areas (such as the development of targeted fibrosis molecular probes) | At present, it is mainly used for scientific research, and its clinical routine application is limited |
Characteristics of noninvasive renal fibrosis imaging techniques.
In conclusion, despite significant advancements and the demonstrated potential of serum and urinary biomarkers and imaging techniques such as ultrasound, PET/CT, and MRI, much work remains to be done to clarify biomarker mechanisms, enhance imaging diagnostic thresholds, and expand the clinical translation of these methods. Future efforts should focus on integrating novel biomarkers and imaging modalities with multi-omics and artificial intelligence approaches to overcome the current “bench-to-bedside” translation bottleneck, enabling earlier diagnosis and treatment of renal fibrosis.
Statements
Author contributions
TY: Writing – original draft, Software, Writing – review & editing, Conceptualization. HW: Writing – review & editing, Writing – original draft, Conceptualization. TK: Software, Writing – review & editing. WW: Writing – review & editing, Methodology. SO: Supervision, Writing – review & editing.
Funding
The author(s) declare that no financial support was received for the research and/or publication of this article.
Acknowledgments
Parts of the figures were created using BioRender (https://biorender.com/, accessed on May 26, 2025). Parts of the figures were created with MedPeer (https://medpeer.cn).
Conflict of interest
The authors declare that the research was conducted in the absence of any commercial or financial relationships that could be construed as a potential conflict of interest.
Generative AI statement
The authors declare that no Gen AI was used in the creation of this manuscript.
Publisher’s note
All claims expressed in this article are solely those of the authors and do not necessarily represent those of their affiliated organizations, or those of the publisher, the editors and the reviewers. Any product that may be evaluated in this article, or claim that may be made by its manufacturer, is not guaranteed or endorsed by the publisher.
References
1.
Chen TK Knicely DH Grams ME . Chronic kidney disease diagnosis and management: a review. JAMA. (2019) 322:1294–304. doi: 10.1001/jama.2019.14745
2.
Khandpur S Mishra P Mishra S Tiwari S . Challenges in predictive modelling of chronic kidney disease: a narrative review. World J Nephrol. (2024) 13:97214. doi: 10.5527/wjn.v13.i3.97214
3.
Kovesdy CP . Epidemiology of chronic kidney disease: an update 2022. Kidney Int Suppl. (2022) 12:7–11. doi: 10.1016/j.kisu.2021.11.003
4.
Li L Fu H Liu Y . The fibrogenic niche in kidney fibrosis: components and mechanisms. Nat Rev Nephrol. (2022) 18:545–57. doi: 10.1038/s41581-022-00590-z
5.
Balakumar P . Unleashing the pathological role of epithelial-to-mesenchymal transition in diabetic nephropathy: the intricate connection with multifaceted mechanism. World J Nephrol. (2024) 13:95410. doi: 10.5527/wjn.v13.i2.95410
6.
Liu D Chen X He W Lu M Li Q Zhang S et al . Update on the pathogenesis, diagnosis, and treatment of diabetic tubulopathy. Integr Med Nephrol Androl. (2024) 11:e23-00029. doi: 10.1097/IMNA-D-23-00029
7.
Raikou VD . Renoprotective strategies. World J Nephrol. (2024) 13:89637. doi: 10.5527/wjn.v13.i1.89637
8.
Satrapova V Sparding N Genovese F Karsdal MA Bartonova L Frausova D et al . Biomarkers of fibrosis, kidney tissue injury and inflammation may predict severity and outcome of renal ANCA—associated vasculitis. Front Immunol. (2023) 14:1122972. doi: 10.3389/fimmu.2023.1122972
9.
Genovese F Akhgar A Lim SS Farris AB Battle M Cobb J et al . Collagen type III and VI remodeling biomarkers are associated with kidney fibrosis in lupus nephritis. Kidney360. (2021) 2:1473–81. doi: 10.34067/KID.0001132021
10.
Genovese F Rasmussen DGK Karsdal MA Jesky M Ferro C Fenton A et al . Imbalanced turnover of collagen type III is associated with disease progression and mortality in high-risk chronic kidney disease patients. Clin Kidney J. (2021) 14:593–601. doi: 10.1093/ckj/sfz174
11.
Poulsen CG Rasmussen DGK Genovese F Hansen TW Nielsen SH Reinhard H et al . Marker for kidney fibrosis is associated with inflammation and deterioration of kidney function in people with type 2 diabetes and microalbuminuria. PLoS One. (2023) 18:e0283296. doi: 10.1371/journal.pone.0283296
12.
Rende U Guller A Goldys EM Pollock C Saad S . Diagnostic and prognostic biomarkers for tubulointerstitial fibrosis. J Physiol. (2023) 601:2801–26. doi: 10.1113/JP284289
13.
Zakiyanov O Kalousová M Zima T Tesař V . Matrix metalloproteinases in renal diseases: a critical appraisal. Kidney Blood Press Res. (2019) 44:298–330. doi: 10.1159/000499876
14.
Enoksen IT Svistounov D Norvik JV Stefansson VTN Solbu MD Eriksen BO et al . Serum matrix metalloproteinase 7 and accelerated glomerular filtration rate decline in a general non-diabetic population. Nephrol Dial Transplant. (2022) 37:1657–67. doi: 10.1093/ndt/gfab251
15.
Ihara K Skupien J Kobayashi H Md Dom ZI Wilson JM O’Neil K et al . Profibrotic circulating proteins and risk of early progressive renal decline in patients with type 2 diabetes with and without albuminuria. Diabetes Care. (2020) 43:2760–7. doi: 10.2337/dc20-0630
16.
Sarangi R Tripathy KP Bahinipati J Gupta P Pathak M Mahapatra S et al . Urinary MMP-7: a predictive, noninvasive early marker for chronic kidney disease development in patients with hypertension. Lab Med. (2022) 53:386–93. doi: 10.1093/labmed/lmac003
17.
Yang X Ou J Zhang H Xu X Zhu L Li Q et al . Urinary matrix metalloproteinase 7 and prediction of IgA nephropathy progression. Am J Kidney Dis. (2020) 75:384–93. doi: 10.1053/j.ajkd.2019.07.018
18.
Hirohama D Abedini A Moon S Surapaneni A Dillon ST Vassalotti A et al . Unbiased human kidney tissue proteomics identifies matrix metalloproteinase 7 as a kidney disease biomarker. J Am Soc Nephrol. (2023) 34:1279–91. doi: 10.1681/ASN.0000000000000141
19.
Ren LL Miao H Wang YN Liu F Li P Zhao YY . TGF-β as a master regulator of aging-associated tissue fibrosis. Aging Dis. (2023) 10:5. doi: 10.14336/ad.2023.0222
20.
Bagnasco SM Rosenberg AZ . Biomarkers of chronic renal tubulointerstitial injury. J Histochem Cytochem. (2019) 67:633–41. doi: 10.1369/0022155419861092
21.
Mitra P Jana S Roy S . A mini review: role of novel biomarker for kidney disease of future study. Adv Biomarker Sci Technol. (2025) 7:65–75. doi: 10.1016/j.abst.2025.02.002
22.
Bharti N Agrawal V Kamthan S Prasad N Agarwal V . Blood TGF-β1 and miRNA-21-5p levels predict renal fibrosis and outcome in IgA nephropathy. Int Urol Nephrol. (2023) 55:1557–64. doi: 10.1007/s11255-023-03464-w
23.
Zhao H Li Z Yan M Ma L Dong X Li X et al . Irbesartan ameliorates diabetic kidney injury in db/db mice by restoring circadian rhythm and cell cycle. J Transl Int Med. (2024) 12:157–69. doi: 10.2478/jtim-2022-0049
24.
Hou Y Tan E Shi H Ren X Wan X Wu W et al . Mitochondrial oxidative damage reprograms lipid metabolism of renal tubular epithelial cells in the diabetic kidney. Cell Mol Life Sci. (2024) 81:23. doi: 10.1007/s00018-023-05078-y
25.
Mitra P Jana S Roy S . Insights into the therapeutic uses of plant derive Phytocompounds on Diabetic nephropathy. Curr Diabetes Rev. (2024) 20:e230124225973. doi: 10.2174/0115733998273395231117114600
26.
He S Yao L Li J . Role of MCP-1/CCR2 axis in renal fibrosis: mechanisms and therapeutic targeting. Medicine. (2023) 102:e35613. doi: 10.1097/MD.0000000000035613
27.
Phanish MK Chapman AN Yates S Price R Hendry BM Roderick PJ et al . Evaluation of urinary biomarkers of proximal tubular injury, inflammation, and fibrosis in patients with albuminuric and nonalbuminuric diabetic kidney disease. Kidney Int Rep. (2021) 6:1355–67. doi: 10.1016/j.ekir.2021.01.012
28.
Siddiqui K Joy SS Al-Rubeaan K . Association of urinary monocyte chemoattractant protein-1 (MCP-1) and kidney injury molecule-1 (KIM-1) with risk factors of diabetic kidney disease in type 2 diabetes patients. Int Urol Nephrol. (2019) 51:1379–86. doi: 10.1007/s11255-019-02201-6
29.
Miller LM Rifkin D Lee AK Kurella Tamura M Pajewski NM Weiner DE et al . Association of urine biomarkers of kidney tubule injury and dysfunction with frailty index and cognitive function in persons with CKD in SPRINT. Am J Kidney Dis. (2021) 78:530–540.e531. doi: 10.1053/j.ajkd.2021.01.009
30.
Urrego-Callejas T Álvarez SS Arias LF Reyes BO Vanegas-García AL González LA et al . Urinary levels of ceruloplasmin and monocyte chemoattractant protein-1 correlate with extra-capillary proliferation and chronic damage in patients with lupus nephritis. Clin Rheumatol. (2021) 40:1853–9. doi: 10.1007/s10067-020-05454-0
31.
Mertowska P Mertowski S Smarz-Widelska I Grywalska E . Biological role, mechanism of action and the importance of interleukins in kidney diseases. Int J Mol Sci. (2022) 23:647. doi: 10.3390/ijms23020647
32.
Doke T Abedini A Aldridge DL Yang Y-W Park J Hernandez CM et al . Single-cell analysis identifies the interaction of altered renal tubules with basophils orchestrating kidney fibrosis. Nat Immunol. (2022) 23:947–59. doi: 10.1038/s41590-022-01200-7
33.
Taslipinar A Yaman H Yilmaz MI Demirbas S Saglam M Taslipinar MY et al . The relationship between inflammation, endothelial dysfunction and proteinuria in patients with diabetic nephropathy. Scand J Clin Lab Invest. (2011) 71:606–12. doi: 10.3109/00365513.2011.598944
34.
García-Covarrubias L Cedillo JS Morales L Fonseca-Sanchez M-A García-Covarrubias A Villanueva-Ortega E et al . Interleukin 8 is overexpressed in acute rejection in kidney transplant patients. Transplant Proc. (2020) 52:1127–31. doi: 10.1016/j.transproceed.2020.02.005
35.
Deng Y-J Lin X-P Li X-Q Lu P-F Cai Y Liu L-l et al . Interleukin-7 is associated with clinical and pathological activities in immunoglobulin A nephropathy and protects the renal proximal tubule epithelium from cellular fibrosis. Curr Med Sci. (2021) 41:880–7. doi: 10.1007/s11596-021-2409-z
36.
Varatharajan S Jain V Pyati AK Neeradi C Reddy KS Pallavali JR et al . Neutrophil gelatinase-associated lipocalin, kidney injury molecule-1, and periostin: novel urinary biomarkers in diabetic nephropathy. World J Nephrol. (2024) 13:98880. doi: 10.5527/wjn.v13.i4.98880
37.
Jana S Mitra P Dutta A Khatun A Kumar Das T Pradhan S et al . Early diagnostic biomarkers for acute kidney injury using cisplatin-induced nephrotoxicity in rat model. Curr Res Toxicol. (2023) 5:100135. doi: 10.1016/j.crtox.2023.100135
38.
Ix JH Shlipak MG . The promise of tubule biomarkers in kidney disease: a review. Am J Kidney Dis. (2021) 78:719–27. doi: 10.1053/j.ajkd.2021.03.026
39.
Brilland B Boud'hors C Wacrenier S Blanchard S Cayon J Blanchet O et al . Kidney injury molecule 1 (KIM-1): a potential biomarker of acute kidney injury and tubulointerstitial injury in patients with ANCA-glomerulonephritis. Clin Kidney J. (2023) 16:1521–33. doi: 10.1093/ckj/sfad071
40.
Abbasi F Moosaie F Khaloo P Dehghani Firouzabadi F Fatemi Abhari SM Atainia B et al . Neutrophil gelatinase-associated lipocalin and retinol-binding protein-4 as biomarkers for diabetic kidney disease. Kidney Blood Press Res. (2020) 45:222–32. doi: 10.1159/000505155
41.
Bourgonje AR Abdulle AE Bourgonje MF Kieneker LM La Bastide-van GS Gordijn SJ et al . Plasma neutrophil gelatinase-associated lipocalin associates with new-onset chronic kidney disease in the general population. Biomol Ther. (2023) 13:338. doi: 10.3390/biom13020338
42.
Bolignano D Coppolino G Campo S Aloisi C Nicocia G Frisina N et al . Urinary neutrophil gelatinase-associated lipocalin (NGAL) is associated with severity of renal disease in proteinuric patients. Nephrol Dial Transplant. (2008) 23:414–6. doi: 10.1093/ndt/gfm541
43.
Washino S Hosohata K Miyagawa T . Roles played by biomarkers of kidney injury in patients with upper urinary tract obstruction. Int J Mol Sci. (2020) 21:5490. doi: 10.3390/ijms21155490
44.
Lin Z-H Dai S-F Zhao J-N Jiang Y . Application of urinary N-acetyl-β-D-glucosaminidase combined with serum retinol-binding protein in early detection of diabetic nephropathy. World J Diabetes. (2023) 14:883–91. doi: 10.4239/wjd.v14.i6.883
45.
Nüsken E Weber LT . IgA vasculitis nephritis. Curr Opin Pediatr. (2022) 34:209–16. doi: 10.1097/MOP.0000000000001120
46.
Hsu C-Y Xie D Waikar SS Bonventre JV Zhang X Sabbisetti V et al . Urine biomarkers of tubular injury do not improve on the clinical model predicting chronic kidney disease progression. Kidney Int. (2017) 91:196–203. doi: 10.1016/j.kint.2016.09.003
47.
Fang X Hu J Chen Y Shen W Ke B . Dickkopf-3: current knowledge in kidney diseases. Front Physiol. (2020) 11:533344. doi: 10.3389/fphys.2020.533344
48.
Federico G Meister M Mathow D Heine GH Moldenhauer G Popovic ZV et al . Tubular Dickkopf-3 promotes the development of renal atrophy and fibrosis. JCI Insight. (2016) 1:e84916. doi: 10.1172/jci.insight.84916
49.
Dziamałek-Macioszczyk P Winiarska A Pawłowska A Wojtacha P Stompór T . Patterns of Dickkopf-3 serum and urine levels at different stages of chronic kidney disease. J Clin Med. (2023) 12:4705. doi: 10.3390/jcm12144705
50.
Sánchez-Álamo B García-Iñigo FJ Shabaka A Acedo JM Cases-Corona C Domínguez-Torres P et al . Urinary Dickkopf-3: a new biomarker for CKD progression and mortality. Nephrol Dial Transplant. (2021) 36:2199–207. doi: 10.1093/ndt/gfab198
51.
Torigoe K Muta K Tsuji K Yamashita A Torigoe M Abe S et al . Association of urinary Dickkopf-3 with residual renal function decline in patients undergoing peritoneal dialysis. Medicina. (2021) 57:631. doi: 10.3390/medicina57060631
52.
Fu Z Geng X Liu C Shen W Dong Z Sun G et al . Identification of common and specific fibrosis-related genes in three common chronic kidney diseases. Ren Fail. (2024) 46:2295431. doi: 10.1080/0886022X.2023.2295431
53.
Melchinger I Guo K Li X Guo J Cantley LG Xu L . VCAM-1 mediates proximal tubule-immune cell cross talk in failed tubule recovery during AKI-to-CKD transition. Am J Physiol Renal Physiol. (2024) 327:F610–22. doi: 10.1152/ajprenal.00076.2024
54.
Chen Y-Y Ding Y Li L-L Han S-S Huang M Wong CC et al . Proteomic profiling of kidney samples in patients with pure membranous and proliferative lupus nephritis. Lupus. (2022) 31:837–47. doi: 10.1177/09612033221094711
55.
Chiang Y-H Li Y-H Chan Y-C Cheng Y-C Wu J Lin J-A et al . Low brain-derived neurotrophic factor and high vascular cell adhesion molecule-1 levels are associated with chronic kidney disease in patients with type 2 diabetes mellitus. Front Endocrinol. (2024) 15:1403717. doi: 10.3389/fendo.2024.1403717
56.
Yu KY Yung S Chau MK Tang CS Yap DY Tang AH et al . Clinico-pathological associations of serum VCAM-1 and ICAM-1 levels in patients with lupus nephritis. Lupus. (2021) 30:1039–50. doi: 10.1177/09612033211004727
57.
Guo Y Yuan Z Hu Z Gao Y Guo H Zhu H et al . Diagnostic model constructed by five EMT-related genes for renal fibrosis and reflecting the condition of immune-related cells. Front Immunol. (2023) 14:1161436. doi: 10.3389/fimmu.2023.1161436
58.
Svenningsen P Sabaratnam R Jensen BL . Urinary extracellular vesicles: origin, role as intercellular messengers and biomarkers; efficient sorting and potential treatment options. Acta Physiol (Oxf). (2020) 228:e13346. doi: 10.1111/apha.13346
59.
Lv L-L Feng Y Tang T-T Liu B-C . New insight into the role of extracellular vesicles in kidney disease. J Cell Mol Med. (2019) 23:731–9. doi: 10.1111/jcmm.14101
60.
Carreras-Planella L Cucchiari D Cañas L Juega J Franquesa M Bonet J et al . Urinary vitronectin identifies patients with high levels of fibrosis in kidney grafts. J Nephrol. (2021) 34:861–74. doi: 10.1007/s40620-020-00886-y
61.
Cao Y Shi Y Yang Y Wu Z Peng N Xiao J et al . Urinary exosomes derived circRNAs as biomarkers for chronic renal fibrosis. Ann Med. (2022) 54:1966–76. doi: 10.1080/07853890.2022.2098374
62.
Earle A Bessonny M Benito J Huang K Parker H Tyler E et al . Urinary exosomal microRNAs as biomarkers for obesity-associated chronic kidney disease. J Clin Med. (2022) 11:5271. doi: 10.3390/jcm11185271
63.
Zhang Q Zhao Y Luo Y Guo S Hou H Han X et al . Urinary exosomal miRNA-451a can be used as a potential noninvasive biomarker for diagnosis, reflecting tubulointerstitial damage and therapeutic response in IgA nephropathy. Ren Fail. (2024) 46:2319326. doi: 10.1080/0886022X.2024.2319326
64.
Tepus M Tonoli E Verderio EAM . Molecular profiling of urinary extracellular vesicles in chronic kidney disease and renal fibrosis. Front Pharmacol. (2023) 13:1041327. doi: 10.3389/fphar.2022.1041327
65.
Wu HHL Goldys EM Pollock CA Saad S . Exfoliated kidney cells from urine for early diagnosis and prognostication of CKD: the way of the future?Int J Mol Sci. (2022) 23:7610. doi: 10.3390/ijms23147610
66.
Li M Chang D Zhao Y Wu L Tan Y Zhao M et al . Urinary renal tubular epithelial cells and casts as predictors of renal outcomes in patients with biopsy-proven diabetic nephropathy. J Nephrol. (2024) 37:2233–42. doi: 10.1007/s40620-024-01995-8
67.
Wang F Jin Y Zhou F Luo L Tang J Huang L et al . Urinary isomorphic red blood cells for the prediction of disease severity and renal outcomes in MPO-ANCA-associated vasculitis: a retrospective cohort study. J Nephrol. (2023) 36:2295–304. doi: 10.1007/s40620-023-01663-3
68.
Abedini A Zhu YO Chatterjee S Halasz G Devalaraja-Narashimha K Shrestha R et al . Urinary single-cell profiling captures the cellular diversity of the kidney. J Am Soc Nephrol. (2021) 32:614–27. doi: 10.1681/ASN.2020050757
69.
Monteiro MB Pelaes TS Santos-Bezerra DP Thieme K Lerario AM Oba-Shinjo SM et al . Urinary sediment transcriptomic and longitudinal data to investigate renal function decline in type 1 diabetes. Front Endocrinol. (2020) 11:238. doi: 10.3389/fendo.2020.00238
70.
Li X-J Shan Q-Y Wu X Miao H Zhao Y-Y . Gut microbiota regulates oxidative stress and inflammation: a double-edged sword in renal fibrosis. Cell Mol Life Sci. (2024) 81:480. doi: 10.1007/s00018-024-05532-5
71.
Huang MJ Ji YW Chen JW Li D Zhou T Qi P et al . Targeted VEGFA therapy in regulating early acute kidney injury and late fibrosis. Acta Pharmacol Sin. (2023) 44:1815–25. doi: 10.1038/s41401-023-01070-1
72.
Corradi V Caprara C Barzon E Mattarollo C Zanetti F Ferrari F et al . A possible role of P-cresyl sulfate and indoxyl sulfate as biomarkers in the prediction of renal function according to the GFR (G) categories. Integr Med Nephrol Androl. (2024) 11:e24. doi: 10.1097/IMNA-D-24-00002
73.
Zhao H Zhao T Li P . Gut microbiota-derived metabolites: a new perspective of traditional Chinese medicine against diabetic kidney disease. Integr Med Nephrol Androl. (2024) 11:e23. doi: 10.1097/IMNA-D-23-00024
74.
Miao H Wang Y-N Yu X-Y Zou L Guo Y Su W et al . Lactobacillus species ameliorate membranous nephropathy through inhibiting the aryl hydrocarbon receptor pathway via tryptophan-produced indole metabolites. Br J Pharmacol. (2024) 181:162–79. doi: 10.1111/bph.16219
75.
Miao H Liu F Wang Y-N Yu X-Y Zhuang S Guo Y et al . Targeting Lactobacillus johnsonii to reverse chronic kidney disease. Signal Transduct Target Ther. (2024) 9:195. doi: 10.1038/s41392-024-01913-1
76.
Zixin Y Lulu C Xiangchang Z Qing F Binjie Z Chunyang L et al . TMAO as a potential biomarker and therapeutic target for chronic kidney disease: a review. Front Pharmacol. (2022) 13:929262. doi: 10.3389/fphar.2022.929262
77.
Kalagi NA Thota RN Stojanovski E Alburikan KA Garg ML . Plasma trimethylamine N-oxide levels are associated with poor kidney function in people with type 2 diabetes. Nutrients. (2023) 15:812. doi: 10.3390/nu15040812
78.
Huang Y Zhu Z Huang Z Zhou J . Elevated serum trimethylamine oxide levels as potential biomarker for diabetic kidney disease. Endocr Connect. (2023) 12:e220542. doi: 10.1530/EC-22-0542
79.
Ribeiro M Kemp JA Cardozo L Vargas D Ribeiro-Alves M Stenvinkel P et al . Trimethylamine N-oxide (TMAO) plasma levels in patients with different stages of chronic kidney disease. Toxins. (2024) 17:15. doi: 10.3390/toxins17010015
80.
Hu D-Y Wu M-Y Chen G-Q Deng B-Q Yu H-B Huang J et al . Metabolomics analysis of human plasma reveals decreased production of trimethylamine N-oxide retards the progression of chronic kidney disease. Br J Pharmacol. (2022) 179:4344–59. doi: 10.1111/bph.15856
81.
Boonhai S Bootdee K Saisorn W Takkavatakarn K Sitticharoenchai P Tungsanga S et al . TMAO reductase, a biomarker for gut permeability defect induced inflammation, in mouse model of chronic kidney disease and dextran sulfate solution-induced mucositis. Asian Pac J Allergy Immunol. (2023) 41:168–78. doi: 10.12932/AP-100321-1084
82.
Zhou Z Jin H Ju H Sun M Chen H Li L . Circulating trimethylamine-N-oxide and risk of all-cause and cardiovascular mortality in patients with chronic kidney disease: a systematic review and meta-analysis. Front Med. (2022) 9:828343. doi: 10.3389/fmed.2022.828343
83.
Li Y Lu H Guo J Zhang M Zheng H Liu Y et al . Gut microbiota-derived trimethylamine N-oxide is associated with the risk of all-cause and cardiovascular mortality in patients with chronic kidney disease: a systematic review and dose-response meta-analysis. Ann Med. 55:2215542. doi: 10.1080/07853890.2023.2215542
84.
Jiang J Zhu P Ding X Zhou L Li X Lei Y et al . The microbiome-derived metabolite trimethylamine N-oxide is associated with chronic kidney disease risk. Appl Microbiol Biotechnol. (2025) 109:97. doi: 10.1007/s00253-025-13481-7
85.
Regis B Passeri L Moreira NX Borges NA Ribeiro-Alves M Mafra D . Plasma trimethylamine N-oxide levels in nondialysis chronic kidney disease patients following meal challenge. Mol Nutr Food Res. (2025) 109:e70121. doi: 10.1002/mnfr.70121
86.
Heinrich-Sanchez Y Vital M . Trimethylamine-N-oxide formation, the bacterial taxa involved and intervention strategies to reduce its concentration in the human body. Ann Med. (2025) 57:2525403. doi: 10.1080/07853890.2025.2525403
87.
Luo Y Zhang W Qin G . Metabolomics in diabetic nephropathy: unveiling novel biomarkers for diagnosis (review). Mol Med Rep. (2024) 30:156. doi: 10.3892/mmr.2024.13280
88.
Cao G Miao H Wang YN Chen DQ Wu XQ Chen L et al . Intrarenal 1-methoxypyrene, an aryl hydrocarbon receptor agonist, mediates progressive tubulointerstitial fibrosis in mice. Acta Pharmacol Sin. (2022) 43:2929–45. doi: 10.1038/s41401-022-00914-6
89.
Wang Y-n Zhang Z-h Liu H-j Guo Z-y Zou L Zhang Y-m et al . Integrative phosphatidylcholine metabolism through phospholipase A2 in rats with chronic kidney disease. Acta Pharmacol Sin. (2023) 44:393–405. doi: 10.1038/s41401-022-00947-x
90.
Glavan M-R Socaciu C Socaciu AI Milas O Gadalean F Cretu OM et al . Targeted analysis of serum and urinary metabolites for early chronic kidney disease. Int J Mol Sci. (2025) 26:2862. doi: 10.3390/ijms26072862
91.
Hong H Zhou S Zheng J Shi H Chen Y Li M . Metabolic assessment in non-dialysis patients with chronic kidney disease. J Inflamm Res. (2024) 17:5521–31. doi: 10.2147/JIR.S461621
92.
Wu HHL Possell M Nguyen LT Peng W Pollock CA Saad S . Evaluation of urinary volatile organic compounds as a novel metabolomic biomarker to assess chronic kidney disease progression. BMC Nephrol. (2024) 25:352. doi: 10.1186/s12882-024-03819-0
93.
Peters B Beige J Siwy J Rudnicki M Wendt R Ortiz A et al . Dynamics of urine proteomics biomarker and disease progression in patients with IgA nephropathy. Nephrol Dial Transplant. (2023) 38:2826–34. doi: 10.1093/ndt/gfad125
94.
Romanova Y Laikov A Markelova M Khadiullina R Makseev A Hasanova M et al . Proteomic analysis of human serum from patients with chronic kidney disease. Biomol Ther. (2020) 10:257. doi: 10.3390/biom10020257
95.
Gu X Dong Y Wang X Ren Z Li G Hao Y et al . Identification of serum biomarkers for chronic kidney disease using serum metabolomics. Ren Fail. (2024) 46:2409346. doi: 10.1080/0886022X.2024.2409346
96.
Chen D Guo Y Li P . New insights into a novel metabolic biomarker and therapeutic target for chronic kidney disease. Integr Med Nephrol Androl. (2024) 11:e24. doi: 10.1097/IMNA-D-24-00019
97.
Fu X Luo Z-X Yin H-H Liu Y-N Du X-G Cheng W et al . Metabolomics study reveals blood biomarkers for early diagnosis of chronic kidney disease and IgA nephropathy: a retrospective cross-sectional study. Clin Chim Acta. (2024) 555:117815. doi: 10.1016/j.cca.2024.117815
98.
Wu I-W Liao Y-C Tsai T-H Lin C-H Shen Z-Q Chan Y-H et al . Machine-learning assisted discovery unveils novel interplay between gut microbiota and host metabolic disturbance in diabetic kidney disease. Gut Microbes. (2025) 17:2473506. doi: 10.1080/19490976.2025.2473506
99.
Hirakawa Y Yoshioka K Kojima K Yamashita Y Shibahara T Wada T et al . Potential progression biomarkers of diabetic kidney disease determined using comprehensive machine learning analysis of non-targeted metabolomics. Sci Rep. (2022) 12:16287. doi: 10.1038/s41598-022-20638-1
100.
Xu J Jia X Zhang X Jiao X Zhang S Zhao Y et al . Correlation between serum biomarkers and disease progression of chronic kidney disease. Br J Hosp Med. (2024) 85:1–14. doi: 10.12968/hmed.2024.0474
101.
Li Y Chen S Yang Q Liu X Zhou W Kang T et al . The ANGPTL4-HIF-1α loop: a critical regulator of renal interstitial fibrosis. J Transl Med. (2024) 22:649. doi: 10.1186/s12967-024-05466-3
102.
Li Y Zhang Y Cao M Yuan T Ou S . Angiopoietin-like protein 4 dysregulation in kidney diseases: a promising biomarker and therapeutic target. Front Pharmacol. (2024) 15:1475198. doi: 10.3389/fphar.2024.1475198
103.
Gutiérrez OM Shlipak MG Katz R Waikar SS Greenberg JH Schrauben SJ et al . Associations of plasma biomarkers of inflammation, fibrosis, and kidney tubular injury with progression of diabetic kidney disease: a cohort study. Am J Kidney Dis. (2022) 79:849–857.e841. doi: 10.1053/j.ajkd.2021.09.018
104.
Schmidt IM Colona MR Kestenbaum BR Alexopoulos LG Palsson R Srivastava A et al . Cadherin-11, Sparc-related modular calcium binding protein-2, and pigment epithelium-derived factor are promising non-invasive biomarkers of kidney fibrosis. Kidney Int. (2021) 100:672–83. doi: 10.1016/j.kint.2021.04.037
105.
Kim T Surapaneni AL Schmidt IM Eadon MT Kalim S Srivastava A et al . Plasma proteins associated with chronic histopathologic lesions on kidney biopsy. J Am Soc Nephrol. (2024) 35:910. doi: 10.1681/ASN.0000000000000358
106.
Liu J Liu Y Zhou W Liu Y Zhu S Yu Y et al . Serum soluble LYVE1 is a promising non-invasive biomarker of renal fibrosis: a population-based retrospective cross-sectional study. Immunol Res. (2024) 72:476–89. doi: 10.1007/s12026-023-09448-3
107.
Matsushita K Toyoda T Akane H Morikawa T Ogawa K . Role of CD44 expressed in renal tubules during maladaptive repair in renal fibrogenesis in an allopurinol-induced rat model of chronic kidney disease. J Appl Toxicol. (2023) 44:455–69. doi: 10.1002/jat.4554
108.
Ye Q Xu G Huang H Pang S Xie B Feng B et al . Nicotinamide N-methyl transferase as a predictive marker of tubular fibrosis in CKD. Int J Gen Med. (2023) 16:3331–44. doi: 10.2147/IJGM.S420706
109.
Tsai M-T Yang R-B Ou S-M Tseng W-C Lee K-H Yang C-Y et al . Plasma galectin-9 is a useful biomarker for predicting renal function in patients undergoing native kidney biopsy. Arch Pathol Lab Med. (2023) 147:167–76. doi: 10.5858/arpa.2021-0466-OA
110.
Hsu P-C Liao P-Y Huang S-W Chang H-H Chiang JY Lo L-C . Nailfold capillary abnormalities as indicators of diabetic nephropathy progression: a cross-sectional study in type 2 diabetes. Ann Med. (2025) 57:2458766. doi: 10.1080/07853890.2025.2458766
111.
Cho A Park HC Lee Y-K Shin YJ Bae SH Kim H . Progression of diabetic retinopathy and declining renal function in patients with type 2 diabetes. J Diabetes Res. (2020) 2020:8784139. doi: 10.1155/2020/8784139
112.
Bhak Y Lee YH Kim J Lee K Lee D Jang EC et al . Diagnosis of chronic kidney disease using retinal imaging and urine dipstick data: multimodal deep learning approach. JMIR Med Inform. (2025) 13:e55825. doi: 10.2196/55825
113.
Zhang K Liu X Xu J Yuan J Cai W Chen T et al . Deep-learning models for the detection and incidence prediction of chronic kidney disease and type 2 diabetes from retinal fundus images. Nat Biomed Eng. (2021) 5:533–45. doi: 10.1038/s41551-021-00745-6
114.
Turgutalp K Balcı Y Özer C Bardak S Gürses İ Karabulut Y et al . Shear wave elastography findings in immunoglobulin a nephropathy patients: is it more specific and sensitive for interstitial fibrosis or interstitial fibrosis/tubular atrophy?Ren Fail. (2020) 42:590–9. doi: 10.1080/0886022X.2020.1779087
115.
Kula S Haliloglu N . Comparison of shear wave elastography measurements in chronic kidney disease patients and healthy volunteers. J Clin Ultrasound. (2025) 53:778–84. doi: 10.1002/jcu.23949
116.
Chen Z Wang Y Ying MTC Su Z . Interpretable machine learning model integrating clinical and elastosonographic features to detect renal fibrosis in Asian patients with chronic kidney disease. J Nephrol. (2024) 37:1027–39. doi: 10.1007/s40620-023-01878-4
117.
Chen Z Ying TC Chen J Wu C Li L Chen H et al . Using elastography-based multilayer perceptron model to evaluate renal fibrosis in chronic kidney disease. Ren Fail. (2023) 45:2202755. doi: 10.1080/0886022X.2023.2202755
118.
Chen Z Wang Y Gunda ST Han X Su Z Ying MTC . Integrating shear wave elastography and estimated glomerular filtration rate to enhance diagnostic strategy for renal fibrosis assessment in chronic kidney disease. Quant Imaging Med Surg. (2024) 14:1766–77. doi: 10.21037/qims-23-962
119.
Zhu M Ma L Yang W Tang L Li H Zheng M et al . Elastography ultrasound with machine learning improves the diagnostic performance of traditional ultrasound in predicting kidney fibrosis. J Formos Med Assoc. (2022) 121:1062–72. doi: 10.1016/j.jfma.2021.08.011
120.
Jiang B Liu F Fu H Mao J . Advances in imaging techniques to assess kidney fibrosis. Ren Fail. (2023) 45:2171887. doi: 10.1080/0886022X.2023.2171887
121.
Hysi E He X Fadhel MN Zhang T Krizova A Ordon M et al . Photoacoustic imaging of kidney fibrosis for assessing pretransplant organ quality. JCI Insight. (2020) 5:e136995. doi: 10.1172/jci.insight.136995
122.
Yang Y Li T Jing W Yan Z Li X Fu W et al . Dual-modality and noninvasive diagnostic of MNP-PEG-Mn nanoprobe for renal fibrosis based on photoacoustic and magnetic resonance imaging. ACS Appl Mater Interfaces. (2023) 15:12797–808. doi: 10.1021/acsami.2c22512
123.
Yan D Li T Yang Y Niu N Wang D Ge J et al . A water-soluble AIEgen for noninvasive diagnosis of kidney fibrosis via SWIR fluorescence and photoacoustic imaging. Adv Mater. (2022) 34:e2206643. doi: 10.1002/adma.202206643
124.
Granata A Campo I Lentini P Pesce F Gesualdo L Basile A et al . Role of contrast-enhanced ultrasound (CEUS) in native kidney pathology: limits and fields of action. Diagnostics. (2021) 11:1058. doi: 10.3390/diagnostics11061058
125.
Fleig S Magnuska ZA Koczera P Salewski J Djudjaj S Schmitz G et al . Advanced ultrasound methods to improve chronic kidney disease diagnosis. npj Imaging. (2024) 2:22. doi: 10.1038/s44303-024-00023-5
126.
Denis L Bodard S Hingot V Chavignon A Battaglia J Renault G et al . Sensing ultrasound localization microscopy for the visualization of glomeruli in living rats and humans. EBioMedicine. (2023) 91:104578. doi: 10.1016/j.ebiom.2023.104578
127.
Garessus J Brito W Loncle N Vanelli A Hendriks-Balk M Wuerzner G et al . Cortical perfusion as assessed with contrast-enhanced ultrasound is lower in patients with chronic kidney disease than in healthy subjects but increases under low salt conditions. Nephrol Dial Transplant. (2022) 37:705–12. doi: 10.1093/ndt/gfab001
128.
Srivastava A Sridharan A Walmer RW Kasoji SK Burke LMB Dayton PA et al . Association of contrast-enhanced ultrasound–derived kidney cortical microvascular perfusion with kidney function. Kidney360. (2022) 3:647–56. doi: 10.34067/KID.0005452021
129.
Han BH Park SB . Usefulness of contrast-enhanced ultrasound in the evaluation of chronic kidney disease. Curr Med Imaging. (2021) 17:1003–9. doi: 10.2174/1573405617666210127101926
130.
Chen Q Yu J Rush BM Stocker SD Tan RJ Kim K . Ultrasound super-resolution imaging provides a noninvasive assessment of renal microvasculature changes during mouse acute kidney injury. Kidney Int. (2020) 98:355–65. doi: 10.1016/j.kint.2020.02.011
131.
Chen Q George MW McMahon B Rosenthal JA Kim K Tan RJ . Super-resolution ultrasound to assess kidney vascular changes in humans with kidney disease. Am J Kidney Dis. (2025) 85:393–5. doi: 10.1053/j.ajkd.2024.06.021
132.
Hu Y Lei Y Yu M Zhang Y Huang X Zhang G et al . Ultrasound super-resolution imaging for the assessment of renal allograft dysfunction: a pilot study. Heliyon. (2024) 10:e36515. doi: 10.1016/j.heliyon.2024.e36515
133.
Bodard S Denis L Hingot V Chavignon A Hélénon O Anglicheau D et al . Ultrasound localization microscopy of the human kidney allograft on a clinical ultrasound scanner. Kidney Int. (2023) 103:930–5. doi: 10.1016/j.kint.2023.01.027
134.
Zhao S Hartanto J Joseph R Wu C-H Zhao Y Chen Y-S . Hybrid photoacoustic and fast super-resolution ultrasound imaging. Nat Commun. (2023) 14:2191. doi: 10.1038/s41467-023-37680-w
135.
Zhao S Zhang X Bailey K Pai S Zhao Y Chen Y-S . Label-free dual-modal photoacoustic/ultrasound localization imaging for studying acute kidney injury. Adv Sci. (2025) 12:e2414306. doi: 10.1002/advs.202414306
136.
Armaly Z Abu-Rahme M Kinaneh S Hijazi B Habbasshi N Artul S . An innovative ultrasound technique for early detection of kidney dysfunction: superb microvascular imaging as a reference standard. J Clin Med. (2022) 11:925. doi: 10.3390/jcm11040925
137.
Chang T-W Tsai C-Y Tang Z-Y Zheng C-M Liao C-T Cheng C-Y et al . Artificial intelligence for predicting interstitial fibrosis and tubular atrophy using diagnostic ultrasound imaging and biomarkers. BMJ Health Care Inform. (2025) 32:e101192. doi: 10.1136/bmjhci-2024-101192
138.
Qin X Liu X Xiao W Luo Q Xia L Zhang C . Interpretable deep-learning model based on superb microvascular imaging for noninvasive diagnosis of interstitial fibrosis in chronic kidney disease. Acad Radiol. (2025) 32:2730–8. doi: 10.1016/j.acra.2024.11.067
139.
Qin X Liu X Xia L Luo Q Zhang C . Multimodal ultrasound deep learning to detect fibrosis in early chronic kidney disease. Ren Fail. (2024) 46:2417740. doi: 10.1080/0886022X.2024.2417740
140.
Ju Y Wang Y Luo RN Wang N Wang JZ Lin LJ et al . Evaluation of renal function in chronic kidney disease (CKD) by mDIXON-quant and amide proton transfer weighted (APTw) imaging. Magn Reson Imaging. (2023) 103:102–8. doi: 10.1016/j.mri.2023.07.005
141.
Hua C Qiu L Zhou L Zhuang Y Cai T Xu B et al . Value of multiparametric magnetic resonance imaging for evaluating chronic kidney disease and renal fibrosis. Eur Radiol. (2023) 33:5211–21. doi: 10.1007/s00330-023-09674-1
142.
Zhang Z Zha T Jiang Z Pan L Liu Y Dong C et al . Using ultrahigh b -value diffusion-weighted imaging to noninvasively assess renal fibrosis in a rabbit model of renal artery stenosis. J Comput Assist Tomogr. (2023) 47:713–20. doi: 10.1097/RCT.0000000000001487
143.
Su C-H Hsu Y-C Thangudu S Chen W-Y Huang Y-T Yu C-C et al . Application of multiparametric MR imaging to predict the diversification of renal function in miR29a-mediated diabetic nephropathy. Sci Rep. (2021) 11:1909. doi: 10.1038/s41598-021-81519-7
144.
Ferguson CM Eirin A Abumoawad A Saad A Jiang K Hedayat AF et al . Renal fibrosis detected by diffusion-weighted magnetic resonance imaging remains unchanged despite treatment in subjects with renovascular disease. Sci Rep. (2020) 10:16300. doi: 10.1038/s41598-020-73202-0
145.
Adams LC Bressem KK Scheibl S Nunninger M Gentsch A Fahlenkamp UL et al . Multiparametric assessment of changes in renal tissue after kidney transplantation with quantitative MR relaxometry and diffusion-tensor imaging at 3 T. J Clin Med. (2020) 9:1551. doi: 10.3390/jcm9051551
146.
Wan J Jin M Li J Ma J Que C Jiang B et al . Magnetic resonance diffusion tensor imaging is superior to arterial spin labeling in detecting renal allograft fibrosis. Quant Imaging Med Surg. (2025) 15:3211–21. doi: 10.21037/qims-24-1023
147.
Nassar MK Khedr D Abu-Elfadl HG Abdulgalil AE Abdalbary M Moustafa FE et al . Diffusion tensor imaging in early prediction of renal fibrosis in patients with renal disease: functional and histopathological correlations. Int J Clin Pract. (2021) 75:e13918. doi: 10.1111/ijcp.13918
148.
Buchanan CE Mahmoud H Cox EF McCulloch T Prestwich BL Taal MW et al . Quantitative assessment of renal structural and functional changes in chronic kidney disease using multi-parametric magnetic resonance imaging. Nephrol Dial Transplant. (2020) 35:955–64. doi: 10.1093/ndt/gfz129
149.
Mao W Zhou J Zeng M Ding Y Qu L Chen C et al . Intravoxel incoherent motion diffusion-weighted imaging for the assessment of renal fibrosis of chronic kidney disease: a preliminary study. Magn Reson Imaging. (2018) 47:118–24. doi: 10.1016/j.mri.2017.12.010
150.
Liang P Yuan G Li S Peng Y Xu C Benkert T et al . Noninvasive assessment of the renal function, Oxford classification and prognostic risk stratification of IgAN by using intravoxel incoherent motion diffusion-weighted imaging and blood oxygenation level-dependent MRI. J Magn Reson Imaging. (2023) 58:879–91. doi: 10.1002/jmri.28565
151.
Zhou SP Wang Q Zhai X Chen P Zhao J Bai X et al . The role of intravoxel incoherent motion diffusion-weighted imaging in distinguishing diabetic nephropathy from non-diabetic renal disease in diabetic patients. Zhonghua Nei Ke Za Zhi. (2023) 62:1288–94. doi: 10.3760/cma.j.cn112138-20230520-00265
152.
Ichikawa S Motosugi U Ichikawa T Sano K Morisaka H Araki T . Intravoxel incoherent motion imaging of the kidney: alterations in diffusion and perfusion in patients with renal dysfunction. Magn Reson Imaging. (2013) 31:414–7. doi: 10.1016/j.mri.2012.08.004
153.
Liu Y Zhang G-M-Y Peng X Li X Sun H Chen L . Diffusion kurtosis imaging as an imaging biomarker for predicting prognosis in chronic kidney disease patients. Nephrol Dial Transplant. (2022) 37:1451–60. doi: 10.1093/ndt/gfab229
154.
Yuan G Qu W Li S Liang P He K Li A et al . Noninvasive assessment of renal function and fibrosis in CKD patients using histogram analysis based on diffusion kurtosis imaging. Jpn J Radiol. (2023) 41:180–93. doi: 10.1007/s11604-022-01346-2
155.
Li A Yuan G Hu Y Shen Y Hu X Hu D et al . Renal functional and interstitial fibrotic assessment with non-Gaussian diffusion kurtosis imaging. Insights Imaging. (2022) 13:70. doi: 10.1186/s13244-022-01215-6
156.
Nangaku M . Chronic hypoxia and tubulointerstitial injury: a final common pathway to end-stage renal failure. J Am Soc Nephrol. (2006) 17:17–25. doi: 10.1681/ASN.2005070757
157.
Heyman SN Khamaisi M Rosen S Rosenberger C . Renal parenchymal hypoxia, hypoxia response and the progression of chronic kidney disease. Am J Nephrol. (2008) 28:998–1006. doi: 10.1159/000146075
158.
Sugiyama K Inoue T Kozawa E Ishikawa M Shimada A Kobayashi N et al . Reduced oxygenation but not fibrosis defined by functional magnetic resonance imaging predicts the long-term progression of chronic kidney disease. Nephrol Dial Transplant. (2020) 35:964–70. doi: 10.1093/ndt/gfy324
159.
Xu Y Lu F Wang M Wang L Ye C Yang S et al . Linking renal hypoxia and oxidative stress in chronic kidney disease: based on clinical subjects and animal models. Biomol Biomed. (2024) 24:1319–30. doi: 10.17305/bb.2024.10257
160.
Yang J Yang S Xu Y Lu F You L He Z et al . Evaluation of renal oxygenation and hemodynamics in patients with chronic kidney disease by blood oxygenation level-dependent magnetic resonance imaging and intrarenal Doppler ultrasonography. Nephron. (2021) 145:653–63. doi: 10.1159/000516637
161.
Xu Y Yang J Lu F Ye C Wang C . Correlation of renal oxygenation with renal function in chronic kidney disease: a preliminary prospective study. Kidney Blood Press Res. (2023) 48:175–85. doi: 10.1159/000529165
162.
Inoue T Kozawa E Ishikawa M Fukaya D Amano H Watanabe Y et al . Comparison of multiparametric magnetic resonance imaging sequences with laboratory parameters for prognosticating renal function in chronic kidney disease. Sci Rep. (2021) 11:22129. doi: 10.1038/s41598-021-01147-z
163.
Neugarten J Golestaneh L . Blood oxygenation level-dependent MRI for assessment of renal oxygenation. Int J Nephrol Renov Dis. (2014) 7:421–35. doi: 10.2147/IJNRD.S42924
164.
Fine LG Dharmakumar R . Limitations of BOLD-MRI for assessment of hypoxia in chronically diseased human kidneys. Kidney Int. (2012) 82:934–5. doi: 10.1038/ki.2012.283
165.
Nery F Buchanan CE Harteveld AA Odudu A Bane O Cox EF et al . Consensus-based technical recommendations for clinical translation of renal ASL MRI. MAGMA. (2020) 33:141–61. doi: 10.1007/s10334-019-00800-z
166.
Jiang B Wan JY Tian YY Xu R Ma JL Li J et al . Arterial spin labeling in assessment of interstitial fibrosis in renal allografts. Zhonghua Yi Xue Za Zhi. (2024) 104:276–81. doi: 10.3760/cma.j.cn112137-20230726-00095
167.
Yu YM Wang W Wen J Zhang Y Lu GM Zhang LJ . Detection of renal allograft fibrosis with MRI: arterial spin labeling outperforms reduced field-of-view IVIM. Eur Radiol. (2021) 31:6696–707. doi: 10.1007/s00330-021-07818-9
168.
Mao W Ding X Ding Y Cao B Fu C Kuehn B et al . Evaluation of interstitial fibrosis in chronic kidney disease by multiparametric functional MRI and histopathologic analysis. Eur Radiol. (2023) 33:4138–47. doi: 10.1007/s00330-022-09329-7
169.
Mora-Gutiérrez JM Fernández-Seara MA Echeverria-Chasco R Garcia-Fernandez N . Perspectives on the role of magnetic resonance imaging (MRI) for noninvasive evaluation of diabetic kidney disease. J Clin Med. (2021) 10:2461. doi: 10.3390/jcm10112461
170.
Brown RS Sun MRM Stillman IE Russell TL Rosas SE Wei JL . The utility of magnetic resonance imaging for noninvasive evaluation of diabetic nephropathy. Nephrol Dial Transplant. (2020) 35:970–8. doi: 10.1093/ndt/gfz066
171.
Krehl K Hahndorf J Stolzenburg N Taupitz M Braun J Sack I et al . Characterization of renal fibrosis in rats with chronic kidney disease by in vivo tomoelastography. NMR Biomed. (2023) 36:e5003. doi: 10.1002/nbm.5003
172.
Kirpalani A Hashim E Leung G Kim JK Krizova A Jothy S et al . Magnetic resonance elastography to assess fibrosis in kidney allografts. Clin J Am Soc Nephrol. (2017) 12:1671–9. doi: 10.2215/CJN.01830217
173.
Chauveau B Merville P Soulabaille B Taton B Kaminski H Visentin J et al . Magnetic resonance elastography as surrogate marker of interstitial fibrosis in kidney transplantation: a prospective study. Kidney360. (2022) 3:1924–33. doi: 10.34067/KID.0004282022
174.
Gandhi D Kalra P Raterman B Mo X Dong H Kolipaka A . Magnetic resonance elastography-derived stiffness of the kidneys and its correlation with water perfusion. NMR Biomed. (2020) 33:e4237. doi: 10.1002/nbm.4237
175.
Wu J Shi Z Zhang Y Yan J Shang F Wang Y et al . Native T1 mapping in assessing kidney fibrosis for patients with chronic glomerulonephritis. Front Med. (2021) 8:772326. doi: 10.3389/fmed.2021.772326
176.
Guo L-S An Y Zhang Z-Y Ma C-B Li J-Q Dong Z et al . Exploring the diagnostic potential: magnetic particle imaging for brain diseases. Mil Med Res. (2025) 12:18. doi: 10.1186/s40779-025-00603-5
177.
Zeng N Guan X Liu X Shi H Li N Yang R et al . Fibroblast activation protein-sensitive polymeric nanobeacon for early diagnosis of renal fibrosis. Biosens Bioelectron. (2024) 253:116144. doi: 10.1016/j.bios.2024.116144
178.
Zhao D Wang W Niu YY Ren XH Shen AJ Xiang YS et al . Amide proton transfer-weighted magnetic resonance imaging for application in renal fibrosis: a radiological-pathological-based analysis. Am J Nephrol. (2024) 55:334–44. doi: 10.1159/000536232
179.
Chen Y-C Waghorn PA Rosales IA Arora G Erstad DJ Rotile NJ et al . Molecular MR imaging of renal fibrogenesis in mice. J Am Soc Nephrol. (2023) 34:1159–65. doi: 10.1681/ASN.0000000000000148
180.
Ashouri H Riyahi Alam N Khoobi M Haghgoo S Rasouli Z Gholami M . NSF evaluation of gadolinium biodistribution in renally impaired rats: using novel metabolic Gd2O3 nanoparticles coated with β-cyclodextrin (Gd2O3@PCD) in MR molecular imaging. Magn Reson Imaging. (2024) 107:120–9. doi: 10.1016/j.mri.2024.01.003
181.
Liang P Yuan G Li S He K Peng Y Hu D et al . Non-invasive evaluation of the pathological and functional characteristics of chronic kidney disease by diffusion kurtosis imaging and intravoxel incoherent motion imaging: comparison with conventional DWI. Br J Radiol. (2023) 96:20220644. doi: 10.1259/bjr.20220644
182.
Zhu J Chen A Gao J Zou M Du J Wu P-Y et al . Diffusion-weighted, intravoxel incoherent motion, and diffusion kurtosis tensor MR imaging in chronic kidney diseases: correlations with histology. Magn Reson Imaging. (2024) 106:1–7. doi: 10.1016/j.mri.2023.07.002
183.
Caraiani C Dong Y Rudd AG Dietrich CF . Reasons for inadequate or incomplete imaging techniques. Med Ultrason. (2018) 20:498–507. doi: 10.11152/mu-1736
184.
Zhang G Zhang P Xia Y Shi F Zhang Y Ding D . Radiomics analysis of whole-kidney non-contrast CT for early identification of chronic kidney disease stages 1-3. Bioengineering. (2025) 12:454. doi: 10.3390/bioengineering12050454
185.
Chantaduly C Troutt HR Perez Reyes KA Zuckerman JE Chang PD Lau WL . Artificial intelligence assessment of renal scarring (AIRS study). Kidney360. (2022) 3:83–90. doi: 10.34067/KID.0003662021
186.
Ren Y Yang F Li W Zhang Y Kang S Cui F . End-to-end CT radiomics-based pipeline for predicting renal interstitial fibrosis grade in CKD patients. Acad Radiol. (2025) 32:3464–74. doi: 10.1016/j.acra.2024.12.050
187.
Velikyan I Rosenström U Estrada S Ljungvall I Häggström J Eriksson O et al . Synthesis and preclinical evaluation of 68Ga-labeled collagelin analogs for imaging and quantification of fibrosis. Nucl Med Biol. (2014) 41:728–36. doi: 10.1016/j.nucmedbio.2014.06.001
188.
Hamson EJ Keane FM Tholen S Schilling O Gorrell MD . Understanding fibroblast activation protein (FAP): substrates, activities, expression and targeting for cancer therapy. Proteomics Clin Appl. (2014) 8:454–63. doi: 10.1002/prca.201300095
189.
Huang J Cui S Chi X Cong A Yang X Su H et al . Dynamically visualizing profibrotic maladaptive repair after acute kidney injury by fibroblast activation protein imaging. Kidney Int. (2024) 106:826–39. doi: 10.1016/j.kint.2024.07.015
190.
Mao H Chen L Wu W Zhang L Li X Chen Y et al . Noninvasive assessment of renal fibrosis of chronic kidney disease in rats by [68Ga]Ga-FAPI-04 small animal PET/CT and biomarkers. Mol Pharm. (2023) 20:2714–25. doi: 10.1021/acs.molpharmaceut.3c00163
191.
Zhou Y Yang X Liu H Luo W Liu H Lv T et al . Value of [68Ga]Ga-FAPI-04 imaging in the diagnosis of renal fibrosis. Eur J Nucl Med Mol Imaging. (2021) 48:3493–501. doi: 10.1007/s00259-021-05343-x
192.
Chen J Wan Z Cao M Huang Y Li Y Wu W et al . 68Ga-FAPI small animal PET/CT in rats with peritoneal fibrosis and the therapeutic effect of sodium butyrate. Mol Pharm. (2025) 22:1329–38. doi: 10.1021/acs.molpharmaceut.4c00998
193.
Yu S Yang Z Ding Z Jia Y Wan L Li L et al . 68Ga-FAPI-04 PET/CT imaging for assessing renal tubulointerstitial fibrosis in lupus nephritis. J Nucl Med. (2025) 66:418–24. doi: 10.2967/jnumed.124.268643
194.
Conen P Pennetta F Dendl K Hertel F Vogg A Haberkorn U et al . [68Ga]Ga-FAPI uptake correlates with the state of chronic kidney disease. Eur J Nucl Med Mol Imaging. (2022) 49:3365–72. doi: 10.1007/s00259-021-05660-1
195.
Ma J Yang Q Huo L Dai J Niu N Cao X . Performance of 68Ga-labeled fibroblast activation protein inhibitor PET/CT in evaluation of Erdheim–Chester disease: a comparison with 18F-FDG PET/CT. J Nucl Med. (2023) 64:1385–91. doi: 10.2967/jnumed.123.265691
196.
Wang H Deng Y He L Deng Y Zhang W . Renal interstitial fibrosis detected on 18F-AlF-NOTA-FAPI-04 PET/CT in a patient with multiple myeloma. Clin Nucl Med. (2023) 48:896–8. doi: 10.1097/RLU.0000000000004804
197.
Wang H He L Feng L Zhang W Liu N Zhang W . Non-invasive assessment of IgA nephropathy severity with [18F]AlF-NOTA-FAPI-04 PET/CT imaging. Clin Kidney J. (2024) 17:sfae340. doi: 10.1093/ckj/sfae340
198.
Wang H Zhang P Wang W He L Liu N Yang J et al . [18F] AlF-NOTA-FAPI-04 PET/CT for non-invasive assessment of tubular injury in kidney diseases. Clin Kidney J. (2024) 17:sfae064. doi: 10.1093/ckj/sfae064
199.
Klinkhammer BM Boor P . Kidney fibrosis: emerging diagnostic and therapeutic strategies. Mol Asp Med. (2023) 93:101206. doi: 10.1016/j.mam.2023.101206
200.
Zhao BR Hu XR Wang WD Zhou Y . Cardiorenal syndrome: clinical diagnosis, molecular mechanisms and therapeutic strategies. Acta Pharmacol Sin. (2025) 46:1539–55. doi: 10.1038/s41401-025-01476-z
201.
Brown JM Park M-A Kijewski MF Weber BN Yang Y Martell L et al . Feasibility of simultaneous quantification of myocardial and renal perfusion with cardiac positron emission tomography. Circ Cardiovasc Imaging. (2023) 16:e015324. doi: 10.1161/CIRCIMAGING.123.015324
202.
Lu Y Yang K Zhou K Pang B Wang G Ding Y et al . An integrated quad-modality molecular imaging system for small animals. J Nucl Med. (2014) 55:1375–9. doi: 10.2967/jnumed.113.134890
203.
Zhou F Li Z Li H Lu Y Cheng L Zhang Y et al . An initiative on digital nephrology: the kidney imageomics project. Natl Sci Rev. (2025) 12:nwaf034. doi: 10.1093/nsr/nwaf034
Summary
Keywords
chronic kidney disease, renal fibrosis, non-invasive diagnosis, biomarkers, imaging techniques
Citation
Yuan T, Wang H, Kang T, Wu W and Ou S (2025) Advancements in the non-invasive diagnosis of renal fibrosis. Front. Med. 12:1646412. doi: 10.3389/fmed.2025.1646412
Received
13 June 2025
Accepted
14 July 2025
Published
30 July 2025
Volume
12 - 2025
Edited by
Ying-Yong Zhao, Northwest University, China
Reviewed by
Barbara Mara Klinkhammer, University Hospital RWTH Aachen, Germany
Palash Mitra, Midnapore City College, India
Zehua Li, Peking University, China
Updates
Copyright
© 2025 Yuan, Wang, Kang, Wu and Ou.
This is an open-access article distributed under the terms of the Creative Commons Attribution License (CC BY). The use, distribution or reproduction in other forums is permitted, provided the original author(s) and the copyright owner(s) are credited and that the original publication in this journal is cited, in accordance with accepted academic practice. No use, distribution or reproduction is permitted which does not comply with these terms.
*Correspondence: Santao Ou, ousantao@163.com
†These authors have contributed equally to this work and share first authorship
Disclaimer
All claims expressed in this article are solely those of the authors and do not necessarily represent those of their affiliated organizations, or those of the publisher, the editors and the reviewers. Any product that may be evaluated in this article or claim that may be made by its manufacturer is not guaranteed or endorsed by the publisher.