Abstract
Background and objectives:
The purpose of this study is to use a data-driven method to analyze the time taken by junior doctors to extract lower wisdom teeth and the factors affecting the difficulty of the procedure. It aims to reveal the distribution characteristics of difficulty factors at different stages of development, establish a mathematical model for procedural difficulty, evaluate the effectiveness of the existing difficulty scale, and provide difficulty indicators for the extraction training of impacted teeth for young doctors at different stages.
Materials and methods:
We collected surgical records of 419 cases of lower impacted wisdom teeth extraction completed by 9 residents. The difficulty index was based on a scale with 14 primary indicators and 37 secondary indicators. We proposed a data-driven method for surgeon-specific difficulty assessment (DDSS) of third molar extraction surgery. When assessing the surgical difficulty for a surgeon, the DDSS uses a method based on Lasso regression to classify the doctor as either a junior doctor who has completed grade 1 training or a novice doctor. It then calls upon the corresponding pre-trained model to conduct targeted difficulty prediction and provide key difficulty factors.
Results:
Our method achieved an accuracy of 80% and an AUC of 0.85 with SVM. The methods we proposed outperformed the methods without decoupling. The clustering analysis revealed that inexperienced surgeons are affected by a larger number of factors, while experienced surgeons are primarily influenced by four key factors: Crown resistance, impacted type, mouth opening, and gender. Learning curves indicated that surgeons typically become proficient after 8 months of practice.
Conclusion:
We propose a data-driven decoupling-prediction model, which improves the model’s performance in the task of assessing dental surgery difficulty. We also draw the learning curve of novice surgeons based on the data decoupling method we proposed. This provides a new perspective for surgical difficulty assessment and surgeon training, and offers a reliable conclusion.
1 Introduction
The extraction of impacted mandibular third molar is one of the most common procedures in oral and maxillofacial surgery. Given the anatomical variations and limited surgical visibility, these surgeries often present significant challenges (1), especially for residents. On the other hand, there is a large number novice of doctors in the field who need targeted training, and assigning them surgeries with inappropriate levels of difficulty poses safety risks (2–4). Therefore a reasonable evaluation can not only formulate more accurate surgical plans and optimize resource allocation, but also provide targeted training for novice doctors, accelerating their learning process.
Nowadays, there have been many rule—based methods to quantify the difficulty of extracting impacted mandibular third molars. These methods are established by experienced doctors who set relevant rules and apply them in clinical practice. The traditional Pell-Gregory classification is criticized for its unreliability in predicting extraction challenges (5). In recent years, scholars have introduced various new assessment methods that consider additional factors, however, those assessment still have limitations, such as oversimplified scoring systems and the lack of a theoretical basis for grading differences (6–8). To address these issues, the Delphi survey, a technique that facilitates group consensus through an iterative multistage process, was employed to develop a new scoring scale (9). This method involves soliciting, synthesizing, and refining expert opinions across multipole rounds, thereby avoiding mutual influence among experts and achieving more accurate and objective results (10). Chen et al. established a difficulty scoring scale for third molar extraction using the Delphi method.
However, these rule-driven methods overlook the growth potential of novice surgeons and fail to account for the complex and idiosyncratic situations of novice doctors. In recent years, some methods have tried to rebuild the assessment system from a data—driven perspective. Compared with rule—driven methods, data—driven methods can mine key information from data, and get a better performance (11–22). For example, Chen et al. (11) systematically reviewed the research progress of deep learning in caries detection, exploring the potential of this technology to improve diagnostic accuracy. Chen et al. developed a clinical decision support system that automatically generates diagrams for removable partial dentures based on textual design, simplifying the restoration process. Yamagami et al. (12) trained a decision—tree model to accurately assess the risk of postoperative infection and Van der Cruyssen et al. (13) established a postoperative risk—assessment system for third—molar surgery using the XGBoost model. These methods employ machine learning techniques, enabling the model to learn thoroughly in a data—driven manner for the corresponding tasks. They allow the model to learn the inherent patterns in the data at a relatively low cost, thus avoiding the introduction of a large number of manual rules. Drawing on these studies, we attempt to establish an assessment method that focuses on the growth potential of each surgeon by approaching from the perspective of data.
In summary, in addition to the previous rule-driven methods, this study proposes a new assessment method from a data-driven perspective. This approach attempts to address the issue of existing rule-driven methods that overlook the differences in the growth potential of novice surgeons. Specifically, the study introduces a data-driven decoupling-evaluation model. This model not only pays attention to the differences in the learning process of each surgeon, but also attempts to identify the common difficulty factors that affect surgeons at different stages.
2 Materials and methods
2.1 Study design and data sources
In this study, all data were obtained from the Department of Oral and Maxillofacial Surgery in Peking University School and Hospital of Stomatology, and the evaluation period was from December 24, 2020, to October 28, 2023. Our inclusion criteria were as follows: (1) The cases included were those treated entirely by one-year graduate resident in the Department of Oral and Maxillofacial Surgery, with the residents’ training period ranging from January to December, and who were assessed by senior physicians as capable of independently performing the extraction of impacted lower third molars. (2) The cases included were those of impacted lower third molar extractions, with complete preoperative imaging data and accurate records of surgical operation time during the procedure. (3) The patients included were aged 18–45 years and were able to fully cooperate with the surgical procedures. Our exclusion criteria were as follows: (1) The patient was missing the second molar on the side of the extraction. (2) The patient had significant dental anxiety or a pronounced gag reflex, making it impossible to perform the extraction under local anesthesia in an outpatient setting. (3) During the internship period, the resident had an interruption of more than 1 week or attended the outpatient clinic for less than 2 days per week. After screening, we collected surgical records of 419 cases of lower impacted wisdom teeth extraction completed by 9 residents, each case of data has 14 surgical features: Crown condition of second molar, Second molar looseness, Relationship of M3M and IAN, impacted type, Crown condition of M3M, Root number, Root Morphology, Root width, Crown resistance, Age, Mouth opening, BMI, and gender.
To ensure data integrity, all 14 primary and 37 secondary indicators were checked for completeness. Missing values accounted for less than 0.05% of the entire dataset. For these rare cases, group-wise mean imputation was applied. We further verified that imputing these values did not significantly affect model performance (AUC change < 0.01). This preprocessing procedure ensured the robustness and reproducibility of subsequent analyses.
All analyses were conducted using Python version 3.12.3 with the scikit-learn package (version 1.5.2). Descriptive statistics were expressed as mean ± standard deviation for continuous variables and frequency (percentage) for categorical variables. Independent sample t-tests were applied to compare operative times between groups, with a significance level of p ≤ 0.05. For machine learning models, performance was evaluated using accuracy, sensitivity, specificity, F1-score, and the area under the receiver operating characteristic curve (AUC). Five-fold cross-validation was conducted to ensure the robustness of the results.
The purpose of this study was to evaluate surgical difficulty, with the surgeons themselves as the research subjects. No patient treatment interventions or follow-ups were involved. The core data consisted of operative time and related surgical factors recorded independently by assistants during the procedures, focusing solely on the assessment of operative difficulty. At no point were patient identifiers collected, recorded, or disseminated, and the data could not be linked to any specific patient. Therefore, no patient interests were affected, and ethical approval was not required. Specifically, operative times were documented by assistants during the procedures, along with the relevant case information, which was then compiled and delivered to the first author for statistical analysis. The operators were affiliated with Peking University School and Hospital of Stomatology, while the first author was affiliated with Beihang University and had no access to patient identity information.
2.2 Overview of DDSS
We propose a decoupling-prediction model to classify and predict different types of surgeons, with the overall workflow as follows: first, we calculate the surgical preference vector for each surgeon based on the Lasso regression (23–25) method and measure the similarity between vectors using the Levenshtein distance. Subsequently, we use hierarchical clustering to divide the surgeons into two categories and train a machine learning model for each category (26). During the training process, we split the data for each surgeon into training and testing sets at a ratio of 4:1. The overall training set is composed of the training data from all surgeons (see Figure 1).
Figure 1

Overview of DDSS.
2.3 Construction of feature vectors
We used the Lasso regression method to determine the feature order based on the sequence in which features transition from zero to non-zero as the regularization parameter lambda decreases. Specifically, we plot the Lasso curve for each doctor and record the number of times the coefficients of all features change from zero to non-zero as the regularization parameter lambda decreases from positive infinity to zero. By doing so, we constructed unique feature vectors for the surgical features of each surgeon. In this study, we used Python 3.12.3 and called the scikit-learn library (version 1.5.2) to implement this process.
2.4 Data decoupling
After obtaining the surgical vectors for each surgeon, we used the Levenshtein distance to measure the surgical similarity between surgeons and applied hierarchical clustering to divide all surgeons into two major categories. The Levenshtein distance is a measure of the minimum number of single-character edits (insertions, deletions, or substitutions) required to change one string into another, commonly used to quantify the similarity between two sequences. Hierarchical clustering is a method that builds nested clusters by successively merging or splitting existing clusters based on distance metrics, resulting in a tree-like structure called a dendrogram. Through these method, we were able to identify surgeons with similar surgical preferences. In this study, we used Python 3.12.3 and called the scikit-learn library (version 1.5.2) to implement this process.
2.5 Machine learning prediction
We designed Support Vector Machine (SVM) to learn from each category of surgeons (27–33). To enhance the SVM’s ability to understand complex data, we introduced the radial basis kernel function. We optimized the penalty parameter (C) and kernel parameters using grid search combined with five-fold cross-validation. The optimal configuration was C = 100 with a radial basis kernel, which achieved the highest validation AUC and was subsequently adopted for testing. The same parameter-tuning strategy was applied to Random Forest and XGBoost for fair comparison. Besides, we also selected XGBoost and Random Forest for comparison (17–22). Through this approach, we can specifically learn the surgical features of surgeons with similar surgical preferences. In the experiment, we used Python 3.12.3 and called the scikit-learn library (version 1.5.2) to implement these process.
3 Results
In summary, the main findings of this study were that most extractions were completed within 20 min, clustering analysis effectively distinguished inexperienced from experienced residents, and the proposed decoupling SVM model achieved the highest predictive performance with an accuracy of 80% and an AUC of 0.85. In addition, learning curve analysis suggested that residents typically required about 8 months of practice to become proficient, with crown resistance, impaction type, mouth opening, and gender identified as the key factors influencing surgical difficulty.
3.1 Basic statistical analysis
We conducted a basic statistical analysis of the 419 surgical records, and the results are shown in Table 1. Based on the distribution of surgical duration, we found that 25.24% of surgeries were completed within 10 min (600 s), while 76.21% were completed within 20 min (1,200 s). For ease of calculation, we set the first quartile at 600 s and the third quartile at 1200 s. Combining clinical expertise, we classified cases into three difficulty levels: Class 1: Surgeries completed in under 10 min. Class 2: Surgeries taking 10 to 20 min. Class 3: Surgeries exceeding 20 min. Additionally, to account for variations among different surgeons, we first normalized the surgical duration for each surgeon based on their recorded operation times. In this experiment, we divided the dataset into a training set and a test set in a 4:1 ratio.
Table 1
| Primary indicators | Abbreviation | Secondary indicators | Proportions |
|---|---|---|---|
| (1) Crown condition of second molar | SMC | Prothesis | 0.3% |
| Distal tooth defect or filling | 9.6% | ||
| Other situations | 90.0% | ||
| (2) Second molar looseness | Stability | Loose | 5% |
| Not loose | 94.9% | ||
| (3) Relationship of M3M and IAN | IAN | Uncontacted | 67.3% |
| Overlap | 10.1% | ||
| Intrude | 22.2% | ||
| (4) Impacted type (winter classification) | Angle | Distal | 8.2% |
| Vertical and mesial (located above the contour point of second molar) | 26.6% | ||
| Mesial (located below the contour point of second molar) | 26.3% | ||
| Horizontal | 34.3% | ||
| Inverted | 0.4% | ||
| Buccal | 1.2% | ||
| Lingual | 2.4% | ||
| (5) Depth (Pell & Gregory classification) | Depth | High | 49.3% |
| Medium | 44.5% | ||
| Low | 5.8% | ||
| (6) Crown condition of M3M | Crown | Tooth defect (non-mesial defect more than 1/2) | 7.9% |
| Unbroken or small decay | 91.7% | ||
| (7) Root number | Roots | Two | 52.5% |
| Three or more | 2.1% | ||
| One or fusion | 45% | ||
| (8) Root morphology | Morphology | Complete development | 3.8% |
| Incomplete development | 7.2% | ||
| Bending in opposite direction or to mesial | 1.4% | ||
| Bending in two or more different direction | 2.1% | ||
| Enlargement in apical site | 84.9% | ||
| (9) Root width a: cervical width b: maximum root width |
Width | a>b or a ≈ b | 84.0% |
| a<b | 15.7% | ||
| (10) Crown resistance | Resistance | Complete eruption | 8.9% |
| Soft tissue coverage | 49.1% | ||
| Partial bone coverage | 40.4% | ||
| Complete bone coverage | 1.2% | ||
| (11) Age | Age | 0–25 | 30.2% |
| 25–35 | 54.7% | ||
| >35 | 14.7% | ||
| (12) Mouth opening | Opening | Normal | 98.5% |
| Limited mouth opening | 1.2% | ||
| (13) BMI | BMI | <18.5 | 11.4% |
| 18.5–25 | 69.6% | ||
| 25–30 | 15.0% | ||
| 30–35 | 3.3% | ||
| >35 | 0.4% | ||
| (14) Gender | Gender | Male | 40.5% |
| Female | 59.4% |
Baseline surgical characteristics.
The specific surgical qualifications of each surgeon are shown in Table 2, which presents the surgical experience, average surgical time and standard deviation, longest surgical duration, and shortest surgical duration of each surgeon (Unit: seconds).
Table 2
| Surgeon | Surgical experience | Average surgical time with std (second) | Longest surgery duration (second) | The shortest surgery duration (second) |
|---|---|---|---|---|
| Surgeon 1 | 10 months | 914 (±435) | 2,700 | 40 |
| Surgeon 2 | 10 months | 1,062 (±438) | 2,100 | 180 |
| Surgeon 3 | 10 months | 759 (±348) | 2,400 | 240 |
| Surgeon 4 | 6 months | 917 (±342) | 1,500 | 480 |
| Surgeon 5 | 6 months | 1,160 (±634) | 2,700 | 180 |
| Surgeon 6 | 1 months | 1,585 (±577) | 2,520 | 1,080 |
| Surgeon 7 | 4 months | 1,091 (±415) | 1980 | 420 |
| Surgeon 8 | 5 months | 1,075 (±490) | 2,100 | 300 |
| Surgeon 9 | 1 months | 949 (±446) | 1,560 | 240 |
The specific surgical qualifications of each surgeon.
3.2 The performance of different clustering algorithms and machine learning methods in the classification of oral surgery difficulty
First, we calculated the surgical preference sequence labels for all the surgeons based on the LASSO parameter trajectory method we proposed, as shown on the left side of Figure 2. Each label reflects the surgical preferences of the corresponding surgeon to some extent. Subsequently, we applied hierarchical clustering to these surgical preference sequence labels, using the Levenshtein distance to measure the similarity between sequences, as shown on the right side of Figure 2. The experimental results indicate that the surgical behaviors of surgeons no. 1, 2, 3, 4, and 7 are relatively similar, while those of surgeons no. 5, 6, 8, and 9 are relatively similar. Therefore, we conclude that the surgeons can be divided into two major groups: the first group includes surgeons no. 1, 2, 3, 4, and 7, and the second group includes surgeons no. 5, 6, 8, and 9.
Figure 2
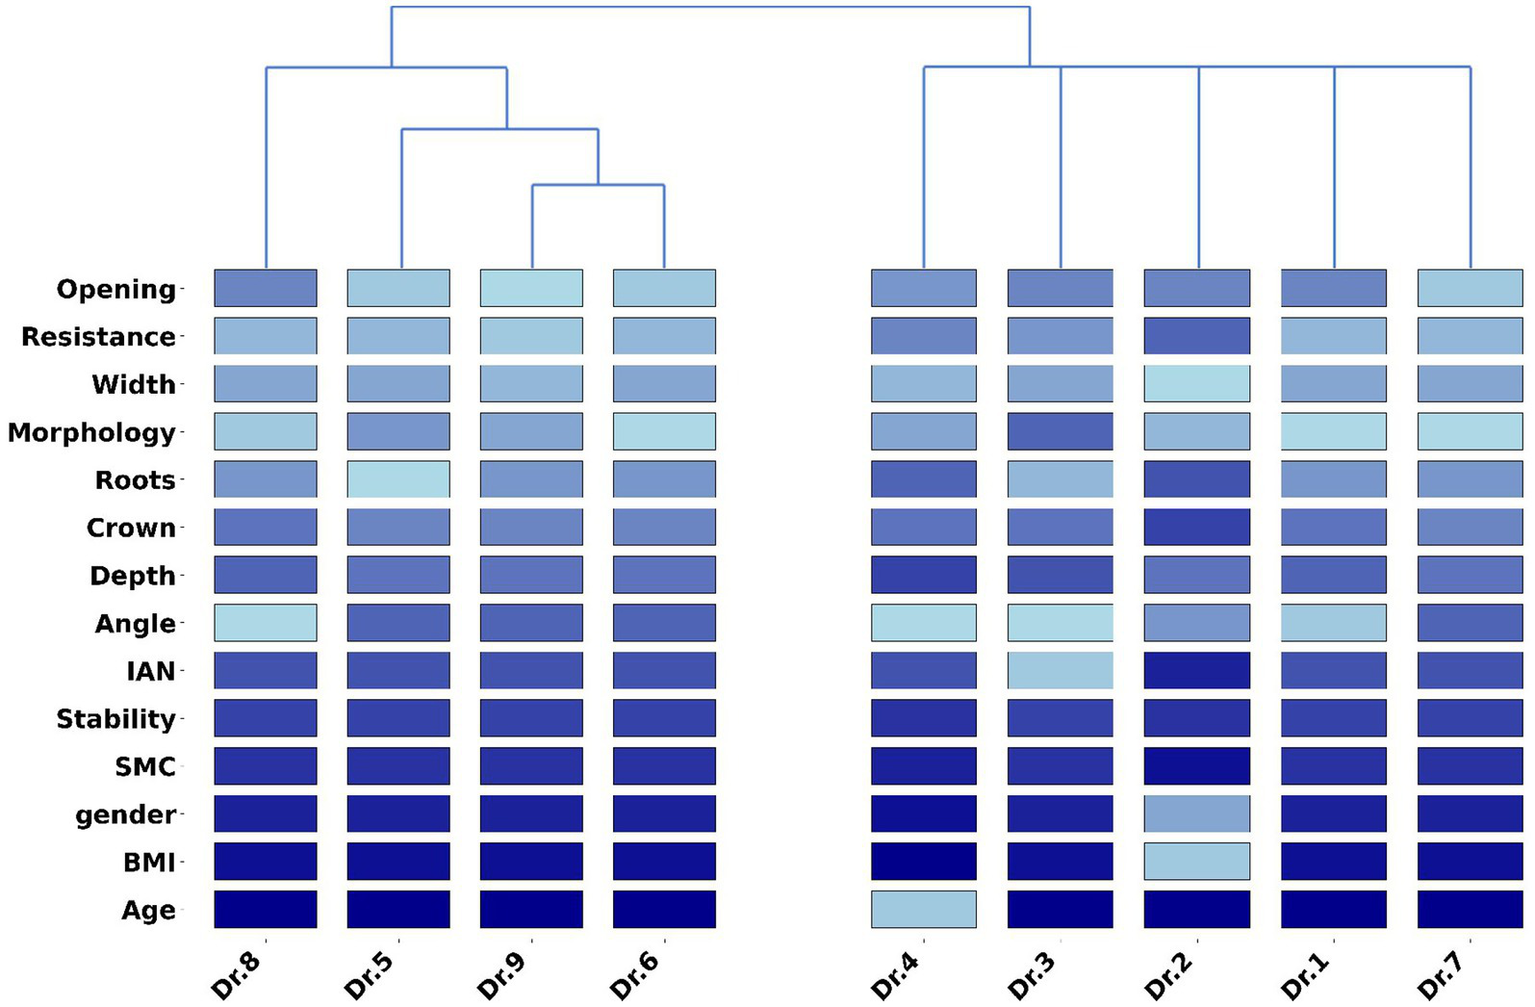
This figure shows the surgical feature labels corresponding to different surgeons and the clustering results for all surgeons. Among them, surgeons 1, 2, 3, 4, and 7 are grouped into the first category, while surgeons 5, 6, 8, and 9 are classified into the second category.
After obtaining the clustering results, we trained a specific model for each cluster using three machine learning algorithms. During the testing phase, we first determined the closest cluster for each test sample and then used the model trained on that cluster for prediction. In addition to our proposed method of hierarchical clustering based on the label vectors obtained from the LASSO trajectory, we also applied the commonly used GMM algorithm in the medical field for comparison. The results are shown in Table 3. The experimental results demonstrate that the approach of clustering the data before model training outperforms the method without clustering. The performance improved by at least 2% when clustering was applied compared to when it was not. In addition, after adopting the decoupling algorithm, the AUC metric reached 0.85, which is 4% than higher without the decoupling algorithm. Moreover, our proposed clustering method achieved results of 72 and 68% with Random Forest and XGBoost, respectively, which are on par with the results obtained using the GMM algorithm. Notably, our clustering method achieved the best performance with SVM, reaching an accuracy of 80%, while the method based on GMM clustering only achieved an accuracy of 78%. On the other hand, as shown in Figure 3, our model achieves the best performance in the macro-average ROC curve, with an AUC of 0.85. This indicates that the model delivers optimal average performance across all categories, demonstrating strong robustness.
Table 3
| Clustering algorithm | SVM | RF | XGBoost |
|---|---|---|---|
| Lasso clustering | 80% | 72% | 68% |
| GMM clustering | 78% | 72% | 68% |
| Without clustering | 75% | 70% | 66% |
Results of different clustering methods and three machine learning models in the task of predicting the difficulty of oral surgery.
Figure 3
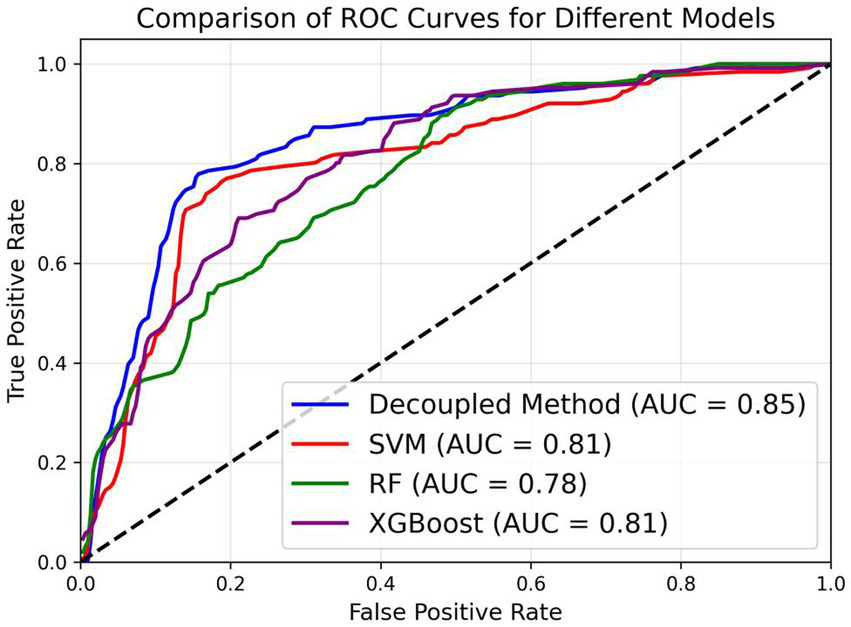
Macro-average ROC curve of three machine learning models and SVM with Lasso-based clustering method in the task of predicting the difficulty of oral surgery.
3.3 Research on classification criteria and the impact of different features
In order to investigate the rationale behind our proposed clustering algorithm, we conducted an analysis using the student t-test and the test results are shown in Figure 4. The results indicate a significant difference in the duration of surgery between the two groups of surgeons, with the second group of surgeons having a significantly longer surgical duration than the first group. Upon comparison, we found that the first group of surgeons had a longer tenure in the department, with an average experiences of 8 months, while the second group had an average tenure of only 3.25 months.
Figure 4
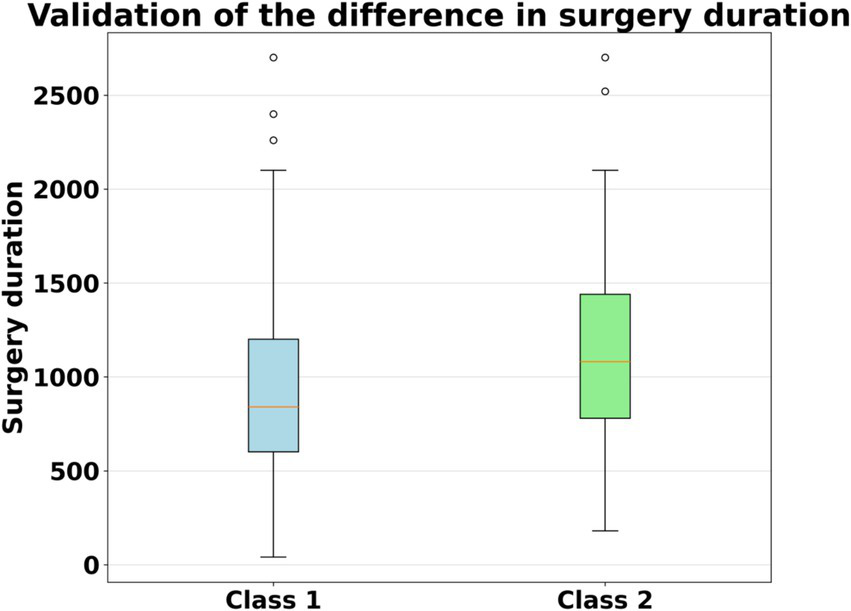
Boxplot of surgical duration for the two groups of surgeons.
Therefore, we conclude that the first group of surgeons are more proficient in surgical operations, resulting in shorter surgical times. In contrast, the second group of surgeons are less experienced, leading to longer surgical times. Therefore, we infer that the first group of surgeons are those who have completed the grade 1 training, while the second group consists of novice surgeons.
We applied the Lasso trajectory method to observe the differences between the two groups of surgeons in terms of various features. Specifically, we drew Lasso parameter trajectory curves for each group of surgeons separately and retained the features with absolute values of parameters greater than or equal to 0.05 after truncation at λ = 0.01. These features are considered to significantly affect the difficulty of surgery. The results are shown in Figure 5. For the first group of surgeons, only four features were retained: Crown resistance, impacted type, gender and mouth opening. Among them, the coefficient of the feature impacted type is 0.17, the coefficient of Crown resistance is 0.10, the coefficient of mouth opening is 0.09, and the coefficient of gender is −0.09. In contrast, for the second group of surgeons, all factors were retained.
Figure 5
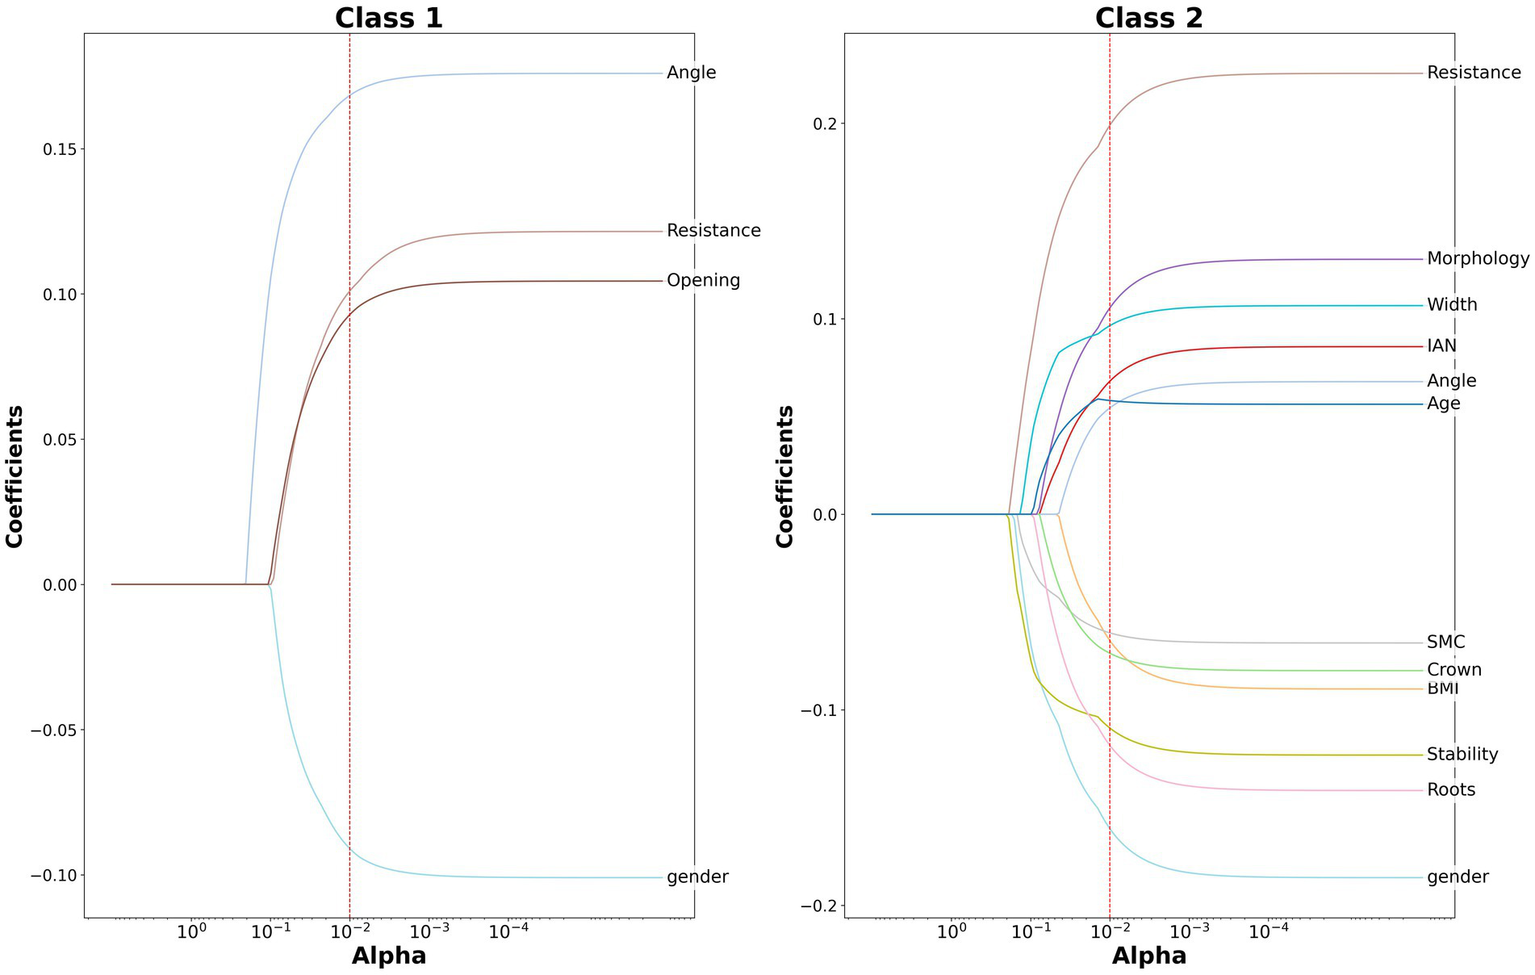
Lasso parameter trajectory curves for the two groups of surgeons.
3.4 Learning curve of surgeons after joining the department by monthly division
To further explore the growth process of the surgeons, we have specifically drawn learning curves to better observe the growth of surgeons after joining the department. These learning curves reflect the changes in surgical performance on a monthly basis after joining the department. For this analysis, we obtained the records of all surgeons for their first 10 months, divided them by month, and drew Lasso parameter trajectories based on the corresponding surgical records. To more intuitively demonstrate the growth process of the surgeons, we presented the coefficients of each surgical feature at the 1st, 5th, 8th, and 10th months. The results are shown in Figure 6.
Figure 6
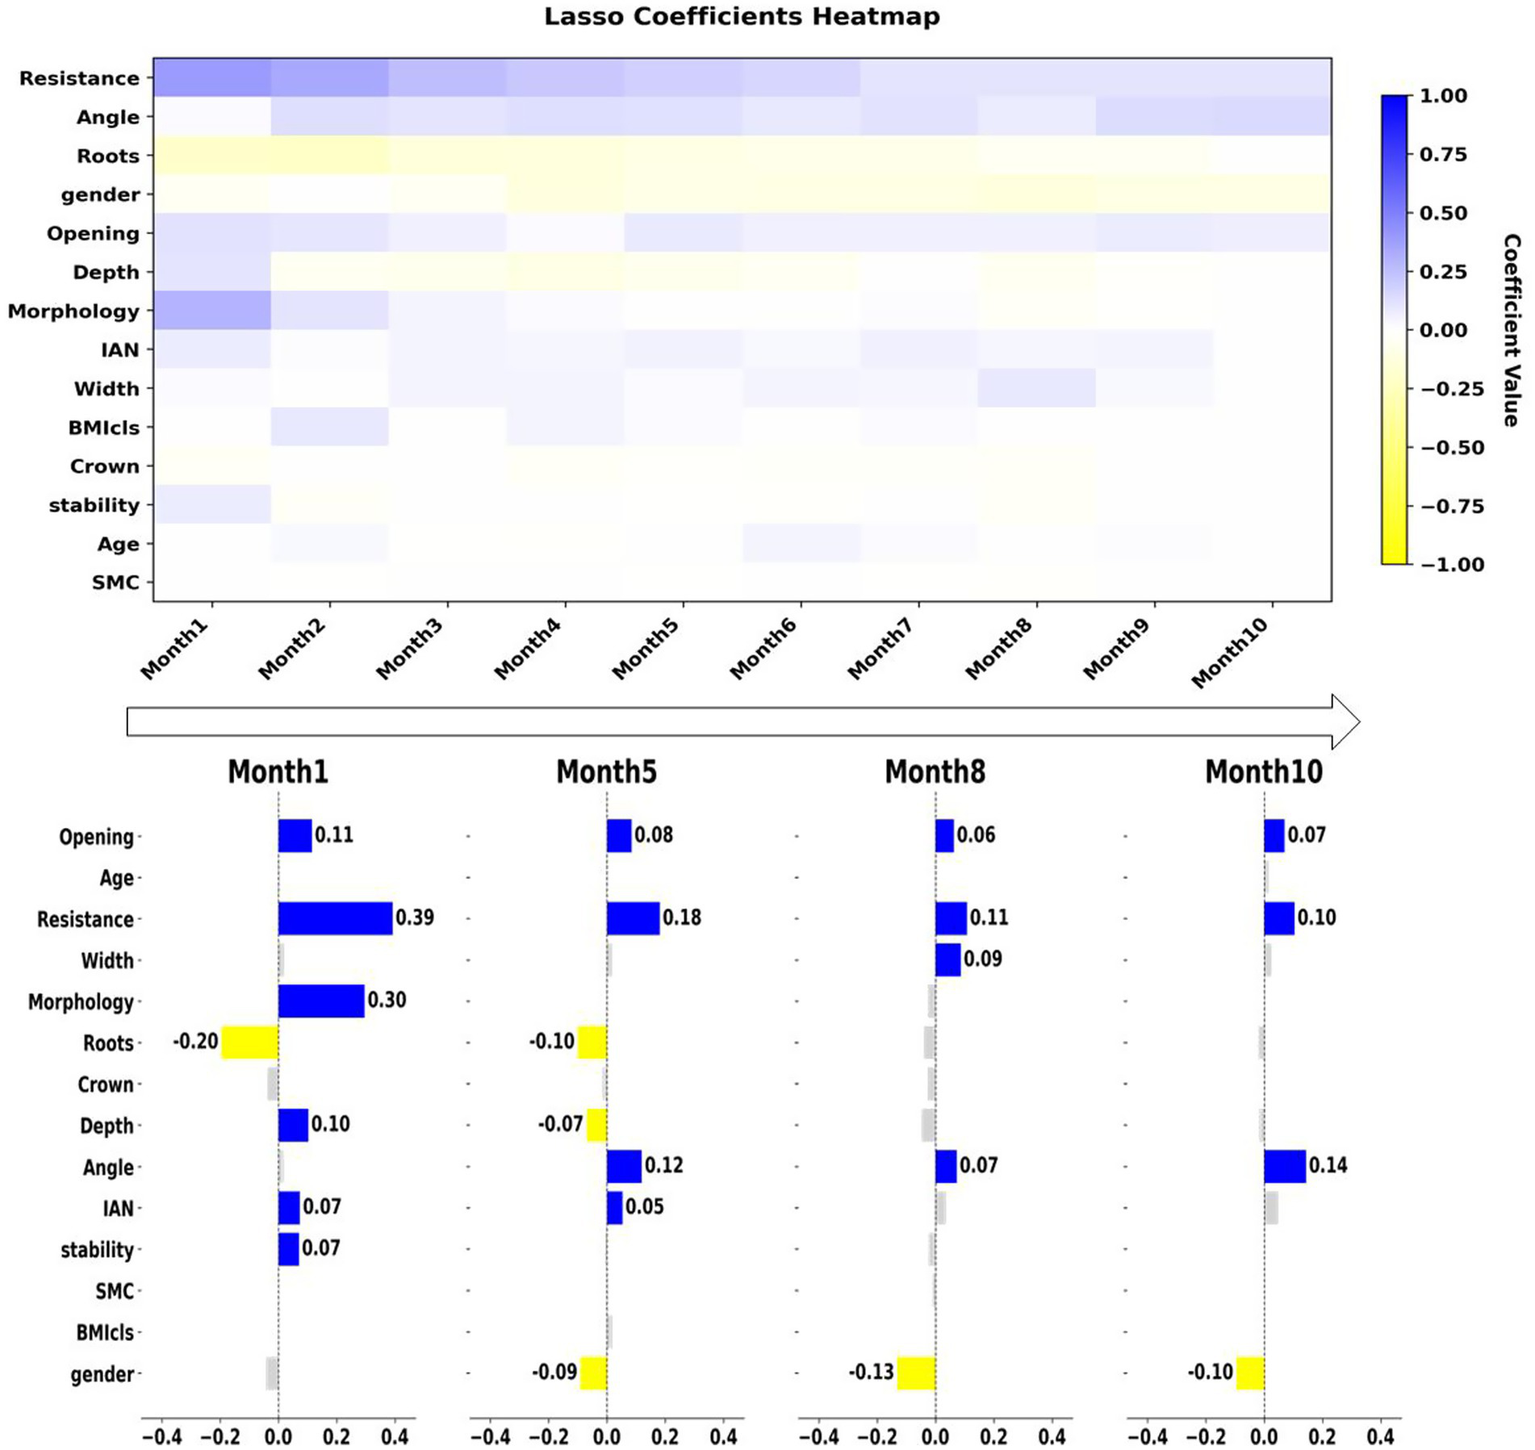
The upper panel shows the learning curve of surgeons after joining the department, plotted on a monthly basis. The lower panel shows the retained features and their corresponding parameters at 1, 5, 8, and 10 months.
Compared with the Delphi method, we found that all the factors mentioned in the Delphi method are reflected in our study, and different factors show different performances at different stages. The Delphi method considers the four factors—Depth, impacted type, Relationship of M3M and IAN, and mouth opening—to be more critical in the surgical procedure, which slightly differs from our conclusion. In fact, these factors are distributed across different periods and have varying impacts on the surgical difficulty during different stages. For example, the “Depth” factor is a highly significant influencing factor in the early stages. However, after 6 months, the impact of this factor diminishes to some extent. Similarly, the “Relationship of M3M and IAN” factor has a very significant impact on the surgery in the first 6 months, but its impact diminishes after 7 months. In contrast, we found that Factor “mouth opening” did not change significantly over the 10 month period and remained a factor with a substantial impact on the surgery. This phenomenon also applies to the Crown resistance factor, with the only difference being that this factor did not have a significant impact on the surgeon in the first month. However, starting from the second month, it became a factor that influences the surgery. Overall, the learning curve we proposed shows the evolution of each feature over time.
Our study, for the first time in comparison with these rule-based methods, emphasizes the growth curve of novice surgeons. As can be seen from Figure 6, the learning curves of the surgeons’ surgical features initially diverge but eventually converge on a few factors. This indicates that the surgeons, who are initially sensitive to all feature factors, become sensitive only to a few factors over time, demonstrating the growth process of the surgeons. It can be seen that in the first month after joining the department, surgeons are sensitive to the vast majority of features. After the fifth month, only these seven factors have a significant impact on the surgery. After the eighth month, all factors except these 5—crown resistance, impacted type, Root width, gender, and mouth opening—become insignificant. And by the ninth and tenth months, only four factors have a significant impact on the surgery, which are impaction resistance of wisdom teeth, impacted type, gender and mouth opening. The process reflects that for novice surgeons, the influencing factors evolve from being complex and variable to eventually converging into core four factors during the learning process.
4 Discussion
The extraction of impacted mandibular third molar is one of the most common procedures in oral and maxillofacial surgery. Given the anatomical variations and limited surgical visibility, these surgeries often present significant challenges, especially for residents. On the other hand, there is a large number novice of doctors in the field who need targeted training, and assigning them surgeries with inappropriate levels of difficulty poses safety risks. Therefore, we urgently need a surgical assessment system tailored for novice doctors. A reasonable assessment can not only formulate more accurate surgical plans and optimize resource allocation, but also provide targeted training for novice doctors, accelerating their learning process.
Previous studies have proposed various approaches to evaluate surgical difficulty. Rule-based systems (5–10), such as the Pell–Gregory classification and the Delphi method, provide standardized frameworks but rely heavily on expert consensus and often fail to reflect the dynamic learning process of novice surgeons. With the rise of artificial intelligence, data-driven approaches have become increasingly popular. For example, Yoo et al. (34) used convolutional neural networks on panoramic radiographs to predict third molar extraction difficulty, while Karkehabadi et al. (35) applied deep learning to periapical radiographs to classify endodontic case complexity, both achieving high accuracy. These data-driven studies emphasize anatomical complexity but generally overlook the role of operator performance. Beyond dentistry, radiomics and machine learning models have been successfully applied in cancer diagnosis, genetic prediction, and clinical risk assessment (17–22). Such work demonstrates the broad potential of data-driven methods to support medical decision-making. Our study shares this data-driven philosophy but differs in focus. Instead of relying solely on anatomical or imaging features, we incorporated operative time and surgeon-specific data to capture both case complexity and the learning curve of residents. This approach revealed that residents typically required about 8 months to achieve proficiency, with crown resistance, impaction type, mouth opening, and gender identified as the most influential factors. By integrating surgeon performance into difficulty assessment, our framework provides an objective and practical tool for surgical education and competency evaluation.
In this study, we propose a data-driven method to address those issues. We proposed a data-driven method for surgeon-specific difficulty assessment (DDSS) of third molar extraction surgery, which is highly interpretable and can provide rational explanations for evaluation decisions. The DDSS method comprises a decoupler and a predictor. Specifically, the decoupler is responsible for categorizing the doctor into an appropriate group and providing targeted difficulty-influencing factors, while the predictor is in charge of offering a difficulty prediction result to ensure that the doctor is suitable for the particular surgery. Through this approach, we divided surgeons into two major categories. It has been verified that the first category of surgeons belongs to surgeons who have completed the grade 1 training, while the second category belongs to novice surgeons different decoupling algorithms and different machine learning models. The experimental results showed that clustering the data before training machine learning models yielded better performance compared to not using any clustering method. Moreover, our proposed decoupling method outperformed or matched the GMM method, which was the best result among all experiments. These findings demonstrate the superiority of our proposed method.
To explore the learning curve of novice surgeons, we plotted the learning curve of novice doctors from the beginning to the completion of the first year of training, and the results are shown in the upper part of Figure 6. Compared with traditional methods such as the Delphi method, for the first time we have presented the changing trend of difficulty factors from the perspective of the growth process. We have also precisely located these factors in terms of time to show the changes in the learning process of novice surgeons. For example, factors such as depth and root number will significantly affect the surgical difficulty in the first month. However, as time goes on, their impact on the surgery gradually decreases and by the eighth month, they no longer have a significant impact on the surgical difficulty. This indicates that a doctor who has completed the grade 1 training is already able to skillfully handle these factors. Nevertheless, the mouth opening factor will have a certain impact on the surgical difficulty from the first month to the tenth month. But in the first month, compared with depth and root number, this factor does not show a significant impact on the surgery. Meanwhile, impacted type factor does not have a significant impact on the surgery even in the first month. However, as doctors grow, this difficulty factor gradually becomes more significant. This shows that with the doctors’ in-depth learning, some factors will be skillfully handled by the doctors, while the importance of some factors gradually emerges. Overall, the learning curve reflects the learning process of the surgeons. In the first month after joining the department, the vast majority of factors had a significant impact on the surgical difficulty. After 8 months, only Crown resistance, impacted type, gender and mouth opening had a significant impact on the surgery. This indicates that 8 months is a crucial point for novice surgeons to reach the level of grade 1 training. Meanwhile, it also demonstrates that these four factors have a significant impact on the surgical difficulty, and they should be given particular attention when designing surgical plans. This conclusion provides a solid theoretical basis for surgeon training and fills the gap in the relevant field.
In practical application scenarios, by employing the DDSS method we proposed, we can conduct targeted assessments for doctors who have a limited number of third molar extraction surgery samples, as shown in Figure 7. Specifically, when we need to evaluate the difficulty of a surgery for a doctor with a small amount of historical surgical data, the decoupler of DDSS will carry out an operational level assessment, while the classifier will conduct a difficulty assessment of execution. They will, respectively, identify targeted difficulty factors and provide a difficulty assessment for the current surgery. This method is not only suitable for assessing novice surgeons to provide targeted training but is also applicable to other surgeons with only a few surgical samples, such as newly arrived surgeons, thereby enabling more accurate predictions.
Figure 7
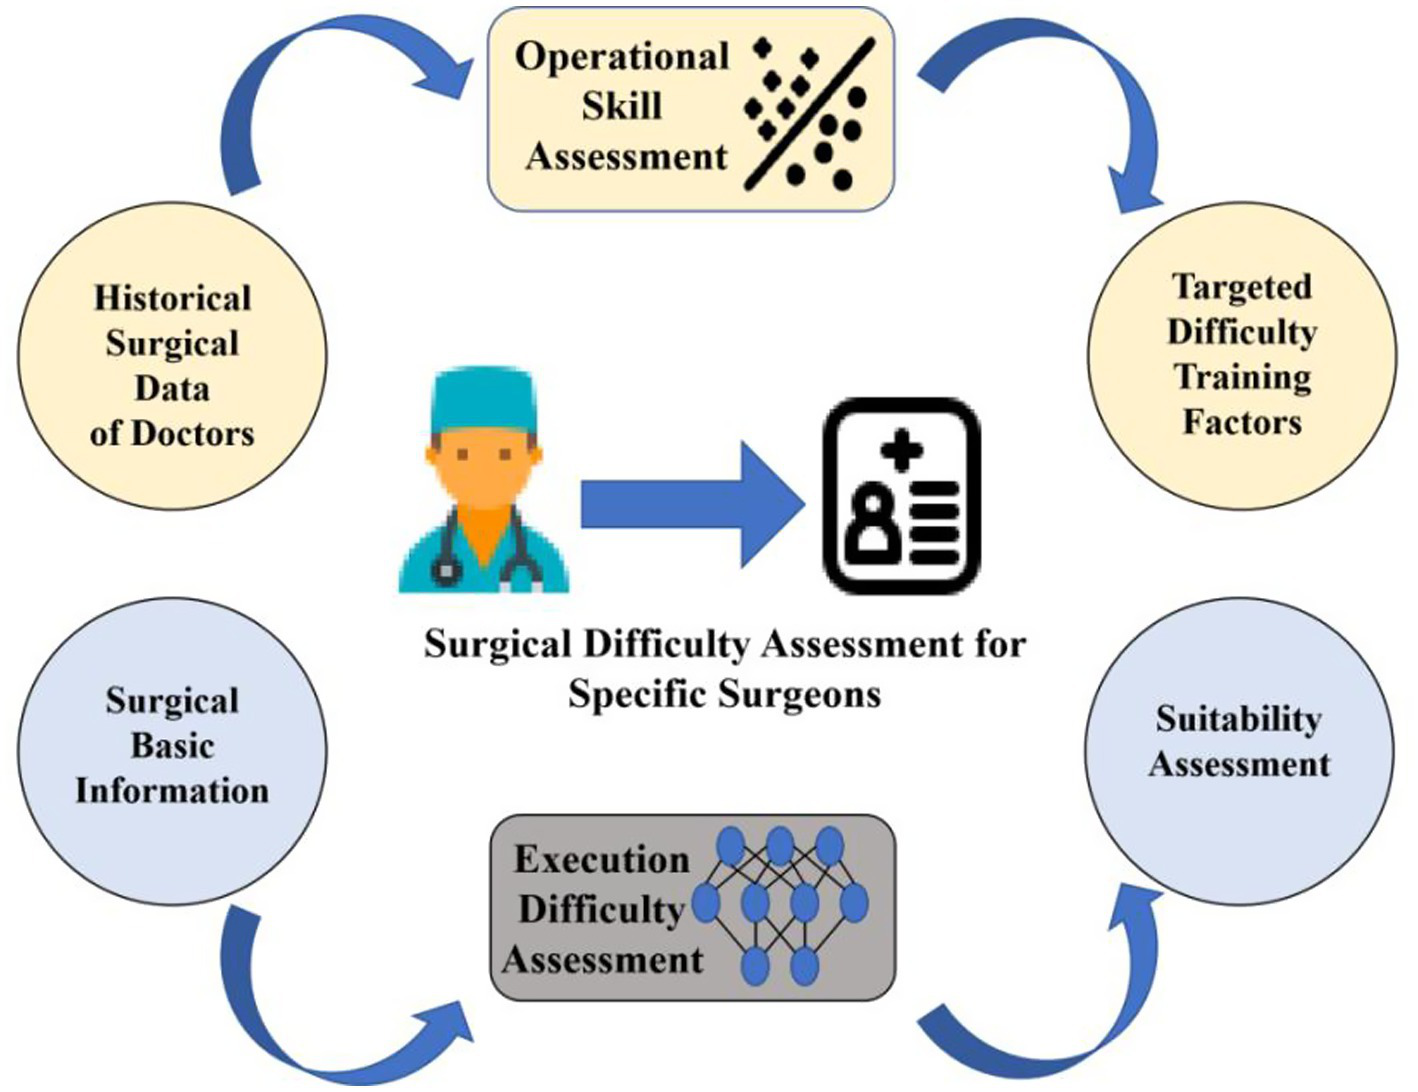
Model applications.
Beyond individual case assessment, the DDSS framework can be seamlessly integrated into clinical education and training systems. For instance, it can be used as a digital evaluation module in resident training programs to automatically track surgeons’ learning curves, identify key difficulty factors affecting each stage of skill development, and generate personalized feedback reports. By continuously updating the model with new surgical records, institutions can employ DDSS to assign cases of appropriate complexity, optimize supervision strategies, and ensure both patient safety and educational effectiveness. We are currently developing a prototype training-assessment platform based on this framework for multi-center validation.
Despite its promising results, this study has several limitations. First, it was conducted at a single institution, which may limit the generalizability of the findings to other training environments. Future work will expand the dataset through multi-center collaboration to enhance model robustness and external validity. Second, although all surgical indicators were recorded objectively by assistants during operations, potential recording bias cannot be completely excluded. Finally, the sample size of 419 cases, while sufficient for model development, can be further increased to support deeper model architectures such as neural networks. Addressing these issues will form the next phase of our research.
In future work, we will establish a multi-center collaboration to enlarge the dataset and craft more diverse evaluation metrics, thereby boosting model robustness and external validity. We will also explore additional architectures such as CNNs and Transformers. Ultimately, we will extend our data-driven assessment pipeline beyond dentistry to a wider range of medical disciplines.
5 Conclusion
This study proposed a data-driven framework for evaluating surgical difficulty in mandibular third molar extractions, focusing on operative time and surgeon performance rather than patient outcomes. The decoupling SVM model demonstrated the best predictive performance, achieving an accuracy of 80% and an AUC of 0.85. Clustering analysis distinguished inexperienced from experienced residents, showing that inexperienced surgeons were influenced by multiple factors, while experienced surgeons were mainly affected by crown resistance, impaction type, mouth opening, and gender. Learning curve analysis further revealed that residents generally required approximately 8 months of practice to become proficient. These findings suggest that our approach not only provides an objective tool for surgical difficulty assessment but also offers practical insights into training evaluation and curriculum design for dental education.
Statements
Data availability statement
The data analyzed in this study is subject to the following licenses/restrictions: further inquiries can be directed to the corresponding author. Requests to access these datasets should be directed to Nianhui Cui, drcuinianhui@163.com.
Author contributions
CK: Conceptualization, Validation, Writing – review & editing, Writing – original draft, Methodology, Software, Visualization, Investigation. ZYa: Writing – review & editing, Resources, Investigation, Formal analysis, Validation, Data curation, Supervision, Project administration. XX: Formal analysis, Investigation, Writing – review & editing. ZM: Writing – review & editing, Supervision, Investigation. FW: Writing – review & editing, Resources, Data curation. BG: Writing – review & editing, Supervision, Investigation. BW: Writing – review & editing, Resources, Data curation. ZYi: Conceptualization, Visualization, Resources, Formal analysis, Validation, Project administration, Supervision, Writing – review & editing, Methodology. NC: Resources, Visualization, Supervision, Project administration, Investigation, Validation, Writing – review & editing, Data curation, Conceptualization.
Funding
The author(s) declare that financial support was received for the research and/or publication of this article. This work was supported by the National Science and Technology Major Project 2022ZD0117802, and the National Natural Science Foundation of China under Grant 12201025.
Conflict of interest
The authors declare that the research was conducted in the absence of any commercial or financial relationships that could be construed as a potential conflict of interest.
Generative AI statement
The authors declare that Gen AI was used in the creation of this manuscript. We used generative AI to translate some paragraphs and have carefully checked the generated parts.
Any alternative text (alt text) provided alongside figures in this article has been generated by Frontiers with the support of artificial intelligence and reasonable efforts have been made to ensure accuracy, including review by the authors wherever possible. If you identify any issues, please contact us.
Publisher’s note
All claims expressed in this article are solely those of the authors and do not necessarily represent those of their affiliated organizations, or those of the publisher, the editors and the reviewers. Any product that may be evaluated in this article, or claim that may be made by its manufacturer, is not guaranteed or endorsed by the publisher.
References
1.
Jerjes W Upile T Kafas P Abbas S Rob J McCarthy E et al . Third molar surgery: the patient's and the clinician's perspective. Int Arch Med. (2009) 2:32. doi: 10.1186/1755-7682-2-32
2.
Gay-Escoda C Sánchez-Torres A Borrás-Ferreres J Valmaseda-Castellón E . Third molar surgical difficulty scales: systematic review and preoperative assessment form. Med Oral Patol Oral Cir Bucal. (2021) 27:e68. doi: 10.4317/medoral.24951
3.
Komerik N Muglali M Tas B Selcuk U . Difficulty of impacted mandibular third molar tooth removal: predictive ability of senior surgeons and residents. J Oral Maxillofac Surg. (2014) 72:1062.e1–6. doi: 10.1016/j.joms.2014.01.023
4.
García AG Sampedro FG Rey JG Vila PG Martin MS . Pell-Gregory classification is unreliable as a predictor of difficulty in extracting impacted lower third molars. Br J Oral Maxillofac Surg. (2000) 38:585–7. doi: 10.1054/bjom.2000.0535
5.
Zhang X Wang L Gao Z Li J Shan Z . Development of a new index to assess the difficulty level of surgical removal of impacted mandibular third molars in an Asian population. J Oral Maxillofac Surg. (2019) 77:1358.e1–8. doi: 10.1016/j.joms.2019.03.005
6.
Roy I Baliga SD Louis A Rao S . Importance of clinical and radiological parameters in assessment of surgical difficulty in removal of impacted mandibular 3rd molars: a new index. J Maxillofac Oral Surg. (2015) 14:745–9. doi: 10.1007/s12663-014-0731-8
7.
Sammartino G Gasparro R Marenzi G Trosino O Mariniello M Riccitiello F . Extraction of mandibular third molars: proposal of a new scale of difficulty. Br J Oral Maxillofac Surg. (2017) 55:952–7. doi: 10.1016/j.bjoms.2017.09.012
8.
Hasson F Keeney S McKenna H . Research guidelines for the Delphi survey technique. J Adv Nurs. (2000) 32:1008–15. doi: 10.1046/j.1365-2648.2000.t01-1-01567.x
9.
McPherson S Reese C Wendler MC . Methodology update: Delphi studies. Nurs Res. (2018) 67:404–10. doi: 10.1097/NNR.0000000000000297
10.
Chen Z Gu BX Tang YF Yan ZY Ni FD Cui NH . Constructions of the scale of difficulty in the extraction of impacted mandibular third molars by using Delphi method. J Peking Univ Health Sci. (2022) 54:100–4. doi: 10.19723/j.issn.1671-167X.2022.01.016
11.
Chen Q Lin S Wu J Lyu P Zhou Y . Automatic drawing of customized removable partial denture diagrams based on textual design for the clinical decision support system. J Oral Sci. (2020) 62:236–8. doi: 10.2334/josnusd.19-0138
12.
Yamagami A Narumi K Saito Y Furugen A Imai S Kitagawa Y et al . Development of a risk prediction model for surgical site infection after lower third molar surgery. Oral Dis. (2024) 30:3202–11. doi: 10.1111/odi.14747
13.
Van der Cruyssen F Verhelst P-J Jacobs R . The use of artificial intelligence in third molar surgery risk assessment. Dent Update. (2024) 51:28–33. doi: 10.12968/denu.2024.51.1.28
14.
Imai S . Data-driven clinical pharmacy research: utilizing machine learning and medical big data. Biol Pharm Bull. (2024) 47:1594–9. doi: 10.1248/bpb.b24-00492
15.
Yamagami A Narumi K Saito Y Furugen A Imai S Okamoto K et al . Validity and utility of a risk prediction model for wound infection after lower third molar surgery. Oral Dis. (2025) 31:1922–31. doi: 10.1111/odi.15243
16.
Ali H Shahzad M Sarfraz S Sewell KB Alqalyoobi S Mohan BP et al . Application and impact of Lasso regression in gastroenterology: a systematic review. Indian J Gastroenterol. (2023) 42:780–90. doi: 10.1007/s12664-023-01426-9
17.
Bu D Duan S Ren S Ma Y Liu Y Li Y et al . Machine learning-based ultrasound radiomics for predicting TP53 mutation status in hepatocellular carcinoma. Front Med. (2025) 12:1565618. doi: 10.3389/fmed.2025.1565618
18.
Li Q Liu L Liu Y Zheng T Chen N du P et al . Exploration of key genes associated with oxidative stress in polycystic ovary syndrome and experimental validation. Front Med. (2025) 12:1493771. doi: 10.3389/fmed.2025.1493771
19.
Long QY Wang FY Hu Y Gao B Zhang C Ban BH et al . Development of the interpretable typing prediction model for osteosarcoma and chondrosarcoma based on machine learning and radiomics: a multicenter retrospective study. Front Med. (2024) 11:1497309. doi: 10.3389/fmed.2024.1497309
20.
Ma T Zhao M Li X Song X Wang L Ye Z et al . A machine learning based radiomics approach for predicting no. 14v station lymph node metastasis in gastric cancer. Front Med. (2024) 11:1464632. doi: 10.3389/fmed.2024.1464632
21.
Huang Z Ge H Sun Y . Nomogram establishment for gastrointestinal bleeding prediction in ICU patients with traumatic brain injury based on the MIMIC-IV database. Front Med. (2025) 12:1523535. doi: 10.3389/fmed.2025.1523535
22.
Fan X Zhu Y Kan H Mao A Geng L Li C et al . Single-cell transcriptome analysis reveals status changes of immune cells in chronic kidney disease. Front Med. (2024) 11:1434535. doi: 10.3389/fmed.2024.1434535
23.
Mohd Faizal NF Shai S Savaliya BP Karen-Ng LP Kumari R Kumar R et al . A narrative review of prognostic gene signatures in oral squamous cell carcinoma using LASSO cox regression. Biomedicine. (2025) 13:134. doi: 10.3390/biomedicines13010134
24.
Werner E Clark JN Hepburn A Bhamber RS Ambler M Bourdeaux CP et al . Explainable hierarchical clustering for patient subtyping and risk prediction. Exp Biol Med (Maywood). (2023) 248:2547–59. doi: 10.1177/15353702231214253
25.
Braz DC Neto MP Shimizu FM Sá AC Lima RS Gobbi AL et al . Using machine learning and an electronic tongue for discriminating saliva samples from oral cavity cancer patients and healthy individuals. Talanta. (2022) 243:123327. doi: 10.1016/j.talanta.2022.123327
26.
Masood M Masood Y Newton JT . The clustering effects of surfaces within the tooth and teeth within individuals. J Dent Res. (2015) 94:281–8. doi: 10.1177/0022034514559408
27.
Alsakar YM Elazab N Nader N Elazab N Ezzat M Elmogy M . Multi-label dental disorder diagnosis based on mobile NetV2 and swin transformer using bagging ensemble classifier. Sci Rep. (2024) 14:25193. doi: 10.1038/s41598-024-85193-4
28.
Tseng YJ Wang YC Hsueh PC Wu CC . Development and validation of machine learning-based risk prediction models of oral squamous cell carcinoma using salivary autoantibody biomarkers. BMC Oral Health. (2022) 22:534. doi: 10.1186/s12903-022-02607-2
29.
Nayarisseri A Khandelwal R Tanwar P Madhavi M Sharma D Thakur G et al . Artificial intelligence, big data and machine learning approaches in precision medicine & drug discovery. Curr Drug Targets. (2021) 22:631–55. doi: 10.2174/18735592MTEzsMDMnz
30.
Song Y Zhang D Wang Q Liu Y Chen K Sun J et al . Prediction models for postoperative delirium in elderly patients with machine-learning algorithms and SHapley Additive Explanations. Transl Psychiatry. (2024) 14:57. doi: 10.1038/s41398-024-02762-w
31.
He B Cao Y Zhuang Z Deng Q Qiu Y Pan L et al . The potential value of oral microbial signatures for prediction of oral squamous cell carcinoma based on machine learning algorithms. Head Neck. (2024) 46:1660–70. doi: 10.1002/hed.27795
32.
Guido R Ferrisi S Lofaro D Conforti D . An overview on the advancements of support vector machine models in healthcare applications: a review. Information. (2024) 15:235. doi: 10.3390/info15040235
33.
Ameli N Gibson MP Kornerup I Lagravere M Gierl M Lai H . Automating bone loss measurement on periapical radiographs for predicting the periodontitis stage and grade. Front Dent Med. (2024) 5:1479380. doi: 10.3389/fdm.2024.1479380
34.
Yoo J-H Yeom H-G Shin W Kim H-C Kim K-W Lee J-H . Deep learning based prediction of extraction difficulty for mandibular third molars. Sci Rep. (2021) 11:1954. doi: 10.1038/s41598-021-81449-4
35.
Karkehabadi H Khoshbin E Ghasemi N Mahavi A Mohammad-Rahimi H Sadr S . Deep learning for determining the difficulty of endodontic treatment: a pilot study. BMC Oral Health. (2024) 24:574. doi: 10.1186/s12903-024-04235-4
Summary
Keywords
impacted mandibular third molars, tooth extraction, machine learning, data-decoupling, difficulty assessment
Citation
Kang C, Yan Z, Xiong X, Mi Z, Wang F, Guo B, Wu B, Yin Z and Cui N (2025) A data-driven method for surgeon-specific difficulty assessment in third molar extraction. Front. Med. 12:1654727. doi: 10.3389/fmed.2025.1654727
Received
26 June 2025
Accepted
20 October 2025
Published
07 November 2025
Volume
12 - 2025
Edited by
Ahsan Sethi, QU Health, Qatar University, Qatar
Reviewed by
Pradeep Kumar Yadalam, Saveetha Dental College and Hospitals, India; Gözde ışık, EgeSAM-Ege University Translational Pulmonary Research Center, Türkiye
Updates
Copyright
© 2025 Kang, Yan, Xiong, Mi, Wang, Guo, Wu, Yin and Cui.
This is an open-access article distributed under the terms of the Creative Commons Attribution License (CC BY). The use, distribution or reproduction in other forums is permitted, provided the original author(s) and the copyright owner(s) are credited and that the original publication in this journal is cited, in accordance with accepted academic practice. No use, distribution or reproduction is permitted which does not comply with these terms.
*Correspondence: Ziqiao Yin, yinziqiao@buaa.edu.cn; Nianhui Cui, drcuinianhui@163.com
Disclaimer
All claims expressed in this article are solely those of the authors and do not necessarily represent those of their affiliated organizations, or those of the publisher, the editors and the reviewers. Any product that may be evaluated in this article or claim that may be made by its manufacturer is not guaranteed or endorsed by the publisher.