Abstract
Background:
Early risk stratification in acute pancreatitis should address not only the probability of severe disease but also the timely prediction of persistent organ failure, (POF) infectious complications [including infected pancreatic necrosis (IPN)], and mortality. The neutrophil-to-lymphocyte ratio (NLR) is a low-cost, first-line biomarker that is readily obtainable within the initial 24–48 h.
Objective:
To evaluate the clinical utility of the NLR for predicting a severe disease course, persistent organ failure, infection, and mortality across predefined, time-specific measurement windows.
Methods:
We conducted a systematic review with meta-analytic synthesis of studies assessing the NLR at admission and during the first two days of hospitalization. Random-effects models were used, and bivariate approaches were applied to synthesize diagnostic accuracy.
Results:
Elevated admission NLR was consistently associated with subsequent severe disease and an early need for intensive care. NLR dynamics on day 1 and day 2 preserved prognostic value and improved identification of patients at risk of persistent organ failure. NLR also helped identify individuals more likely to develop infectious complications, including infected pancreatic necrosis. An admission NLR > 12 was associated with in-hospital mortality. Overall, NLR showed acceptable discriminative performance with a favorable sensitivity–specificity profile and remained clinically useful for early triage.
Conclusions:
The NLR is a simple, reproducible tool for early prediction of organ failure, infection, and mortality in acute pancreatitis. The use of time-specific, locally calibrated thresholds, integrated with clinical scores and routine laboratory data, is recommended to optimize patient triage, routing, and care decisions.
Systematic review registration:
PROSPERO (CRD420251169592).
1 Introduction
Acute pancreatitis (AP) remains one of the leading causes of urgent hospitalization in gastroenterology and abdominal surgery, and is accompanied by a substantial burden of complications, necessitating timely triage. Contemporary clinical guidelines underscore the critical importance of risk stratification within the first 24–48 h to determine monitoring intensity, the need for transfer to the intensive care unit (ICU), and the selection of invasive strategies for necrotizing disease (1–4). Despite long-standing experience with composite scoring systems and laboratory indicators [C-reactive protein (CRP); procalcitonin (PCT)], their prognostic utility in the initial hours is limited by the lag to peak informativeness, need for extended variable sets, and inter-center variability in discriminative performance. Against this backdrop, there is a growing demand for simple, accessible, and reproducible biomarkers for early risk stratification, aligned with contemporary severity definitions under the revised Atlanta 2012 classification (5–7).
Updated guidance from professional societies emphasizes that early risk assessment should rely on tools that can be measured repeatedly without delay and anchored to clearly validated endpoints such as persistent organ failure (POF), infected pancreatic necrosis (IPN), and in-hospital mortality (1, 2). This creates a mandate for first-line indices of systemic inflammation that can be deployed in the emergency department.
The biological rationale for this strategy is grounded in early sterile inflammatory events in AP, including neutrophil activation, formation of neutrophil extracellular traps (NETs), microcirculatory disturbances, and the systemic effects of cytokines. Collectively, these processes drive an imbalance between an “aggressive” innate response and stress-induced immunosuppression, a framework that underpins the interpretation of indices, such as the neutrophil-to-lymphocyte ratio (NLR) and related metrics (systemic immune-inflammation index, SII; platelet-to-lymphocyte ratio, PLR). Accumulating literature, including reviews of NET cell biology and experimental studies of their pharmacologic modulation, reinforces this biological plausibility and highlights the potential of targeting NETs to mitigate inflammatory severity in AP (8–10).
At the same time, several fundamental questions remain unresolved (4, 11). First, the temporal behavior of early indicators is insufficiently characterized; the informativeness of biomarkers in AP changes materially between admission, 24 h, and 48 h. Even for widely used CRP, the discrimination of severe disease is strongly time-dependent; thus, fixed one-off thresholds that ignore trajectory are methodologically unsound (4, 12). Second, standardization of endpoints and thresholds is lacking; real-world implementation requires harmonized rule-in/rule-out cut-offs with sensitivity/specificity estimates, LR±, and AUC calculated within predefined temporal windows, accompanied by external validation. Third, etiologic stratification (e.g., biliary vs. hypertriglyceridemic) and comorbidity may modify the performance of inflammatory indices, yet available interaction data remain fragmentary. Fourth, comparisons with existing tools remain unsettled: it is unclear whether a simple first-line index improves the discrimination of validated scores or can function as a standalone, rapid primary triage test before composite scales are calculated.
In managing complications of necrotizing disease, it is crucial to distinguish markers of infection risk from indicators of overall severity. For infected pancreatic necrosis, the strongest evidence to date supports procalcitonin (PCT), particularly its dynamic changes, whereas C-reactive protein (CRP) more reliably reflects systemic inflammatory activity. Combining markers or using composite models may improve decision-making accuracy during critical time windows (13, 14). In parallel, emerging artificial intelligence algorithms for early severity prediction underscore the need for simple, yet informative variables available at admission (15).
In summary, current clinical guidelines provide clear management frameworks for AP while also highlighting an unmet need for rapid, standardized predictors to support early triage. Against the backdrop of the immunobiology of systemic inflammation and the practical constraints of the first hours of presentation, the NLR remains an attractive, readily measurable first-line index. Nevertheless, confident implementation will require concordant evidence regarding (i) associations with clinically meaningful outcomes within predefined temporal windows; (ii) test accuracy and operational thresholds; (iii) etiologic modification of effects; and (iv) the incremental value achieved when combined with scoring systems and/or other biomarkers.
Study objective: To systematically evaluate the role of the neutrophil-to-lymphocyte ratio in the early prediction of clinically meaningful outcomes in acute pancreatitis.
2 Methods
2.1 Search strategy
We searched PubMed, Scopus, and Google Scholar for studies on NLR in AP through September 2025. The search combined the keywords “neutrophil-to-lymphocyte ratio,” “NLR,” and “acute pancreatitis.” In parallel, two reviewers independently screened the reference lists of included articles to identify additional publications and maximize completeness. Disagreements regarding study relevance were resolved through discussion until consensus was reached. The protocol for this systematic review and meta-analysis was registered in PROSPERO (CRD420251169592).
2.2 Review design and questions
We conducted a prespecified systematic review comprising two complementary syntheses:
Meta-analysis of prognostic factors: assessment of the association between NLR and adverse AP outcomes using odds ratios (ORs) or relative risks (RRs).
Meta-analysis of prognostic accuracy: pooling the discriminatory performance of NLR [area under the receiver operating characteristic curve (AUC), sensitivity/specificity, positive/negative likelihood ratios (LR+/LR–), and diagnostic odds ratio (DOR)] based on 2 × 2 tables (TP/FP/FN/TN) and reported AUC values.
Reporting adhered to PRISMA and MOOSE for meta-analyses of observational studies, and PRISMA-DTA for reviews of diagnostic accuracy. The clinical questions were as follows: (1) Is a higher NLR associated with severe disease, persistent organ failure (POF), infected pancreatic necrosis (IPN), or in-hospital mortality? (2) How accurately does NLR measured at different time points (day 0, day 1, and day 2) discriminate these outcomes?
2.3 Inclusion and exclusion criteria
Eligible studies were original investigations of adult patients with AP in which NLR was measured during the index hospitalization or within the first 48 h (strata: day 0, ~24 h/day 1, ~48 h/day 2) and were related to at least one of the following outcomes: severe disease (SAP/severe AP), POF, IPN, or in-hospital mortality.
For the prognostic factor synthesis, studies were required to report odds ratios (ORs) or risk ratios (RRs), adjusted and/or unadjusted, or to provide sufficient data for their calculation. For the prognostic accuracy synthesis, studies had to report 2 × 2 tables and/or the area under the curve (AUC) with 95% confidence intervals (CIs). We excluded pediatric cohorts, single-case reports, narrative reviews, and publications lacking data suitable for quantitative synthesis.
2.4 Endpoint definitions and time windows
The primary outcomes were SAP, defined according to the revised Atlanta classification or accepted equivalents; POF, as defined by the source studies; IPN; and in-hospital mortality. Analytic time windows were harmonized into three strata: admission (day 0), day 1 (~24 h), and day 2 (~48 h).
2.5 Data collection and risk of bias assessment
Two reviewers independently screened titles/abstracts and full texts and extracted data using a standardized form (study identifier; design; sample size; timing and method of NLR measurement; NLR threshold; number of events; 2 × 2 contingency tables; AUC with 95% CI; OR/RR with 95% CI; and covariates included in adjusted models). For reporting of the prognostic meta-analysis, we used the MOOSE checklist (16), and for diagnostic sub-analyses we followed PRISMA-DTA (17). Discrepancies during study selection and data extraction were resolved by consensus, with involvement of a third reviewer when needed.
Risk of bias for prognostic factor studies was assessed using the QUIPS tool (six domains: study participation, study attrition, prognostic factor measurement, outcome measurement, confounding, and statistical analysis/reporting) (18). For prognostic accuracy sub-analyses, we used QUADAS-2 (19). Domain-level judgments were incorporated into sensitivity analyses. The conduct and reporting of this study adhered to contemporary principles of transparency and reproducibility; in particular, recent recommendations such as TITAN for studies involving artificial intelligence were considered (20).
2.6 Statistical analysis
2.6.1 Prognostic factor (OR/RR associations)
Effect estimates (OR/RR) were synthesized on a log scale using random-effects models (REML) with Hartung–Knapp–Sidik–Jonkman confidence intervals. Heterogeneity was described using I2 and τ2, and PIs were reported when feasible. When multiple estimates were available within a study, we prioritized pre-specified early time windows (admission/day 1/day 2) and adjusted the models when reported.
Given the anticipated clinical and methodological diversity in acute pancreatitis (etiology, baseline risk, timing of blood sampling, and outcome definitions), substantial heterogeneity was expected. Accordingly, we interpreted I2 alongside τ2 and 95% prediction intervals and focused on clinically interpretable accuracy measures (HSROC-derived Se/Sp and LR±) with locally calibrated thresholds rather than on a single universal pooled cut-off.
2.6.2 Prognostic accuracy (DTA approach)
For studies providing complete 2 × 2 data, we calculated sensitivity and specificity and estimated pooled accuracy using a bivariate HSROC (Reitsma) model. Where available, AUC values were pooled using random-effects inverse-variance methods. Small-study effects in diagnostic accuracy analyses were explored using Deeks' test; additional model diagnostics are provided in the Supplementary Materials.
2.6.3 Thresholds and clinical calibration
Reported NLR cut-offs were summarized according to outcome and time window. Working thresholds were proposed by integrating the HSROC summary point with the empirical distribution of published cut-offs and were illustrated with post-test probabilities under clinically plausible prevalence (details in Supplementary Tables and Figures).
2.6.4 Subgroup and sensitivity analyses
Pre-specified subgroup analyses (e.g., etiology and sampling time) and sensitivity analyses (e.g., influence/leave-one-out checks and alternative assumptions for sparse data) were performed when sufficient studies were available; complete outputs are reported in the Supplementary materials.
2.6.5 Software and reproducibility
All analyses were performed in R (version 4.5.1); the full analytic workflow and technical specifications are detailed in the Supplementary materials. As an auxiliary check for DOR coherence and rapid SROC construction in the selected sub-analyses, we used Meta-DiSc 2.0.
3 Results
In accordance with PRISMA 2020 recommendations (21), 517 records were screened across databases; 92 reports underwent full-text assessment, and 72 studies (6, 22–92) were included in the qualitative synthesis (Table 1 and Figure 1). Risk of bias was evaluated using QUIPS (18) (Figures S1, S2). Overall, studies were rated as having low-to-moderate risk of bias, and none were rated as high risk.
Table 1
| Study | Year (patient accrual) | Country | Study design | Number of patients | Etiology | Severity assessment | Timing of NLR measurement | Prediction (endpoints) |
|---|---|---|---|---|---|---|---|---|
| Vo et al. (22) | 2023 (2021–2022) | Vietnam | Prospective | 131 | AP, BP, HTG, AP+HTG, other | Atlanta 2012 | On admission | 1 |
| Lu et al. (23) | 2022 (2016–2019) | China | Retrospective | 446 | HTG | Atlanta 2012, Ranson, BISAP, APACHE II | On admission | 1, 2 |
| Huang et al. (24) | 2019 (2012–2017) | China | Retrospective | 268 | AP, BP, HTG | Atlanta 2012 | On admission | 1 |
| Halaseh et al. (25) | 2022 (2019–2020) | United Kingdom | Retrospective | 314 | Mixed cohort | Glasgow | On admission; at 24 and 48 h | 4, 5 |
| Abayli et al. (26) | 2018 | Turkey | Retrospective | 435 | Mixed cohort | Ranson | On admission | 1 |
| Kolber et al. (27) | 2018 | Poland | Prospective | 95 | Mixed cohort | Atlanta 2012 | On admission; at 24 and 48 h | 2 |
| Park et al. (28) | 2019 (2008–2017) | Republic of Korea | Retrospective | 672 | Mixed cohort | Atlanta 2012 | On admission | 1 |
| Petrescu et al. (29) | 2019 (2013–2017) | Romania | Retrospective | 337 | Mixed cohort | Balthazar | On admission | 1 |
| Tahir et al. (30) | 2021 (2016–2019) | Pakistan | Retrospective | 166 | Mixed cohort | Atlanta 2012, MCTSI | On admission | 1 |
| Xu et al. (31) | 2024 (2012–2023) | China | Retrospective | 771 | BP, HTG | Atlanta 2012, BISAP, MCTSI | On admission | 2 |
| Karabuga et al. (32) | 2022 (2019–2020) | Turkey | Retrospective | 500 | BP, other | BISAP | On admission | 1 |
| Wang et al. (33) | 2017 (2010–2016) | USA | Retrospective | 110 | HTG | Atlanta 2012, Ranson, APACHE II | On admission | 1, 4 |
| Cho et al. (34) | 2018 (2014–2016) | Republic of Korea | prospective | 243 | AP, BP | Atlanta 2012, Ranson, BISAP, CTSI | On admission | 2 |
| Zhou et al. (35) | 2019 (2014–2017) | China | Retrospective | 406 | AP, BP, HTG, other | Atlanta 2012, BISAP, Ranson, APACHE II | On admission | 1, 4 |
| Azab et al. (36) | 2011 (2005–2008) | USA | Retrospective | 283 | Mixed cohort | Modified Early Warning Score (MEWS) | On admission | 1, 4 |
| Gezer et al. (37) | 2020 (2015–2018) | Turkey | Retrospective | 80 | Mixed cohort | Atlanta 2012, HAPS, BISAP, Ranson, MCTSI, Balthazar | On admission | 1, 4 |
| Yu et al. (38) | 2019 (2013–2018) | China | Retrospective | 159 | HTG, other | Atlanta 2012 | On admission | 1 |
| Suppiah et al. (39) | 2013 (2010) | United Kingdom | Retrospective | 146 | Mixed cohort | Atlanta 2012, Glasgow | On admission; at 24 and 48 h | 1, 2, 5 |
| Reddy and Muduru (40) | 2025 (2022–2024) | India | Prospective | 70 | Mixed cohort | Atlanta 2012 | On admission; at 24, 48 and 72 h | 1, 2, 4 |
| O'Connell et al. (41) | 2018 (2013–2016) | Ireland | Retrospective | 185 | Mixed cohort | ICU/HDU | On admission | 1, 4 |
| Vincent and Shashirekha (42) | 2024 | India | Retrospective | 118 | Mixed cohort | Atlanta 2012, CTSI | On admission | 1 |
| Jeon and Park (43) | 2017 (2007–2017) | Republic of Korea | Retrospective | 490 | Mixed cohort | Atlanta 2012 | On admission; at 24, 48 and 72 h | 1, 2 |
| Ak et al. (44) | 2023 (2015–2020) | Turkey | Retrospective | 514 | Mixed cohort | Atlanta 2012 | On admission | 1, 4 |
| Han et al. (45) | 2017 | China | Retrospective | 328 | BP, other | Atlanta 2012, Ranson | On admission; at 24 and 48 h | 1 |
| Kumbhar et al. (46) | 2025 (2018–2022) | India | Retrospective | 505 | Mixed cohort | Atlanta 2012, BISAP | At onset of fever | 3 |
| Uludag et al. (47) | 2022 (2012–2018) | Turkey | Retrospective | 341 | Mixed cohort | Balthazar CTSI | On admission | 1 |
| Jain et al. (48) | 2023 (2020–2022) | India | Prospective | 249 | Mixed cohort | Atlanta 2012, APACHE II, SAPS II, BISAP | On admission | 4 |
| Lu et al. (49) | 2023 | China | Retrospective | 113 | AP, BP, HTG, other | WSES-2019, BISAP | On admission | 1 |
| Akdur et al. (50) | 2022 | Turkey | Retrospective | 171 | Mixed cohort | Atlanta 2012, BISAP | On admission | 1, 5 |
| Junare et al. (51) | 2021 (2018–2019) | India | Prospective | 160 | Mixed cohort | Atlanta 2012, APACHE II, BISAP, mCTSI | On admission | 2, 4 |
| Li et al. (52) | 2017 (2013–2015) | China | Retrospective | 359 | AP, BP, HTG, other | Atlanta 2012 | On admission | 1, 4 |
| Dancu et al. (53) | 2021 (2018–2019) | Romania | Retrospective | 216 | Mixed cohort | Atlanta 2012, BISAP | On admission; at 48 h | 1, 4, 5 |
| Sandhyav et al. (54) | 2025 (2015–2018) | India | Prospective | 39 | Mixed cohort | Atlanta 2012, CTSI | At signs of infection | 3 |
| Pian et al. (55) | 2021 (2015–2017) | China | Retrospective | 169 | AP, BP, HTG, other | Atlanta 2012 | On admission | 1 |
| Liu et al. (56) | 2022 (2010–2020) | China | Retrospective | 2327 | AP, BP, HTG, other | Atlanta 2012, CTSI | On admission | 1 |
| Mihoc et al. (57) | 2021 (2016–2020) | Romania | Retrospective | 53 | BP, HTG, other | Atlanta 2012, CTSI | On admission | 4 |
| Xinyu et al. (58) | 2025 (2021–2023) | China | Retrospective | 137 | Mixed cohort | Atlanta 2012 | On admission | 1 |
| Ünal and Barlas (59) | 2019 | Turkey | Retrospective | 96 | BP, other | mCTSI | On admission | 1 |
| Liu et al. (60) | 2021 (2020–2021) | China | Retrospective | 101 | Mixed cohort | Atlanta 2012, BISAP, CTSI | On admission | 1 |
| Mubder et al. (61) | 2020 (2015–2018) | USA | Retrospective | 239 | Mixed cohort | Atlanta 2012 | On admission; at 24 and 48 h | 1, 2, 4 |
| Lin et al. (62) | 2023 (2012–2021) | China | Retrospective | 311 | HTG | Atlanta 2012 | On admission | 1 |
| Khan et al. (63) | 2021 | Pakistan | Retrospective | 154 | Mixed cohort | Balthazar | On admission | 1 |
| Li et al. (64) | 2024 (2018–2020) | China | Retrospective | 253 | Mixed cohort | Atlanta 2012, BISAP, Ranson | On admission | 1 |
| Bengi et al. (65) | 2025 (2021–2023) | Turkey | Retrospective | 238 | BP, other | BISAP, Ranson, HAPS | On admission; at 24 and 48 h | 1, 2, 4 |
| Piñerúa-Gonsálvez et al. (66) | 2025 (2014–2022) | Spain | Retrospective | 778 | Mixed cohort | Atlanta 2012, BISAP, Ranson | On admission | 2 |
| Zengin et al. (6) | 2025 (2019–2024) | Turkey | Retrospective | 412 | BP, other | Atlanta 2012, BISAP, Ranson, Glasgow, APACHE II | On admission | 4, 5 |
| Araiza-Rodríguez et al. (67) | 2025 (2021–2023) | Mexico | Retrospective | 100 | BP | Atlanta 2012 | On admission | 1 |
| Qi et al. (68) | 2025 (2020–2023) | China | Retrospective | 415 | AP, BP, HTG, other | Atlanta 2012 | On admission | 3 |
| Saribas et al. (69) | 2025 (2017–2024) | Turkey | Retrospective | 209 | BP | Atlanta 2012 | On admission | 4 |
| Kurtipek et al. (70) | 2025 (2021–2023) | Turkey | Prospective | 424 | Mixed cohort | Atlanta 2012 | On admission | 1 |
| Huynh et al. (71) | 2025 (2022–2023) | Vietnam | Prospective | 340 | Mixed cohort | Atlanta 2012 | On admission | 1 |
| Bhanou et al. (72) | 2018 | India | Retrospective | 107 | Mixed cohort | Atlanta 2012 | On admission | 1, 2, 4 |
| Memmedova et al. (73) | 2019 (2014–2016) | Turkey | Retrospective | 150 | BP, other | Ranson, Glasgow, Balthazar | On admission | 1, 5 |
| Fonseca et al. (74) | 2021 | Portugal | Retrospective | 445 | Mixed cohort | Atlanta 2012 | On admission | 1, 2, 4 |
| Roy et al. (75) | 2023 | Bangladesh | Prospective | 120 | Mixed cohort | Atlanta 2012 | On admission | 1 |
| Abu-Elfatth et al. (76) | 2022 (2018–2020) | Єгипет | Prospective | 100 | Mixed cohort | Atlanta 2012 | On admission | 1, 4 |
| Shrestha et al. (77) | 2024 (2020–2021) | Nepal | Prospective | 45 | AP, BP, other | Atlanta 2012 | On admission | 1, 4 |
| Yalçin and Yalaki (78) | 2019 | Turkey | Retrospective | 667 | BP, other | Atlanta 2012, Ranson | At 48 h | 4 |
| Kumar and Tamma (79) | 2023 (2022) | India | Prospective | 48 | Mixed cohort | Atlanta 2012 | On admission; at 24 and 48 h | 1 |
| Mumin et al. (80) | 2024 | Bangladesh | Prospective | 40 | Mixed cohort | BISAP | On admission | 1, 4 |
| Pati et al. (81) | 2025 (2020–2021) | India | Prospective | 108 | AP, BP, HTG, other | Atlanta 2012, BISAP | On admission | 1, 4 |
| Orak et al. (82) | 2016 (2009–2014) | Turkey | Retrospective | 494 | Mixed cohort | Atlanta 2012 | On admission | 1, 4, 5 |
| Ergenc et al. (83) | 2022 (2014–2015) | Turkey | Retrospective | 200 | BP, other | Atlanta 2012 | On admission; at 48 h | 1 |
| Silva-Vaz et al. (84) | 2020 (2015–2017) | Portugal | Prospective | 75 | BP | Atlanta 2012, BISAP | On admission | 1, 4 |
| Pan et al. (85) | 2023 (2021–2023) | China | Retrospective | 145 | HTG | Atlanta 2012 | On admission | 1 |
| Mihoc et al. (86) | 2025 (2017–2024) | Romania | Retrospective | 179 | Mixed cohort | Atlanta 2012, APACHE II, Ranson, CTSI | On admission | 4 |
| Aktaş et al. (87) | 2025 (2018–2022) | Turkey | Retrospective | 357 | Mixed cohort | Atlanta 2012, APACHE II, BISAP, mCTSI | On admission; at 24 and 48 h | 1, 4, 5 |
| Zhu et al. (88) | 2023 (2018–2020) | China | Retrospective | 324 | BP, HTG, other | Atlanta 2012 | On days 1, 4, and 7 | 3 |
| Shabbir et al. (89) | 2025 (2017–2018) | USA | Retrospective | 1 250 | Mixed cohort | Atlanta 2012 | On admission | 1 |
| Jin et al. (90) | 2021 (2017–2019) | China | Retrospective | 300 | BP, HTG, other | Atlanta 2012 | On admission | 1 |
| Sarihan et al. (91) | 2024 (2019–2022) | Turkey | Retrospective | 254 | Mixed cohort | MCTSI | On admission | 1 |
| Cazacu et al. (92) | 2023 (2018–2021) | Romania | Retrospective | 725 | AP, BP, HTG, other | Atlanta 2012, BISAP, SOFA, mCTSI | On admission; at 48 h | 2, 4 |
Characteristics of studies of the neutrophil-to-lymphocyte ratio in acute pancreatitis.
1 severe course, 2 organ failure, 3 infected pancreatic necrosis, 4 mortality, 5 complications, AP, alcoholic pancreatitis; BP, biliary; HTG, hypertriglyceridemic.
Figure 1

PRISMA 2020 flow diagram for study selection.
3.1 NLR on admission
Higher admission NLR was associated with an increased risk of severe disease, with a pooled OR of 4.50 (95% CI 2.97–6.81) and a wide prediction interval (0.41–49.75; Figure 2 and Table S1). In the bivariate diagnostic test accuracy meta-analysis (33 studies; 7,223 patients), the summary estimates were sensitivity 0.777 and specificity 0.726, with a summary AUC of 0.771, indicating good discrimination despite substantial between-study heterogeneity (Figures 3, S3–S5). Published cut-offs clustered around 7–10 and are summarized in Table S2, while variability in log(DOR) with prediction intervals is shown in Figure S6. Based on these distributions and pooled performance, we selected an operational threshold of NLR = 9; corresponding PPV/NPV across assumed prevalences (10–30%) are presented in Figure S7 and Table S3. Threshold-category behavior on the HSROC plane is shown in Figure S8.
Figure 2

Forest plot of odds ratios (ORs) for day-0 NLR and the risk of a severe course of acute pancreatitis.
Figure 3

Summary ROC (SROC) curve for admission NLR with the summary point and confidence/prediction ellipses.
3.1.1 NLR on day 1
Five studies showed that higher day-1 NLR was associated with severe disease (pooled OR 6.65, 95% CI 1.85–23.91), with high heterogeneity and a wide prediction interval (0.38–117.78; Figure 4). In the bivariate diagnostic test accuracy meta-analysis (4 studies; n = 833; prevalence 0.30), pooled sensitivity was 0.723 and pooled specificity was 0.665, corresponding to a DOR of 5.17, LR+ of 2.16, and LR– of 0.417 (Figures S9, S10, S12). Discrimination was moderate to good (AUC 0.779) in the SROC analysis (Figures 5, S11). Reported cut-offs clustered around ~8 (weighted median 8.1; Table S4); using NLR = 8.1, expected PPV/NPV were 0.19/0.96 (10%), 0.35/0.91 (20%), and 0.48/0.85 (30%; Figure S13 and Table S5).
Figure 4
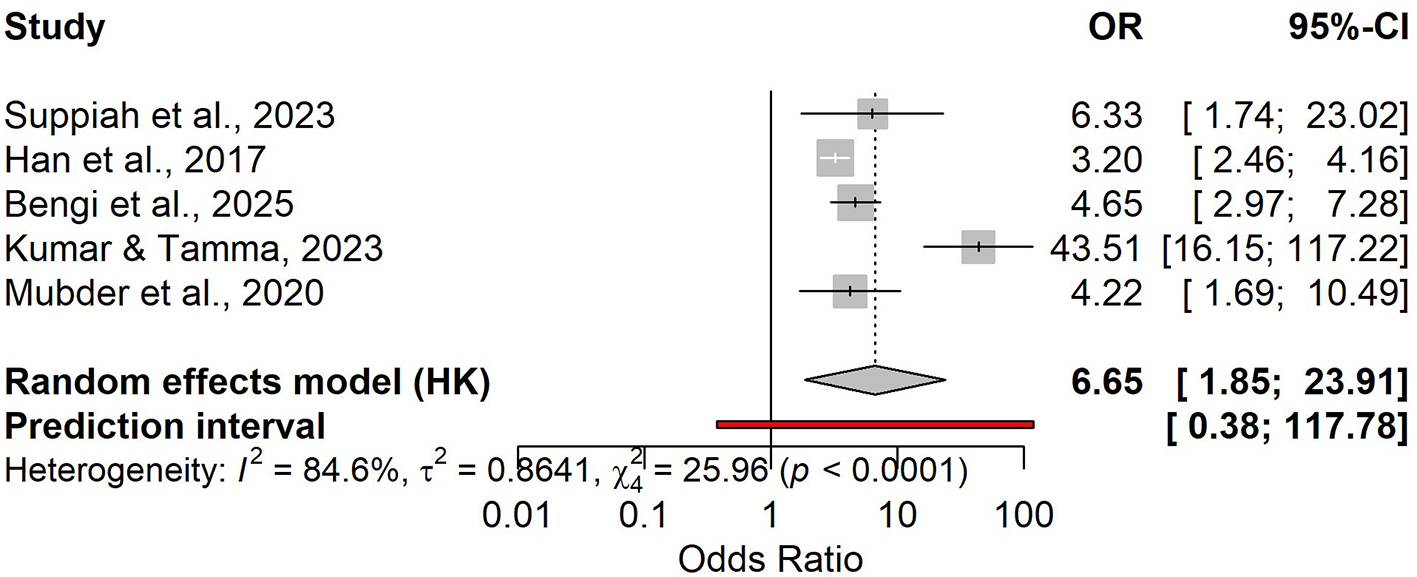
Forest plot of odds ratios (OR) for day-1 NLR and the risk of a severe course of acute pancreatitis.
Figure 5

Summary ROC (SROC) curve for day-1 NLR with the summary point and confidence/prediction ellipses.
3.1.2 NLR on day 2
Seven studies contributed to the association analysis, showing that higher day-2 NLR was linked to severe acute pancreatitis (random-effects OR 6.94, 95% CI 2.16–22.29), with substantial heterogeneity and a wide prediction interval (0.32–151.08; Figure 6). In the bivariate diagnostic test accuracy meta-analysis (5 studies; n = 958; prevalence 0.27), pooled sensitivity was 0.831 (95% CI 0.674–0.921) and pooled specificity was 0.651 (95% CI 0.541–0.747; Figures S14, S15), corresponding to a DOR of 9.17 (95% CI 4.04–20.85), LR+ of 2.38, and LR– of 0.259 (Figure S18). The SROC analysis showed moderate to good discrimination (AUC 0.753, 95% CI 0.696–0.802; Figures 7, S16, S17). Reported cut-offs (n = 6) clustered around ~6–8 (weighted median 6.5; median 7.0; IQR 6.24–9.75; Table S6); therefore, we used an operational threshold of NLR ≈ 7 on day 2. Using LR+ 2.38 and LR– 0.259, expected PPV/NPV are 0.21/0.97 at 10% prevalence, 0.37/0.94 at 20%, 0.47/0.91 at 27%, and 0.50/0.90 at 30% (Figure S19 and Table S7).
Figure 6

Forest plot of odds ratios (OR) for day-2 NLR and the risk of a severe course of acute pancreatitis.
Figure 7

Summary ROC (SROC) curve for day-2 NLR with the summary point and confidence/prediction ellipses.
3.1.3 NLR in acute biliary pancreatitis
Two studies (n = 209; severe ABP = 19; prevalence 9%) evaluated admission NLR. Pooled diagnostic accuracy showed sensitivity 0.84 (95% CI 0.61–0.95) and specificity 0.54 (95% CI 0.35–0.72; Figures S20, S21), corresponding to LR+ 1.83, LR– 0.29, and DOR 6.28 (Figure S23); AUC is summarized in Figure S22. Sensitivity heterogeneity was negligible (I2 = 0%), whereas specificity was highly heterogeneous (I2 = 91%), consistent with different thresholds across studies. The association meta-analysis suggested an increased risk of severe ABP with elevated admission NLR (OR 4.02), but with extremely wide confidence intervals due to few events (Figure 8). Reported cut-offs differed (7.80 vs. 14.64); a pragmatic working threshold was NLR ≈ 10 (range 8–11). At a 9% prevalence, the expected PPV is approximately 0.15 and the NPV approximately 0.97, indicating that NLR is primarily useful for ruling out a severe course at intake.
Figure 8
![Forest plot showing the odds ratios (OR) and 95% confidence intervals (CI) for two studies: Cho et al., 2018 (OR 1.97, CI [1.21; 3.19]) and Silva-Vaz et al., 2020 (OR 11.55, CI [2.34; 57.09]). A random effects model shows a pooled OR of 4.02 with confidence intervals from [0.00; 248997.85] and a prediction interval from [0.00; 211480912.17]. Heterogeneity indices \(I˄2 = 76.8\%\), \(\tau˄2 = 1.2036\), and \(\chi˄2 = 4.32\) (p = 0.0377). Odds ratio scale ranges from 0.001 to 1000.](https://www.frontiersin.org/files/Articles/1729339/xml-images/fmed-12-1729339-g0008.webp)
Forest plot of pooled odds ratios (ORs) for the association between elevated admission NLR and a severe course of acute biliary pancreatitis.
3.1.4 NLR in hypertriglyceridemia-induced pancreatitis (HTG-AP)
Three studies (n = 378; severe = 112; prevalence 30%) assessed admission NLR diagnostic accuracy: Se 0.90 (95% CI 0.83–0.94) and Sp 0.68 (95% CI 0.51–0.81; Figures S26, S27), with LR+ 2.79, LR– 0.15, DOR 19.22, and pooled AUC 0.75 (95% CI 0.646–0.834; Figures S28, S29). Sensitivity heterogeneity was minimal (I2 = 0%), whereas specificity heterogeneity was high (I2 = 90%), again suggesting threshold variability. The association meta-analysis (five studies) yielded an OR of 4.95 (95% CI 0.64–38.09) with substantial heterogeneity (I2 = 93.8%; Figure 9). Reported cut-offs ranged from 5.88 to 10.00; overall performance favored an operational threshold of NLR ≈ 10 (practical range 8–11). At a 30% prevalence, the expected PPV is approximately 0.55 and the NPV approximately 0.94.
Figure 9

Forest plot of odds ratios (ORs) for the association between elevated admission NLR and a severe course of hypertriglyceridemia-induced acute pancreatitis (random-effects Hartung–Knapp model).
3.2 NLR for organ dysfunction
Ten studies assessed admission NLR as a prognostic marker for subsequent POF; all contributed to the pooled effect estimate, and eight reported 2 × 2 data suitable for diagnostic accuracy synthesis (n = 3,178; POF prevalence 12%). Overall, higher admission NLR was associated with increased odds of POF in the random-effects meta-analysis, with substantial between-study heterogeneity and a wide prediction interval (Figure 10). In the bivariate HSROC model (8 studies), the summary operating point indicated moderate sensitivity and specificity for identifying patients who will develop POF, consistent with the SROC curve and the dispersion of study points and confidence/prediction regions (Figures 11, S30, S31). Discrimination was modest in the pooled AUC meta-analysis, aligning with the HSROC summary performance (Figures 11, S33), while diagnostic odds ratios varied across studies with persistent heterogeneity (Figure S34). Reported “optimal” admission NLR thresholds ranged widely, with a central tendency around ~9, supporting a pragmatic cut-off near this value with local calibration to baseline risk (Table S8 and Figure S32). Using the summary likelihood ratios, post-test values at representative prevalences are summarized in Table S9 and illustrated with Fagan nomograms (Figure S35).
Figure 10
![Forest plot showing odds ratios (OR) and 95% confidence intervals (CI) for several studies. The studies listed are Lu et al., Kolber et al., Xu et al., and others. Individual study ORs range from 1.15 to 15.67. The random effects model shows a summary OR of 2.21 with a 95% CI of [1.37, 3.59]. Heterogeneity statistics include I² = 87.0%.](https://www.frontiersin.org/files/Articles/1729339/xml-images/fmed-12-1729339-g0010.webp)
Pooled forest plot of the association between admission NLR and risk of POF (random-effects model).
Figure 11

SROC curve for admission NLR (POF) with the summary point and predictive/confidence ellipses.
3.3 NLR for infected pancreatic necrosis (IPN)
Four studies (n = 744; IPN prevalence ~45%) assessed admission NLR. The pooled association with IPN was imprecise and highly heterogeneous (OR 1.77, with a wide prediction interval; Figure 12). Given the extreme between-study heterogeneity and the small number of studies, this pooled estimate should be considered exploratory and should not be used for definitive inference. In the HSROC analysis, diagnostic accuracy was moderate (Se ≈ 0.75; Sp ≈ 0.67; LR+ ≈ 2.26; LR– ≈ 0.38; DOR in the moderate range; Figures S36, S37, S39). Discrimination was generally good but variable (pooled AUC ≈ 0.79; Figure S38). Reported cut-offs (~3.5–6.2) support a pragmatic threshold around NLR ≈ 6, with local calibration at ~45% prevalence, PPV ≈ 0.65 and NPV ≈ 0.76 (illustrative).
Figure 12
![Forest plot showing odds ratios (ORs) and 95% confidence intervals (CI) for studies by Kumbhar et al. 2025, Sandhyav et al. 2025, Qi et al. 2025, and Zhu et al. 2023. The overall random effects model indicates an OR of 1.77 with a 95% CI of [0.53, 5.87] and prediction interval [0.17, 18.90]. High heterogeneity is noted with I-squared at 93.9%.](https://www.frontiersin.org/files/Articles/1729339/xml-images/fmed-12-1729339-g0012.webp)
Forest plot of the association between NLR and infected pancreatic necrosis (OR, 95% CI; random-effects model).
3.4 NLR and mortality
Across 15 studies, higher admission NLR was associated with increased mortality (pooled OR 3.72), but with very high heterogeneity and a wide prediction interval (Figure 13). In 14 studies with 2 × 2 data (N = 4,090), the HSROC analysis showed good overall performance (Se ≈ 0.73; Sp ≈ 0.79; LR+ ≈ 3.44; LR– ≈ 0.34), with moderate-to-high between-study heterogeneity (Figures 14, S40–S42). Discrimination was good (pooled AUC ≈ 0.80; Figures S43, S44). Reported optimal cut-offs varied (~9.7–18.7) but clustered around ~12, which serves as a pragmatic benchmark with local calibration (Figure S42). At low mortality prevalence, PPV remains modest (≈0.18 at 6%; ≈0.28 at 10%), while NPV is high (≈0.98 and ≈0.96, respectively; Table S10 and Figure S45).
Figure 13

Forest plot of the association between admission NLR and mortality (random-effects model; OR and 95% CI).
Figure 14

SROC curve for admission NLR in predicting mortality, with the summary point and confidence/prediction ellipse regions.
4 Discussion
In this systematic review and meta-analysis, NLR measured within the first two days of hospitalization provided time-dependent prognostic information in acute pancreatitis. At admission, NLR provided moderate discrimination for severe disease and good discrimination for mortality, whereas performance for infection-related outcomes, driven largely by infected pancreatic necrosis, was only moderate. Importantly, the association-based synthesis for infected pancreatic necrosis (odds ratios) was not robust, reflecting extreme heterogeneity and the small number of available studies. Overall, the evidence supports NLR as a rapid adjunct for early triage and follow-up assessment, rather than a standalone decision rule.
Several included cohorts directly compared NLR with established multivariable scores for predicting severe acute pancreatitis (Table S11), helping to contextualize NLR within routine risk stratification. Across these head-to-head comparisons, admission-based analyses more often favored multivariable scores (e.g., BISAP and APACHE II) for predicting severe disease in multiple cohorts (35, 37, 70). Findings for mortality and organ failure were less consistent: some cohorts reported better discrimination for mortality with NLR than with BISAP (37), whereas others showed the opposite (35). For organ failure, Junare et al. reported slightly better performance for NLR than for BISAP and APACHE II (51). When dynamic testing was available, NLR reassessed at approximately 48 h sometimes matched or exceeded BISAP/APACHE II for both severe disease and mortality (53, 87). However, these comparisons derive from a limited set of heterogeneous studies with variable endpoints and sampling windows and therefore do not justify firm claims of superiority. Taken together, NLR is best interpreted as a universally available complement to established prognostic scores, with its main value in rapid early screening and short-interval reassessment during the first forty-eight hours.
Biologically, NLR captures two early processes in acute pancreatitis: neutrophil-driven innate activation (DAMP/cytokine/NET-mediated injury) and relative lymphopenia reflecting stress-related immune dysregulation. This dual signal supports its use as an early, readily available marker during the first days of illness (93) and aligns with evidence linking neutrophils/NETs to systemic complications in AP (8–10, 94). Overall, NLR condenses the early inflammatory–immune balance into a simple, readily repeatable metric, making 0–48-h trends clinically informative. This is consistent with guideline emphasis on early stratification aimed at predicting persistent organ failure, infected pancreatic necrosis, and mortality (1, 2). Across diverse conditions, higher NLR is associated with worse outcomes, reflecting the broader prognostic relevance of neutrophilia with relative lymphopenia (95). In AP, many cohorts report higher NLR in patients who progress to organ dysfunction, infection, and death; however, thresholds and sampling windows vary, reinforcing the need for dynamic, context-aware interpretation rather than reliance on a single universal cut-off (1, 2).
To address this variability, we performed a prespecified systematic review using two complementary lenses: (i) association measures (OR/RR) and (ii) prognostic accuracy (ROC/HSROC). This approach allowed us to assess both the direction of risk and the practical discriminatory value of NLR across clinically relevant early time windows. Consistent with the evolving inflammatory response, NLR measured at ~24 h generally showed improved discrimination compared with admission. For day-1 reassessment, many cohorts support a pragmatic working threshold near ~8, best used for serial monitoring rather than as a standalone decision rule. By ~48 h, reported thresholds tend to shift lower (often around ~7, commonly within 6–8), supporting continued serial reassessment. Lower or declining values in clinically stable patients may help justify de-escalation, whereas persistently elevated or rising values should prompt evaluation for evolving organ dysfunction or complications.
Similarly, emergency-department cohorts suggest that an admission NLR of approximately 9–10 can aid early identification of patients unlikely to develop a severe course and may outperform single routine laboratory measures (e.g., CRP, creatinine, BUN) in the first hours—supporting a rule-out–oriented role rather than definitive rule-in (28, 96). In multivariable models incorporating routine hemogram parameters, NLR often remains among the strongest contributors to ICU admission and organ failure, supporting its relevance for predicting persistent organ failure rather than only binary severity classification (28, 51).
Etiology may modify performance. In biliary AP, admission NLR tends to show higher sensitivity than specificity, suggesting stronger rule-out than rule-in utility, and limited data in hypertriglyceridemic AP suggest that practical admission thresholds often fall toward the upper end of the ~9–11 range. Across etiologies, confounding by comorbidities, medications, resuscitation intensity, and antibiotic strategies remains important, yet few studies have formally quantified clinical utility (e.g., via decision-curve analysis). Importantly, etiology-specific evidence, particularly for alcohol-induced acute pancreatitis, remains scarce. None of the included studies were specifically designed to evaluate NLR in alcoholic AP, nor did they report sufficiently detailed, etiology-stratified diagnostic/performance metrics to enable a separate quantitative synthesis. At present, only a single dedicated report has addressed NLR/PLR in alcoholic AP (97), which precludes meta-analysis and underscores the need for well-designed prospective studies with standardized etiology-stratified reporting.
For fatal outcomes, pooling the available ROC estimates in our meta-analysis yielded a summary AUC = 0.80 at admission and a weighted mean = 0.79–0.80, which we deem sufficient to use the NLR as an early risk “signal,” with subsequent confirmation by more complex scores and specialized biomarkers. For IPN, the OR-based association meta-analysis was non-robust (imprecise pooled estimate with extreme heterogeneity across only four studies). Therefore, NLR should not be interpreted as a consistent prognostic factor for IPN; its role in infection-related endpoints is best viewed as adjunctive and interpreted within diagnostic accuracy metrics and dynamic clinical assessment. Accordingly, it should complement (not replace) PCT/CRP and imaging.
We emphasize that for early detection of a severe course, cytokine markers, particularly IL-6, demonstrate the highest diagnostic informativeness among single tests (Se = 87% and Sp = 88% at a threshold >50 pg/ml in the first hours), whereas procalcitonin performs best for infected necrosis (dynamic high LR+), and CRP is more useful as a background indicator of systemic inflammatory activity (13, 98). Therefore, after 72 h and thereafter, and particularly in clinically unstable patients, it is rational to rely on PCT-based algorithms, using the NLR as a low-cost indicator of trend. Where available, early IL-6 may outperform NLR for confirming severe disease; however, it is less accessible in routine practice. In this context, NLR can serve as an immediate first-line screen, complemented by PCT/CRP, composite scores, and imaging, consistent with professional society recommendations (1, 2).
Clinical translation of NLR is best framed as serial assessment (Box 1). At admission, a higher NLR can flag patients who warrant closer monitoring, whereas a low NLR, alongside clinical stability, argues against immediate escalation. Repeat testing at ~24–48 h adds context: falling values support de-escalation, while persistently high or rising values should prompt reassessment for organ dysfunction and complications and consideration of additional biomarkers when available.
Box 1
NLR clinical interpretation (0–48 h)
NLR is an adjunct screening signal available immediately from the complete blood count.
Best suited for early triage and serial reassessment (day 0 → day 1 → day 2), not for a single stand-alone decision.
Because thresholds vary across settings, local calibration and integration with clinical scores/labs are required.
NLR tends to be more useful for ruling out an early high-risk course when low (high NPV in many settings), while rule-in performance is only moderate.
Comorbidities, medications, and intercurrent infection can confound NLR; interpret in context.
5 Limitations
The present findings should be interpreted in light of several methodological and clinical constraints. Substantial between-study heterogeneity persists; differences in study design, cohort composition, etiologic spectrum of acute pancreatitis, timing of blood sampling, and analytical platform characteristics inevitably influence the accuracy and reproducibility of the metric. Variability in threshold values reflects not only the statistical methods used to derive them, but also the clinical context of application—event prevalence, initial treatment strategies, criteria for severity and complications, and divergent operational definitions of endpoints. Additional risks of bias include incomplete primary data, selective reporting, lack of prespecified analytical protocols, and the limited number of prospective studies using standardized measurement procedures. Residual confounding inherent to observational research remains a major challenge, encompassing comorbidities, concomitant pharmacotherapy, the intensity of fluid resuscitation, and antibacterial prophylaxis. Finally, most studies do not provide access to individual patient data and rarely evaluate clinical utility (e.g., decision-curve analysis), which constrains interpretability, external validity, and translation of results into real-world care pathways.
6 Future perspectives
Prospective multicenter validation should be prioritized, with uniform endpoint definitions, harmonized protocols for sample collection and processing, and pre-specified clinical thresholds that allow local recalibration. Systematic evaluation of early marker dynamics—within the first hours and days—as triggers for intensified monitoring and treatment is a promising direction, as is integration into multimodal prognostic models that combine clinical features, routine biomarkers, and imaging with modern analytical tools. Traditional diagnostic metrics should be complemented by assessments of net clinical benefit, effects on decision-making, resource requirements, and cost-effectiveness across diverse healthcare systems. Priorities also include open reporting, replication in independent cohorts, adoption of transparent standards for the development and validation of prognostic tools, and implementation studies that test readiness for routine practice while ensuring equitable access to innovative approaches across diverse clinical settings.
7 Conclusions
This systematic review and meta-analysis suggest that the neutrophil-to-lymphocyte ratio measured within the first 48 h of hospitalization may provide clinically useful, low-cost prognostic information in acute pancreatitis when used as an adjunct to established scores and routine assessment (Box 1). Across the included studies, NLR showed moderate-to-good discrimination for severe disease at presentation (pooled AUC ~0.77), with commonly reported thresholds shifting over time (approximately ~9 at admission, ~8 at 24 h, and ~7 at 48 h), reflecting the evolving inflammatory response. However, substantial between-study heterogeneity, variable endpoint definitions, and differences in patient mix and sampling windows limit the generalizability of any single cut-off. Therefore, NLR should not be used as a stand-alone criterion; rather, it may support early screening and serial reassessment within 0–48 h, with mandatory local calibration and integration with validated clinical scores, other laboratory markers, and imaging, where appropriate. Prospective multicenter studies with standardized time windows and prespecified thresholds are needed to determine net clinical benefit and to guide implementation pathways.
Statements
Data availability statement
The original contributions presented in the study are included in the article/Supplementary material, further inquiries can be directed to the corresponding author.
Author contributions
SCho: Conceptualization, Data curation, Formal analysis, Investigation, Methodology, Software, Supervision, Validation, Visualization, Writing – original draft, Writing – review & editing. SChu: Conceptualization, Data curation, Formal analysis, Investigation, Methodology, Software, Validation, Visualization, Writing – original draft, Writing – review & editing.
Funding
The author(s) declared that financial support was not received for this work and/or its publication.
Conflict of interest
The author(s) declared that this work was conducted in the absence of any commercial or financial relationships that could be construed as a potential conflict of interest.
Generative AI statement
The author(s) declared that generative AI was not used in the creation of this manuscript.
Any alternative text (alt text) provided alongside figures in this article has been generated by Frontiers with the support of artificial intelligence and reasonable efforts have been made to ensure accuracy, including review by the authors wherever possible. If you identify any issues, please contact us.
Publisher’s note
All claims expressed in this article are solely those of the authors and do not necessarily represent those of their affiliated organizations, or those of the publisher, the editors and the reviewers. Any product that may be evaluated in this article, or claim that may be made by its manufacturer, is not guaranteed or endorsed by the publisher.
Supplementary material
The Supplementary Material for this article can be found online at: https://www.frontiersin.org/articles/10.3389/fmed.2025.1729339/full#supplementary-material
References
1.
IAP/APA/EPC/IPC/JPS Working Group. International Association of Pancreatology Revised Guidelines on Acute Pancreatitis 2025: Supported and Endorsed by the American Pancreatic Association, European Pancreatic Club, Indian Pancreas Club, and Japan Pancreas Society. Pancreatology. (2025) 25:770–814.
2.
Tenner S Vege SS Sheth SG Sauer B Yang A Conwell DL et al . American College of Gastroenterology guidelines: management of acute pancreatitis. Am J Gastroenterol. (2024) 119:419–37. doi: 10.14309/ajg.0000000000002645
3.
Leppäniemi A Tolonen M Tarasconi A Segovia-Lohse H Gamberini E Kirkpatrick AW et al . 2019 WSES guidelines for the management of severe acute pancreatitis. World J Emerg Surg. (2019) 14:27. doi: 10.1186/s13017-019-0247-0
4.
Trikudanathan G Yazici C Evans Phillips A Forsmark CE . Diagnosis and management of acute pancreatitis. Gastroenterology. (2024) 167:673–88. doi: 10.1053/j.gastro.2024.02.052
5.
Zhu J Wu L Wang Y Fang M Liu Q Zhang X . Predictive value of the Ranson and BISAP scoring systems for the severity and prognosis of acute pancreatitis: a systematic review and meta-analysis. PLoS ONE. (2024) 19:e0302046. doi: 10.1371/journal.pone.0302046
6.
Zengin O Göre B Öztürk O Cengiz AM Güler Kadioglu S Asfuroglu Kalkan E et al . Evaluation of acute pancreatitis severity and prognosis using the aggregate systemic inflammation index (AISI) as a new marker: a comparison with other inflammatory indices. J Clin Med. (2025) 14:3419. doi: 10.3390/jcm14103419
7.
Hu JX Zhao CF Wang SL Tu XY Huang WB Chen JN et al . Acute pancreatitis: a review of diagnosis, severity prediction and prognosis assessment from imaging technology, scoring system and artificial intelligence. World J Gastroenterol. (2023) 29:5268–91. doi: 10.3748/wjg.v29.i37.5268
8.
Zhang H Wang Z Li J Jia Y Li F . Timing, initiation and function: an in-depth exploration of the interaction network among neutrophil extracellular traps related genes in acute pancreatitis. Int Immunopharmacol. (2024) 141:112923. doi: 10.1016/j.intimp.2024.112923
9.
Wang H Kim SJ Lei Y Wang S Wang H Huang H et al . Neutrophil extracellular traps in homeostasis and disease. Signal Transduct Target Ther. (2024) 9:235. doi: 10.1038/s41392-024-01933-x
10.
Wan J Ren Y Yang X Li X Xia L Lu N . The role of neutrophils and neutrophil extracellular traps in acute pancreatitis. Front Cell Dev Biol. (2021) 8:565758. doi: 10.3389/fcell.2020.565758
11.
Metri A Bush N Singh VK . Predicting the severity of acute pancreatitis: current approaches and future directions. Surg Open Sci. (2024) 19:109–17. doi: 10.1016/j.sopen.2024.03.012
12.
Kim K Kim SB . Predictors of severity of acute pancreatitis. Gut Liver. (2023) 17:493–4. doi: 10.5009/gnl230235
13.
Tarján D Szalai E Lipp M Verbói M Kói T Eross B et al . Persistently high procalcitonin and C-reactive protein are good predictors of infection in acute necrotizing pancreatitis: a systematic review and meta-analysis. Int J Mol Sci. (2024) 25:1273. doi: 10.3390/ijms25021273
14.
Kong D Lei Z Wang Z Yu M Li J Chai W et al . A novel HCP (heparin-binding protein–C-reactive protein–procalcitonin) inflammatory composite model can predict severe acute pancreatitis. Sci Rep. (2023) 13:9440. doi: 10.1038/s41598-023-36552-z
15.
Shen Y Li Z Li S Zhou L Chen Y Dong K et al . Federated learning for early severity prediction in acute pancreatitis: a multi-center study. BMC Gastroenterol. (2025) 25:681. doi: 10.1186/s12876-025-04265-4
16.
Stroup DF Berlin JA Morton SC Olkin I Williamson GD Rennie D et al . Meta-analysis of observational studies in epidemiology: a proposal for reporting. JAMA. (2000) 283:2008–12. doi: 10.1001/jama.283.15.2008
17.
McInnes MDF Moher D Thombs BD McGrath TA Bossuyt PM PRISMA-DTA Group et al . Preferred reporting items for a systematic review and meta-analysis of diagnostic test accuracy studies: the PRISMA-DTA statement. JAMA. (2018) 319:388–96. doi: 10.1001/jama.2017.19163
18.
Hayden JA van der Windt DA Cartwright JL Côté P Bombardier C . Assessing bias in studies of prognostic factors. Ann Intern Med. (2013) 158:280–6. doi: 10.7326/0003-4819-158-4-201302190-00009
19.
Whiting PF Rutjes AW Westwood ME Mallett S Deeks JJ Reitsma JB et al . QUADAS-2: a revised tool for the quality assessment of diagnostic accuracy studies. Ann Intern Med. (2011) 155:529–36. doi: 10.7326/0003-4819-155-8-201110180-00009
20.
Agha RA Mathew G Rashid R Kerwan A Al-Jabir A Sohrabi C et al . Transparency in the reporting of artificial intelligence—the TITAN guideline. Premier J Sci. (2025) 10:100082. doi: 10.70389/PJS.100082
21.
Page MJ McKenzie JE Bossuyt PM Boutron I Hoffmann TC Mulrow CD et al . The PRISMA 2020 statement: an updated guideline for reporting systematic reviews. BMJ. (2021) 372:n71. doi: 10.1136/bmj.n71
22.
Vo HH Truong-Thi NN Ho-Thi HB Vo HMC Tran-Thi KT Nguyen MD . The value of neutrophil-to-lymphocyte ratio, platelet-to-lymphocyte ratio, red cell distribution width, and their combination in predicting acute pancreatitis severity. Eur Rev Med Pharmacol Sci. (2023) 27:11464–71.
23.
Lu Z Chen X Ge H Li M Feng B Wang D et al . Neutrophil-lymphocyte ratio in patients with hypertriglyceridemic pancreatitis predicts persistent organ failure. Gastroenterol Res Pract. (2022) 2022:8333794. doi: 10.1155/2022/8333794
24.
Huang L Chen C Yang L Wan R Hu G . Neutrophil-to-lymphocyte ratio can specifically predict the severity of hypertriglyceridemia-induced acute pancreatitis compared with white blood cell. J Clin Lab Anal. (2019) 33:e22839. doi: 10.1002/jcla.22839
25.
Halaseh SA Kostalas M Kopec C Toubasi AA Salem R . Neutrophil-to-lymphocyte ratio as an early predictor of complication and mortality outcomes in individuals with acute pancreatitis at a UK district general hospital: a retrospective analysis. Cureus. (2022) 14:e29782. doi: 10.7759/cureus.29782
26.
Abayli B Gençdal G Degirmencioglu S . Correlation between neutrophil/lymphocyte ratio and Ranson score in acute pancreatitis. J Clin Lab Anal. (2018) 32:e22437. doi: 10.1002/jcla.22437
27.
Kolber W Kuśnierz-Cabala B Maraj M Kielar M Mazur P Maziarz B et al . Neutrophil to lymphocyte ratio at the early phase of acute pancreatitis correlates with serum urokinase-type plasminogen activator receptor and interleukin 6 and predicts organ failure. Folia Med Cracov. (2018) 58:57–74. doi: 10.24425/fmc.2018.125704
28.
Park HS In SG Yoon HJ Lee WJ Woo SH Kim D . Predictive values of neutrophil-lymphocyte ratio as an early indicator for severe acute pancreatitis in the emergency department patients. J Lab Physicians. (2019) 11:259–64. doi: 10.4103/JLP.JLP_82_19
29.
Petrescu GS Georgescu I Petrescu AM Rǎdulescu D Petrescu MO Pǎtraşcu Ş . Balthazar score and neutrophil-lymphocytes ratio in acute pancreatitis. Curr Health Sci J. (2019) 45:316–20. doi: 10.12865/CHSJ.45.03.11
30.
Tahir H Rahman S Habib Z Khan Y Shehzad S . Comparison of the accuracy of modified CT severity index score and neutrophil-to-lymphocyte ratio in assessing the severity of acute pancreatitis. Cureus. (2021) 13:e17020. doi: 10.7759/cureus.17020
31.
Xu MS Xu JL Gao X Mo SJ Xing JY Liu JH et al . Clinical study of neutrophil-to-lymphocyte ratio and platelet-to-lymphocyte ratio in hypertriglyceridemia-induced acute pancreatitis and acute biliary pancreatitis with persistent organ failure. World J Gastrointest Surg. (2024) 16:1647–59. doi: 10.4240/wjgs.v16.i6.1647
32.
Karabuga B Gemcioglu E Konca Karabuga E Baser S Ersoy O . Comparison of the predictive values of CRP, CRP/albumin, RDW, neutrophil/lymphocyte, and platelet/lymphocyte levels in determining the severity of acute pancreatitis in patients with acute pancreatitis according to the BISAP score. Bratisl Lek Listy. (2022) 123:129–35. doi: 10.4149/BLL_2022_020
33.
Wang Y Fuentes HE Attar BM Jaiswal P Demetria M . Evaluation of the prognostic value of neutrophil to lymphocyte ratio in patients with hypertriglyceridemia-induced acute pancreatitis. Pancreatology. (2017) 17:893–7. doi: 10.1016/j.pan.2017.10.001
34.
Cho SK Jung S Lee KJ Kim JW . Neutrophil to lymphocyte ratio and platelet to lymphocyte ratio can predict the severity of gallstone pancreatitis. BMC Gastroenterol. (2018) 18:18. doi: 10.1186/s12876-018-0748-4
35.
Zhou H Mei X He X Lan T Guo S . Severity stratification and prognostic prediction of patients with acute pancreatitis at early phase: a retrospective study. Medicine (Baltimore). (2019) 98:e15275. doi: 10.1097/MD.0000000000015275
36.
Azab B Jaglall N Atallah JP Lamet A Raja-Surya V Farah B et al . Neutrophil-lymphocyte ratio as a predictor of adverse outcomes of acute pancreatitis. Pancreatology. (2011) 11:445–52. doi: 10.1159/000331494
37.
Gezer NS Bengi G Baran A Erkmen PE Topalak ÖS Altay C et al . Comparison of radiological scoring systems, clinical scores, neutrophil-lymphocyte ratio and serum C-reactive protein level for severity and mortality in acute pancreatitis. Rev Assoc Med Bras (1992). (2020) 66:762–70. doi: 10.1590/1806-9282.66.6.762
38.
Yu S Wu D Jin K Yin L Fu Y Liu D et al . Low serum ionized calcium, elevated high-sensitivity C-reactive protein, neutrophil-lymphocyte ratio, and body mass index (BMI) are risk factors for severe acute pancreatitis in patients with hypertriglyceridemia pancreatitis. Med Sci Monit. (2019) 25:6097–103. doi: 10.12659/MSM.915526
39.
Suppiah A Malde D Arab T Hamed M Allgar V Smith AM et al . The prognostic value of the neutrophil-lymphocyte ratio (NLR) in acute pancreatitis: identification of an optimal NLR. J Gastrointest Surg. (2013) 17:675–81. doi: 10.1007/s11605-012-2121-1
40.
Reddy GHV Muduru VSP . Neutrophil-to-lymphocyte and platelet-to-lymphocyte ratios as predictors of severity in pancreatitis. BMC Med Educ. (2025) 25:1004.
41.
O'Connell RM Boland MR O'Driscoll J Salih A Arumugasamy M Walsh TN et al . Red cell distribution width and neutrophil to lymphocyte ratio as predictors of outcomes in acute pancreatitis: a retrospective cohort study. Int J Surg. (2018) 55:124–7. doi: 10.1016/j.ijsu.2018.05.028
42.
Vincent A Shashirekha AS . Predicting severity of acute pancreatitis-evaluation of neutrophil-to-lymphocyte count ratio as emerging biomarker: a retrospective analytical study. Cureus. (2024) 16:e74881. doi: 10.7759/cureus.74881
43.
Jeon TJ Park JY . Clinical significance of the neutrophil-lymphocyte ratio as an early predictive marker for adverse outcomes in patients with acute pancreatitis. World J Gastroenterol. (2017) 23:3883–9. doi: 10.3748/wjg.v23.i21.3883
44.
Ak C Kahraman R Sayar S Kilic ET Adali G Ozdil K . Prediction of prognosis acute pancreatitis with inflammatory markers and patient characteristics compared to the scoring system: real-life data. Sisli Etfal Hastan Tip Bul. (2023) 57:182–8. doi: 10.14744/SEMB.2022.42966
45.
Han C Zeng J Lin R Liu J Qian W Ding Z et al . The utility of neutrophil to lymphocyte ratio and fluid sequestration as an early predictor of severe acute pancreatitis. Sci Rep. (2017) 7:10704. doi: 10.1038/s41598-017-10516-6
46.
Kumbhar G Kurien RT Joseph AJ Simon EG Dutta AK Goel A et al . Neutrophil-to-lymphocyte ratio differentiates infections from sterile inflammation in first week of acute pancreatitis. Dig Dis Sci. (2025) 70:853–61. doi: 10.1007/s10620-024-08812-z
47.
Uludag SS Güreş N Sirolu S Aşkar A Sanli AN Zengin AK et al . Investigating the correlation between severe acute pancreatitis and pancreatic necrosis with some serum parameters. Ulus Travma Acil Cerrahi Derg. (2022) 28:1609–15. doi: 10.14744/tjtes.2021.96782
48.
Jain V Nath P Satpathy SK Panda B Patro S . Comparing prognostic scores and inflammatory markers in predicting the severity and mortality of acute pancreatitis. Cureus. (2023) 15:e39515. doi: 10.7759/cureus.39515
49.
Lu F Zhang Y Yu J Ge Z Gu L . Clinical value of BISAP score combined with CRP and NLR in evaluating the severity of acute pancreatitis. Medicine (Baltimore). (2023) 102:e35934. doi: 10.1097/MD.0000000000035934
50.
Akdur G Bardakçi O Das M Akdur O Beyazit Y . Diagnostic utility of hematological indices in predicting adverse outcomes and severity of acute pancreatitis based on BISAP and modified Glasgow score. Ulus Travma Acil Cerrahi Derg. (2022) 28:268–75.
51.
Junare PR Debnath P Nair S Chandnani S Udgirkar S Thange R et al . Complete hemogram: simple and cost-effective in staging and predicting outcome in acute pancreatitis. Wien Klin Wochenschr. (2021) 133:661–8. doi: 10.1007/s00508-021-01821-2
52.
Li Y Zhao Y Feng L Guo R . Comparison of the prognostic values of inflammation markers in patients with acute pancreatitis: a retrospective cohort study. BMJ Open. (2017) 7:e013206. doi: 10.1136/bmjopen-2016-013206
53.
Dancu GM Popescu A Sirli R Danila M Bende F Tarta C et al . The BISAP score, NLR, CRP, or BUN: which marker best predicts the outcome of acute pancreatitis?Medicine (Baltimore). (2021) 100:e28121. doi: 10.1097/MD.0000000000028121
54.
Sandhyav R Mohapatra N Agrawal N Patidar Y Arora A Chattopadhyay TK . Diffusion weighted MRI and neutrophil lymphocyte ratio non-invasively predict infection in pancreatic necrosis: a pilot study. ANZ J Surg. (2025) 95:363–9. doi: 10.1111/ans.19301
55.
Pian G Li H Piao Y . Clinical significance of inflammation markers in predicting the severity of acute pancreatitis. Pancreas. (2021) 50:201–5. doi: 10.1097/MPA.0000000000001749
56.
Liu GH Chen J Li LQ Huan XS Lei P . Development and validation of a nomogram for early assessment the severity of acute pancreatitis. Scand J Gastroenterol. (2022) 57:990–5. doi: 10.1080/00365521.2022.2050293
57.
Mihoc T Tarta C Duta C Lupusoru R Dancu G Oprescu-Macovei MA et al . Monitoring approach of fatality risk factors for patients with severe acute pancreatitis admitted to the intensive care unit. A retrospective, monocentric study. Diagnostics (Basel). (2021) 11:2013. doi: 10.3390/diagnostics11112013
58.
Xinyu X Jiang Z Qing A Lihua L Xiehong L Lin Z . Clinical significance of PCT, CRP, IL-6, NLR, and TyG index in early diagnosis and severity assessment of acute pancreatitis: a retrospective analysis. Sci Rep. (2025) 15:2924. doi: 10.1038/s41598-025-86664-x
59.
Ünal Y Barlas AM . Role of increased immature granulocyte percentage in the early prediction of acute necrotizing pancreatitis. Ulus Travma Acil Cerrahi Derg. (2019) 25:177–82. doi: 10.14744/tjtes.2019.70679
60.
Liu X Guan G Cui X Liu Y Liu Y Luo F . Systemic immune-inflammation index (SII) can be an early indicator for predicting the severity of acute pancreatitis: a retrospective study. Int J Gen Med. (2021) 14:9483–9. doi: 10.2147/IJGM.S343110
61.
Mubder M Dhindsa B Nguyen D Saghir S Cross C Makar R et al . Utility of inflammatory markers to predict adverse outcome in acute pancreatitis: a retrospective study in a single academic center. Saudi J Gastroenterol. (2020) 26:216–21. doi: 10.4103/sjg.SJG_49_20
62.
Lin XY Lai YX Lin Y Lin ZH . Low-grade inflammation for predicting severe acute pancreatitis in patients with hypertriglyceridemic acute pancreatitis. J Dig Dis. (2023) 24:562–9. doi: 10.1111/1751-2980.13231
63.
Khan NA Haider Kazmi SJ Asghar MS Singh M Iqbal S Jawed R et al . Hematological indices predicting the severity of acute pancreatitis presenting to the emergency department: a retrospective analysis. Cureus. (2021) 13:e16752. doi: 10.7759/cureus.16752
64.
Li X Zhang Y Wang W Meng Y Chen H Chu G et al . An inflammation-based model for identifying severe acute pancreatitis: a single-center retrospective study. BMC Gastroenterol. (2024) 24:63. doi: 10.1186/s12876-024-03148-4
65.
Bengi G Çelik I Dolu S Önem S Soytürk M Rendeci S et al . Neutrophil-lymphocyte ratio and LDH/albumin ratio as biomarkers for severity and mortality in acute pancreatitis. Turk J Gastroenterol. (2025) 36:497–507. doi: 10.5152/tjg.2025.24828
66.
Piñerúa-Gonsálvez JF Ruiz-Rebollo ML Fernández-Salazar L . Assessing the predictive value of the C-reactive protein and neutrophil-to-lymphocyte ratio combined score for organ failure in acute pancreatitis. Arq Gastroenterol. (2025) 62:e24119. doi: 10.1590/s0004-2803.24612024-119
67.
Araiza-Rodríguez JF Bautista-Becerril B Núñez-Venzor A Falfán-Valencia R Zubillaga-Mares A et al . Systemic inflammation indices as early predictors of severity in acute pancreatitis. J Clin Med. (2025) 14:5465. doi: 10.3390/jcm14155465
68.
Qi R Wang HB Luo RY Li J Su L . Development of a clinical prediction model for intra-abdominal infection in severe acute pancreatitis using logistic regression and nomogram. Front Med (Lausanne). (2025) 12:1636733. doi: 10.3389/fmed.2025.1636733
69.
Saribas MS Erinmez MA Ozen A Akca I . Prediction of in-hospital mortality in patients with acute pancreatitis: role of inflammation-related biomarkers. J Emerg Med. (2025) 77:159–68. doi: 10.1016/j.jemermed.2025.05.018
70.
Kurtipek AC Yilmaz Y Canli T Hamamci M . A new simple scoring system for early prediction of severe acute pancreatitis. Dig Dis Sci. (2025) 70:2186–93. doi: 10.1007/s10620-025-09010-1
71.
Huynh TM Tran A Tran DT Thi Dao YH Vo TD . A novel CART-driven decision tree combining NLR and CRP for early prognostication of severe acute pancreatitis: a prospective Vietnamese cohort study. Clin Transl Gastroenterol. (2025) 16:0919. doi: 10.14309/ctg.0000000000000919
72.
Bhanou NMS Balachandran G Jain NB . Neutrophil to lymphocyte ratio (NLR) in acute pancreatitis as an early predictor of severity and outcome. Int Surg J. (2018) 5:3545–8. doi: 10.18203/2349-2902.isj20184619
73.
Memmedova J Gökden Y Adaş M . Diagnostic and prognostic value of neutrophil lymphocyte ratio in patients with acute pancreatitis. Eur Arch Med Res. (2019) 35:157–61. doi: 10.4274/eamr.galenos.2019.29392
74.
Fonseca T Miranda J Devezas V Aral M Costa RM Maia JC et al . Closer look: assessment of acute pancreatitis prognosis using neutrophil-lymphocyte ratio. Surg Gastroenterol Oncol. (2021) 26:118–23. doi: 10.21614/sgo-26-2-296
75.
Roy NC Azam MG Hossain RMM Sajjad SM Datta IK Ahmed S et al . Role of neutrophil to lymphocyte ratio (NLR) and C-reactive protein to albumin ratio (CAR) as early predictors of severity in acute pancreatitis. Bangladesh Crit Care J. (2023) 11:83–9. doi: 10.3329/bccj.v11i2.69186
76.
Abu-Elfatth AM El Sabour Mohamed Mekky MA Othman AM Mohammed SM El-Mokhtar MA . Neutrophil-lymphocyte ratio and platelet to lymphocyte ratio in prediction of severe acute pancreatitis: a prospective single center study. Egypt J Hosp Med. (2022) 89:5452–7. doi: 10.21608/ejhm.2022.264525
77.
Shrestha A Pradhananga S Shakya N . Prediction of severity of acute pancreatitis using neutrophil to lymphocyte ratio. Int Surg J. (2024) 11:1477–83. doi: 10.18203/2349-2902.isj20242447
78.
Yalçin MS Yalaki S . Novel markers for mortality in patients with acute pancreatitis: NLR and PLR at the 48th hour. J Surg Med. (2019) 3:873–6. doi: 10.28982/josam.658773
79.
Kumar SP Tamma MK . Predicting severity of acute pancreatitis using neutrophil-lymphocyte ratio. IOSR-JDMS. (2023) 22:8–11. doi: 10.9790/0853-2202100811
80.
Mumin A Al Amin A Kabir AKMS Noor RA Rahman U . Role of C-reactive protein (CRP) and neutrophil lymphocyte ratio (NLR) in detecting severity and predicting outcome of acute pancreatitis patients. Dinkum J Med Innov. (2024) 3:1–12. doi: 10.71017/djmi.3.1.d-0236
81.
Pati GK Patnaik SK Mohanty S Uthansingh K Kanungo M Narayan J et al . Role of neutrophil to lymphocyte and platelet to lymphocyte ratio in assessing severity of acute pancreatitis. Afr J Biomed Res. (2025) 28:480–7. doi: 10.53555/AJBR.v28i1S.6135
82.
Orak M Üstündag M Güllü MN Özhasenekler A Durgun HM Güloglu C . The comparison of APACHE II scores with neutrophil lymphocyte ratio and red cell distribution width for the prediction of prognosis of patients with acute pancreatitis. J Gastroenterol Dig Dis. (2016) 1:6–9.
83.
Ergenc H Ergenc Z Eminler AT Cinemre H . Diagnostic and prognostic value of neutrophil/lymphocyte ratio and platelet/lymphocyte ratios on acute pancreatitis patients. Turk J Health Sci. (2022) 7:80–5. doi: 10.26453/otjhs.1022717
84.
Silva-Vaz P Abrantes AM Morgado-Nunes S Castelo-Branco M Gouveia A Botelho MF et al . Evaluation of prognostic factors of severity in acute biliary pancreatitis. Int J Mol Sci. (2020) 21:4300. doi: 10.3390/ijms21124300
85.
Pan L Xiao J Fan L . The value of NLR, PLR, PCT, and D-D levels in assessing the severity of hyperlipidemic acute pancreatitis. Front Med (Lausanne). (2025) 12:1561255. doi: 10.3389/fmed.2025.1561255
86.
Mihoc T Pirvu C Dobrescu A Brebu D Macovei AMO Pantea S et al . Comparative analysis of laboratory markers, severity scores, and outcomes in 179 patients with severe acute pancreatitis. Biomedicines. (2025) 13:797. doi: 10.3390/biomedicines13040797
87.
Aktaş AA Taşar P Sigirli D Kiliçturgay SA . Comparison of the effectiveness of different scoring systems and biochemical markers in determining the severity and complications of acute pancreatitis. Turk J Med Sci. (2025) 55:451–60. doi: 10.55730/1300-0144.5989
88.
Zhu QY Li RM Zhu YP Hao DL Liu Y Yu J et al . Early predictors of infected pancreatic necrosis in severe acute pancreatitis: implications of neutrophil to lymphocyte ratio, blood procalcitonin concentration, and modified CT severity index. Dig Dis. (2023) 41:677–84. doi: 10.1159/000529366
89.
Shabbir U Bashir Z Abid A Amanzai A Tariq MT Rajput IA et al . Neutrophil lymphocyte ratio for assessing severity of acute pancreatitis [version 1; peer review: awaiting peer review]. F1000Research. (2025) 14:1031. doi: 10.12688/f1000research.170009.1
90.
Jin X Ding Z Li T Xiong J Tian G Liu J . Comparison of MPL-ANN and PLS-DA models for predicting the severity of patients with acute pancreatitis: an exploratory study. Am J Emerg Med. (2021) 44:85–91. doi: 10.1016/j.ajem.2021.01.044
91.
Sarihan A Durak S Rahman F Koran S Can Ç Bülbül E . Comparison of the prognostic value of hematologic inflammatory markers in patients with acute pancreatitis. Europeanatolia Health Sci J. (2024) 2:53–9. doi: 10.5281/zenodo.13998726
92.
Cazacu SM Parscoveanu M Cartu D Moraru E Rogoveanu I Ungureanu BS et al . NLR48 is better than CRP, and mCTSI, and similar to BISAP and SOFA scores for mortality prediction in acute pancreatitis: a comparison of 6 scores. J Inflamm Res. (2023) 16:4793–804. doi: 10.2147/JIR.S432408
93.
Zouali M . Swaying the advantage: multifaceted functions of inflammasomes in adaptive immunity. FEBS J. (2025) 292:1817–32. doi: 10.1111/febs.17204
94.
Ishqi HM Ali M Dawra R . Recent advances in the role of neutrophils and neutrophil extracellular traps in acute pancreatitis. Clin Exp Med. (2023) 23:4107–22. doi: 10.1007/s10238-023-01180-4
95.
Chen Q Dai XW Dong QQ Zhang XX Ma WT . Association of NLR with all-cause and cardiovascular mortality in adults with coronary heart disease: 1999–2018 NHANES data analysis. Medicine (Baltimore). (2024) 103:e40844. doi: 10.1097/MD.0000000000040844
96.
Zhang Y Wu W Dong L Yang C Fan P Wu H . Neutrophil to lymphocyte ratio predicts persistent organ failure and in-hospital mortality in an Asian Chinese population of acute pancreatitis. Medicine (Baltimore). (2016) 95:e4746. doi: 10.1097/MD.0000000000004746
97.
Jayalal JA Manovah JA Michael L Kumar ASJ Jayanand D . Neutrophil-lymphocyte ratio (Nlr) and platelet-lymphocyte ratio (Plr) as indicators of severity in acute pancreatitis of alcoholic etiology. Eur J Cardiovasc Med. (2025) 15:548–53. doi: 10.5083/ejcm/25-02-77
98.
Wiese ML Urban S von Rheinbaben S Frost F Sendler M Weiss FU et al . Identification of early predictors for infected necrosis in acute pancreatitis. BMC Gastroenterol. (2022) 22:405. doi: 10.1186/s12876-022-02490-9
Summary
Keywords
acute pancreatitis, biomarkers, neutrophil-to-lymphocyte ratio, organ failure, severity
Citation
Chooklin S and Chuklin S (2026) Neutrophil-to-lymphocyte ratio for primary risk stratification in acute pancreatitis: a systematic review and meta-analysis. Front. Med. 12:1729339. doi: 10.3389/fmed.2025.1729339
Received
21 October 2025
Revised
19 December 2025
Accepted
23 December 2025
Published
13 January 2026
Volume
12 - 2025
Edited by
Wandong Hong, First Affiliated Hospital of Wenzhou Medical University, China
Reviewed by
Bhowmick Mithu, Apollo Hospitals, Guwahati, India
Budi Utomo, Airlangga University, Indonesia
Updates
Copyright
© 2026 Chooklin and Chuklin.
This is an open-access article distributed under the terms of the Creative Commons Attribution License (CC BY). The use, distribution or reproduction in other forums is permitted, provided the original author(s) and the copyright owner(s) are credited and that the original publication in this journal is cited, in accordance with accepted academic practice. No use, distribution or reproduction is permitted which does not comply with these terms.
*Correspondence: Serge Chooklin, chooklin_serge@hotmail.com
†These authors have contributed equally to this work and share first authorship
Disclaimer
All claims expressed in this article are solely those of the authors and do not necessarily represent those of their affiliated organizations, or those of the publisher, the editors and the reviewers. Any product that may be evaluated in this article or claim that may be made by its manufacturer is not guaranteed or endorsed by the publisher.