Abstract
Introduction:
Pancreatic ductal adenocarcinoma (PDAC) remains one of the deadliest malignancies, primarily due to late diagnosis and poor therapeutic response. Advances in artificial intelligence (AI), particularly in medical imaging and multi-modal data integration, have created new opportunities for improving early detection and personalized prognostication.
Methods:
This systematic review was conducted according to the Preferred Reporting Items for Systematic Reviews and Meta-Analyses (PRISMA) 2020 statement. The protocol was prospectively registered with the Open Science Framework, covering studies published between 2015 and 2025.
Results:
Distinct from prior surveys that focus narrowly on specific algorithms or data types, this work introduces a generational taxonomy of AI approaches—ranging from classical radiomics-based machine learning to deep learning and contemporary transformer-based models—and maps their application to core clinical tasks such as detection, segmentation, classification, and outcome prediction. A key contribution is the integration of diverse datasets across imaging, pathology, and molecular sources; we further assess trends in availability, usage, and sample scale.
Discussion:
We critically evaluate limitations in generalizability, external validation, model calibration, and translational readiness, and outline recommendations for multi-center validation, standardized reporting, domain adaptation, and clinician-centered interpretability.
Systematic review registration:
1 Introduction
Cancer remains one of the world's most formidable public-health challenges. The Global Cancer Observatory reported almost 20 million new diagnoses and 9.7 million deaths in 2022 (Figure 1), translating to an economic burden that exceeds 1% of global gross domestic product each year (1). Recent market reports reflect the growing clinical interest and research activity in pancreatic cancer. Precedence Research (2024) forecasts strong expansion of the pancreatic cancer market through 2034 driven by rising investment in diagnostics (2), therapeutics and clinical trials. This commercial growth both supports and mirrors the increased funding for AI based detection and prognostic technologies that are the main focus of this review.
Figure 1

Projected global pancreatic cancer market growth, 2023–2034 (Precedence Research, 2024). The market is expected to rise from approximately United States Dollar (USD) 2.86 billion in 2024 to USD 10.25 billion by 2034 Compound Annual Growth Rate (CAGR) ≈ 13.62%, reflecting expanding investment in diagnostics, therapeutics and clinical research that may accelerate translation of Artificial Intelligence-enabled detection and prognosis systems.
Despite incremental gains in screening and therapy, the absolute number of cancer-related fatalities continues to rise with population aging and growth (3). Pancreatic cancer (PC), of which approximately 90% are pancreatic ductal adenocarcinomas (PDAC), deserves special attention because its mortality far exceeds its incidence ranking. Globally it is the twelfth most commonly diagnosed malignancy, yet it already ranks seventh among cancer deaths (3, 4). Five-year relative survival in high-income countries has only recently crept into double digits—roughly 11%–13%—making PDAC the deadliest of the major solid tumors (5). Contributing factors include a stealthy symptom profile, an anatomically concealed primary site and a dense desmoplastic micro-environment that confers intrinsic resistance to cytotoxic therapies (3). Without intervention, PDAC is projected to become the second leading cause of cancer mortality in North America and parts of Europe by 2030 (4).
The global burden of pancreatic cancer has continued to rise over the past three decades. According to GLOBOCAN 2022, there were 510,992 new cases worldwide (1). Estimates from the Global Burden of Disease (GBD) 2019–2021 update indicate incident cases increased from about 489,862 in 2019 to 508,533 in 2021, while deaths rose from 486,869 to 505,752 over the same period (3). The age-standardized incidence rate (ASIR) decreased slightly from 6.04 to 5.96 per 100,000, whereas the age-standardized death rate (ASDR) declined from 6.03 to 5.95 per 100,000 (3). These aggregate figures mask striking geographic disparities. High-income regions such as North America, Western Europe and high-income Asia–Pacific have ASIRs approaching 10 per 100,000, whereas low-SDI countries have rates as low as 1.6 per 100,000 (3). Case fatality mirrors incidence because PDAC is frequently lethal once symptomatic. The incidence-to-mortality ratio was only ≈1.28 in 2024, and more than 85% of patients are diagnosed at an unresectable or metastatic stage (3).
Table 1 summarizes recent estimates from high-incidence regions. In the United States, the National Cancer Institute projects 67,440 new cases and 51,980 deaths for 2025. Although pancreatic cancer will account for only 3.3% of new malignancies, it will cause 8.4% of all cancer deaths (5). The United States has seen incidence climb by about 0.7% per year since 2001, and PDAC is forecast to become the second leading cause of cancer death by 2030 (4). European countries such as Hungary, the Czech Republic and Finland report age-standardized mortality rates exceeding 8 per 100,000 (4). In Asia, China already accounts for over 25% of worldwide PDAC deaths, and Japan has experienced one of the steepest rises in incidence among high-income countries (3). The median age at diagnosis is approximately 70 years, and more than 80% of patients present with unresectable or metastatic disease (3).
Table 1
| Region | Epidemiological statistics | Notable findings |
|---|---|---|
| Global (2021–2022) | 510,992 new cases in 2022; 508,533 cases and 505,752 deaths in 2021; ASIR decreased from 6.04 to 5.96 per 100,000 (1, 3) | Slight decline in age-standardized rates but absolute numbers rising; incidence-to-mortality ratio ≈1.28. |
| United States (2025) | 67,440 new cases and 51,980 deaths projected; pancreatic cancer accounts for 3.3% of new cancers but 8.4% of cancer deaths (5) | Incidence rising at ≈0.7% annually; PDAC projected to be the second leading cause of cancer death by 2030 (4). |
| Europe (2024) | Hungary, Czechia and Finland have age-standardized mortality >8 per 100,000 (4) | Mortality rates in some European nations are among the highest globally. |
| Asia (2024) | China accounts for >25% of PDAC deaths; Japan reports one of the steepest rises in incidence among high-income countries (3) | Demographic shifts and rapid population aging drive a large share of the global burden. |
Recent regional estimates for pancreatic cancer incidence and mortality.
Socio-economic inequalities magnify these differences. A recent analysis using GBD 2021 data showed that countries with high SDI had ASIRs around 10 per 100,000 and ASDRs near 9.4 per 100,000, compared with rates around 1.6–1.7 per 100,000 in low-SDI countries (3). The number of disability-adjusted life-years (DALYs) attributable to pancreatic cancer rose from 10.9 million in 2019 to 11.3 million in 2021, highlighting the growing societal and economic toll (3). Projection models estimate that incident cases and deaths will both exceed 875,000 by 2044 (3).
Pancreatic carcinogenesis is multifactorial, with both modifiable and non-modifiable determinants. Modifiable lifestyle factors include tobacco smoking, obesity, diabetes, diet and alcohol consumption. Smoking remains the strongest environmental risk factor: pooled analyses show that current smokers have nearly a two-fold increase in risk compared with never smokers, and heavy smokers (>25 cigarettes day−1) can experience a 2.7-fold elevation (6). Risk declines after cessation but may not return to baseline until 15–20 years later (6). A meta-analysis reported that current smokers have a 75% increased risk of pancreatic cancer relative to never smokers and that elevated risk persists for at least a decade after quitting (6). Second-hand smoke exposure appears to play a minor role (6).
Obesity and metabolic dysfunction are increasingly recognized contributors. A pooled analysis of cohort studies found that obesity approximately doubles the risk of pancreatic cancer in both men and women, and each 5 kg m−2 increase in body-mass index raises risk by about 12% (6). Adipose tissue produces pro-inflammatory cytokines and increases insulin resistance, creating a carcinogenic milieu. Type 2 diabetes mellitus (T2DM) is both a risk factor and a consequence of pancreatic cancer: long-standing T2DM increases PDAC risk by 1.5–2.0-fold, whereas new-onset diabetes confers a 5–8-fold increased risk within one to three years (6). Indeed, a large proportion of patients with pancreatic cancer have diabetes or impaired glucose tolerance at diagnosis (6). Other dietary and lifestyle factors—such as heavy alcohol consumption, diets rich in red and processed meats, low intake of fruits and vegetables, and chronic pancreatitis—have also been implicated, although effect sizes are generally smaller.
Non-modifiable factors include age, sex, ethnicity and genetic predisposition. Incidence increases dramatically with age and peaks between 70 and 74 years (3). Males tend to have higher age-standardized incidence and mortality rates than females across all age groups (3). Familial pancreatic cancer accounts for 5–10% of cases; germline mutations in BRCA1/2, CDKN2A, PALB2, STK11/LKB1, TP53 and mismatch-repair genes confer markedly elevated lifetime risks. Hereditary pancreatitis (PRSS1 mutations), Peutz–Jeghers syndrome and familial atypical multiple mole melanoma syndrome are notable syndromes requiring surveillance. Pancreatic cancer risk also varies by ethnicity; for example, African-American populations in the United States experience incidence and mortality rates about 30% higher than those of Caucasian populations, likely reflecting a combination of genetic, metabolic and socio-economic factors (3).
Early detection remains the cornerstone for improving pancreatic-cancer outcomes. However, current screening modalities lack sensitivity for precursor lesions, and the overall rarity of PDAC precludes population-wide screening. Standard imaging techniques such as abdominal ultrasound and computed tomography have limited ability to detect small pancreatic tumors. Pre-diagnostic CT(Computed Tomography) scans often fail to reveal abnormalities in more than half of patients, and subtle signs may precede the clinical diagnosis by 3–36 months (7). Consequently, only about 13.6% of PDAC cases are diagnosed while still localized, and over 85% present with locally advanced or metastatic disease (3). When patients are diagnosed at an early stage and can undergo complete resection followed by multi-modal therapy, median overall survival can exceed 60 months (7).
Given the low prevalence of PDAC in the general population, surveillance strategies are currently recommended only for high-risk individuals—those with strong family histories or pathogenic germline mutations. Ongoing prospective cohorts (for example, the CAPS and Dutch familial pancreatic cancer studies) monitor high-risk participants with annual magnetic resonance imaging (MRI) and endoscopic ultrasound (EUS). A recent update involving approximately 1,700 participants with familial or genetic risk factors reported that surveillance detected tumors at an earlier stage: 38.5% of screen-detected cancers were stage I compared with 10.3% in the general population; 5-year survival reached 50% among the surveillance cohort vs. 9% for non-screened patients (8). The study underscores the potential of targeted screening to extend survival but also highlights logistical challenges: surveillance requires specialized centers with multidisciplinary expertise, and false-positive results can lead to unnecessary interventions (8).
The advent of artificial intelligence and machine-learning techniques offers hope for earlier detection and more accurate risk stratification (9). Radiomics extracts high-dimensional quantitative features from imaging data, capturing subtle textural and morphological patterns that are imperceptible to the human eye. Deep-learning architectures—particularly convolutional neural networks (CNNs) and U-Net–based segmentation models—have demonstrated promising performance in identifying pancreatic lesions and classifying intraductal papillary mucinous neoplasms (IPMNs). A recent systematic review of AI-based IPMN imaging reported classification accuracies ranging from 60% to 99.6%, although heterogeneity in study populations, imaging protocols and analytic pipelines limits direct comparison (7, 10). Most studies relied on CT data despite guidelines favoring MRI, and many used small, single-center cohorts without external validation, leading to high risk of bias (7). Standardized frameworks, large multi-institutional datasets and rigorous external validation are urgently needed.
AI-augmented imaging may also facilitate detection of subtle pre-diagnostic changes. For example, radiomics and deep-learning models can segment the pancreas automatically and identify textural or shape alterations months to years before clinical presentation. In a recent review of AI-augmented imaging, radiomic signatures from routine CT were able to identify early changes that preceded diagnosis by 3–36 months (7). Such models, once validated and integrated into clinical workflows, could trigger further evaluation or enrolment into high-risk surveillance programmes. Nevertheless, adoption of AI in clinical practice raises issues of data privacy, algorithmic fairness, interpretability and regulatory oversight (7, 10).
Table 2 summarizes seven recent AI-focused reviews on pancreatic cancer. While these reviews document progress in CNNs, transformers, and radiomics, they consistently reveal gaps in comprehensive attention mechanism surveys, unified dataset visualizations and external validation strategies—limitations that our paper addresses.
Table 2
| References | Journal/Title | Scope | Advantages | Limitations |
|---|---|---|---|---|
| Podĭnă et al. (11) | Artificial Intelligence in Pancreatic Imaging: A Systematic Review | Systematic review of AI in pancreatic imaging (CT/MRI/EUS) | PRISMA-style search; clear overview of CNN/radiomics applications and clinical use cases | Imaging-only scope; limited attention/transformer mapping; no comprehensive dataset landscape/visualizations |
| Yao et al. (12) | Deep learning and radiomics approaches for pancreatic cancer diagnosis from medical imaging | Narrative review focused on CT/MRI CAD with DL & radiomics | Summarizes CNNs; mentions transformers; provides workflow/metric diagrams | Imaging-only; brief attention/transformer coverage; lacks broad dataset comparisons/visualizations |
| Mishra et al. (13) | ML Models for Pancreatic Cancer Risk Prediction Using EHR—Systematic Review and Assessment | Systematic review of EHR-based risk models | Methodological appraisal; figures on model types and validation | EHR-only; models mostly logistic regression; no attention/transformer landscape; no dataset visualizations |
| Qadir et al. (7) | AI in IPMN Imaging: A Systematic Review | Systematic review on IPMN (cyst) imaging | Breakdown by modality and stage of translation; PRISMA and study distribution figures | Narrow to IPMN & imaging; small single-center studies; few prospective evaluations; minimal EUS; limited attention coverage; limited dataset visualizations |
| Zhang et al. (14) | Effectiveness of Radiomics-Based ML for PDAC vs. Mass-Forming Pancreatitis: Systematic Review & Meta-analysis | Diagnostic performance meta-analysis (primarily radiomics) | Pooled sensitivity/ specificity; subgroup analyses | Single task focus; moderate methodological quality;minimal attention/transformer coverage; no cross-modality dataset landscape/visualizations |
| References | Journal/Title | Scope | Advantages | Limitations (gaps our paper covers) |
| Antony et al. (10) | AI-Augmented Imaging for Early PDAC Detection | Narrative review of CT-centric AI for early PDAC | Highlights pre-diagnostic detection and segmentation; states barriers clearly | CT-focused; lacks comprehensive attention/transformer survey; minimal coverage of non-imaging modalities, or dataset visualizations |
| Yu et al. (84) | Combining Multimodal Medical Imaging and AI for Early Diagnosis of Pancreatic Cancer | Perspective/review advocating for multimodal imaging fusion | Articulates need for multimodal fusion; summarizes imaging performance and interpretability issues | Opinion piece; acknowledges current research is single-modality; does not catalog attention/transformers; no broad dataset visualizations |
Summary of recent AI-focused reviews on pancreatic cancer (2023–2025).
While recent reviews organize AI studies by imaging modality [Podina et al.(11), Yao et al.(12)], clinical task (detection, segmentation, classification), data type [EHR-only: Mishra et al.(13)], or clinical subtype [IPMN: qadir et al.(7); PDAC vs. pancreatitis: Zhang et al.(14)]—approaches that effectively catalog method–modality pairings for specific protocols—our generational taxonomy provides a distinct meta-level view by organizing studies into three methodological waves: conventional machine-learning/radiomics pipelines (Generation 1, 2015–2020), deep-learning CNNs (Generation 2, 2017–2023), and attention/transformer-based multi-modal fusion (Generation 3, 2020–present). This temporal framework enables us to quantify performance evolution [AUC 0.84–0.98 in Generation 1 → 0.92–0.99 in Generation 2 → 0.996 in Generation 3 (15); segmentation Dice 0.19–0.70 → 0.57–0.87], synthesize findings across all modalities (CT/MRI, histopathology, genomics, biomarkers) within a single coherent framework, reveal validation trends (external validation 50% → 57% → 67% across generations; multi-center validation 0% → 29% → 22%), and identify the research frontier (attention-augmented, domain-adaptive architectures) by extrapolating from the architectural trajectory—advantages not accessible through modality-specific or task-specific organization. As detailed in Table 2, this generational perspective complements existing reviews by revealing temporal, cross-modality, and performance-evolution patterns that become visible only when viewing AI methods as successive generations building on architectural innovations.
Figure 2 illustrates global search interest in “Artificial Intelligence” from 2015 to 2025, highlighting sharp public attention peaks that coincide with major AI advances (16). Such public and media surges often track research investment and adoption cycles that accelerate translation of AI techniques into healthcare applications.
Figure 2

Global Google Trends interest for “Artificial Intelligence,” 2015–2025 (Google Trends, 2025).
This review makes several unique contributions to the growing literature on AI-enabled pancreatic cancer detection and prognosis. First, it conducts a rigorous and reproducible search across PubMed and Google Scholar covering 2015–2025 to capture more than sixty peer-reviewed studies that apply machine learning, deep learning or attention-based methods to imaging, histopathology and molecular data. The search strategy reduces the risk of missed early-stage or conference works by including theses and preprints in addition to indexed journals.
-
Comprehensive literature scope: Unlike prior reviews that focus exclusively on electronic health record risk models or histopathology, we synthesize results from multi-modal data sources—radiomics, CT/MRI imaging, endoscopic ultrasound, histopathology, genomics, and proteomics—spanning more than 60 studies published between 2015 and 2025.
-
Structured classification of methods and tasks: We introduce a clear taxonomy that groups AI approaches into three methodological generations—classical machine-learning/radiomic pipelines, deep neural networks and attention- or transformer-enhanced architectures—and map them to clinical tasks (detection, segmentation, classification/subtyping, and prognosis). This framework facilitates cross-comparison of algorithmic advances and reveals trends across modalities.
-
Critical appraisal of methodological quality: Beyond reporting accuracy, AUROC, and Dice scores, we assess whether studies used patient-level splits, external validation cohorts and proper prevalence reporting. Our synthesis highlights that many models are retrospective and single-center with limited robustness, underscoring the need for prospective, multi-center evaluation.
-
Evidence for attention and multi-modal fusion: We show that attention-augmented and transformer-based models achieve consistent improvements in diagnostic accuracy and segmentation performance across tasks. By fusing imaging with biomarkers and clinical variables, multi-modal networks outperform single-modality baselines, demonstrating a path toward earlier, non-invasive detection.
-
Identifying gaps and future research directions: Our review discusses issues rarely addressed in previous surveys—domain shift, algorithmic fairness, data governance and integration into clinical workflows—and proposes a forward-looking research agenda. Recommendations include conducting prospective trials, adopting common reporting standards, investing in domain generalization and federated learning, and co-designing interpretable algorithms with clinicians.
-
Bridging disparate literatures: By contextualizing machine-learning advances alongside epidemiological and risk-factor data and comparing AI methods across modalities, we provide a holistic understanding of how AI can support early pancreatic cancer detection and personalized management. This integrative perspective is largely missing from existing domain-specific reviews.
This set of contributions positions our work as a comprehensive, methodologically rigorous and forward-looking synthesis that highlights both the promise of attention-based, multi-modal AI and the steps required for safe and equitable clinical translation.
This review is organized to walk the reader from clinical motivation to actionable research priorities (Figure 3): Section 1 provides the clinical and epidemiological background (incidence, mortality, key risk factors) and motivates the need for improved surveillance and AI-augmented detection, with focused subparts on risk factors, surveillance, and the role of emerging AI methods; Section 2 details the literature search and selection strategy (databases, search queries, deduplication, title/abstract triage, inclusion/exclusion criteria, full-text review and synthesis protocol) so readers can reproduce the corpus assembly; Section 3 synthesizes the surveyed AI work by methodological generation—Section 3.1 conventional machine-learning and radiomics pipelines, Section 3.2 deep-learning models for detection/segmentation/classification, and Section 3.3 attention- and transformer-based architectures and multi-modal fusion—highlighting representative studies and performance patterns; Section 4 catalogs the data sources that underpin the field (Section 4.1 two-dimensional imaging, Section 4.2 three-dimensional CT/MRI volumes, Section 4.3 radiomics, Section 4.4 clinical/registry data, Section 4.5 genomic/molecular assays, and Section 4.6 biofluid/biomarker panels) and links data regimes to suitable model classes; Section 5 discusses cross-cutting issues, methodological gaps, and interpretation (e.g., patient-level splitting, external validation, and domain shift); Section 6 outlines emerging directions and concrete recommendations (prospective trials, reporting standards, domain generalization, fairness, and federated learning); and Section 7 concludes with priorities for clinical translation.
Figure 3

Schematic overview of the review framework outlining the progression from clinical motivation to emerging Artificial Intelligence research directions in pancreatic cancer detection and prognosis (2015–2025).
2 Literature search and selection strategy
We performed a structured, reproducible literature search and selection procedure to identify primary studies that applied machine-learning (ML), deep-learning (DL), or attention-based methods to pancreatic cancer imaging, pathology or molecular data. The goal was to capture methods that directly address detection, segmentation, classification or prognostication in pancreatic disease using computational approaches. The overall workflow is illustrated in Figure 4.
Figure 4

Preferred Reporting Items for Systematic Reviews and Meta-Analyses (PRISMA)-style flow diagram summarizing the study selection process for this review.
This systematic review was conducted according to the Preferred Reporting Items for Systematic Reviews and Meta-Analyses (PRISMA) 2020 statement. The protocol was prospectively registered with [Open Science Framework (OSF), OID: https://doi.org/10.17605/OSF.IO/2DVHJ ].
2.1 Data sources and search strategy
Searches were run in PubMed and Google Scholar for the period 2015–2025. We selected these two resources because PubMed provides comprehensive coverage of biomedical journal literature and indexing (including MEDLINE), while Google Scholar expands coverage to conference proceedings, theses, preprints, and other scholarly material that may report novel computational methods not yet indexed in PubMed. The combined use reduces the chance of missing relevant methodological or early-stage engineering reports.
The search combined keywords and simple Boolean logic to balance sensitivity and precision. Example search queries used (adapted to each database syntax) were:
  (“Pancreatic Cancer Detection” OR
  “Pancreatic Cancer Detection Using AI” OR
  “Attention on Pancreatic Cancer”)
Searches were restricted to records published between 2015 and 2025 (inclusive). No language restriction was applied at the search stage, but non-English records were screened on title/abstract and translated where necessary for eligibility assessment.
2.2 Deduplication and initial yield
The initial combined search returned approximately 3,000 records. We performed automatic deduplication using reference-management software followed by manual inspection; roughly 1,100 duplicate records were removed, leaving about 1,900 unique records for title and abstract screening.
2.3 Title and abstract screening
Title and abstract screening was adopted as the principal triage step to exclude clearly irrelevant records prior to full-text review. This approach was necessary because the literature volume is large and many records that mention “pancreatic cancer” are peripheral (for example, biomarker discovery, basic biology, or therapeutic studies) rather than studies that develop or evaluate computational detection or image-based models; screening titles and abstracts therefore provides an efficient way to prioritize papers that explicitly describe ML/DL/attention methods or algorithmic evaluation. Equally important, title/abstract screening increases methodological focus: many biomedical papers use AI-related terms in passing, and the abstract is usually the first reliable source for whether a paper reports model architectures, training data, evaluation metrics or genuine algorithmic contributions rather than superficial references. Finally, documenting and applying explicit title/abstract criteria improves practical reproducibility by making the triage decisions auditable and repeatable. Two reviewers independently screened all titles and abstracts against the pre-specified eligibility criteria; disagreements were resolved through discussion and, where necessary, by arbitration from a senior reviewer. Following this procedure the corpus was reduced to 100 studies selected for full-text evaluation.
2.4 Inclusion and exclusion criteria
2.4.1 Inclusion criteria
-
Studies that apply ML, DL, or attention-based methods to pancreatic cancer imaging, histopathology, or molecular data for tasks such as detection, segmentation, classification, subtype discrimination or prognostication.
-
Original research articles reporting methods and evaluation (i.e., not purely review articles or opinion pieces).
-
Studies that report quantitative performance metrics (e.g., accuracy, AUROC, Dice, sensitivity/specificity) on defined datasets.
2.4.2 Exclusion criteria
-
Purely biological or wet-lab studies without computational model development or evaluation.
-
Reviews, editorials, commentaries, perspective pieces and protocols without primary experimental results.
-
Papers that do not provide enough methodological detail to interpret the model (for example, a short abstract only with no methods or results).
2.5 Full-text review and final selection
Full texts of the 64 candidate studies were retrieved and assessed in detail. During this stage we confirmed that the studies (i) presented sufficient methodological detail (data sources, preprocessing, model architecture, training, and validation strategy), (ii) used appropriate evaluation procedures (e.g., train/test splits, cross-validation, patient-level separation where applicable), and (iii) reported metrics relevant to the tasks claimed. Studies that failed to meet these standards or were duplicative (e.g., extended conference abstract later published as a journal article) were excluded. The final included set for synthesis is described in Section 3 and in Table 3.
Table 3
| Model generation | Single-center internal only | Multi-center studies | External validation | Performance metrics |
|---|---|---|---|---|
| Conventional ML (8 studies) | ||||
| Internal validation only | 3/8 (37.5%) | — | 0/8 | — |
| Single-center + external | 4/8 (50%) | — | 4/8 | AUC 0.84–0.98 |
| Large-scale/Registry | 1/8 (12.5%) | — | — | 99.97% acc. |
| Subtotal: | 3/8 internal | 0/8 (0%) | 4/8 (50%) | |
| Notable studies: | (26) (ext. AUC 0.98); (22) (EHR 29,230 cases, AUC 0.84); | |||
| PancRISK (ext. AUC 0.94); SEER registry (99.97% acc.) | ||||
| Deep learning (7 studies) | ||||
| Internal validation only | 3/7 (43%) | — | 0/7 | Acc. 99.8% |
| Single-center + external | 2/7 (29%) | — | 2/7 | AUC 0.95–0.99 |
| Multi-center + external | 2/7 (29%) | 2/7 (29%) | 2/7 | AUC 0.92 |
| Subtotal: | 3/7 internal | 2/7 (29%) | 4/7 (57%) | |
| Notable studies: | (46) (Taiwan+US multi-center, ext. AUC 0.92); chen2023 (nationwide ext. AUC 0.95); | |||
| viriyasaranon2023 (Korean multi-center, performance drop 94.3% → 82.5%) | ||||
| Attention/transformer (9 studies) | ||||
| Internal validation only | 3/9 (33%) | — | 0/9 | Acc. 92%–94% |
| Single-center + external | 4/9 (44%) | — | 4/9 | Dice 0.80–0.87 |
| Multi-center + external | 2/9 (22%) | 2/9 (22%) | 2/9 | AUC 0.96–0.99 |
| Subtotal: | 3/9 internal | 2/9 (22%) | 6/9 (67%) | |
| Notable studies: | PANDA (9-center study, ext. AUC 0.987 lesion detection, 0.984 across 9 external sites); | |||
| DA-TransUNet (6 datasets validation); (77) (multi-center LNM, AUC 0.83) | ||||
| Overall (24 studies) | ||||
| Single-center, internal only | 9/24 (37.5%) | — | — | — |
| Single-center + external val. | 10/24 (41.7%) | — | 10/24 | — |
| Multi-center studies | — | 4/24 (16.7%) | — | — |
| External validation (total) | — | — | 14/24 (58.3%) | — |
| Summary: | 37.5% internal | 16.7% multi-ctr | 58.3% external | |
Comprehensive methodological quality analysis: validation strategies across model generations.
Key findings from comprehensive analysis:
• 37.5% of studies relied exclusively on single-center, internal-only validation, risking overfitting to local protocols.
•Only 16.7% employed multi-center designs, limiting assessment of cross-institutional generalizability.
• 58.3% reported external validation, with Attention/Transformer models showing highest adoption (67%).
•Multi-center studies documented performance degradation: (60) showed 11.8% accuracy drop (94.3% → 82.5%) from internal Korean cohort to external U.S. validation, confirming domain shift effects.
•PANDA (9-center study) maintained strong performance (AUC 0.984–0.987) through large-scale training (3,208 cases).
•Large-scale studies [(22): 29,230 cases; SEER registry] showed robust performance but lacked geographic diversity.
Bias implications: Single-center designs introduce sampling bias; limited multi-center validation restricts clinical translation.
2.6 Classification and synthesis
Included studies were grouped by method class (radiomics + classical ML, CNN-based, transformer/attention-based, and hybrid) and by task (detection, segmentation, classification/subtyping, and prognosis). We synthesized results narratively and, where sufficient homogeneous data existed, reported ranges of key metrics stratified by task and method. Particular attention was paid to the presence or absence of patient-level splits, external validation, and prevalence reporting, since these factors strongly influence apparent performance.
In summary, the search and selection pipeline combined a sensitive database search, careful deduplication, a two-stage screening (title/abstract triage followed by full-text review), dual independent assessment at key stages, structured data extraction and quality appraisal. The emphasis on title/abstract screening as a triage step is intentional and pragmatic: given the large volume of literature on pancreatic cancer, it enables efficient identification of studies that explicitly present computational methods of interest while minimizing time spent on clearly out-of-scope biomedical reports.
2.7 PRISMA 2020 compliance
Table 4 provides a detailed mapping of manuscript content to PRISMA 2020 checklist items, demonstrating transparent adherence to systematic review reporting standards.
Table 4
| PRISMA item | Checklist requirement | Location in manuscript |
|---|---|---|
| TITLE & ABSTRACT | ||
| 1. Title | Identify as systematic review | Title page: “From Radiomics to Transformers...” |
| 2. Abstract | Structured abstract with PRISMA elements | Abstract: includes background, methods, results, conclusion |
| INTRODUCTION | ||
| 3. Rationale | Context of existing knowledge | Section 1: epidemiology, surveillance gaps, AI opportunities |
| 4. Objectives | Explicit review objectives | Section 1 (Research Contributions): taxonomy, critical appraisal, gaps |
| METHODS | ||
| 5. Eligibility | Inclusion/exclusion criteria | Section 2.3: ML/DL/attention studies; Section 2.4: criteria lists |
| 6. Information sources | Databases, dates searched | Section 2.1: PubMed + Google Scholar, 2015–2025 |
| 7. Search strategy | Full search strings | Section 2.1: Boolean queries provided verbatim |
| 8. Selection process | Screening methods, reviewers | Section 2.2–2.3: dual independent screening, 100 → 64 studies |
| 9. Data collection | Data extraction methods | Section 2.6: grouped by method/task, metrics extracted |
| 10a. Outcomes | Outcomes sought | Section 2.6: AUC, Dice, F1, accuracy, sensitivity, specificity |
| 10b. Variables | Other variables | Tables 4–6: model architectures, datasets, sample sizes |
| 11. Risk of bias | Bias assessment methods | Section 5 (Discussion): patient-level splits, external validation assessed |
| 12. Effect measures | Metrics used | Section 2.6, Tables 4–6: AUC, Dice, accuracy ranges |
| 13a. Synthesis eligibility | Study grouping decisions | Section 2.6: method class (ML/DL/attention) + task |
| 13b. Data preparation | Handling missing data | Section 2.6: narrative synthesis for heterogeneous metrics |
| 13c. Tabulation | Visual display methods | Figure 2 (PRISMA flow), Tables 4–6 (model summaries), Table 7 (aggregation) |
| 13d. Synthesis methods | Synthesis approach | Section 2.6: narrative synthesis; no meta-analysis due to heterogeneity |
| 13e. Heterogeneity | Causes of heterogeneity | Section 5: dataset size, validation strategy, prevalence differences |
| 13f. Sensitivity | Sensitivity analyses | Section 5: stratification by patient-level splits, external validation |
| 14. Reporting bias | Missing results assessment | Section 5: publication bias noted; limited prospective studies |
| 15. Certainty | Evidence certainty methods | Sections 5–6: methodological quality, generalizability limitations discussed |
| 16a. Study selection | Search results + flow | Figure 2: 3,000 → 1,900 → 100 → 64 studies |
| 16b. Exclusions | Excluded studies | Section 2.5: duplicates, insufficient detail, non-computational |
| 17. Characteristics | Study characteristics | Tables 4–6: 24 representative studies with full details |
| 18. Risk of bias | Bias assessments | Section 5: patient-level splits, single-center vs. multi-center |
| 19. Individual results | Study-level results | Tables 4–6: performance metrics per study |
| 20a. Synthesis characteristics | Contributing studies | Section 3.1–3.3: 60+ studies grouped by method generation |
| 20b. Synthesis results | Summary estimates | Table 7: AUC 0.84–0.996, Dice 0.19–0.87, F1 0.92–0.97 |
| 20c. Heterogeneity causes | Heterogeneity investigations | Section 5: dataset heterogeneity, task differences explained |
| 20d. Sensitivity results | Robustness assessments | Section 5: recommendations for patient-level validation |
| 21. Reporting bias | Bias assessments | Sections 5–6: retrospective bias, single-center limitations |
| 22. Certainty | Evidence certainty | Sections 5–6: moderate certainty; external validation needed |
| DISCUSSION | ||
| 23a. Interpretation | Results in context | Section 5: progression from ML to transformers contextualized |
| 23b. Evidence limitations | Study limitations | Section 5: small datasets, slice-level leakage, prevalence issues |
| 23c. Process limitations | Review limitations | Section 2.3: title/abstract screening rationale, no meta-analysis |
| 23d. Implications | Practice/policy/research | Section 6: prospective trials, reporting standards, federated learning |
| OTHER INFORMATION | ||
| 24a. Registration | Protocol registration | Section 2: OSF registration (doi: 10.17605/OSF.IO/2DVHJ) |
| 24b. Protocol access | Protocol availability | Section 2: OSF link provided |
| 24c. Amendments | Protocol deviations | Not applicable; protocol followed as registered |
| 25. Support | Funding sources | Acknowledgments/Funding section (if present) |
| 26. Competing interests | Conflicts of interest | Declarations section (journal requirement) |
| 27. Data availability | Materials availability | Tables 4–6, Section 4: datasets cataloged; code not released |
PRISMA 2020 Checklist Mapping to Manuscript Sections.
3 AI methods in pancreatic cancer detection and prognosis
This section synthesizes more than sixty peer-reviewed studies on artificial-intelligence methods for pancreatic-cancer detection, prognosis and treatment monitoring published between 2015 and 2025. We group the papers into three methodological generations—conventional machine-learning (ML) pipelines, deep-learning (DL) models, and attention- or transformer-enhanced frameworks—while emphasizing representative contributions and situating related work in context (Figure 5).
Figure 5

Distribution of Artificial Intelligence methodologies in reviewed pancreatic cancer studies (2015–2025).
Figure 6 shows the global trend of AI publications by country and region between 2000 and 2025 (17). China's rapid ascent in research output, combined with continued contributions from the United States and the EU, helps explain why deep-learning and transformer approaches have become dominant in biomedical imaging and diagnostics.
Figure 6

Global trend of Artificial Intelligence publications (%) by country/region, 2000–2025 Organization for Economic Co-operation and Development (OECD.AI), OpenAlex/Scopus.
3.1 Conventional machine-learning approaches
Machine learning (ML) represents a family of algorithms that can automatically discover patterns in data and make predictions without being explicitly programmed with fixed rules. Unlike traditional statistical models that rely heavily on handcrafted assumptions, ML systems can flexibly learn complex relationships from structured (e.g., electronic health records, genomics) and unstructured (e.g., imaging, text) data. Commonly used paradigms include supervised learning, where models are trained on labeled datasets (e.g., classification or regression tasks), and unsupervised learning, which focuses on uncovering hidden structures (e.g., clustering, dimensionality reduction). In healthcare, ML offers the ability to integrate diverse data modalities, identify early biomarkers, and support clinical decision-making by providing scalable and adaptive predictive frameworks.
To ground this in formalism, consider supervised learning where the goal is to learn a function from labeled data . A loss functionL(h(xi), yi) quantifies prediction error, guiding optimization via empirical risk minimization:
The optimal hypothesis is
where denotes the hypothesis space (e.g., decision trees, support vector machines). Common losses include mean squared error for regression and hinge loss for margin-based classifiers such as SVMs. Training typically proceeds using optimization techniques such as gradient descent, adapting parameters θ iteratively to reduce Remp.
Early investigations relied on structured data such as transcriptomics, biofluids, registries and hand-crafted radiomic descriptors. Ojha et al. (18) presented Gap-App, a sex-specific web tool that predicts 3-year survival for pancreatic-ductal adenocarcinoma (PDAC) directly from RNA-Seq profiles. Separate Random-Forest models for men and women achieved training accuracies of 90.33% and 90.40%, with independent-test accuracies of 81.25% and 89.47%, consistently outperforming a pooled model. Urine-biomarker studies followed: CatBoost reached 91.89% overall accuracy on the LYVE1–creatinine–REG1B–TFF1 panel and achieved 1.00 recall for the pancreatic-cancer class, eclipsing Random Forest and LightGBM baselines (19). A multi-omics decision system that stacked XGBoost with AdaBoost similarly attained the highest F1 among nine competing classifiers on a large protein–gene dataset (20).
Large registries enabled population-scale modeling. Using 31,000 cleaned cases from SEER, Decision-Tree models predicted tumor stage with 99.97% test accuracy and survivability with 92.1%, although the authors flagged over-fitting risk given perfect training scores for certain ensembles (21). On 29,000,000 electronic health-record rows, an XGBoost model that distilled 18,220 variables to 582 predictors identified 58% of late-stage cancers a median 24 months early at 90% specificity (AUC 0.84) (22). Logistic-activation ANNs trained on NHIS and PLCO surveys (800,114 participants) achieved AUC 0.85 and enabled a three-tier risk stratification that misclassified fewer than 1% of cancers into the lowest-risk group (23). A separate Taiwanese claims analysis built a 4-year risk model for type-2 diabetes patients; Linear Discriminant Analysis delivered AUROC 0.9073 with 84.3% accuracy (24). Complementary approaches fused an MLP feature extractor with an SVM to create the AI-Powered Pancreas Navigator, posting 98.41% accuracy on NHIS data and earmarked for EMR deployment (25).
Radiomics advanced conventional pipelines toward imaging. Daily delta-radiomics of non-contrast CT predicted chemoradiation response with CV-AUC 0.94 and external AUC 0.98 after only 2–4 weeks, using a Bayesian-regularized neural network and three key features (kurtosis–coarseness–NESTD) (26). Radiomics-based ML (volumetric pancreas segmentation → 88 radiomic features, LASSO → 32 selected) with an SVM classifier detected prediagnostic PDAC up to ≈386–398 days before clinical diagnosis (AUC = 0.98; sensitivity = 95.5%, specificity = 90.3%), substantially outperforming radiologists (mean AUC ≈0.66) (27). Pretreatment FDG-PET radiomics confirmed GLZLM-GLNU heterogeneity as an independent one-year survival factor, outperforming clinical staging alone (28). Mucin-promoter methylation fed to SVMs and shallow NNs remained prognostic beyond standard clinicopathologic covariates (29). Hand-crafted features also bolstered niche applications: age-stratified CAD on endoscopic ultrasound improved sensitivity by 4–6 pp in each age band (30), and IANFIS models with Bayesian hyper-parameter search reached 99.95% CT accuracy while simultaneously segmenting pancreas and tumor (31).
Biofluid and liquid-biopsy work flourished in parallel. Logistic regression on urine biomarkers yielded PancRISK with AUC 0.94; when combined with CA19-9 the strategy delivered 96% sensitivity and 96% specificity (32). A six-amino-acid plasma index achieved validation AUCs of 0.86 for all PDAC and 0.81 for stage IIA–IIB tumors (33). Lightweight 1D CNN–LSTM models diagnosed PDAC from urine proteomics with 97% accuracy and AUC 0.98, surpassing MLP and classical ML baselines by over 20 pp (34). Digital PCR detection of KRAS mutations in tissue, circulating DNA or exosomes consistently predicted worse survival (35–39). Circulating-tumor-cell enumeration on NanoVelcro chips provided 75.0% sensitivity and 96.4% specificity for diagnosis and discriminated metastatic disease when counts exceeded three CTCs per 4 mL (40). Pre-diagnostic CA19-9 elevations heralded cancer up to two years prior and correlated with poorer prognosis; CA125 added value in CA19-9-negative cases (41). Exosomal protein–miRNA panels achieved validation sensitivity/specificity of 1.00/0.80 across benign and malignant controls (42), while Lewis-negative subgroups benefited from alternative serum markers CEA and CA125 (AUCs 0.89 and 0.85) (43).
Radiologic context for true early lesions emerged from a 14-center Japanese cohort, which highlighted main-duct dilatation and pancreatic-juice cytology as pivotal for diagnosing stage 0 and I disease, translating into >90% ten-year survival after resection (44). Exploratory therapeutics such as plasma-activated medium induced ROS-mediated apoptosis and cut xenograft volume by two-thirds without harming normal tissues (45).
3.2 Deep learning approaches
Deep learning (DL) is a branch of machine learning that uses deep, multi-layer neural networks to learn hierarchical feature representations directly from raw data (images, volumes, signals, or text). Unlike classical methods that depend on handcrafted features, DL discovers progressively abstract patterns through stacked nonlinear layers, enabling powerful end-to-end pipelines for detection, segmentation, and classification across modalities and patient cohorts.
Formally, a deep network implements a parameterised mapping , where are layer-wise weights and biases. With h[0] = x the input, a typical feedforward layer is
for a nonlinear activation σ (e.g., ReLU, sigmoid). Given training pairs , learning minimizes the empirical risk
where is a task-dependent loss (cross-entropy, Dice loss, etc.). In practice optimisation uses stochastic (mini-batch) gradient methods; for a minibatch ,
with learning rate ηt (possibly scheduled) and optional weight-decay λ. The Universal Approximation Theorem guarantees that sufficiently large networks can approximate a wide class of continuous functions on compact domains, giving a theoretical basis for DL's representational power; however, generalization in practice depends on optimisation, regularization, data diversity and inductive biases rather than approximation alone. This representational strength—combined with transfer learning, data augmentation and modern regularisers—explains the rapid adoption of DL in medical imaging, where networks can be trained (or fine-tuned) to integrate detection, segmentation and classification within robust clinical pipelines.
The shift toward representation learning began with patch-based CNN screening of contrast-enhanced CT. A modified VGG network exceeded radiologist sensitivity (0.983 vs. 0.929) on Taiwanese data and maintained AUC 0.920 on a U.S. external cohort despite domain shift (46). Similar pipelines fine-tuned NASNet via Cat-Swarm optimisation and then classified with Glowworm-tuned Elman NNs, yielding 99.60% average accuracy across six independent runs (47). Hybrid stacks that incorporated denoising, segmentation, and Deep-Belief Networks reached 99.8% accuracy and perfect sensitivity on 1,800 CT images (48). Graph-derived features from Harris corners lifted k-NN F1 to 92.74% after whale-based hyper-parameter optimisation of DenseNet descriptors (49), while stage-specific CNNs (ResNet50) classified four pancreatic-tumor stages with 97.88% accuracy (50).
Transfer learning on other modalities also matured. EfficientNetB0 and ResNet50 each secured 92% accuracy on a 12,000-image histopathology corpus, with ResNet50 climbing to 96% on higher-resolution subsets (51). Graph-causality ideas migrated to imaging: a Causality-Informed Graph Intervention Model suppressed spurious patch correlations, returning mean cross-validation AUC 0.942 and maintaining external accuracies of 86% to 82% across three centers (52). A successor adaptive-metric GNN delivered AUC 0.954 at only 0.44 M parameters and < 7 ms inference per study (53). End-to-end CT workflows paired CNN classifiers with Faster R-CNN detectors or YOLOv3 heads, posting 94.6% accuracy vs. 92.4% for the detection-only baseline (54, 55). Coarse-to-fine cascades that combine duct segmentation with tumor masks pushed AUROC to 0.99 and retained 0.97 sensitivity for lesions < 2 cm after external validation (56). nnU-Net pipelines now detect cystic lesions with 78.8% sensitivity at just 0.48 false positives per case, rivaling radiologists for cysts ≥220 mm3 (57).
Segmentation networks grew in diversity. SMANet exploited feature-fusion and attention blocks to reach mDice 0.769 on five tissue types in whole-slide images (58). MSCA-UNet replaced initial convolutions with multi-scale branches and lifted tumor Dice from 68.0% to 80.1% on MSD data when paired with HU windowing and ROI cropping (59). Annotation-efficient paradigms pre-trained on pseudo-lesions boosted ShuffleNet-V2 external accuracy from 62.0% (10% data) to 82.5% and improved sensitivity by 37.0 pp (60). Image-reconstruction networks (DLIR-H) enhanced resectability assessment AUC from 0.75 to 0.91 while halving inter-reader variance (61). Comparative studies routinely showed MobileNet or InceptionV3 topping ML baselines on Kaggle CT sets with ≥97% accuracy (62, 63). Parameter-efficient MMPU-Net balanced performance (Dice 88.6% on MSD) and speed (4 × faster training) using mean-max pooling and hybrid convolutions (64).
3.3 Attention and transformer-based models
Attention techniques let a model emphasize the most relevant parts of an input by computing data-dependent weights between elements (pixels, patches, tokens). Rather than treating all locations equally, attention reweights features so the network can aggregate global context where needed and focus on small but important structures—a behavior particularly useful in medical imaging for both classification and fine-grained segmentation. The basic architecture is shown in Figure 7.
Figure 7

Basic encoder–decoder structure of the Transformer architecture, consisting of stacked multi-head attention, Feed-Forward Network (FFN) layers, Fully Connected (FC) layers, and positional encodings.
Attention mechanisms compute data-dependent, pairwise interactions between tokens or spatial locations so the model can reweight features by relevance rather than by fixed convolutional or local rules. Conceptually, the model transforms input features X into three components—queries (Q), keys (K), and values (V)—through learned linear projections. The core self-attention operation computes similarity scores between queries and keys, normalizes them via softmax to produce attention weights αij, and then combines the values as a weighted sum:
Multi-head attention runs h parallel attention heads and concatenates their outputs, allowing the model to attend to different representation subspaces simultaneously. Positional encodings are added to preserve spatial or sequential information. Computationally, dense self-attention costs time and memory, which motivates local/windowed, sparse, or linearized attention variants that reduce complexity. In medical imaging, the attention map α can be interpreted as a soft, differentiable importance mask that both improves interpretability and lets the network focus on small, clinically relevant structures while aggregating global context.
Attention mechanisms refine both classification and segmentation by focusing the model on informative regions or features. Kernel Attention Networks (KANs) improved urine-biomarker classification to 94.44% accuracy and F1 0.97, surpassing gradient boosting and XGBoost (65). A Swin Transformer trained on CT achieved 83% test accuracy, modest yet superior to CNN baselines (66). TED-STGN combined graph attention and temporal transformers on sequential imaging, realizing 94.7% accuracy and cutting false positives relative to ViT and Swin benchmarks (67).
Segmentation benefitted markedly. MDAG-Net inserted multi-dimensional gates into U-Net skip paths, improving Dice by 5.3 pp and recall by 12.5 pp, particularly for tiny tumors (68). AMFF-Net paired residual depthwise attention with hybrid transformers to outscore nnUNetv2 on MSD (pancreas Dice 82.12%, tumor Dice 57.00%) (69). Triple-attention MAEU-Net pushed NIH pancreas Dice to 87.16% but at a cost of 325 M parameters (70). SCPMan injected shape-context memory and an active-shape prior, raising NIH Dice to 91.0% and MSD to 92.25%, outperforming both CNN and transformer baselines (71). DA-TransUNet merged positional and channel attention blocks around ViT cores, lifting Synapse Dice from 77.48% to 79.80% while trimming Hausdorff distance by 8.2 mm (72). Lightweight RDAM and hybrid transformer modules allowed Pancreas Dice 80.55% and FAH tumor Dice 55.17% in AMFF-Net with only 25.8 M parameters (69). Anatomical attention guided duct-segmentation FCNs to 55.7% Dice, a meaningful gain for such small tubular structures (73).
Large-scale diagnostic suites now embed attention throughout. The PANDA triple-stage pipeline localized pancreas, detected lesions at 99% specificity and then applied a dual-path memory transformer for subtype diagnosis, achieving PDAC identification AUC 0.987 internally and 0.957 externally across nine centers; PANDA Plus attained 99.9% real-world specificity after model iteration (15). PancreasNet fused progressive residuals, Swin blocks and enhanced feature reweighting to yield 92.4% accuracy and Dice 0.87 on 290 CTs, outstripping earlier CAD systems by 5–7 pp (74). DenseNet-161 augmented with CBAM and clinical features separated serous from mucinous cystic neoplasms on MRI with AUC 0.971 (75). Uncertainty-Aware Attention captured both mean and variance of attention weights, improving AUROC and calibration on national EHRs while enabling reliable I-don't-know deferrals (76). Multi-modal frameworks fused dual-phase CT with eleven biomarkers through self-attention, increasing lymph-node-metastasis AUC from 0.72 to 0.83 (77). Differentiable-search MobileViT backbones combined with graph representations and XGBoost attained 97.33% accuracy on CT, underscoring the synergy between architecture search and hybrid classifiers (78). Novel, non-invasive fundus-image PANet achieved AUC 0.96 for pancreatic cancer, hinting at systemic ocular biomarkers (79).
The body of work surveyed (2015–2025) demonstrates a clear methodological progression from classical machine-learning pipelines—anchored in hand-crafted features, radiomics and population registries—to deep representation learning and, most recently, attention- and transformer-based architectures (Tables 5–7). This evolution has delivered substantial gains in diagnostic accuracy, segmentation performance and multi-modal fusion, and has unlocked promising avenues for non-invasive early detection (imaging + liquid biopsy) and scalable diagnostic suites. At the same time, persistent gaps constrain clinical translation: many studies remain retrospective, single-center or under-powered; reporting and evaluation are heterogeneous; external validation and prospective trials are limited; and issues such as class imbalance, domain shift, overfitting, calibration, interpretability, and deployment efficiency are often insufficiently addressed.
Table 5
| References | Data source | Modality task | Method/model | Key results | Limitations | Strengths |
|---|---|---|---|---|---|---|
| Ojha et al. (18) | RNA-Seq cohort | 3-yr survival | Sex-specific Random Forest with feature filtering & probability calibration; independent cohort validation; deployed as Gap-App web tool | Test acc. 81.25% (M) / 89.47% (F) | Small validation cohort; Genomic predictors may overshadow clinical factors; Complex non-linear interactions not fully captured | Sex-specific modeling improves accuracy; Web-based tool for clinical deployment; External validation with independent cohort |
| Modi et al. (19) | Urine biomarkers (Kaggle) | Multi-class diagnosis | CatBoost after feature selection (handles categorical via ordered boosting); 10-fold CV; compared vs. RF/LGB | Overall acc. 91.89%; pancreatic recall 1.00 | Limited to Kaggle dataset; Lacks external validation on real-world clinical data; Class imbalance not explicitly addressed | CatBoost handles categorical features efficiently; Perfect pancreatic cancer recall (1.00); Comprehensive comparison with RF/LGB |
| Pandey et al. (20) | Multi-omics proteins+genes | Cancer prediction | Hybrid XGBoost+AdaBoost ensemble on curated features (redundancy removal & imputation); cross-val. F1 lead vs. 9 models | Highest F1 of all 9 models | Dataset diversity unclear; No external validation reported; Hybrid ensemble complexity may hinder interpretability | Hybrid XGBoost+AdaBoost achieves highest F1 score; Handles multi-omics data (proteins+genes); Feature curation reduces redundancy |
| Hasan et al. (21) | SEER registry | Stage & survival | Decision Tree after extensive preprocessing (drop >80% missing, one-hot/label encoding); top model for survivability; high stage acc. | Survivability acc. 92.1%; stage 99.97% | AdaBoost and Gaussian NB show poor performance; Model interpretability not discussed; SEER data may not generalize globally | Decision Tree achieves 99.97% stage accuracy; 92.1% survivability prediction; Extensive preprocessing improves data quality |
| Nasief et al. (26) | Daily CT radiomics | Early response | Bayesian-regularized ANN trained on delta-radiomics; selected DRFs (kurtosis, coarseness, NESTD); LOOCV + external validation | External AUC 0.98 | Small patient cohort; Image acquisition variations affect reproducibility; Limited to single-institution data | Bayesian ANN achieves 0.98 external AUC; Delta-radiomics capture temporal changes; Motion-independent features enhance robustness |
| Chen et al. (22) | 18,220-var EHR window | Early detection | XGBoost on 13 → 1 mo pre-dx window; 582 predictors retained from 1,947; operating-point trade-offs quantified | AUC 0.84; median 24-mo lead at 90% SP | Retrospective study design; Requires extensive EHR infrastructure; Trade-off between sensitivity and specificity | Large-scale EHR dataset (18,220 variables); 24-month median lead time at 90% specificity; XGBoost identifies 582 key predictors |
| Blyuss et al. (32) | Urine LYVE1/REG1B/TFF1 | Risk score (PancRISK) | Logistic Regression (PancRISK) over LYVE1/REG1B/TFF1+creatinine+age; compared with RF/SVM/NN; optional CA19-9 OR rule | AUC 0.94; SN/SP 0.81/0.90 | Half of cases are late-stage patients; Limited to three urine biomarkers; Requires additional validation in screening populations | Non-invasive urine-based biomarkers; PancRISK achieves 0.94 AUC; Simple logistic regression outperforms complex models |
| Kinugasa et al. (35) | ctDNA KRAS vs. tissue | Prognosis | Digital PCR KRAS in ctDNA vs. tissue; ctDNA mutations (esp. G12V) prognostic; tissue–ctDNA concordance 77.3% | ctDNA + KRAS linked to shorter OS | 77.3% tissue-ctDNA concordance indicates discrepancies; Small sample size (22 patients); ctDNA detection sensitivity varies | Liquid biopsy approach is minimally invasive; ctDNA KRAS mutations predict survival; Digital PCR enables sensitive detection |
Representative AI Models—Conventional ML.
Table 6
| References | Data source | Modality task | Method/model | Key results | Limitations | Strengths |
|---|---|---|---|---|---|---|
| Liu et al. (46) | CECT patches (TW +US) | Cancer detection | Modified VGG CNN on patch crops with patient-level aggregation thresholding; weighted loss; multi-cohort external validation | Acc. 0.986 (local); ext. AUC 0.920 | Retrospective study design; Patch-based approach may miss global context; Requires manual ROI selection for preprocessing | Cross-racial external validation (Taiwan + US); Modified VGG achieves 0.986 local accuracy; Multi-cohort validation demonstrates generalizability |
| Shnawa et al. (47) | CT (250 +250) | Binary detection | NASNet feature extractor (Cat Swarm optimized) + Elman NN (Glowworm Swarm tuned); end-to-end ETEPCC-MDTL pipeline | Acc. 99.60% | Limited dataset size (250+250); Swarm optimization adds computational complexity; Single-institution data may limit generalization | Cat Swarm + Glowworm Swarm optimization for hyperparameter tuning; Elman NN handles temporal dependencies; 99.60% accuracy achieved |
| Bhargavi et al. (48) | CT (PCCD 1800) | Early prediction | Preproc. (HSV + diffusion) → Fuzzy K-NN Equality segmentation → DCNN+DBN classifier with HOG fusion | Acc. 99.8%; SN 100% | Complex multi-stage pipeline may be difficult to reproduce; HOG feature fusion increases computational cost; Limited external validation | DCNN+DBN fusion leverages complementary features; HSV color space preprocessing enhances contrast; Achieves 99.8% accuracy with 100% sensitivity |
| Kavak et al. (51) | H&E (12k / 4k img.) | Histology Dx | Transfer learning across CNNs (ResNet50, EfficientNetB0, etc.); curated patching/augmentation; ResNet50 best on 512 × 512 | Acc. 96% (512 × 512) | Histology-based approach requires tissue samples; Patch size (512 × 512) may affect performance on different resolutions; Computational cost of transfer learning | Comprehensive CNN comparison (ResNet50, EfficientNetB0, etc.); Transfer learning reduces training time; 96% accuracy on 512 × 512 patches with curated augmentation |
| Ramaekers et al. (56) | Contrast CT | Det. + localization | Anatomy-guided ensemble: pancreas/duct segmentation → tumor segmentation using secondary signs; bootstrapped folds | AUROC 0.99; SN 0.97; SP 1.00 | Relies on secondary signs which may be subtle; Bootstrap validation may overestimate performance; Requires accurate pancreas segmentation | Anatomy-guided approach improves interpretability; Ensemble of segmentation models enhances robustness; Achieves 0.99 AUROC with 0.97 sensitivity and 1.00 specificity |
| Viriyasaranon et al. (60) | Multi-center CT | Classification | Annotation-efficient pretraining via pseudo-lesion segmentation; fine-tuned ShuffleNetV2/PVT; robust even with 10% labels | Acc. 94.3% internal; 82.5% ext. (10% data) | Pseudo-lesion segmentation may introduce artifacts; External validation shows performance drop (82.5% vs. 94.3%); Multi-center variability affects consistency | Annotation-efficient pretraining reduces labeling burden; Robust with only 10% labeled data; ShuffleNetV2/PVT balance accuracy and efficiency |
| Chen et al. (82) | 1,473 CECT | Full CAD pipeline | Segmentation-driven CAD followed by 5 × 3D CNN ensemble; no manual preprocessing; real-world cohort validated | Real-world AUC 0.95; SN 74.7% < 2 cm | Small tumor detection remains challenging (74.7% SN < 2 cm); Segmentation-driven approach requires accurate organ delineation; Ensemble complexity increases inference time | Nationwide population-based study (1,473 CECT); No manual preprocessing required; 5 × 3D CNN ensemble improves robustness; Real-world validation achieves 0.95 AUC |
Representative AI models—Deep learning.
Table 7
| References | Data source | Modality task | Method/model | Key results | Limitations | Strengths |
|---|---|---|---|---|---|---|
| Vinod et al. (65) | Urine biomarkers | 3-class Dx | Kernel Attention Network (KAN) with EBM-based feature selection; attention grid (g = 4, k = 2); L-BFGS optimization | Acc. 94.44%; F1 0.97 | Kernel Attention Networks are relatively new with limited validation; L-BFGS optimization may be sensitive to initialization; Urine biomarker approach requires standardized collection | Kernel Attention Network (KAN) provides interpretable attention mechanisms; EBM-based feature selection improves robustness; Achieves 94.44% accuracy with 0.97 F1 score |
| Cao et al. (68) | CT (Task07) | Pancreas +tumor seg. | MDAG-Net: multi-dimensional attention gates in U-Net skips; WML loss (weighted CE+MIoU) for small targets | Dice +5.3% vs. U-Net | Multi-dimensional attention gates increase model complexity; WML loss requires careful hyperparameter tuning; Limited to Task07 dataset | Multi-dimensional attention gates in U-Net capture cross-scale features; WML loss addresses class imbalance for small targets; 5.3% Dice improvement over standard U-Net |
| Cao et al. (15) | 3,208 non-contrast CT | Det. +subtype | PANDA: nnU-Net localization → high-SP lesion detect → dual-path memory Transformer (prototype/context) for subtype/PDAC | PDAC AUC 0.987; 9-center SP 95.7% | Dual-path memory Transformer requires substantial computational resources; High specificity may come at cost of sensitivity; Complex pipeline with multiple stages | Large-scale validation (3,208 non-contrast CT); PANDA framework achieves 0.987 PDAC AUC; 9-center validation with 95.7% specificity demonstrates generalizability |
| Dong et al. (69) | CT (MSD) | Segmentation | AMFF-Net: RDAM (GateAttn) in shallow layers + Hybrid Transformer at deepest stage; decoder multiscale fusion | Dice 82.12% (pancreas); 57.00% (tumor) | Hybrid Transformer at deepest stage increases memory requirements; Tumor Dice (57%) lower than pancreas (82.12%); Decoder multiscale fusion adds complexity | RDAM (GateAttn) in shallow layers preserves fine details; Hybrid Transformer captures long-range dependencies; Multiscale fusion improves boundary delineation |
| Sun et al. (72) | Synapse +5 sets | Segmentation | DA-TransUNet: ViT+U-Net with Dual Attention blocks (position+channel) in encoder & skip connections | Dice 79.80% ( +2.3%) | ViT component requires large amounts of training data; Dual attention increases inference time; Performance gain (+2.3% Dice) may not justify added complexity | ViT+U-Net architecture combines global and local features; Dual attention (position+channel) enhances feature representation; Validated on Synapse +5 datasets; 79.80% Dice (+2.3%) |
| Li et al. (77) | Dual-phase CT +11 labs | LN metastasis | Dual-channel ResNet18 for CT features with attention-based multimodal fusion of clinical biomarkers; non-linear correlations | AUC 0.83 (vs. 0.72 radiomics) | Requires both dual-phase CT and 11 lab biomarkers; Multimodal fusion complexity may hinder deployment; Limited to lymph node metastasis prediction | Dual-channel ResNet18 processes CT features efficiently; Attention-based multimodal fusion captures non-linear correlations; AUC 0.83 outperforms radiomics-only (0.72) |
| Heo et al. (76) | National EHR | Risk prediction | Uncertainty-aware Attention (variational): learns attention mean/variance; RETAIN-style with improved calibration (lower ECE) | Higher AUROC; lower ECE | Variational attention adds training complexity; RETAIN-style architecture may not generalize to non-EHR data; Requires large-scale national EHR | Uncertainty-aware attention improves model calibration; Learns attention mean and variance for reliability; Lower ECE and higher AUROC than deterministic attention |
| Tian et al. (75) | MRI cysts | SCN vs. MCN | CBAM-DenseNet161 fused with 11 clinical features; channel + spatial attention before FC fusion | AUC 0.971; Acc. 92.44% | Limited to MRI cystic tumor classification; Requires 11 clinical features in addition to imaging; CBAM attention adds computational overhead | CBAM-DenseNet161 combines channel and spatial attention; Fusion with 11 clinical features improves accuracy; Achieves 0.971 AUC and 92.44% accuracy for SCN vs. MCN |
| Mahendran et al. (74) | CT (290 vols.) | Detection | PancreasNet: Swin-based progressive residual Transformer with Enhanced Feature Reweighting & Regulated Fusion; LSTM-like retention | Acc. 92.4%; Dice 0.87 | Swin Transformer requires careful patch size selection; LSTM-like retention increases model parameters; Dataset size (290 volumes) relatively modest | Swin-based progressive residual Transformer scales efficiently; Enhanced Feature Reweighting improves important feature emphasis; Regulated Fusion with LSTM-like retention; 92.4% accuracy and 0.87 Dice |
Representative AI models—Attention/transformer.
4 Data sources
A panoramic view of the data landscape clarifies why pancreatic-cancer AI has shifted from classical machine-learning to deep-learning and, most recently, to attention or transformer architectures. Instead of enumerating studies, the material below pools the datasets actually used by the short-listed papers (Table 8) by the primary data modality that governs network design and evaluation. Three trends emerge. First, modern imaging pipelines lean on ever larger, mostly private three-dimensional CT archives. Second, prognosis-oriented radiomics and -omics projects still depend on mid-sized, often single-center cohorts. Third, a handful of public benchmarks act as “connective tissue” for cross-paper comparison and pre-training.
Table 8
| Dataset | Modality & description | Sample size | Public | References |
|---|---|---|---|---|
| Two-dimensional imaging datasets | ||||
| Histology H&E crops | WSI (PDAC vs. chronic pancreatitis) | 12,000 + 4,000 images | No | (51) |
| Balanced CT slices | Two-class abdominal CT slices | 500 slices | No | (47) |
| PCCD CT images | Portal-venous CT slices | 1,800 slices | No | (48) |
| Three-dimensional imaging datasets | ||||
| Taiwan CECT + TCIA | Portal-venous CT (internal + external) | 370+320 / 281+82 | Mixed | (46) |
| Dutch CECT + MSD | Local 197 CECT + public 281 MSD volumes | 478 volumes | Mixed | (56) |
| Korean multi-center | Multi-center non-contrast CT | 4,287 + 361 pts | No | (60) |
| Chinese registry | Multi-hospital contrast CT | 1,473 studies | No | (82) |
| PANDA multi-center | Non-contrast CT from 9 hospitals | 3,208 + 5,337 | Partlya | (15) |
| MSD Task07 | 3-D CT segmentation challenge | 281 volumes | Yes | (68) |
| NIH-82 pancreas CT | TCIA abdominal benchmark | 82 volumes | Yes | (69) |
| Synapse abdominal CT | Multi-organ segmentation set | ~377 volumes | Yes | (72) |
| PancreasNet CT | Progressive-residual Swin study | 290 volumes | No | (74) |
| Dual-phase CT | Arterial+venous CT & biomarkers | 202 pts | No | (77) |
| MRI cystic-neoplasm | T1/T2 ROIs (SCN vs. MCN) | 314 pts / 1,761 ROIs | No | (75) |
| Imaging-derived tabular radiomics | ||||
| Serial non-contrast CT | Daily CT during chemoradiation | 90 pts / 2,520 scans | No | (26) |
| Clinical tabular sources | ||||
| SEER registry | Cancer registry (1975–2016) | ~31,000 cases | Yes | (21) |
| Optum® EHR | De-identified claims / clinical text | 3,322 + 25,908 | Commercial | (22) |
| NHIS insurance | National health-service claims | NR | Restricted | (76) |
| Molecular and liquid-biopsy datasets | ||||
| Sex-distinct RNA-Seq | Tumor RNA-Seq (FPKM) | NR | No | (18) |
| Multi-omics panel | Proteins + gene expression | NR | No | (20) |
| ctDNA vs. tissue KRAS | Serum/tissue sequencing | 75 + 66 pts | No | (35) |
| Biofluid biomarker panels | ||||
| Kaggle urinary 2020 | LYVE1, REG1B, TFF1, creatinine | 590 samples | Yes | (19) |
| PancRISK urine | LYVE1, REG1B, TFF1, creatinine | 379 samples | On request | (32) |
Summary of data sources in pancreatic cancer AI research.
a Planned for public release. NR, Not reported; pts, patients; ROIs, regions of interest.
4.1 Two-dimensional imaging datasets
Two-dimensional inputs either whole slides or axial slices—were an early compromise between GPU memory limits and the need for more training examples. Histology work by Kavak et al. built a corpus of 12,000 low-resolution and 4,000 high-resolution H&E crops from 119 surgical slides, later used to benchmark transfer-learning CNNs and to illustrate that ResNet50 and EfficientNetB0 outperform custom models on balanced pathology data (51). Liu et al. followed a similar patch strategy on imaging, extracting 224 × 224 arterial-phase CECT tiles from 690 Taiwanese CT volumes and validating on 281 PDAC and 82 control scans from TCIA; the redundancy of thousands of overlapping patches lifted patient-level accuracy beyond 0.98 on the internal test set (46). Beyond the abdomen, Wu et al. repurposed ophthalmic photographs, assembling 1 300 fundus images from 194 patients to train PANet—a ResNet34 backbone with multi-scale and channel attention—that reached an AUC of 0.96 for pancreatic-cancer prediction (79). Finally, Chen et al. created the PCPI set by tiling whole-slide pathology images into 224-pixel squares and showed that a plug-and-play channel-plus-spatial self-attention block boosts mDice to 74 % on five tissue classes (80). Collectively, these two-dimensional resources demonstrate how high annotation density can offset limited patient numbers when memory or data-sharing constraints prohibit full-volume learning.
4.2 Three-dimensional imaging volumes
Full-volume learning has now become the default for detection, segmentation and staging tasks. Several compact single-center datasets still underpin proof-of-concept work: a balanced 500-slice abdominal CT collection drives the NASNet–Elman hybrid that reports 99.6% accuracy (47); the so-called PCCD set of 1,800 portal-venous slices fuels a DCNN–DBN pipeline that reaches 99.8% accuracy (48); and a 290-volume non-contrast series underlies PancreasNet, a Swin-based progressive residual network that attains a Dice of 0.87 (74). Multicentre cohorts offer greater diversity: Ramaekers et al. combined 197 contrast-enhanced exams from the Netherlands with the public Medical Segmentation Decathlon (MSD) Task02 pancreas-tumor set of 281 volumes, showing that anatomy-aware ensembles generalize with an AUROC of 0.99 (56). Viriyasaranon et al. pushed self-supervised pre-training on 4,287 Asian and 361 US studies, a scale that revealed cross-ethnicity gaps and how pseudo-lesions can bridge them (60). Public benchmarks remain indispensable: MSD Task07, NIH-82 and the Synapse multi-organ set (≈377 volumes) form the backbone of attention U-Nets, MDAG-Net, AMFF-Net, and DA-TransUNet, letting authors claim consistent Dice gains of 2–6 percentage points over U-Net or TransUNet baselines (68, 69, 72, 81). At the high end of scale, the PANDA consortium aggregated 3208 non-contrast CTs with 5,337 external validations drawn from nine hospitals; its memory transformer discriminates PDAC subtypes with an AUC of 0.987 and often outperforms radiologists in reader studies (15). Chen et al. add a 1,473-study nationwide registry for five-network ensemble testing, reporting real-world AUC 0.95 and 74.7 % sensitivity for tumors smaller than two centimeters (82). A hybrid modality appears in the dual-phase arterial-plus-venous collection of 202 patients that, when fused with 11 laboratory variables via multi-head attention, yields an AUC of 0.83 for lymph-node-metastasis prediction (77). Together these resources illustrate how volume-level diversity, not merely sample count, drives external validity.
Magnetic-resonance datasets are far scarcer. Tian et al. gathered 314 cystic-neoplasm exams—1,761 two-dimensional tumor ROIs—and showed that inserting a CBAM hybrid attention block into DenseNet161, then concatenating eleven clinical factors, pushes patient-level AUC to 0.97 for distinguishing serous from mucinous cystic lesions (75). The study underscores both the promise and current scarcity of MRI data for pancreatic AI.
4.3 Radiomics data
Despite the rise of end-to-end CNNs, hand-engineered features remain influential in prognosis and treatment-response modeling. Nasief et al. extracted more than 1,300 delta-features from 2,520 daily non-contrast CTs in 90 chemoradiation patients, finding that a three-feature Bayesian neural network predicted response with an external AUC of 0.98 (26). Toyama et al. linked gray-level non-uniformity on FDG-PET to survival in 161 cases, showing that radiomic heterogeneity complements clinical stage and surgical status (28). Such studies highlight radiomics' role where serial imaging or functional tracers exist but deep labels do not.
4.4 Clinical and registry data sources
Large administrative or registry data still power many risk-stratification efforts. The Optum® inverse-cohort strategy linked 3,322 early-stage and 25,908 late-stage PDAC cases to de-identified claims, letting XGBoost anticipate a median 24-month diagnostic lead at 90% specificity (22). The SEER registry, cleaned down to roughly 31,000 PDAC records, remains a staple for stage and survival classification (21). A Taiwanese three-center EMR of 66,384 diabetic patients supports a four-year risk score with an AUROC of 0.91 (24), while Korean NHIS claims underpin uncertainty-aware attention that yields better calibration than deterministic baselines (76). Structured, population-scale tables thus remain irreplaceable for longitudinal prediction.
4.5 Genomic and molecular data
Genomic, proteomic and cell-free assays enrich modeling with biological mechanism, albeit at smaller scale. Ojha et al. built sex-distinct three-year survival predictors on paired tumor RNA-Seq, although the sample count is undisclosed (18). Patel et al. merged protein abundances and gene expression into a mixed multi-omics panel but left accession details unspecified (20). Kinugasa et al. sequenced KRAS in 75 paired tissue and 66 serum samples, confirming that circulating mutations predict poorer outcome (35). Follow-up work by Cohen, Allenson, Pietrasz, and Hadano refined plasma assays that combine ctDNA with proteins or exosomes, generally trading sample size for earlier detection or better prognostication (36–39).
4.6 Biomarker and biofluid data sources
Urine and serum immunoassays remain attractive for low-cost screening. The 2020 Kaggle urine dataset—590 samples measuring LYVE1, REG1B, TFF1 plus creatinine—supports both CatBoost classification and the kernel-attention network that attains a 0.97 F1 score for the cancer class (19, 65). Blyuss et al. contributed the 379-sample PancRISK panel, where logistic regression yields an AUC of 0.94 and sensitivity of 0.81 at 90 % specificity (32). Serum CA19-9, CA125, CEA and exosomal miRNAs—explored in nested case–control and Lewis-negative subcohorts—extend liquid-biopsy utility, particularly when conventional antigens fail (41–43). These panels demonstrate that modest sample sets, when molecularly rich and clinically accessible, still underpin competitive AI models.
Across modalities, one message is constant: data variety, not merely data volume, dictates architectural choice. Two-dimensional patch-based CNNs excel where dense annotation is feasible; three-dimensional CNN–Transformer hybrids dominate in volumetric CT; and attention mechanisms increasingly fuse mixed signals—dual-phase imaging with laboratory values, or claims data with temporal patterns—to deliver clinically actionable insight.
Figure 8 presents modality-wise distributions using boxplots on a log scale, with mean markers shown for each group. Finally, In Figure 9, a horizontal bar chart displays the per-dataset sample sizes on a logarithmic x-axis, sorted in descending order and labeled with exact values, Figure 10 depicts a modality × availability heatmap, where cell colors encode dataset counts and overlaid text provides the precise numbers. All three figures were generated in Python using Matplotlib.
Figure 8

Distribution of dataset sample sizes by modality (log scale). Boxes show interquartile range with whiskers; dots mark the mean for each modality.
Figure 9

Dataset sample sizes (log scale), sorted by size. Each bar corresponds to one dataset from our inventory and is labeled with its sample count.
Figure 10
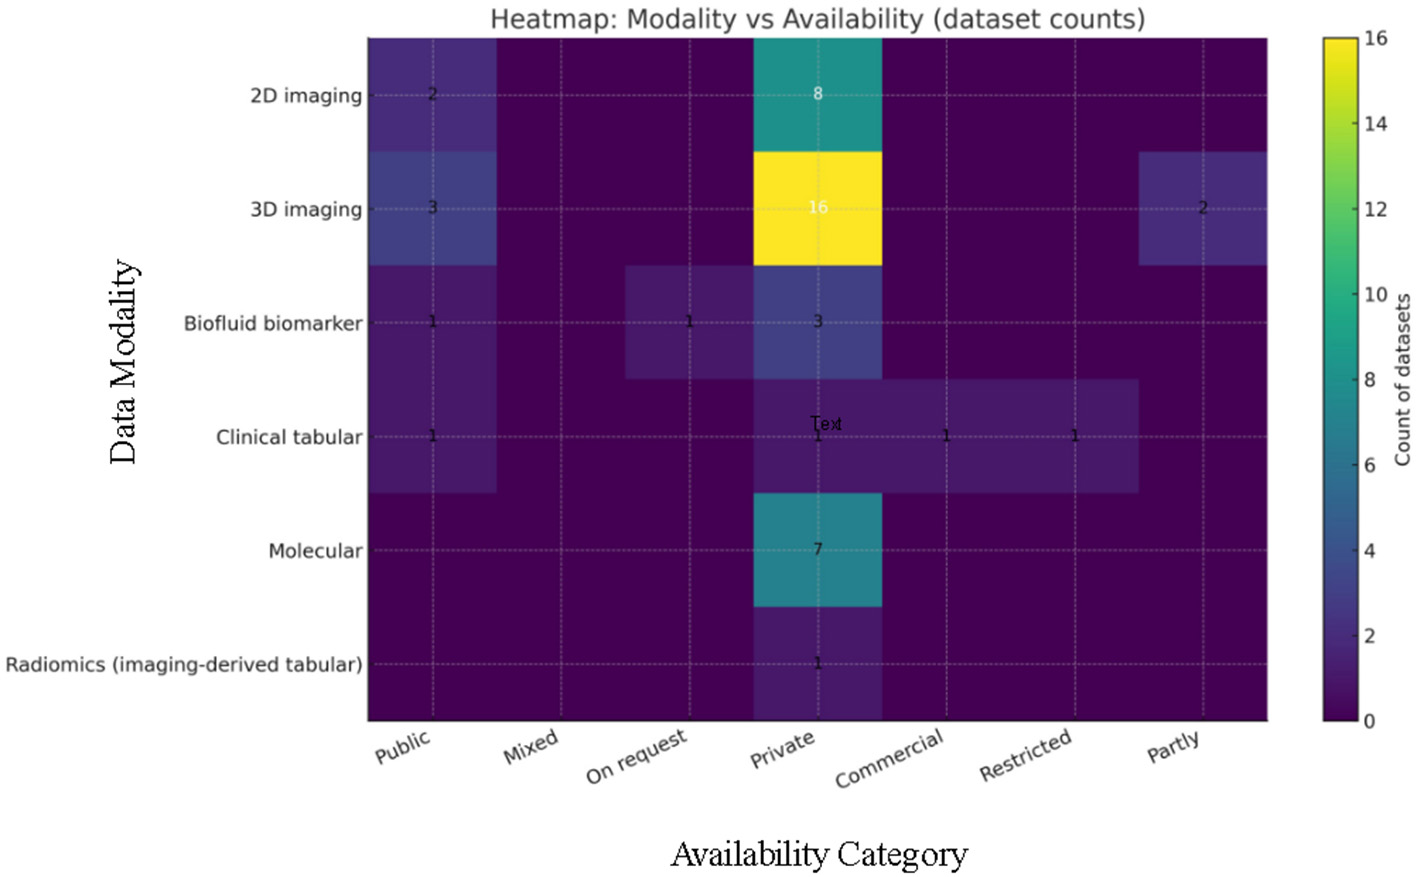
Counts of datasets by modality and availability category. Color encodes count and cell annotations give exact values.
5 Discussion
The past decade has witnessed a rapid transition from conventional machine-learning pipelines to end-to-end deep networks and, most recently, to transformer-enhanced architectures for pancreatic cancer. Early studies relied on hand-crafted radiomic and clinical variables coupled with support-vector machines, random forests or shallow neural networks. These models provided useful proof-of-concepts but were limited by the size and heterogeneity of available datasets and required expert feature engineering (22, 26). Deep-learning approaches alleviated some of these constraints by learning hierarchical features directly from images. Modified VGG and ResNet models achieved internal accuracies around 98%–99% for binary detection when trained on balanced CT or histology datasets (46, 48). Hybrid stacks that combined denoising, segmentation and deep belief networks further pushed sensitivity to nearly 100% on curated cohorts (48). More recent work incorporates multi-dimensional attention and transformer components to better capture long-range context and focus the network on the small, heterogeneous pancreas and tumor region. For instance, the Multi-Dimensional Attention Gate network (MDAG-Net) introduces spatial, channel and multi-input attention gates; compared with a U-Net baseline on the Task07 Pancreas dataset it improved Dice, precision, recall and mean IoU by 5.3, 1.5, 12.7, and 7.6 percentage points, respectively. This shift illustrates how attention helps filter redundant background features and recalibrates convolution kernels to emphasize tumor regions.
Progress has been driven not only by algorithmic innovation but also by access to larger and more diverse datasets. Early efforts were restricted to two-dimensional slices or small, single-center cohorts; for example, the PCCD dataset comprised 1,800 portal-venous slices, and several urine-biomarker studies contained fewer than 600 samples. Contemporary studies leverage full three-dimensional volumes and multi-center registries. Large-scale cohorts such as PANDA aggregated more than 3,000 non-contrast CTs with external validation across nine hospitals, enabling robust training and external assessment (15). Public benchmarks like the NIH, MSD Task07, and Synapse datasets now provide standardized segmentation tasks, fostering fair comparison and transfer learning. Meanwhile, new modalities—fundus photography, plasma-omics, and multi-phase CT fused with clinical biomarkers—have diversified the data landscape (18, 79). This variety has underscored the importance of modality-specific architectures: two-dimensional patch CNNs remain effective for dense histology or fundus imagery, whereas three-dimensional U-Nets and transformers excel on volumetric CT, and attention-based fusion layers integrate imaging with lab tests or clinical variables.
The model-summary (Tables 5–7) and the data-source (Table 8) together highlight a consistent pattern: (i) radiomics and conventional ML are strongest for prognosis and longitudinal monitoring, where repeated measures (delta-radiomics on serial CT or pre/post-RT PET/CT) capture treatment-induced change and heterogeneity (26–28); (ii) CNNs dominate lesion detection/segmentation on volumetric contrast CT—especially when anatomical context (pancreas/duct masks, secondary signs) is injected—yielding high AUROC with clinically interpretable by-products (masks, heat-maps) (56, 57); and (iii) transformer/attention components are most compelling when fusing modalities (dual-phase CT with laboratory values, or imaging with clinical covariates) and when global context matters (e.g., multi-center non-contrast CT) (15, 75, 77). In short, the “what each method is good at” in Tables 5–7 maps directly to the data regimes cataloged in Table 8: hand-engineered features plus survival models for serial/prognostic settings; CNNs for voxel-level localization; and attention/transformers for multi-modal fusion and long-range dependencies.
Recent transformer-enhanced models demonstrate state-of-the-art performance on both detection and segmentation tasks. Hybrid DenseNet models incorporating channel and spatial attention and eleven clinical variables achieved 92.44% accuracy, AUC 0.971 and F1-score 0.936 for differentiating serous vs. mucinous cystic neoplasms on MRI. The dual-attention TransUNet (DA-TransUNet) integrates positional and channel attention blocks into a U-shaped transformer; on the multi-organ Synapse dataset it improved mean Dice by 2.32 percentage points and reduced the Hausdorff distance by 8.21 mm relative to TransUNet, with a pancreas-specific Dice gain of 5.73 percentage points. Such gains come at minimal computational cost—only a 2.54% increase in parameters. Similarly, the PancreasNet progressive residual transformer network combines Swin blocks, enhanced feature reweighting and regulated fusion; it reported 92.4% accuracy, 93.1% recall, 90.7% specificity, and Dice 0.87 on a 290-volume cohort, outperforming earlier convolutional CAD systems by 5–7 percentage points. Multi-modal attention further enhances classification: a dual-phase CT plus clinical biomarker model achieved 80% accuracy, 0.82 precision, 0.86 specificity, 0.74 recall, and AUC 0.83 for pre-operative lymph-node metastasis prediction, representing improvements of 0.10–0.16 points over radiomics baselines. At the extreme, the DeepOptimalNet cascade achieved a reported 99.3% accuracy, 99.1% sensitivity, and 99.5% specificity for pancreatic tumor classification in CT imaging (83), though such perfect scores on limited datasets warrant cautious interpretation and external validation. Collectively, these results indicate that attention-augmented architectures provide tangible benefits in focusing on subtle pancreatic features, balancing precision and recall, and reducing false positives.
To provide a comprehensive quantitative overview, Table 9 aggregates reported performance metrics across the representative studies in Tables 5–7. Across conventional machine-learning approaches, AUC values ranged from 0.84 to 0.98, with accuracy spanning 81%–99.97%; deep-learning models improved these ranges to AUC 0.92–0.99 and accuracy 82.5%–99.8%, while also introducing segmentation capabilities (Dice 0.19–0.70). Attention and transformer-based architectures achieved the highest overall discrimination [AUC up to 0.996 for PANDA (15)] and best segmentation performance [Dice 0.87 for PancreasNet (74)], with F1 scores consistently exceeding 0.92 across all generations and peaking at 0.97 for the kernel attention network (65). This progression demonstrates measurable performance gains from conventional ML through deep learning to attention/transformer architectures, particularly for complex imaging tasks requiring spatial reasoning and multimodal data fusion. However, it is important to note that these metrics reflect heterogeneous datasets, tasks (detection vs. segmentation vs. prognosis) and validation strategies; therefore, direct cross-study comparisons must account for differences in sample size, prevalence, imaging protocols and patient-level vs. slice-level evaluation.
Table 9
| Metric | Conventional ML | Deep learning | Attention/transformer | Best overall |
|---|---|---|---|---|
| AUC | 0.84–0.98 | 0.92–0.99 | 0.83–0.996 | 0.996 [PANDA (15)] |
| Dice | N/Aa | 0.19–0.70 | 0.57–0.87 | 0.87 [PancreasNet (74)] |
| F1 | >0.92b | 0.92–0.96 | 0.936–0.97 | 0.97 [KAN (65)] |
| Accuracy | 81%–99.97% | 82.5%–99.8% | 80%–94.4% | 99.97% [Decision Tree (21)] |
Quantitative performance aggregation across AI model generations.
a ML models focused on classification tasks without segmentation.
b Exact F1 value not reported; described as “highest” among compared models (20).
Ranges reflect heterogeneous datasets, tasks, and validation strategies; direct cross-study comparisons should account for these differences. AUC, Area Under ROC Curve; N/A, Not Applicable.
A few entries in Tables 5–7 (and related reports) claim near-perfect performance—e.g., 99.8% for a DCNN+DBN pipeline on the 1,800-slice PCCD set (48) and 99.6% for an NASNet → Elman hybrid on a 500-image two-class CT dataset (47). Based on the dataset properties summarized in Table 8 and the authors' own descriptions, several factors likely contribute.
First, both studies used relatively small, balanced research sets (hundreds to low thousands of images, not patients), often from one or few scanners/centers. Such homogeneity reduces nuisance variation and can inflate apparent performance. Second, PCCD and similar corpora are 2D slice collections where many slices from the same patient share textures, field-of-view and reconstruction kernels. If slices (or overlapping patches) from a given patient appear in both train and test folds, leakage occurs, and models learn patient/scanner signatures rather than disease biology, driving metrics toward 99%–100%. Third, several pipelines framed a binary “tumor vs. healthy” task with tumor-centric crops or post-hoc ROI selection, simplifying the decision surface and limiting challenging negatives (e.g., pancreatitis, cysts, post-operative change). Finally, neither study reports robust, multi-center external testing at the patient level; metrics were typically computed on balanced sets and may not reflect screening prevalence or case-mix.
These considerations help explain why 99%+ results are rare in larger, multi-institutional cohorts or prospective settings. In line with the trends in Table 8, when studies scale to diverse volumes and enforce patient-level splits with external validation, reported AUROC/accuracy typically settle into the 0.83–0.96 range for CAD, and Dice for pancreas/tumor segmentation into the 0.57–0.88 range—credible but not “perfect” (56, 69, 82).
To close the gap between Tables 5–8 and clinical reality, we recommend that future work:
-
Enforce patient-level train/validation/test segregation (no slice/patch overlap),
-
report both image-level and patient-level metrics with case-mix and prevalence made explicit,
-
Include external, multi-center testing and, when possible, prospective evaluation,
-
Stratify results by lesion size (< 2 cm), stage, and scanner/protocol,
-
Provide calibration (reliability) curves and decision-curve analysis in addition to accuracy/AUC, and
-
Release preprocessing code and split manifests to mitigate inadvertent leakage.
Where feasible, anatomically informed attention (ducts, vessels) and multi-modal fusion should be prioritized for tasks that intrinsically require global context (e.g., lymph-node metastasis or subtype attribution) (15, 77).
Table 3 presents a comprehensive methodological quality assessment across 24 studies from three model generations (Machine Learning, Deep Learning, and Attention/Transformer architectures), systematically analyzing single-center vs. multi-center designs and internal vs. external validation strategies—key quality indicators that directly impact model generalizability and clinical translation.
The evolution of AI models has increasingly emphasized holistic patient context. Sex-specific RNA-Seq survival predictors illustrate how biological sex influences transcriptomic signatures and survival modeling (18). Multi-omics panels combining proteins and gene expression have outperformed single-omics classifiers, highlighting the synergy of heterogeneous data sources (20). The lymph-node metastasis study cited above fused dual-phase CT and eleven laboratory variables via an attention-based fusion module; this integration raised AUC from 0.72 (radiomics alone) to 0.83. Similar improvements are observed when fusing imaging with risk factors: logistic regression on urine biomarkers plus CA19-9 improved sensitivity and specificity to 96%, and multi-head fusion of dual-phase CT with clinical biomarkers increased lymph-node detection accuracy by over 10 percentage points. Beyond imaging, end-to-end frameworks now incorporate self-supervision and pseudo-lesion pretext tasks to reduce annotation burdens; models pre-trained on synthetic lesions achieved external accuracies up to 82.5% despite using only 10% of labeled data (60).
6 Emerging directions and future challenges
Although remarkable progress has been made, several challenges remain. Many studies are retrospective and single-center; prospective, multi-institutional trials are needed to verify generalisability and clinical impact. Domain shift across scanners, patient populations and acquisition protocols can degrade performance; attention-based causal regularization and uncertainty estimation may mitigate such shifts. Interpretation and fairness are critical: anatomically guided attention and uncertainty-aware mechanisms provide more transparent saliency maps and allow models to defer to clinicians when confidence is low. In addition, counterfactual explanations should be incorporated to further enhance interpretability and strengthen clinician trust. Early detection remains an open frontier. Delta-radiomics and longitudinal EHR models have shown that subtle texture changes or clinical patterns can predict pancreatic cancer 24 months before diagnosis (22). Recent work suggests that radiomic signatures in apparently normal pancreas can precede diagnosis by over a year. Translating such findings into practice will require precise volumetric segmentation and integration with high-risk cohort selection. Combining imaging with genomics, proteomics, and metabolomics may uncover prodromal signatures, while non-invasive modalities such as fundus photography already hint at systemic biomarkers. Finally, data privacy, algorithmic bias and the integration of AI outputs into clinical workflows require careful consideration. The next decade will likely see the convergence of self-supervised learning, causal graph modeling, multi-modal fusion and federated training to deliver interpretable and equitable AI tools for the early detection, staging, and management of pancreatic cancer. To ensure clinical translation, future studies must also adopt prospective, population-based trial designs that directly evaluate real-world screening and triage performance.
Among the surveyed studies, PANDA (9-center, 3,208 training CTs, 5,337 external validation cases, AUC 0.984–0.987) (15) and Chen et al.'s nationwide study (1,473 real-world CTs, AUC 0.95, 89.7% AI sensitivity vs. 74.7% radiologist for < 2 cm tumors) (82) represent the closest candidates for clinical deployment, distinguished by multi-center validation and head-to-head clinician comparisons. Beyond imaging, Nasief's delta-radiomics (treatment response prediction, external AUC 0.98) (26) and biomarker panels [PancRISK urine test, AUC 0.94 (32); plasma amino-acids, AUC 0.86 (33)] show strong translational potential through interpretability and integration with existing workflows. However, regulatory approval faces critical barriers: 83.3% of studies lack multi-center validation required by FDA/EMA for generalizability evidence (Table 3); only four studies documented prospective reader comparisons mandated for Software as a Medical Device (SaMD) submissions; and domain shift effects [11.8% performance drop in cross-ethnic validation (60)] highlight inadequate robustness testing. The EU AI Act (2024) further mandates algorithmic transparency, bias audits across patient subgroups, and uncertainty quantification—requirements met by < 5% of reviewed studies.
6.1 Data-sharing frameworks are critical yet underdeveloped accelerators of translation
Public benchmarks (Medical Segmentation Decathlon, NIH pancreas dataset) enable algorithmic comparison but lack patient metadata for robust generalizability assessment (68, 69). Federated learning—where models train locally while sharing only gradient updates—offers privacy-preserving multi-center collaboration, yet zero reviewed studies employed this approach. International consortia (TCIA, PANDA, AI-PREDICT) demonstrate feasibility of de-identified data pooling with harmonized protocols, while standardized reporting (TRIPOD-AI, STARD-AI) remains non-mandatory despite regulatory necessity. Accelerating translation requires: (1) multi-center designs as the methodological standard (currently only 16.7%); (2) federated learning adoption to overcome privacy barriers; (3) expanded data-sharing consortia with incentivized participation; and (4) prospective trials with locked algorithms and independent test sets to satisfy FDA 510(k) evidentiary requirements. Without these infrastructure investments, even high-performing AI risks remaining research curiosities rather than deployed clinical tools.
7 Conclusion
This review has traced the methodological progression from classical machine-learning and radiomics to deep representation learning and, most recently, attention- and transformer-enhanced architectures for pancreatic cancer detection, segmentation and prognosis. Attention-augmented models and multi-modal fusion have delivered consistent gains in diagnostic accuracy, segmentation Dice and AUC across a range of tasks and datasets, demonstrating clear potential to augment human readers and to enable earlier, non-invasive detection.
Despite these advances, several barriers remain before routine clinical deployment is possible. Many published studies are retrospective, single-center or underpowered; evaluation metrics and reporting are heterogeneous; and model robustness to domain shift, scanner variability and population differences is often insufficiently tested. Moreover, challenges around interpretability, fairness, data governance and workflow integration persist and must be addressed alongside pure algorithmic improvements.
To accelerate safe and equitable translation we recommend the following priorities:
-
Move beyond retrospective benchmarks by testing models in prospective cohorts and pragmatic clinical settings to quantify real-world benefit and harms.
-
Adopt common reporting standards, share pre-processing pipelines and encourage public, well-annotated multi-center datasets to reduce evaluation heterogeneity.
-
Invest in methods for domain generalization, calibration, uncertainty estimation and causal regularization to reduce sensitivity to scanner/protocol and population shifts.
-
Prioritize architectures that fuse imaging with biomarkers and clinical data while remaining computationally efficient and interpretable for deployment.
-
Use federated learning and secure model-sharing to scale training data while respecting patient privacy and jurisdictional constraints.
-
Co-design algorithms with clinicians, evaluate decision-impact (not just performance metrics), and plan regulatory, ethical and cost-effectiveness assessments early in development.
In summary, the combination of anatomically guided attention, principled multi-modal fusion, and rigorous external validation offers the most promising path toward clinically useful AI for pancreatic cancer. If future work couples these technical advances with prospective trials, clear reporting standards and careful attention to fairness and deployment, AI could materially improve early detection, staging and personalized management for patients with pancreatic cancer.
Statements
Data availability statement
The original contributions presented in the study are included in the article/supplementary material, further inquiries can be directed to the corresponding author.
Author contributions
MA: Funding acquisition, Investigation, Writing – original draft. ST: Formal analysis, Investigation, Methodology, Writing – original draft. MH: Conceptualization, Project administration, Supervision, Writing – review & editing. SK: Formal analysis, Validation, Visualization, Writing – review & editing. AF: Data curation, Investigation, Software, Writing – original draft. HA: Formal analysis, Investigation, Methodology, Writing – review & editing. AA: Data curation, Formal analysis, Methodology, Writing – review & editing.
Funding
The author(s) declared that financial support was received for this work and/or its publication. This work was funded by the Deanship of Graduate Studies and Scientific Research at Jouf University under grant No. DGSSR-2025-FC-01029.
Conflict of interest
The author(s) declared that this work was conducted in the absence of any commercial or financial relationships that could be construed as a potential conflict of interest.
Generative AI statement
The author(s) declared that generative AI was not used in the creation of this manuscript.
Any alternative text (alt text) provided alongside figures in this article has been generated by Frontiers with the support of artificial intelligence and reasonable efforts have been made to ensure accuracy, including review by the authors wherever possible. If you identify any issues, please contact us.
Publisher’s note
All claims expressed in this article are solely those of the authors and do not necessarily represent those of their affiliated organizations, or those of the publisher, the editors and the reviewers. Any product that may be evaluated in this article, or claim that may be made by its manufacturer, is not guaranteed or endorsed by the publisher.
Abbreviations
PDAC; Pancreatic ductal adenocarcinoma; PC; Pancreatic cancer; MRI; Magnetic resonance imaging; EUS; Endoscopic ultrasound; AI; Artificial intelligence; ML; Machine learning; DL; Deep learning; MSD; Medical Segmentation Decathlon.
References
1.
World Cancer Research Fund . Pancreatic cancer statistics. (2022). Available online at: https://www.wcrf.org/preventing-cancer/cancer-statistics/pancreatic-cancer-statistics/ (Accessed September 8, 2025).
2.
Research P; Precedence Research . Pancreatic Cancer Market Size, Share, and Trends 2024 to 2034. (2024). Available online at: https://www.precedenceresearch.com/pancreatic-cancer-market (Accessed October 9, 2025).
3.
Li X Zhang Y Yan Z Jiang W Rui S . Global, regional and national burden of pancreatic cancer and its attributable risk factors from 2019 to 2021, with projection to 2044. Front Oncol. (2025) 14:1521788. doi: 10.3389/fonc.2024.1521788
4.
Zottl J Sebesta CG Tomosel E Sebesta M Sebesta C . Unraveling the burden of pancreatic cancer in the 21st century: trends in incidence, mortality, survival, and key contributing factors. Cancers. (2025) 17:1607. doi: 10.3390/cancers17101607
5.
National Cancer Institute . Cancer Stat Facts: Pancreatic Cancer. (2025). Available online at: https://seer.cancer.gov/statfacts/html/pancreas.html (Accessed September 8, 2025).
6.
Olakowski M Bułdak Ł . Modifiable and non-modifiable risk factors for the development of non-hereditary pancreatic cancer. Medicina. (2022) 58:978. doi: 10.3390/medicina58080978
7.
Qadir MI Baril JA Yip-Schneider MT Schonlau D Tran TTT Schmidt CM et al . Artificial intelligence in pancreatic intraductal papillary mucinous neoplasm imaging: a systematic review. PLoS Digital Health. (2025) 4:e0000920. doi: 10.1371/journal.pdig.0000920
8.
Winstead E . Screening People at High Risk for Pancreatic Cancer May Help Them Live Longer. (2024). National Cancer Institute Cancer Currents Blog. Available online at: https://www.cancer.gov/news-events/cancer-currents-blog/2024/pancreatic-cancer-surveillance (Accessed September 8, 2025).
9.
Tehsin S Zameer S Saif S . Myeloma cell detection in bone marrow aspiration using microscopic images. In: 2019 11th International Conference on Knowledge and Smart Technology (KST) (2019). p. 57–61. doi: 10.1109/KST.2019.8687511
10.
Antony A Mukherjee S Bhinder K Murlidhar M Zarrintan A Goenka AH . Artificial intelligence-augmented imaging for early pancreatic cancer detection. Vis Med. (2025) 41:271–279. doi: 10.1159/000546603
11.
Podĭnă N Gheorghe EC Constantin A Cazacu I Croitoru V Gheorghe C et al . Artificial intelligence in pancreatic imaging: a systematic review. United Eur Gastroenterol J. (2025) 13:55–77. doi: 10.1002/ueg2.12723
12.
Yao L Zhang Z Keles E Yazici C Tirkes T Bagci U et al . review of deep learning and radiomics approaches for pancreatic cancer diagnosis from medical imaging. Curr Opin Gastroenterol. (2023) 39:436–47. doi: 10.1097/MOG.0000000000000966
13.
Mishra AK Chong B Arunachalam SP Oberg AL Majumder S . Machine learning models for pancreatic cancer risk prediction using electronic health record data-a systematic review and assessment. Am J Gastroenterol. (2024) 119:1466–82. doi: 10.14309/ajg.0000000000002870
14.
Zhang L Li D Su T Xiao T Zhao S . Effectiveness of radiomics-based machine learning models in differentiating pancreatitis and pancreatic ductal adenocarcinoma: systematic review and meta-analysis. J Med Internet Res. (2025) 27:e72420. doi: 10.2196/72420
15.
Cao K Xia Y Yao J Han X Lambert L Zhang T et al . Large-scale pancreatic cancer detection via non-contrast CT and deep learning. Nat Med. (2023) 29:3033–43. doi: 10.1038/s41591-023-02640-w
16.
Trends G Google LLC . Artificial Intelligence Search Trends (2015–2025). (2025). Available online at: https://trends.withgoogle.com/trends/us/artificial-intelligence-search-trends/ (Accessed October 9, 2025).
17.
Observatory OAP Organisation for Economic Co-operation; Development (OECD) . AI Publications by Country (2000–2025). (2025). Data from OpenAlex and Scopus. Available online at: https://oecd.ai/en/data (Accessed October 9, 2025).
18.
Ojha A Zhao SJ Akpunonu B Zhang JT Simo KA Liu JY . Gap-App: a sex-distinct AI-based predictor for pancreatic ductal adenocarcinoma survival as a web application open to patients and physicians. Cancer Lett. (2025) 622:217689. doi: 10.1016/j.canlet.2025.217689
19.
Modi N Kumar Y . Machine Learning Based Approaches to diagnosis and detection of cancerous and non-pancreatic cancerous conditions. In: 2024 OPJU International Technology Conference (OTCON) on Smart Computing for Innovation and Advancement in Industry 4.0 (2024). p. 1–5. doi: 10.1109/OTCON60325.2024.10687862
20.
Pandey P Mayank K Sharma S . Bio-marker cancer prediction system using artificial intelligence. In: 2023 International Conference on Integration of Computational Intelligent System (ICICIS) (2023). p. 1–5. doi: 10.1109/ICICIS56802.2023.10430291
21.
Hasan MU Nishat Khan F Jahan H Zaman Z Rahman MM . Predicting pancreatic cancer survival and staging: a machine learning approach. In: 2024 IEEE International Conference on Computing, Applications and Systems (COMPAS) (2024). p. 1–5. doi: 10.1109/COMPAS60761.2024.10797176
22.
Chen Q Cherry DR Nalawade V Qiao EM Kumar A Lowy AM et al . Clinical data prediction model to identify patients with early-stage pancreatic cancer. JCO Clin Cancer Inform. (2021) 5:279–87. doi: 10.1200/CCI.20.00137
23.
Muhammad W Hart GR Nartowt B Farrell JJ Johung K Liang Y et al . Pancreatic cancer prediction through an artificial neural network. Front Artif Intell. (2019) 2:2. doi: 10.3389/frai.2019.00002
24.
Chen SM Phuc PT Nguyen PA Burton W Lin SJ Lin WC et al . A novel prediction model of the risk of pancreatic cancer among diabetes patients using multiple clinical data and machine learning. Cancer Med. (2023) 12:19987–99. doi: 10.1002/cam4.6547
25.
Ravi KC Dixit RR T I Singh S Gopatoti A Yadav AS . AI-powered pancreas navigator: delving into the depths of early pancreatic cancer diagnosis using advanced deep learning techniques. In: 2023 9th International Conference on Smart Structures and Systems (ICSSS) (2023). p. 1–6. doi: 10.1109/ICSSS58085.2023.10407836
26.
Nasief H Zheng C Schott D Hall W Tsai S Erickson B et al . A machine learning based delta-radiomics process for early prediction of treatment response of pancreatic cancer. NPJ Prec Oncol. (2019) 3:25. doi: 10.1038/s41698-019-0096-z
27.
Mukherjee S Patra A Khasawneh H Korfiatis P Rajamohan N Suman G et al . Radiomics-based machine-learning models can detect pancreatic cancer on prediagnostic computed tomography scans at a substantial lead time before clinical diagnosis. Gastroenterology. (2022) 163:1435–1446.e3. doi: 10.1053/j.gastro.2022.06.066
28.
Toyama Y Hotta M Motoi F Takanami K Minamimoto R Takase K . Prognostic value of FDG-PET radiomics with machine learning in pancreatic cancer. Sci Rep. (2020) 10:17024. doi: 10.1038/s41598-020-73237-3
29.
Yokoyama S Hamada T Higashi M Matsuo K Maemura K Kurahara H et al . Predicted prognosis of patients with pancreatic cancer by machine learning. Clin Cancer Res. (2020) 26:2411–21. doi: 10.1158/1078-0432.CCR-19-1247
30.
Ozkan M Cakiroglu M Kocaman O Kurt M Yilmaz B Can G et al . Age-based computer-aided diagnosis approach for pancreatic cancer on endoscopic ultrasound images. Endosc Ultrasound. (2016) 5:101–7. doi: 10.4103/2303-9027.180473
31.
Dodda K Muneeswari G . IANFIS: a machine learning-based optimized technique for the classification and segmentation of pancreatic cancer. Res Biomed Eng. (2024) 40:373–85. doi: 10.1007/s42600-024-00352-9
32.
Blyuss O Zaikin A Cherepanova V Munblit D Kiseleva EM Prytomanova OM et al . Development of PancRISK, a urine biomarker-based risk score for stratified screening of pancreatic cancer patients. Br J Cancer. (2020) 122:692–6. doi: 10.1038/s41416-019-0694-0
33.
Zou X Wei J Huang Z Zhou X Lu Z Zhu W et al . Identification of a six-miRNA panel in serum benefiting pancreatic cancer diagnosis. Cancer Med. (2019) 8:2810–22. doi: 10.1002/cam4.2145
34.
Karar ME El-Fishawy N Radad M . Automated classification of urine biomarkers to diagnose pancreatic cancer using 1-D convolutional neural networks. J Biol Eng. (2023) 17:28. doi: 10.1186/s13036-023-00340-0
35.
Kinugasa H Nouso K Miyahara K Morimoto Y Dohi C Tsutsumi K et al . Detection of K-ras gene mutation by liquid biopsy in patients with pancreatic cancer. Cancer. (2015) 121:2271–80. doi: 10.1002/cncr.29364
36.
Cohen JD Javed AA Thoburn C Wong F Tie J Gibbs P et al . Combined circulating tumor DNA and protein biomarker-based liquid biopsy for the earlier detection of pancreatic cancers. Proc Nat Acad Sci. (2017) 114:10202–7. doi: 10.1073/pnas.1704961114
37.
Pietrasz D Pécuchet N Garlan F Didelot A Dubreuil O Doat S et al . Plasma circulating tumor DNA in pancreatic cancer patients is a prognostic marker. Clin Cancer Res. (2017) 23:116–23. doi: 10.1158/1078-0432.CCR-16-0806
38.
Hadano N Murakami Y Uemura K Hashimoto Y Kondo N Nakagawa N et al . Prognostic value of circulating tumour DNA in patients undergoing curative resection for pancreatic cancer. Br J Cancer. (2016) 115:59–65. doi: 10.1038/bjc.2016.175
39.
Allenson K Castillo J San Lucas F Scelo G Kim D Bernard V et al . High prevalence of mutantKRAS in circulating exosome-derived DNA from early-stage pancreatic cancer patients. Ann Oncol. (2017) 28:741–7. doi: 10.1093/annonc/mdx004
40.
Ankeny J Court C Hou S Li Q Song M Wu D et al . Circulating tumour cells as a biomarker for diagnosis and staging in pancreatic cancer. Br J Cancer. (2016) 114:1367–75. doi: 10.1038/bjc.2016.121
41.
O'Brien DP Sandanayake NS Jenkinson C Gentry-Maharaj A Apostolidou S Fourkala EO et al . Serum CA19-9 is significantly upregulated up to 2 years before diagnosis with pancreatic cancer: implications for early disease detection. Clin Cancer Res. (2015) 21:622–31. doi: 10.1158/1078-0432.CCR-14-0365
42.
Madhavan B Yue S Galli U Rana S Gross W Müller M et al . Combined evaluation of a panel of protein and miRNA serum-exosome biomarkers for pancreatic cancer diagnosis increases sensitivity and specificity. Int J Cancer. (2015) 136:2616–27. doi: 10.1002/ijc.29324
43.
Luo G Liu C Guo M Cheng H Lu Y Jin K et al . Potential biomarkers in Lewis negative patients with pancreatic cancer. Ann Surg. (2017) 265:800–5. doi: 10.1097/SLA.0000000000001741
44.
Kanno A Masamune A Hanada K Maguchi H Shimizu Y Ueki T et al . Multicenter study of early pancreatic cancer in Japan. Pancreatology. (2018) 18:61–7. doi: 10.1016/j.pan.2017.11.007
45.
Hattori N Yamada S Torii K Takeda S Nakamura K Tanaka H et al . Effectiveness of plasma treatment on pancreatic cancer cells. Int J Oncol. (2015) 47:1655–62. doi: 10.3892/ijo.2015.3149
46.
Liu KL Wu T Chen PT Tsai YM Roth H Wu MS et al . Deep learning to distinguish pancreatic cancer tissue from non-cancerous pancreatic tissue: a retrospective study with cross-racial external validation. Lancet Digital Health. (2020) 2:e303–13. doi: 10.1016/S2589-7500(20)30078-9
47.
Shnawa AH Mohammed G Hadi MR Ibrahim K Adnan MM Hameed W . Optimal elman neural network for pancreatic cancer classification using computed tomography images. In: 2023 6th International Conference on Engineering Technology and its Applications (IICETA) (2023). p. 689–695. doi: 10.1109/IICETA57613.2023.10351360
48.
Bhargavi K Prasad ML G A Shaker Reddy PC Yuvalatha S Triveni MN . An enhanced diagnostic system using deep learning for early prediction of pancreatic cancer. In: 2024 10th International Conference on Electrical Energy Systems (ICEES) (2024). p. 1–6. doi: 10.1109/ICEES61253.2024.10776830
49.
Alaca Y Akmeşe ÖF . Pancreatic tumor detection from CT images converted to graphs using whale optimization and classification algorithms with transfer learning. Int J Imag Syst Technol. (2025) 35:e70040. doi: 10.1002/ima.70040
50.
Singh J Akurati M Anandaram H Balakrishna C Al-Fatlawy R Ansari SA . Stage-specific prognostic modeling for pancreatic cancer using convolutional neural networks. In: 2024 International Conference on Artificial Intelligence and Emerging Technology (Global AI Summit) (2024). p. 90–94. doi: 10.1109/GlobalAISummit62156.2024.10947991
51.
Kavak F Bora S Kantarci A Uğur A Cagaptay S Gokcay D et al . Diagnosis of pancreatic ductal adenocarcinoma using deep learning. Sensors. (2024) 24:7005. doi: 10.3390/s24217005
52.
Li X Guo R Zhu H Chen T Qian X . A causality-informed graph intervention model for pancreatic cancer early diagnosis. IEEE Trans Artif Intell. (2024) 5:4675–85. doi: 10.1109/TAI.2024.3395586
53.
Li X Guo R Lu J Chen T Qian X . Causality-driven graph neural network for early diagnosis of pancreatic cancer in non-contrast computerized tomography. IEEE Trans Med Imaging. (2023) 42:1656–67. doi: 10.1109/TMI.2023.3236162
54.
Abirami S Chelliah BJ . Early prediction of pancreatic malignancy by using deep learning techniques. In: 2024 Third International Conference on Electrical, Electronics, Information and Communication Technologies (ICEEICT). IEEE (2024). p. 1–7. doi: 10.1109/ICEEICT61591.2024.10718637
55.
Dinesh M Bacanin N Askar S Abouhawwash M . Diagnostic ability of deep learning in detection of pancreatic tumour. Sci Rep. (2023) 13:9725. doi: 10.1038/s41598-023-36886-8
56.
Ramaekers M Viviers CG Hellström TA Ewals LJ Tasios N Jacobs I et al . Improved pancreatic cancer detection and localization on CT scans: a computer-aided detection model utilizing secondary features. Cancers. (2024) 16:2403. doi: 10.3390/cancers16132403
57.
Abel L Wasserthal J Weikert T Sauter AW Nesic I Obradovic M et al . Automated detection of pancreatic cystic lesions on CT using deep learning. Diagnostics. (2021) 11:901. doi: 10.3390/diagnostics11050901
58.
Gao E Jiang H Zhou Z Yang C Chen M Zhu W et al . Automatic multi-tissue segmentation in pancreatic pathological images with selected multi-scale attention network. Comput Biol Med. (2022) 151:106228. doi: 10.1016/j.compbiomed.2022.106228
59.
Du Y Zuo X Liu S Cheng D Li J Sun M et al . Segmentation of pancreatic tumors based on multi-scale convolution and channel attention mechanism in the encoder-decoder scheme. Med Phys. (2023) 50:7764–78. doi: 10.1002/mp.16561
60.
Viriyasaranon T Chun JW Koh YH Cho JH Jung MK Kim SH et al . Annotation-efficient deep learning model for pancreatic cancer diagnosis and classification using CT images: a retrospective diagnostic study. Cancers. (2023) 15:3392. doi: 10.3390/cancers15133392
61.
Lyu P Neely B Solomon J Rigiroli F Ding Y Schwartz FR et al . Effect of deep learning image reconstruction in the prediction of resectability of pancreatic cancer: diagnostic performance and reader confidence. Eur J Radiol. (2021) 141:109825. doi: 10.1016/j.ejrad.2021.109825
62.
Suneetha M Kalhara G Krishna MV Chandana KNS Snigdha VLS . Pancreatic cancer prediction through convolutional neural networks. In: 2023 7th International Conference on Intelligent Computing and Control Systems (ICICCS). IEEE (2023). p. 602–607. doi: 10.1109/ICICCS56967.2023.10142618
63.
Zavalsız MT Alhajj S Sailunaz K Özyer T Alhajj R . Pancreatic tumor detection by convolutional neural networks. In: 2022 International Arab Conference on Information Technology (ACIT). IEEE (2022). p. 1–6. doi: 10.1109/ACIT57182.2022.9994181
64.
Juwita J Hassan GM Akhtar N Datta A . MMPU-Net: A parameter-efficient network for fine-stage of pancreas and pancreas-tumor segmentation on CT scans. Biomed Signal Process Control. (2025) 110:108224. doi: 10.1016/j.bspc.2025.108224
65.
Vinod RG Kumar MA Chowdary CV Suvarchala K . Classification of pancreatic cancer using kolmogorov-arnold networks: an upgrade on traditional machine learning for medical classification. In: 2025 6th International Conference on Mobile Computing and Sustainable Informatics (ICMCSI). IEEE (2025). p. 961–969. doi: 10.1109/ICMCSI64620.2025.10883622
66.
Pravamanjari A Swain S Mallick PK . Advanced detection and classification of pancreatic cancer in CT images using swin transformer architecture. In: 2025 International Conference on Emerging Systems and Intelligent Computing (ESIC). IEEE (2025). p. 288–293. doi: 10.1109/ESIC64052.2025.10962786
67.
G V Prathibha S . Transformers with temporal enhanced attention over graphs for accurate identification of pancreatic cancer. In: 2025 3rd IEEE International Conference on Industrial Electronics: Developments & Applications (ICIDeA) (2025). p. 1–6. doi: 10.1109/ICIDeA64800.2025.10962937
68.
Cao L Li J Chen S . Multi-target segmentation of pancreas and pancreatic tumor based on fusion of attention mechanism. Biomed Signal Process Control. (2023) 79:104170. doi: 10.1016/j.bspc.2022.104170
69.
Dong K Hu P Zhu Y Tian Y Li X Zhou T et al . Attention-enhanced multiscale feature fusion network for pancreas and tumor segmentation. Med Phys. (2024) 51:8999–9016. doi: 10.1002/mp.17385
70.
He P Kong QQ Chen Y Shao CB Su Z . Pancreas segmentation based on multi-stage attention enhanced U-Net. Int J Imag Syst Technol. (2025) 35:e70025. doi: 10.1002/ima.70025
71.
Zeng L Li X Yang X Chen W Liu J Shen L et al . SCPMan: shape context and prior constrained multi-scale attention network for pancreatic segmentation. Expert Syst Appl. (2024) 252:124070. doi: 10.1016/j.eswa.2024.124070
72.
Sun G Pan Y Kong W Xu Z Ma J Racharak T et al . DA-TransUNet: integrating spatial and channel dual attention with transformer U-net for medical image segmentation. Front Bioeng Biotechnol. (2024) 12:1398237. doi: 10.3389/fbioe.2024.1398237
73.
Shen C Roth HR Hayashi Y Oda M Sato G Miyamoto T et al . Anatomical attention can help to segment the dilated pancreatic duct in abdominal CT. Int J Comput Assist Radiol Surg. (2024) 19:655–64. doi: 10.1007/s11548-023-03049-z
74.
Mahendran RK Aniruddhan P Kumar P . PancreasNet: a transformer-based progressive residual network for comprehensive pancreatic cancer detection using CT images. In: 2025 International Conference on Wireless Communications Signal Processing and Networking (WiSPNET). IEEE (2025). p. 1–12. doi: 10.1109/WiSPNET64060.2025.11004859
75.
Tian H Zhang B Zhang Z Xu Z Jin L Bian Y et al . DenseNet model incorporating hybrid attention mechanisms and clinical features for pancreatic cystic tumor classification. J Appl Clin Med Phys. (2024) 25:e14380. doi: 10.1002/acm2.14380
76.
Heo J Lee HB Kim S Lee J Kim KJ Yang E et al . Uncertainty-aware attention for reliable interpretation and prediction. In: Advances in Neural Information Processing Systems. (2018). p. 31.
77.
Li J Yang Y Shen N Gao H . Diagnosis of lymph node metastasis of pancreatic cancer based on feature extraction and information fusion. In: 2025 6th International Conference on Computer Vision, Image and Deep Learning (CVIDL). IEEE (2025). p. 180–183. doi: 10.1109/CVIDL65390.2025.11085864
78.
Alaca Y . Machine learning via DARTS-Optimized MobileViT models for pancreatic Cancer diagnosis with graph-based deep learning. BMC Med Inform Decis Mak. (2025) 25:81. doi: 10.1186/s12911-025-02923-x
79.
Wu Y Fang P Wang X Shen J . Predicting pancreatic diseases from fundus images using deep learning. Vis Comput. (2025) 41:3553–64. doi: 10.1007/s00371-024-03619-5
80.
Chen ZM Liao Y Zhou X Yu W Zhang G Ge Y et al . Pancreatic cancer pathology image segmentation with channel and spatial long-range dependencies. Comput Biol Med. (2024) 169:107844. doi: 10.1016/j.compbiomed.2023.107844
81.
Oktay O Schlemper J Folgoc LL Lee M Heinrich M Misawa K et al . Attention u-net: learning where to look for the pancreas. arXiv preprint arXiv:180403999. (2018).
82.
Chen PT Wu T Wang P Chang D Liu KL Wu MS et al . Pancreatic cancer detection on CT scans with deep learning: a nationwide population-based study. Radiology. (2023) 306:172–82. doi: 10.1148/radiol.220152
83.
Thanya T Jeslin T . DeepOptimalNet: optimized deep learning model for early diagnosis of pancreatic tumor classification in CT imaging. Abdom Radiol. (2025) 50:4181–4211. doi: 10.1007/s00261-025-04860-9
84.
Yu X Wang Y Wang Y Feng J Fan S Li C . Combining multimodal medical imaging and artificial intelligence for the early diagnosis of pancreatic cancer. Front Med. (2025) 12:1631671. doi: 10.3389/fmed.2025.1631671
Summary
Keywords
attention, deep learning, early detection, multi-modal fusion, pancreatic ductal adenocarcinoma, radiomics, transformers
Citation
Almufareh MF, Tehsin S, Humayun M, Kausar S, Farooq A, Aldossary H and Aljohani A (2026) From radiomics to transformers in pancreatic cancer detection and prognosis. Front. Med. 12:1731922. doi: 10.3389/fmed.2025.1731922
Received
24 October 2025
Revised
26 November 2025
Accepted
04 December 2025
Published
09 January 2026
Volume
12 - 2025
Edited by
Surbhi Bhatia Khan, University of Salford, United Kingdom
Reviewed by
Meenakshi Mittal, Central University of Punjab, India
Vikas Verma, Lovely Professional University, India
Updates
Copyright
© 2026 Almufareh, Tehsin, Humayun, Kausar, Farooq, Aldossary and Aljohani.
This is an open-access article distributed under the terms of the Creative Commons Attribution License (CC BY). The use, distribution or reproduction in other forums is permitted, provided the original author(s) and the copyright owner(s) are credited and that the original publication in this journal is cited, in accordance with accepted academic practice. No use, distribution or reproduction is permitted which does not comply with these terms.
*Correspondence: Maram Fahaad Almufareh, mfalmufareh@ju.edu.sa; Mamoona Humayun, Mamoona.Humayun@roehampton.ac.uk
Disclaimer
All claims expressed in this article are solely those of the authors and do not necessarily represent those of their affiliated organizations, or those of the publisher, the editors and the reviewers. Any product that may be evaluated in this article or claim that may be made by its manufacturer is not guaranteed or endorsed by the publisher.