Abstract
Background and aims:
Numerous risk-prediction models for hepatic encephalopathy (HE) after TIPS have been proposed, but their quality, discrimination, and clinical utility remain uncertain. We aimed to identify key predictors of post-TIPS HE and to critically appraise existing models.
Methods:
We performed a systematic review and meta-analysis of observational studies (inception 15 July 2025) from Chinese (VIP, Wanfang, CNKI, and CBM) and international (Embase, PubMed, Web of Science, and Cochrane Library) databases. Model quality and bias were assessed via PROBAST. Pooled AUCs and predictor effect sizes were calculated using STATA 15.0 and MedCalc.
Results:
A total of 24 studies (5,197 patients) yielded 32 unique models; the incidence of HE ranged from 19.9 to 46.6%. Discrimination was generally good (AUC range, 0.64–1.00; 30 models >0.70; 22 > 0.80). PROBAST flagged high bias—especially in model analysis. A meta-analysis produced a summary AUC of 0.815 (95%CI, 0.780–0.849). Consistent predictors (p < 0.01) included older age, diabetes, higher Child-Pugh score/class, elevated ammonia, and increased portal-to-splenic vein diameter ratio.
Conclusion:
Existing post-TIPS HE models demonstrate strong discrimination but suffer methodological limitations and bias. Future studies should employ multicenter cohorts, harmonized definitions, rigorous analytics, and external validation to yield robust, clinically actionable tools.
Systematic review registration:
https://www.crd.york.ac.uk/PROSPERO/view/CRD42024597699, CRD42024597699.
1 Introduction
Transjugular intrahepatic portosystemic shunt (TIPS) is an image-guided intervention that creates a low-resistance channel between the portal and hepatic veins to lower portal pressure in patients with portal hypertension-related liver disease (1). Originally introduced in the 1980s, TIPS has become a mainstay in tertiary centers for controlling variceal hemorrhage and refractory ascites (2, 3). Beyond hemostasis and fluid management, growing data indicate that TIPS confers long-term benefits, such as improved survival, fewer readmissions, and enhanced nutritional status and quality of life in advanced cirrhosis (4–7).
However, these gains must be balanced against the risk of hepatic encephalopathy (HE), the most frequent neurologic complication post-TIPS, which affects 23–54.5% of patients within 6 months (8, 9). HE—from mild cognitive decline to coma—drives morbidity, prolongs hospitalization, and elevates mortality (10, 11). Despite advances in peri-procedural care, post-TIPS HE remains unpredictable and may offset the procedure’s overall benefit.
Researchers have thus developed multivariable models—combining clinical parameters, imaging markers, and biochemical biomarkers—to stratify HE risk after TIPS. However, their methodological rigor, discrimination, and applicability across heterogeneous cohorts remain unexamined. We therefore performed a systematic review of post-TIPS HE prediction tools, critically appraising model development, validation methods, and key performance indices. By comparing their strengths and limitations, we provide hepatologists and interventional radiologists practical, evidence-based recommendations for integrating these tools into patient selection and peri-procedural management.
2 Materials and methods
This review adhered to the PRISMA 2020 statement (12), and its protocol was prospectively registered in PROSPERO (CRD42024597699).
2.1 Search strategy
We searched Chinese (VIP, Wanfang, CNKI, and CBM) and English (Embase, PubMed, Web of Science, and Cochrane Library) databases from inception to 15 July 2025 using MeSH and free-text terms for TIPS (“transjugular intrahepatic portosystemic shunt,” “portasystemic shunt,” and “transjugular intrahepatic”), HE (“hepatic encephalopathy” and “ammoniac encephalopathy”), and risk models (“nomogram,” “prediction model*,” and “risk assessment*”). Database-specific search syntax was applied, and reference lists of included studies and reviews were manually searched. Full search strategies are provided in the Supplementary materials.
We applied the PICOTS framework according to Checklist for Critical Appraisal and Data Extraction for Systematic Reviews of Prediction Modeling Studies (CHARMS) (13) to guide objective formulation, search strategy, and study selection (14).
P: Adults (≥18 years) undergoing TIPS for portal-hypertension complications.
I: Published risk-prediction models for post-TIPS HE.
C: Not applicable (no head-to-head model comparisons).
O: Development of hepatic encephalopathy.
T: Predictions based on baseline demographics, clinical scores, and laboratory data.
S: Models intended to yield individualized HE risk estimates to inform clinical decision-making and preventive measures.
2.2 Include inclusion and exclusion criteria
The inclusion criteria were as follows:
(1) Adults (≥18 years) undergoing TIPS; (2) studies developing HE risk-prediction models; (3) prospective or retrospective study design; and (4) published in English or Chinese.
The exclusion criteria were as follows:
(1) Duplicate publications; (2) models derived from systematic reviews or meta-analyses; (3) studies without full-text access or with insufficient abstract information; (4) studies from which relevant data could not be extracted; (5) conference abstracts, theses, and other unpublished materials; and (6) studies that analyzed risk factors without constructing predictive models.
2.3 Literature screening and data extraction
Study selection followed PRISMA guidelines. After de-duplication in Zotero, titles and abstracts were screened against our inclusion/exclusion criteria. Two reviewers then independently reviewed full texts for eligibility. Data were extracted into a CHARMS-based template and managed in Excel. Any discrepancies were resolved by discussion or, if required, by a third reviewer.
2.4 Quality evaluation of literature
Risk of bias and applicability were assessed using PROBAST (15). Bias was judged across four domains (participants, predictors, outcomes, and analysis) via 20 signaling questions: studies with all domains rated “low” were deemed low-risk, whereas any “high” or “unclear” rating conferred high overall risk. Applicability was evaluated in three domains (participants, predictors, and outcomes), with any “high” concern indicating poor applicability. Two independent reviewers performed all assessments; disagreements were resolved by discussion or, if needed, third-party adjudication.
2.5 Data synthesis and statistical analysis
Meta-analyses were performed in Stata 15.0, with between-study heterogeneity evaluated by the Q test and I2 statistic. A fixed-effects model was used when the p-value was >0.1 and I2 was <50%; otherwise, a random-effects model was applied. Predictors exhibiting substantial heterogeneity underwent sensitivity analyses to assess robustness and explore heterogeneity sources. Statistical significance was defined as a p-value of <0.05. Model discrimination was quantified by pooling AUCs in MedCalc; when only 95% CIs were reported, standard errors were derived by dividing the CI width by 3.92 (16).
3 Results
3.1 Study selection
Figure 1 presents the PRISMA 2020 diagram, which outlines the detailed literature search methodology and outcomes.
Figure 1

Flowchart depicting the systematic review’s literature search and selection based on PRISMA standards.
The systematic search yielded 1,177 records; after removing 367 duplicates, 810 titles and abstracts were screened. Of these, 53 full texts were assessed for eligibility. Fourteen studies lacked predictive models, 16 were conference abstracts, and two were unavailable in full text. Ultimately, 24 studies satisfied all criteria and were included in the review.
3.2 Study characteristics
A total of 24 studies (16–39) were included (9 in Chinese, 15 in English), comprising 13 case–control, 7 retrospective cohort, and 1 prospective cohort design. Sample sizes ranged from 53 to 621 participants. Key characteristics are summarized in Table 1.
Table 1
| Author (year) | Country | Study design | Population | Follow-up time (month) | Sample size | Outcome | HE incidence |
|---|---|---|---|---|---|---|---|
| Li Yinglong* (2020) (17) | China | Retrospective study | 1 | 1–39 | 262 | HE | 34.70% |
| Huang Tingping* (2022) (18) | China | Retrospective study | 1 | 12 | 53 | HE | 26.40% |
| Li Xinyi* (2024) (19) | China | Retrospective study | 1 | 6 | 113 | HE | 28.32% |
| Yong Liao (2023) (20) | China | Retrospective study | 1 | 12 | 296 | HE | 19.93% |
| Yang Yang (2021) (16) | China | Retrospective study | 1 | 12 | 185 | HE | 30.27% |
| Kejia Li (2024) (21) | China | Retrospective study | 1 | 45.8 | 132 | HE | 28.03% |
| Yang Yang (2022) (22) | China | Retrospective study | 1 | 12 | 191 | HE | 26.70% |
| Okan İnce (2023) (23) | The United States | Retrospective study | 1 | 1 | 327 | HE | 32.11% |
| Sihang Cheng (2024) (24) | China | Retrospective study | 1 | 12 | 130 | HE | 23.85% |
| Chongtu Yang (2022) (25) | China | Retrospective study | 2 | 12 | 276 | HE | 22.10% |
| Sihang Cheng (2022) (26) | China | Retrospective study | 1 | None | 106 | HE | 22.64% |
| Xiaochun Yin (2020) (27) | China | Retrospective study | 1 | 12 | 373 | HE | 31.37% |
| Huan Tong (2021) (28) | China | Retrospective study | 1 | 26 | 361 | HE | 20.22% |
| Xiaoqiong Chen (2024) (29) | China | Retrospective study | 1 | 12 | 621 | HE | 30.27% |
| Yuan Wei* (2021) (30) | China | Retrospective study | 1 | 3 | 108 | HE | 37.96% |
| Zhuo Songbo* (2023) (31) | China | Retrospective study | 1 | 3 | 263 | HE | 22.05% |
| Yu Xiang* (2021) (32) | China | Retrospective study | 2 | 12–70 | 106 | HE | 22.64% |
| Zhang Wenjing* (2024) (33) | China | Retrospective study | 1 | 6 | 87 | HE | 31.03% |
| Wang Lanjing* (2024) (34) | China | Retrospective study | 1 | 6 | 302 | HE | 21.52% |
| Silvia Nardelli (2016) (35) | Italy | Prospective study | 2 | 6 | 82 | HE | 42.68% |
| Chuhan Wang (2023) (36) | China | Retrospective study | 2 | 12 | 191 | HE | 46.60% |
| Chang Peng* (2025) (39) | China | Retrospective study | 1 | 3 | 290 | HE | 29.31% |
| DeJia Liu (2025) (38) | China | Retrospective study | 1 | 12 | 218 | HE | 15.1% |
| Gianvincenzo Sparacia (2025) (37) | Italy | Retrospective study | 2 | None | 124 | HE | 30.6% |
Basic characteristics of studies included.
*Published in China; (1) Patients with liver cirrhosis and portal hypertension; (2) Patients with liver cirrhosis; HE, hepatic encephalopathy.
Among 24 studies, AUC ranged from 0.64 to 1.00 (Figure 2). Except for one study, all retained continuous predictors, with variable selection by stepwise regression (n = 1), univariate → multivariate analysis (n = 16), or LASSO (n = 4). Missing data were variably addressed—multiple imputation without case count (n = 1), exclusion after reporting missingness (n = 1), or complete-case analysis (n = 10). Most models employed logistic regression (n = 16), with four using hybrid machine-learning approaches (e.g., random forest, SVM, and CatBoost), one using random forest alone, two using Cox models, and one using a competing-risks Cox model. Calibration was evaluated by both Hosmer–Lemeshow and calibration plots (n = 5), calibration plots alone (n = 7), while ten studies did not report any calibration assessment.
Figure 2
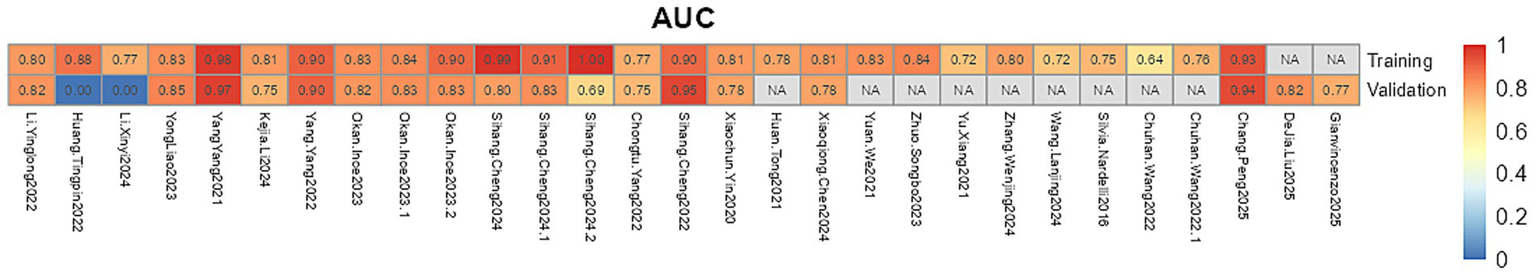
The AUC values of the prediction model.
3.3 Models validation
Regarding validation, three studies performed both internal and external validation, twelve conducted internal validation only, and one reported external validation alone. The remaining studies did not perform any form of validation. Key model characteristics are summarized in Table 2.
Table 2
| Author (year) | Modeling methods | Variable screening method | Modeling methods | EPV | AUC (training/validation) | Model validation method | Model calibration method | Missing data processing method | Continuous data processing method | Model presentation |
|---|---|---|---|---|---|---|---|---|---|---|
| Li Yinglong* (2020) (17) | Classification model | Single-factor analysis | LR | 30.333 | 0.805/0.816 | Internal validation | Hosmer Lemeshow test, Calibration plot | Exclusion included | Continuous variable | Nomogram |
| Huang Tingping* (2022) (18) | Classification model | Single-factor analysis | LR, SVM, RF | 4.667 | 0.770/− | – | Hosmer Lemeshow test, Calibration plot | – | Continuous variable | Nomogram |
| Li Xinyi* (2024) (19) | Classification model | Single-factor analysis | LR | 8.000 | 0.875/− | Internal validation | – | – | Continuous variable | – |
| Yong Liao (2023) (20) | Classification model | Single-factor analysis | LR | 11.800 | 0.828/0.846 | Internal validation (Bootstrap) | Calibration plot | Exclusion included | Continuous variable | Nomogram |
| Yang Yang (2021) (16) | Classification model | Single-factor analysis | LR | 14.000 | 0.978/0.969 | Internal validation | Calibration plot | Exclusion included | Continuous variable | Nomogram |
| Kejia Li (2024) (21) | Prognostic model | Single-factor analysis | Cox regression | 12.333 | 0.806/0.751 | Internal validation | Calibration plot | - | Continuous variable | Nomogram |
| Yang Yang (2022) (22) | Classification model | Lasso regression, backward selection | LR | 7.286 | 0.901/0.903 | Internal validation | Hosmer Lemeshow test, Calibration plot | Exclusion included | Continuous variable | Nomogram |
| Okan İnce (2023) (23) | Classification model | Single-factor analysis | LR, SVM, CatBoost | 15.000 | SVM: 0.830/0.820 LR: 0.840/0.830 CATBOOST: 0.900/0.830 | Internal validation (K-fold cross validation) | – | Exclusion included | Continuous variable | – |
| Sihang Cheng (2024) (24) | Classification model | Single-factor analysis, lasso regression | LR, SVM, RF | 2.818 | SVM: 0.990/0.800 LR: 0.910/0.830 RF: 1.000/0.690 | External validation | – | Exclusion included | Continuous variable | – |
| Chongtu Yang (2022) (25) | Classification model | Lasso regression | LR | 15.250 | 0.770/0.750 | External verification | Hosmer Lemeshow test, Calibration plot, Brier score | Multiple interpolation | Continuous variable | Nomogram |
| Sihang Cheng (2022) (26) | Classification model | – | LR | 6.000 | 0.899/0.955 | Internal validation (K-fold cross validation) | – | – | Continuous variable | – |
| Xiaochun Yin (2020) (27) | Prognostic model | Single-factor analysis | Cox regression | 23.400 | 0.809/0.783 | Internal validation (Bootstrap) | Calibration plot | Exclusion included | Continuous variable | Nomogram |
| Huan Tong (2021) (28) | Classification model | Single-factor analysis | LR | 12.167 | 0.783/− | Internal validation | – | censored-data analysis | Continuous variable | Formula of risk score |
| Xiaoqiong Chen (2024) (29) | Classification model | Lasso regression | LR | 47.000 | 0.814/0.781 | External validation | Calibration plot | Exclusion included | Continuous variable | Web calculator |
| Yuan Wei* (2021) (30) | Classification model | Single-factor analysis | LR | 13.667 | 0.828/− | – | Calibration plot | – | Continuous variable | Formula of risk score |
| Zhuo Songbo* (2023) (31) | Classification model | Single-factor analysis | LR | 11.600 | 0.841/− | – | – | – | Continuous variable | Formula of risk score |
| Yu Xiang* (2021) (32) | Classification model | Single-factor analysis | LR | 12.000 | 0.723/− | – | – | – | Continuous variable | Formula of risk score |
| Zhang Wenjing* (2024) (33) | Classification model | Single-factor analysis | LR | 13.500 | 0.800/− | – | – | Exclusion included | Continuous variable | Formula of risk score |
| Wang Lanjing* (2024) (34) | Classification model | Single-factor analysis | LR | 16.250 | 0.716/− | – | – | – | Continuous variable | Nomogram |
| Silvia Nardelli (2016) (35) | Prognostic model | Single-factor analysis | Fine-Gray test | 11.667 | 0.750/− | – | – | – | Continuous variable | Formula of risk score |
| Chuhan Wang (2022) (36) | Classification model | Single-factor analysis | LR | 22.250 | Model 1: 0.64/− Model 2: 0.76/− |
– | Calibration plot | Exclusion included | Categorical variables | Nomogram |
| Chang Peng* (2025) (39) | Classification model | Lasso regression | LR | 8.500 | 0.933/0.944 | Internal validation | Hosmer Lemeshow test | – | Continuous variable | Nomogram |
| DeJia Liu (2025) (38) | Classification model | Single-factor analysis | LR, RF, XGBoost | 11.000 | −/0.825 | Internal validation | Hosmer Lemeshow test, Calibration plot, Brier score | – | Continuous variable | SHAP |
| Gianvincenzo Sparacia (2025) (37) | Classification model | Principal component analysis | MLP, RF, SVC, DT | 3.800 | KNN: −/0.77 | Internal validation | – | – | Continuous variable | – |
Basic features of the prediction models of the included studies.
*Published in China; –, Not reported in the literature; LR, Logistic regression; SVM, Support vector machine; RF, Random forest; MLP, Multilayer perceptron; KNN, K-nearest neighbor; SVC, Support vector classifier; DT, Decision tree.
3.4 Results of quality assessment
PROBAST was used to evaluate bias and applicability across the 24 studies (Table 3). (1) Participants: Four case–control studies (18, 21, 22, 26) were judged high risk; nested case–control and cohort designs were low risk. (2) Predictors: Four studies (16, 23, 28, 36) were high risk because not all predictors were available at model use; in twelve studies (17–19, 21, 22, 25, 26, 30, 31, 33, 34, 37) predictor definitions or timing were insufficiently reported, yielding unclear risk. (3) Outcome: Thirteen studies (17–19, 21–26, 28, 30, 32, 33) had unclear risk because it was not specified whether outcome assessment was blinded to predictors or the interval between predictor and outcome measurement. (4) Analysis: Ten studies (16, 17, 20, 22–24, 27–29, 33, 36) used complete-case analysis; one (25) study used multiple imputation and the remaining study did not report methods for handling missing data or adjusting for overfitting, resulting in unclear or high risk.
Table 3
| Author (year) | Study type | ROB | Applicability | Overall | ||||||
|---|---|---|---|---|---|---|---|---|---|---|
| Participants | Predictors | Outcome | Analysis | Participants | Predictors | Outcome | ROB | Applicability | ||
| Li Yinglong* (2020) (17) | B | + | ? | ? | − | + | ? | + | − | ? |
| Huang Tingping* (2022) (18) | A | − | ? | ? | − | + | + | ? | − | ? |
| Li Xinyi* (2024) (19) | A | + | ? | ? | − | + | ? | + | − | ? |
| Yong Liao (2023) (20) | B | + | − | + | − | + | + | + | − | + |
| Yang Yang (2021) (16) | B | + | + | + | − | + | + | + | − | + |
| Kejia Li (2024) (21) | B | − | ? | ? | − | − | ? | + | − | − |
| Yang Yang (2022) (22) | B | − | ? | ? | − | − | ? | + | − | − |
| Okan İnce (2023) (23) | B | + | − | ? | − | + | ? | ? | − | ? |
| Sihang Cheng (2024) (24) | B | + | + | ? | − | + | + | + | − | + |
| Chongtu Yang (2022) (25) | B | + | ? | ? | − | + | ? | + | − | ? |
| Sihang Cheng (2022) (26) | B | − | ? | ? | − | + | + | ? | − | ? |
| Xiaochun Yin (2020) (27) | B | + | + | + | − | + | + | + | − | + |
| Huan Tong (2021) (28) | A | + | − | ? | − | + | ? | + | − | ? |
| Xiaoqiong Chen (2024) (29) | B | + | + | + | − | + | + | + | − | + |
| Yuan Wei* (2021) (30) | A | + | ? | ? | − | + | ? | + | − | ? |
| Zhuo Songbo* (2023) (31) | A | + | ? | + | − | + | ? | + | − | ? |
| Yu Xiang* (2021) (32) | A | + | + | ? | − | + | + | ? | − | ? |
| Zhang Wenjing* (2024) (33) | A | + | ? | ? | − | + | ? | + | − | ? |
| Wang Lanjing* (2024) (34) | A | + | ? | + | − | + | ? | + | − | ? |
| Silvia Nardelli (2016) (35) | A | + | + | + | − | + | + | + | − | + |
| Chuhan Wang (2022) (36) | A | + | − | + | − | + | + | + | − | + |
| Chang Peng (2025) (39) | B | + | + | + | − | + | + | + | − | + |
| DeJia Liu (2025) (38) | B | + | + | + | ? | + | + | + | − | + |
| Gianvincenzo Sparacia (2025) (37) | B | + | ? | + | − | + | + | + | − | + |
The risk of bias and suitability evaluation.
*Published in China; ROB, risk of bias; A, development only; B, development and validation in the same publication; + indicates low ROB/low concern regarding applicability; – indicates high ROB/high concern regarding application; ? indicates unclear ROB/unclear concern regarding applicability.
4 Meta-analysis of validation models included in the review
Statistical pooling of model discrimination (AUC) was performed in MedCalc (Figure 3). This summary analysis primarily utilizes the AUC metric from the model development dataset. Given high heterogeneity (I2 = 96.56%, p < 0.001), a random-effects model yielded a summary AUC of 0.815 (95%CI, 0.780–0.849), reflecting strong overall discrimination. Publication bias was negligible, as evidenced by a symmetrical funnel plot (Figure 4) and a non-significant Egger’s test (p = 0.308). Subgroup and meta-regression analyses stratified by modeling algorithm (logistic regression vs. machine learning), validation type (internal vs. external), events-per-variable (≥10 vs. <10), and missing-data strategy (exclusion vs. imputation) failed to explain the remaining heterogeneity (I2 > 85%), suggesting unmeasured clinical or methodological factors.
Figure 3
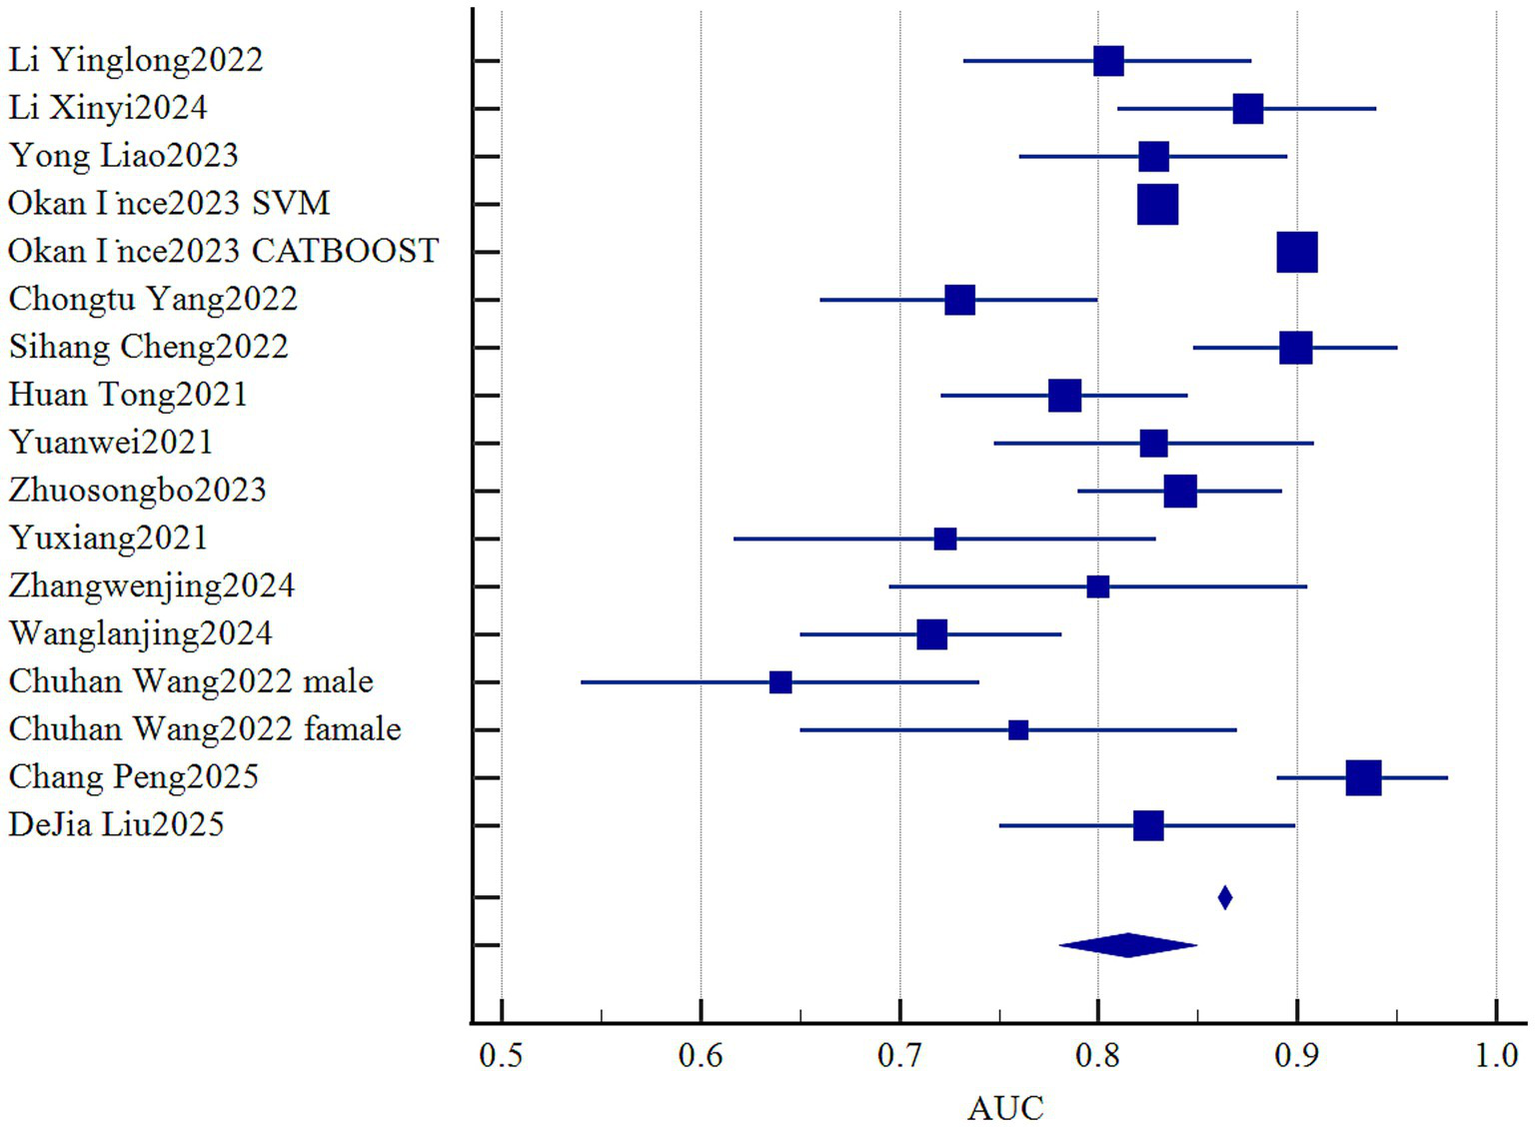
Forest plot of the pooled AUC values.
Figure 4
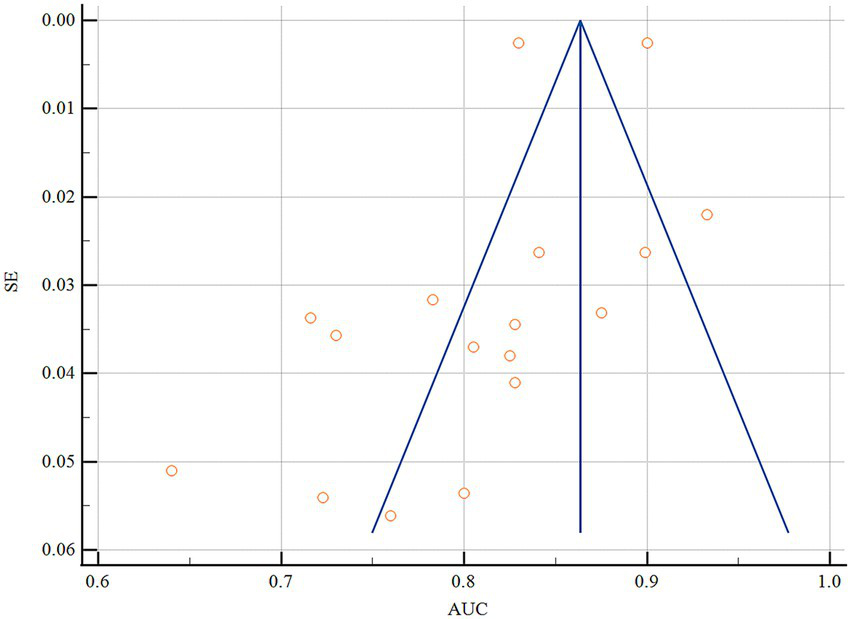
Funnel plot of the pooled AUC values.
Across studies, 71 candidate predictors emerged (Figure 5), with age, diabetes history, Child-Pugh score/class, blood ammonia, and portal–splenic vein diameter ratio—each examined in ≥2 cohorts—significantly associated with post-TIPS HE risk (Table 4). Sensitivity analyses confirmed the robustness of these associations despite heterogeneity.
Figure 5
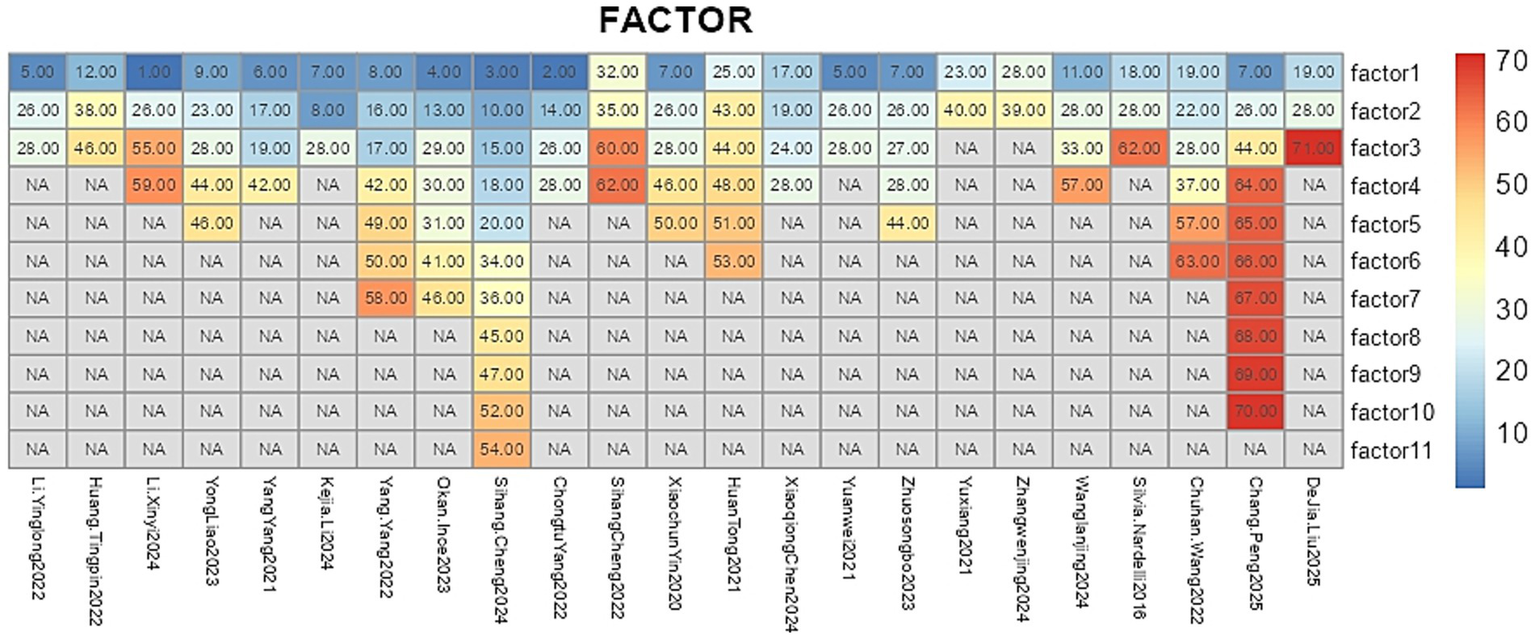
Predictors of the prediction model. In this study, variable codes are defined as follows: 1, denotes preoperative main portal vein diameter; 2, postoperative portosystemic pressure gradient (PPG); 3, Percentile 25-2; 4, operating surgeon; 5, fibrinogen; 6, direct bilirubin; 7, diabetes mellitus; 8, ascites; 9, indocyanine green retention at 15 min (ICG-R15); 10, Median intensity-2; 11, international normalized ratio (INR); 12, triglycerides; 13, indirect bilirubin; 14, sarcopenia; 15, Min intensity-2; 16, ratio of liver transverse diameter to fissure diameter; 17, PSR; 18, Percentile 15-2; 19, Child–Pugh score; 20, Percentile 30-2; 21, fibrinogen (duplicate); 22, visceral fat area index <53.52; 23, percentage decrease in PPG; 24, maximum portal vein diameter; 25, MELD score ≥10; 26, Child–Pugh class; 27, history of hepatitis B; 28, age; 29, MELD-Na score; 30, surgical complications; 31, portal vein puncture site; 32, Correlation_angle90_offset4; 33, white blood cell-to-platelet ratio (WBC/PLT); 34, Percentile 20-2; 35, RunLengthNonuniformity_angle0_offset4; 36, Percentile 40-2; 37, subcutaneous fat area index <70.05; 38, probiotic use; 39, albumin–bilirubin (ALBI) score; 40, high-sensitivity C-reactive protein (hs-CRP); 41, pre-TIPS esophagogastric variceal bleeding; 42, maximum hepatic fissure diameter; 43, alcoholic cirrhosis; 44, blood ammonia; 45, InverseDifferenceMoment_AllDirection_offset4_SD-1; 46, serum creatinine; 47, MeanValue-2; 48, ≥60% reduction in portal pressure; 49, anteroposterior diameter ratio of left to right liver lobe; 50, serum sodium; 51, pleural effusion; 52, Percentile 10-2; 53, stent diameter; 54, C-reactive protein (CRP); 55, Freiburg Index of Post-TIPS Survival (FIPS) score; 56, gamma-glutamyl transpeptidase (GGT); 57, prealbumin; 58, maximum anteroposterior diameter of the right liver lobe; 59, gamma-glutamyl transferase (GGT); 60, Inertia_AllDirection_offset4_SD; 61, RunLengthNonuniformity_AllDirection_offset7_SD; 62, cholinesterase (CHE); and 63, height; 64, total bilirubin; 65, Prothrombin time; 66, IL-6; 67, IL-18; 68, glial fibrillary acidic protein; 69, postoperative gastrointestinal dysfunction; 70, monocyte chemoattractant protein-1; 71, portal vein thrombosis.
Table 4
| Predictor | Included studies (n) | Heterogeneity test | The effect model | Meta | ||
|---|---|---|---|---|---|---|
| I 2 (%) | p value | OR/HR (95%CI) | p value | |||
| Age (16, 22, 24, 28, 30, 32–34, 36–39) | 91 | 8.2 | 0.367 | Fixed | 1.03 (1.02, 1.04) | <0.01 |
| 32 | 23.1 | 0.272 | Fixed | 1.04 (1.02, 1.05) | <0.01 | |
| Diabetes (21, 27, 31, 39) | 21 | 0 | 0.638 | Fixed | 2.089 (1.45,3.02) | <0.01 |
| 22 | 0 | 0.347 | Fixed | 2.158 (1.38,3.39) | <0.01 | |
| Child-Pugh score (23, 32, 39) | 31 | 59.5 | 0.040 | Random | 1.77 (1.53, 2.04) | <0.01 |
| Child-Pugh class (16, 21, 28, 30, 33, 34) | 61 | 8.0 | 0.337 | Fixed | 2.26 (1.66, 3.09) | <0.01 |
| Blood ammonia (22, 31, 34) | 31 | 59 | 0.063 | Random | 1.01 (1.01,1.02) | <0.01 |
| Albumin (37, 39) | 21 | 66.9 | 0.082 | Random | 0.99 (0.98, 0.99) | 0.10 |
| Fibrae sanguis (16, 33) | 21 | 90.1 | 0.002 | Random | 0.811 (0.76, 0.86) | 0.24 |
| The diameter ratio of portal vein to splenic vein (23, 25, 32) | 31 | 65.8 | 0.054 | Random | 3.79 (2.56, 5.61) | <0.01 |
| Maximum diameter of liver laceration (22, 25) | 21 | 93.7 | <0.01 | Random | 1.21 (0.99, 1.48) | 0.317 |
The results of the meta-analysis of the predictors.
1 is OR value; 2 is HR value.
The bold formatting is used solely to highlight these significant variables and carries no intrinsic meaning.
5 Discussion
In 24 studies (35 predictive models, 5,197 patients), the reported incidence of HE after TIPS ranged from 19.9 to 46.6%. Since 2016, many models have shown encouraging discriminative performance (30 models with AUC > 0.70, 22 with AUC > 0.80), but substantial methodological heterogeneity undermines confidence in their clinical applicability. Most models were developed retrospectively and relied primarily on internal validation, with only five studies reporting external validation—features that increase the risk of selection and information bias and limit generalizability. Predictor selection frequently relied on univariable screening, a practice that can overlook important multivariable associations and fails to address multicollinearity or interaction effects (40). Handling of missing data was inconsistent: only one study used multiple imputation, ten excluded incomplete cases, and the majority did not report a clear strategy, further weakening the robustness and reproducibility of results.
Despite these limitations, three recurring predictor domains emerged: patient-specific factors (e.g., age and history of diabetes), preoperative clinical indicators (e.g., Child-Pugh score and blood ammonia level), and imaging-based parameters.
Advanced age is associated with an increased risk of HE, likely mediated through age-related gastrointestinal dysmotility, compositional shifts in the gut microbiota, and diminished extrahepatic ammonia detoxification capacity (41, 42). Physiologically, TIPS further augments systemic exposure to gut-derived ammonia by circumventing hepatic sinusoidal clearance (43, 44). Similarly, diabetes predisposes patients to HE through multiple mechanisms, such as insulin resistance-induced impairment of hepatic and skeletal muscle ammonia metabolism (45), and chronic hyperglycemia-driven upregulation of intestinal glutaminase activity and permeability, which together facilitate ammonia and endotoxin translocation (46, 47); post-TIPS diversion of portal flow further compromises first-pass hepatic extraction, thereby amplifying this risk (48, 49).
Higher pre-TIPS liver dysfunction scores reflect reduced synthetic function and intrinsic shunting, which TIPS may exacerbate (50). Although preprocedural ammonia level was prognostic in several reports, assay variability and lack of standardization limit its routine use (51); standardized protocols or point-of-care assays could improve its utility. Emerging biochemical markers (e.g., glutamine/glutamate ratios and phenylacetate) and dynamic flow metrics (Doppler or 4D-flow MRI) may enhance risk stratification beyond static measures and merit prospective evaluation.
Recent studies have increasingly indicated that malnutrition and sarcopenia are modifiable risk factors for hepatic encephalopathy (HE) after TIPS. Skeletal muscle plays a critical role in extrahepatic ammonia metabolism, and a reduction in muscle mass can markedly impair peripheral ammonia clearance, thereby increasing susceptibility to HE. In our dataset, several models included nutrition- or body composition-related variables—such as CT- or BIA-derived measures of muscle mass or fat distribution, prealbumin levels, or low-fat mass indices (reported in the variable lists as “sarcopenia,” “prealbumin,” or “visceral fat area index”). However, due to substantial heterogeneity in measurement methods, cutoff values, and reporting strategies, these variables did not demonstrate consistent stability in pooled analyses. In other words, while current evidence supports the biological plausibility and potential clinical relevance of nutrition-related indicators, methodological heterogeneity (such as assessment tools, thresholds, and follow-up time points) has hindered their consistent confirmation across prediction models. Therefore, we recommend that future model development prioritize internationally accepted definitions of sarcopenia (e.g., EWGSOP2 or AWGS) and report raw imaging-based measurements to facilitate cross-cohort comparisons and individual participant data (IPD) meta-analyses.
6 Conclusion
Although many existing models demonstrate promising discriminative performance, the substantial methodological heterogeneity across studies—particularly regarding modeling frameworks, predictor selection, and validation strategies—undermines the reliability and generalizability of current evidence. AUCs derived from various modeling frameworks are often highly heterogeneous and emphasize different aspects of predictive performance; therefore, simply pooling these AUCs into a single summary metric is methodologically questionable and may misrepresent a model’s clinical utility. To move the field forward, future studies should adopt prospective, multicenter designs with clearly pre-specified predictor sets, apply modern multivariable selection techniques (e.g., LASSO/ridge) (52, 53) and routine multiple imputation for missing data (54), and perform transparent reporting and external validation in line with TRIPOD and PROBAST (55). Notably, prognostic and diagnostic modeling frameworks should be explicitly separated, and pooled estimates (such as aggregated AUCs) should not be interpreted uncritically when they combine fundamentally different model types (e.g., logistic, Cox) since such pooling can be misleading.
6.1 Limitation
This systematic review has several limitations that should be carefully considered when interpreting the findings. First, approximately two-thirds of the included studies were derived from East Asian cohorts, predominantly from mainland China. This geographic concentration may limit the generalizability of the results to other regions, as differences in etiological profiles (e.g., proportions of viral versus alcohol-related liver disease), TIPS indications, and peri-procedural management strategies (such as perioperative antibiotic use, shunt design, and nursing practices) may influence both the incidence of HE and the external validity of identified predictors. Nevertheless, it is noteworthy that earlier cohort studies from Europe and North America have also reported several core predictors, suggesting that certain factors—such as age, Child-Pugh score, and blood ammonia levels—exhibit consistency across regions. However, these observations still require confirmation through prospective, multicenter, multinational studies. To enhance transparency, we have listed the geographic origin of each included study in the supplementary materials to allow readers to better assess the applicability of our findings.
Second, several potentially important predictors, such as a history of hepatic encephalopathy and nutritional status or sarcopenia, were inconsistently reported or variably defined across the original studies, resulting in a lack of consistent support in pooled model analyses. With respect to prior HE, some studies excluded patients with overt cognitive impairment or recurrent HE episodes, while others did not explicitly document mild or covert cognitive dysfunction at baseline. In addition, a history of HE often coexists with more advanced liver dysfunction and malnutrition, leading to strong collinearity with liver function scores and nutritional variables and increasing the likelihood of exclusion during multivariable model selection. Consequently, although earlier studies have suggested an association between prior HE or baseline cognitive impairment and post-TIPS HE risk, this variable did not emerge as a consistently significant predictor in our pooled analysis due to heterogeneity in definitions, sampling strategies, and statistical approaches. Future studies should incorporate systematic documentation of prior HE and standardized assessments of mild cognitive impairment to better delineate their independent predictive value.
Third, malnutrition and sarcopenia have gained increasing attention in recent years as biologically plausible mechanisms contributing to HE. Our list of candidate predictors included several nutrition- and body composition-related variables, such as sarcopenia, subcutaneous or visceral fat indices, and prealbumin levels. However, substantial variability in measurement methods (e.g., CT-based cross-sectional assessments, body mass index-based thresholds, or laboratory surrogate markers) and cutoff values across studies resulted in unstable findings in pooled analyses. Although existing evidence supports the role of muscle and nutritional depletion in increasing HE susceptibility—primarily through reduced peripheral ammonia clearance—methodological heterogeneity limits comparability. We therefore recommend that future models incorporate standardized sarcopenia assessments and nutritional scoring systems at the design stage and report detailed measurement methods and thresholds to facilitate subsequent synthesis and comparison.
Finally, methodological limitations should also be acknowledged. Most included studies were retrospective in nature, and only a minority performed external validation. In addition, there was no uniform definition of HE or standardized follow-up window (e.g., mixing HE incidence within 6- and 12-month periods), and approaches to handling missing data varied considerably, with complete-case analysis being the most common. These factors are likely to increase heterogeneity and may introduce bias in the estimation of predictive performance. To address this issue, we have provided a comprehensive summary table in the supplementary materials detailing the number of events, events per variable (EPV), missing data handling strategies, and external validation status for each model, enabling readers to better evaluate their robustness and potential clinical applicability.
Statements
Data availability statement
The original contributions presented in the study are included in the article/supplementary material, further inquiries can be directed to the corresponding authors.
Author contributions
ZF: Data curation, Methodology, Software, Writing – original draft, Writing – review & editing. ZL: Data curation, Funding acquisition, Project administration, Supervision, Writing – review & editing. ZP: Conceptualization, Methodology, Writing – review & editing. QX: Formal analysis, Investigation, Project administration, Writing – review & editing. QZ: Investigation, Project administration, Validation, Writing – review & editing. LW: Investigation, Validation, Visualization, Writing – review & editing. PJ: Conceptualization, Formal analysis, Funding acquisition, Resources, Writing – review & editing. XT: Funding acquisition, Methodology, Resources, Writing – review & editing.
Funding
The author(s) declared that financial support was received for this work and/or its publication. This study is supported by the 2023 Science and Technology Plan Project of Sichuan Province (No. 2023YFS0070), Medical Project of Chengdu Municipal Health Commission (No. 2024351).
Conflict of interest
The author(s) declared that this work was conducted in the absence of any commercial or financial relationships that could be construed as a potential conflict of interest.
Generative AI statement
The author(s) declared that Generative AI was not used in the creation of this manuscript.
Any alternative text (alt text) provided alongside figures in this article has been generated by Frontiers with the support of artificial intelligence and reasonable efforts have been made to ensure accuracy, including review by the authors wherever possible. If you identify any issues, please contact us.
Publisher’s note
All claims expressed in this article are solely those of the authors and do not necessarily represent those of their affiliated organizations, or those of the publisher, the editors and the reviewers. Any product that may be evaluated in this article, or claim that may be made by its manufacturer, is not guaranteed or endorsed by the publisher.
Abbreviations
TIPS, Transjugular intrahepatic portosystemic shunt; HE, Hepatic encephalopathy; PRISMA, Preferred Reporting Items for Systematic Reviews and Meta-Analyses; CNKI, China National Knowledge Infrastructure; CBM, Chinese Biomedical Literature Database; CHARMS, Checklist for Critical Appraisal and Data Extraction for Systematic Reviews of Prediction Modeling Studies; PROBAST, Prediction Model Risk of Bias Assessment Tool; AUC, Area under the receiver operating characteristic curve; CI, Confidence interval; SE, Standard error; LASSO, Least absolute shrinkage and selection operator.
References
1.
Bosch J Berzigotti A Garcia-Pagan JC Abraldes JG . The management of portal hypertension: rational basis, available treatments and future options. J Hepatol. (2008) 48:S68–92. doi: 10.1016/j.jhep.2008.01.021,
2.
Lee EW Eghtesad B Garcia-Tsao G Haskal ZJ Hernandez-Gea V Jalaeian H et al . AASLD practice guidance on the use of TIPS, variceal embolization, and retrograde transvenous obliteration in the management of variceal hemorrhage. Hepatology. (2024) 79:224. doi: 10.1097/HEP.0000000000000530
3.
Garcia-Pagan JC Francoz C Montagnese S Senzolo M Mookerjee RP . Management of the major complications of cirrhosis: beyond guidelines. J Hepatol. (2021) 75:S135–46. doi: 10.1016/j.jhep.2021.01.027,
4.
Larrue H D'Amico G Olivas P Lv Y Bucsics T Rudler M et al . TIPS prevents further decompensation and improves survival in patients with cirrhosis and portal hypertension in an individual patient data meta-analysis. J Hepatol. (2023) 79:692–703. doi: 10.1016/j.jhep.2023.04.028,
5.
Rössle M . TIPS: 25 years later. J Hepatol. (2013) 59:1081–93. doi: 10.1016/j.jhep.2013.06.014,
6.
Wang Z Jiang M-S Zhang H-L Weng NN Luo XF Li X et al . Is post-TIPS anticoagulation therapy necessary in patients with cirrhosis and portal vein thrombosis? A randomized controlled trial. Radiology. (2016) 279:943–51. doi: 10.1148/radiol.2015150369,
7.
Liu J Ma J Yang C Ye T Meng J Shi Q et al . Impact of TIPS on splenic volume and thrombocytopenia. AJR Am J Roentgenol. (2021) 216:698–703. doi: 10.2214/ajr.20.22958,
8.
Tripathi D Stanley AJ Hayes PC Travis S Armstrong MJ Tsochatzis EA et al . Transjugular intrahepatic portosystemic stent-shunt in the management of portal hypertension. Gut. (2020) 69:1173–92. doi: 10.1136/gutjnl-2019-320221,
9.
Gairing S Müller L Kloeckner R Galle P Labenz C . Review article: post-TIPSS hepatic encephalopathy-current knowledge and future perspectives. Aliment Pharmacol Ther. (2022) 55:1265–76. doi: 10.1111/apt.16825,
10.
Amodio P . Hepatic encephalopathy: diagnosis and management. Liver Int. (2018) 38:966–75. doi: 10.1111/liv.13752,
11.
Stepanova M Mishra A Venkatesan C Younossi ZM . In-hospital mortality and economic burden associated with hepatic encephalopathy in the United States from 2005 to 2009. Clin Gastroenterol Hepatol. (2012) 10:1034–1041.e1. doi: 10.1016/j.cgh.2012.05.016,
12.
The PRISMA 2020 statement: an updated guideline for reporting systematic reviews. Int J Surg. (2021) 88:105906. doi: 10.1016/j.ijsu.2021.105906,
13.
Moons KGM de Groot JAH Bouwmeester W Vergouwe Y Mallett S Altman DG et al . Critical appraisal and data extraction for systematic reviews of prediction modelling studies: the CHARMS checklist. PLoS Med. (2014) 11:e1001744. doi: 10.1371/journal.pmed.1001744
14.
Debray TPA Damen JAAG Snell KIE Ensor J Hooft L Reitsma JB et al . A guide to systematic review and meta-analysis of prediction model performance (2017) 356:i6460. doi: 10.1136/bmj.i6460,
15.
Moons KGM Wolff RF Riley RD Whiting PF Westwood M Collins GS et al . PROBAST: a tool to assess risk of bias and applicability of prediction model studies: explanation and elaboration. Ann Intern Med. (2019) 170:W1–W33. doi: 10.7326/M18-1377,
16.
Yang Y Fu S Cao B Hao K Li Y Huang J et al . Prediction of overt hepatic encephalopathy after transjugular intrahepatic portosystemic shunt treatment: a cohort study. Hepatol Int. (2021) 15:730–40. doi: 10.1007/s12072-021-10188-5,
17.
Li Y Pang H He X . Development and validation of a nomogram for early hepatic encephalopathy after transjugular intrahepatic portosystemic shunt. J Pract Med. (2020) 36:963–8.
18.
Huang T Wang G Huang G Zhang C . Predicting clinical outcomes of cirrhotic patients after transjugular intrahepatic portosystemic shunt using machine learning algorithms. Chin J Digest Dis Imaging. (2022) 12:4–10.
19.
Li X Li J Sun W . Development and evaluation of a nomogram to predict overt hepatic encephalopathy in cirrhotic patients with esophageal and gastric variceal bleeding after transjugular intrahepatic portosystemic shunt. J Clin Hepatobiliary Dis. (2024) 40:1605–11.
20.
Liao Y Zhang L Wang J-T Yue ZD Fan ZH Wu YF et al . A novel nomogram predicting overt hepatic encephalopathy after transjugular intrahepatic portosystemic shunt in portal hypertension patients. Sci Rep. (2023) 13:15244. doi: 10.1038/s41598-023-42061-w,
21.
Li K Cheng Y Zhao R Jiang H Zhang L Tong Y et al . Prediction of mortality and overt hepatic encephalopathy undergoing transjugular intrahepatic portosystemic shunt: a retrospective cohort study. Abdom Radiol. (2024) 49:908–18. doi: 10.1007/s00261-023-04086-7
22.
Yang Y Liang X Yang S He X Huang M Shi W et al . Preoperative prediction of overt hepatic encephalopathy caused by transjugular intrahepatic portosystemic shunt. Eur J Radiol. (2022) 154:110384. doi: 10.1016/j.ejrad.2022.110384,
23.
İnce O Önder H Gençtürk M Golzarian J Young S . Machine learning insights: predicting hepatic encephalopathy after TIPS placement. Cardiovasc Intervent Radiol. (2023) 46:1715–25. doi: 10.1007/s00270-023-03593-w,
24.
Cheng S Hu G Jin Z Wang Z Xue H . Prediction of hepatic encephalopathy after transjugular intrahepatic portosystemic shunt based on CT radiomic features of visceral adipose tissue. Acad Radiol. (2024) 31:1849–61. doi: 10.1016/j.acra.2023.10.013,
25.
Yang C Zhu X Liu J Shi Q du H Chen Y et al . Development and validation of prognostic models to estimate the risk of overt hepatic encephalopathy after TIPS creation: a multicenter study. Clin Transl Gastroenterol. (2022) 13:e00461. doi: 10.14309/ctg.0000000000000461
26.
Cheng S Yu X Chen X Jin Z Xue H Wang Z et al . CT-based radiomics model for preoperative prediction of hepatic encephalopathy after transjugular intrahepatic portosystemic shunt. Br J Radiol. (2022) 95:20210792. doi: 10.1259/bjr.20210792
27.
Yin X Zhang F Guo H Peng C Zhang W Xiao J et al . A nomogram to predict the risk of hepatic encephalopathy after transjugular intrahepatic portosystemic shunt in cirrhotic patients. Sci Rep. (2020) 10:9381. doi: 10.1038/s41598-020-65227-2
28.
Tong H Gan C Wei B Wang ZD Li XD Qian SJ et al . Risk factors for overt hepatic encephalopathy after transjugular intrahepatic portosystemic shunt creation in patients with liver cirrhosis. J Dig Dis. (2021) 22:31–40. doi: 10.1111/1751-2980.12957,
29.
Chen X Huang M Yu X Chen J Xu C Jiang Y et al . Hepatic-associated vascular morphological assessment to predict overt hepatic encephalopathy before TIPS: a multicenter study. Hepatol Int. (2024) 18:1238–48. doi: 10.1007/s12072-024-10686-2,
30.
Yuan W Li L Han X Liu J Li B Wu J . Development and performance analysis of a clinical prediction model for hepatic encephalopathy after TIPS. Mod Dig Interv Ther. (2021) 26:874–7.
31.
Zhuo S Zhao W Hu J . Incidence and risk factors of overt hepatic encephalopathy after transjugular intrahepatic portosystemic shunt. J Clin Radiol. (2023) 42:1806–11.
32.
Yu X Xie P Cheng S Cao L Gu L Zhu T . Predictive value of preoperative peripheral blood inflammatory markers for hepatic encephalopathy after transjugular intrahepatic portosystemic shunt. J Interv Radiol. (2021) 30:937–40.
33.
Zhang W Gan J . Predictive value of age combined with albumin-bilirubin (ALBI) grade for overt hepatic encephalopathy after transjugular intrahepatic portosystemic shunt. J Pract Clin Med. (2024) 28:53–8.
34.
Wang L Qin J Yao X Qi Q Liu L Tang S . Development of a risk prediction model for overt hepatic encephalopathy in hepatitis B cirrhosis patients with portal hypertension undergoing TIPS. J Clin Hepatobiliary Dis. (2024) 40:1149–55.
35.
Nardelli S Gioia S Pasquale C Pentassuglio I Farcomeni A Merli M et al . Cognitive impairment predicts the occurrence of hepatic encephalopathy after transjugular intrahepatic portosystemic shunt. Am J Gastroenterol. (2016) 111:523–8. doi: 10.1038/ajg.2016.29,
36.
Wang C Teng Y Gao J Zhang Z Li Y . Low adipose tissue index as an indicator of hepatic encephalopathy in cirrhotic patients following transjugular intrahepatic portosystemic shunt. Abdominal Radiology. (2023) 48:1454–67. doi: 10.1007/s00261-023-03813-4,
37.
Sparacia G Colelli G Parla G . Brain magnetic resonance imaging radiomic signature and machine learning model prediction of hepatic encephalopathy in adult cirrhotic patients. Life. (2025) 15:346.
38.
Liu D-J Jia L-X Zeng F-X Zeng W-X Qin G-G Peng Q-F et al . Machine learning prediction of hepatic encephalopathy for long-term survival after transjugular intrahepatic portosystemic shunt in acute variceal bleeding. World J Gastroenterol. (2025) 31:100401. doi: 10.3748/wjg.v31.i4.100401,
39.
Chang P Xue P Guo C . LASSO-logistic regression analysis and nomogram development for predicting hepatic encephalopathy after TIPS. J Pract Clin Med. (2025) 29:19–25.
40.
Ziegler A . Clinical prediction models: a practical approach to development, validation, and updating. Biom J. (2020) 62:1122–3.
41.
Nardelli S Riggio O Marra F Gioia S Saltini D Bellafante D et al . Episodic overt hepatic encephalopathy after transjugular intrahepatic portosystemic shunt does not increase mortality in patients with cirrhosis. J Hepatol. (2024) 80:596–602. doi: 10.1016/j.jhep.2023.11.033,
42.
Bettinger D Sturm L Pfaff L Hahn F Kloeckner R Volkwein L et al . Refining prediction of survival after TIPS with the novel freiburg index of post-TIPS survival. J Hepatol. (2021) 74:1362–72. doi: 10.1016/j.jhep.2021.01.023,
43.
Adhikary S Esmeeta A Dey A Banerjee A Saha B Gopan P et al . Impacts of gut microbiota alteration on age-related chronic liver diseases. Dig Liver Dis. (2024) 56:112–22. doi: 10.1016/j.dld.2023.06.017,
44.
Smith EE Biessels GJ Gao V Gottesman RF Liesz A Parikh NS et al . Systemic determinants of brain health in ageing. Nat Rev Neurol. (2024) 20:647–59. doi: 10.1038/s41582-024-01016-z,
45.
Hafizi Abu Bakar M Kian Kai C Wan Hassan WN Sarmidi MR Yaakob H Zaman Huri H . Mitochondrial dysfunction as a central event for mechanisms underlying insulin resistance: the roles of long chain fatty acids. Diabetes Metab Res Rev. (2015) 31:453–75. doi: 10.1002/dmrr.2601,
46.
Thaiss CA Levy M Grosheva I Zheng D Soffer E Blacher E et al . Hyperglycemia drives intestinal barrier dysfunction and risk for enteric infection. Science. (2018) 359:1376–83. doi: 10.1126/science.aar3318,
47.
Giri B Dey S Das T Sarkar M Banerjee J Dash SK . Chronic hyperglycemia mediated physiological alteration and metabolic distortion leads to organ dysfunction, infection, cancer progression and other pathophysiological consequences: an update on glucose toxicity. Biomed Pharmacother. (2018) 107:306–28. doi: 10.1016/j.biopha.2018.07.157,
48.
Portincasa P Bonfrate L Wang DQ-H Frühbeck G Garruti G Di Ciaula A . Novel insights into the pathogenic impact of diabetes on the gastrointestinal tract. Eur J Clin Investig. (2022) 52:e13846. doi: 10.1111/eci.13846
49.
de Kort S Keszthelyi D Masclee A . M. Leaky gut and diabetes mellitus: what is the link?Obes Rev. (2011) 12:449–58. doi: 10.1111/j.1467-789X.2010.00845.x,
50.
Li Y Wu Y-T Wu H . Management of hepatic encephalopathy following transjugular intrahepatic portosystemic shunts: current strategies and future directions. World J Gastroenterol. (2025) 31:103512. doi: 10.3748/wjg.v31.i15.103512,
51.
Hashim IA Cuthbert JA . Elevated ammonia concentrations: potential for pre-analytical and analytical contributing factors. Clin Biochem. (2014) 47:233–6. doi: 10.1016/j.clinbiochem.2014.08.013,
52.
Ranalli MG Salvati N Petrella L Pantalone F . M-quantile regression shrinkage and selection via the lasso and elastic net to assess the effect of meteorology and traffic on air quality. Biom J. (2023) 65:2100355. doi: 10.1002/bimj.202100355,
53.
Zhang Q Yuan K-H Wang L . Asymptotic bias of normal-distribution-based maximum likelihood estimates of moderation effects with data missing at random. Br J Math Stat Psychol. (2019) 72:334–54. doi: 10.1111/bmsp.12151,
54.
Guide A Garbett S Feng X Mapes BM Cook J Sulieman L et al . Balancing efficacy and computational burden: weighted mean, multiple imputation, and inverse probability weighting methods for item non-response in reliable scales. J Am Med Inform Assoc. (2024) 31:2869–79. doi: 10.1093/jamia/ocae217,
55.
Moons KGM Altman DG Reitsma JB Ioannidis JP Macaskill P Steyerberg EW et al . Transparent reporting of a multivariable prediction model for individual prognosis or diagnosis (TRIPOD): explanation and elaboration. Ann Intern Med. (2015) 162:W1–W73. doi: 10.7326/M14-0698,
Summary
Keywords
hepatic encephalopathy, predictive models, risk factors, systematic review/meta-analysis, transjugular intrahepatic portosystemic shunt
Citation
Fang Z, Liu Z, Pu Z, Xia Q, Zhang Q, Wang L, Jia P and Tang X (2026) Risk prediction models for hepatic encephalopathy following TIPS: a systematic review and meta-analysis. Front. Med. 13:1707035. doi: 10.3389/fmed.2026.1707035
Received
17 September 2025
Revised
15 December 2025
Accepted
02 January 2026
Published
02 February 2026
Volume
13 - 2026
Edited by
Luyan Shen, Jilin University, China
Reviewed by
Manuela Merli, Independent Researcher, Rome, Italy
Dingfan Guo, Nanchang University, China
Updates
Copyright
© 2026 Fang, Liu, Pu, Xia, Zhang, Wang, Jia and Tang.
This is an open-access article distributed under the terms of the Creative Commons Attribution License (CC BY). The use, distribution or reproduction in other forums is permitted, provided the original author(s) and the copyright owner(s) are credited and that the original publication in this journal is cited, in accordance with accepted academic practice. No use, distribution or reproduction is permitted which does not comply with these terms.
*Correspondence: Ping Jia, aonejia@126.com; Xiaobin Tang, aonetang@126.com
†These authors share first authorship
Disclaimer
All claims expressed in this article are solely those of the authors and do not necessarily represent those of their affiliated organizations, or those of the publisher, the editors and the reviewers. Any product that may be evaluated in this article or claim that may be made by its manufacturer is not guaranteed or endorsed by the publisher.