Abstract
Objective:
To develop and validate models for predicting pathological grading of non-small cell lung cancer (NSCLC) using habitat radiomics and clinical semantic features.
Materials and methods:
In this retrospective study of 800 NSCLC patients, a whole tumor volume (WTV) was delineated by applying a 3 mm expansion to the gross tumor volume (GTV) on non-contrast CT scans. Habitat subregions within the WTV were identified using K-means clustering. A two-step binary classification model was constructed to predict pathological grades: Model-1 distinguished Grade 3 from combined Grades 1–2, and Model-2 further differentiated Grade 1 from Grade 2. Predictive models were built with logistic regression based on four distinct feature sets: WTV radiomics (Clf WVOI), habitat radiomics (Clf Habitats), clinical features (Clf Clinical), and a combined feature set (Clf Total).
Results:
In both Model-1 and Model-2, the classification performance of Clf Habitats was generally superior to that of Clf WVOI and Clf Clinical, achieving an AUC of 0.89 and 0.87, specificity of 0.73 for both models, and BACC of 0.78 and 0.79, respectively, on the test set. The combined model, Clf Total, achieved the best predictive performance on the test set, with AUC values of 0.91 and 0.88, specificity of 0.84 and 0.77, and BACC of 0.82 and 0.81.
Conclusion:
Habitat radiomics significantly improves NSCLC pathological grading. The multimodal model offers robust performance and high specificity, aiding personalized treatment planning.
Graphical Abstract

Left: Schematic of the multicenter retrospective study and methodological pipeline, including K means–based habitat segmentation, radiomics feature extraction, and a two step classification framework. Right: Comparison of four classifiers shows that integrating habitat radiomics improves prediction of NSCLC pathological grading.
1 Introduction
Lung cancer is a major global health challenge. According to the International Agency for Research on Cancer (IARC) statistics, it constitutes 12.4% of newly diagnosed cancers and is the leading cause of cancer mortality, accounting for 18.7% of cancer deaths (1). NSCLC, the predominant subtype representing 80–85% of cases, has a 5-year survival rate below 20%. Tumor grading is biologically and prognostically critical: high-grade tumors are associated with significantly worse outcomes, including higher risks of metastasis and recurrence (2, 3). Accurate grading is essential for prognostic stratification and treatment planning. Percutaneous biopsy and frozen section analysis are diagnostic cornerstones but have limitations: tumor spatial heterogeneity causes sampling bias and unreliable assessments (4); invasive procedures risk pneumothorax and hemorrhage; and technical constraints limit utility in small nodules (5).
Computed tomography (CT) is one of the principal imaging modalities for lung cancer. Nonetheless, reliance solely on radiologists’ subjective interpretation of CT morphological features is insufficient for precise tumor grading. Radiomics enables the quantification of high-dimensional imaging features that are imperceptible to human visual inspection. However, conventional radiomics typically focuses on the entire tumor region for feature extraction, thereby failing to accurately characterize the complex spatial heterogeneity within the tumor. Extensive research has shown that although traditional radiomics models exhibit satisfactory performance in tumor-related predictive tasks, their inability to adequately account for heterogeneity across distinct intratumoral regions constrains further improvements in predictive accuracy (6, 7). Habitat radiomics is an analytical approach derived from conventional radiomics. It applies unsupervised machine learning algorithms to partition tumors into distinct subregions. This method effectively characterizes intratumoral heterogeneity and reveals subregion-specific microenvironmental and molecular phenotypes. Many clinical studies have demonstrated that this approach offers significant advantages in oncology by providing novel radiomic biomarkers that support the development of personalized therapeutic strategies (8–10).
Despite numerous studies establishing predictive models for pathological grading of NSCLC using radiomics, there remain several limitations: Most studies have predominantly focused on adenocarcinoma, with limited inclusion of subtypes such as squamous cell carcinoma (SCC) and large cell carcinoma (LCC); many studies have focused on identifying low-differentiated groups, without further distinguishing between moderately and highly differentiated groups; moreover, existing models have not sufficiently taken into account the spatial heterogeneity of tumors, which is a crucial factor (11–13). These factors collectively limit the generalizability and practical clinical utility of the models in real settings.
This study aims to develop and validate a habitat radiomics model using non-enhanced CT, with the goal of integrating the extracted features with key clinical semantic features into a combined predictive model for NSCLC pathological grading.
2 Materials and methods
This retrospective study was approved by the Ethics Committee of the First Affiliated Hospital of Harbin Medical University. Informed consent was waived due to the retrospective nature of the research.
2.1 Participants
The data for this study were obtained from a hospital cohort and two public datasets. The hospital cohort included 220 patients who underwent surgical resection at the First Affiliated Hospital of Harbin Medical University between May 2021 and December 2024. Data from two independent public datasets were incorporated: 443 cases from the National Lung Screening Trial (NLST) database1 and 137 cases from the NSCLC-Radiogenomics dataset.2
2.2 Inclusion and exclusion criteria
Inclusion criteria were as follows: (1) Histopathologically confirmed NSCLC with a definitive pathological grade; (2) No history of any anticancer treatment prior to baseline CT imaging; (3) Availability of complete clinical data, including gender, age, and smoking history.
Exclusion criteria were as follows: (1) Absence of a definitive pathological grade; (2) Presence of significant artifacts on CT images; (3) An interval > 1 month between baseline CT imaging and surgical resection.
Patients from the three cohorts were screened according to the above criteria, and the overall selection process is illustrated in Figure 1.
FIGURE 1

Screening flowchart of study subjects.
Patient demographics from the NLST, NSCLC Radiogenomics, and Hospital cohorts are summarized in Table 1.
TABLE 1
| Characteristics | Subjects | Cohorts | ||
|---|---|---|---|---|
| NLST | NSCLC Radiogenomics | Hospital | ||
| Age (years, mean ± SD) | 800 | 63.75 ± 5.36 | 68.60 ± 9.14 | 60.04 ± 9.33 |
| Gender, n (%) | ||||
| Female | 354 | 188 (42.44 %) | 39 (28.47 %) | 127 (57.73 %) |
| Male | 446 | 255 (57.56 %) | 98 (71.53 %) | 93 (42.27 %) |
| Grading of tumor, n (%) | ||||
| Grade1 | 193 | 104 (23.48 %) | 32 (23.36 %) | 57 (25.91 %) |
| Grade2 | 371 | 178 (40.18 %) | 72 (52.55 %) | 121 (55.00 %) |
| Grade3 | 236 | 161 (36.34 %) | 33 (24.09 %) | 42 (19.09 %) |
| Histology, n (%) | ||||
| ADC | 620 | 312 (70.43 %) | 104 (75.91 %) | 173 (78.64 %) |
| SCC | 158 | 115 (25.96 %) | 29 (21.17 %) | 43 (19.55 %) |
| Others | 22 | 16 (3.61 %) | 4 (2.92 %) | 4 (1.81 %) |
Demographics and tumor characteristics of three cohorts.
2.3 CT Examination and clinical features
CT images were acquired from the hospital using three different CT scanner models: Discovery CT 750 HD (GE Healthcare, United States), Somatom Sensation 64 (Siemens, Germany), and Brilliance iCT (Philips, Netherlands). Scanning parameters were as follows: 80–120 kVp, automatically modulated tube current, and a matrix of 512 × 512. Reconstruction protocols varied by manufacturer, GE CT systems: slice thickness of 1.25 mm with a 1.25 mm reconstruction interval. Philips and Siemens systems: slice thickness of 1 mm with a 1 mm reconstruction interval.
For the NLST cohort, CT images were acquired using eight scanner models: Aquilion (Canon Medical Systems, Japan); HiSpeed QX/i, LightSpeed Plus, LightSpeed QX/i, and LightSpeed 16 (GE Healthcare, United States); Mx8000 (Philips, Netherlands); and Sensation 16 and Volume Zoom (Siemens, Germany). Scanning parameters varied across sites, with tube voltage ranging from 80 to 140 kVp, tube current from 40 to 320 mA, and slice thickness between 2 and 5 mm.
For the NSCLC-Radiogenomics cohort, CT images were obtained using multiple scanners and acquisition protocols, with slice thickness ranging from 0.625 to 3 mm, tube current from 124 to 699 mA (mean: 220 mA), and tube voltage from 80 to 140 kVp (mean: 120 kVp).
Clinical information, including age, gender, and smoking history, was retrieved from the patient electronic medical record system. Two senior thoracic radiologists (with 9 and 15 years of experience in thoracic imaging, respectively) independently assessed the radiographic characteristics of the pulmonary lesions while blinded to the pathological results. The evaluated characteristics included: (1) lesion location; (2) mean diameter, calculated as the average of the longest and shortest axes of the lesion; (3) lesion density (pure ground-glass opacity, mixed density, or solid density); (4) clarity of the tumor-lung interface (clear or blurred); (5) lobulation; (6) spiculation; (7) pleural indentation; (8) vascular convergence; (9) vacuole sign; and (10) air bronchogram sign. Any disagreements during the evaluation were resolved through consultation between the two initial readers. Any persistent discrepancies were adjudicated by a third senior radiologist (with 23 years of experience in pulmonary imaging).
2.4 Tumor delineation and peritumor expansion
The regions of interest (ROIs) encompassing the primary GTV of each lesion were manually delineated on the original CT images by the two radiologists mentioned above. Discrepancies were resolved through consensus; in cases of persistent disagreement, a final decision was made by the third senior radiologist.
Both the original CT images and the corresponding ROI segmentation masks were resampled to an isotropic voxel size of 1 × 1 × 1 mmł using nearest-neighbor interpolation to ensure consistent spatial resolution and to improve feature extraction robustness. Following resampling, the left and right lung lobes were automatically segmented for each case using the TotalSegmentator module in 3D Slicer (version 5.7.0) (14).
Subsequently, all GTV ROIs were expanded isotropically by 3 mm margin (15) to generate the peritumoral area. This expansion was automatically corrected using the segmentation of lung lobes to ensure that the tumor expansion did not include the chest wall or other non-lung tissues. The delineation, resampling, and expansion of the tumor were all carried out using the 3D Slicer tool (version 5.7.0).
2.5 Habitat clustering and feature extraction
For each patient, the original GTV ROI and the expanded peritumoral region together defined the whole volume of interest (whole_VOI, WVOI). The voxel-based first-order entropy feature map for the WVOI was calculated using the PyRadiomics package (version 3.1) (16). The first-order entropy feature, defined by the Image Biomarker Standardization Initiative (IBSI) as Intensity Histogram Entropy (17), specifies the uncertainty or randomness in the image values. The formula for first-order entropy is presented in Eq. 1.
Where (pi) is the normalized first-order histogram and equals P(i) /Np, in which P(i) is the first-order histogram with Ng discrete intensity levels, and Np is the total number of voxels of WVOI. Ng is the number of non-zero bins (Ng = 25 in this study, commonly used for CT images). ε is an arbitrarily small positive number (≈ 2.2 × 10⁻¹⁶).
For each voxel in the WVOI, we created a super-voxel vector by combining the voxel’s gray level intensity with its first-order entropy. The K-means clustering algorithm was then applied to these super-voxel vectors to identify different subregions within the WVOI, thereby forming distinct habitats. To determine the optimal number of clusters (k) for k-means clustering, we analyzed all WVOIs using values of k set to 2, 3, and 4. For each value of k, the average Silhouette Score and the Davies-Bouldin Index (DB Index) were calculated. Both the Silhouette Score and DB Index are metrics used to evaluate clustering performance. The Silhouette Score ranges from -1 to 1, with higher values indicating better clustering results. Conversely, the DB Index measures the similarity between different clusters, with lower values (closer to zero) indicating better clustering performance.
Table 2 summarizes the average Silhouette Scores and DB Indices for different values of k. When k = 2, the highest Silhouette Score and the lowest Davies-Bouldin Index were observed simultaneously, indicating the best clustering performance among the three values of k. Therefore, value 2 of k was selected as the optimal number of clusters to apply to all patients. The two habitats identified through clustering were ranked based on voxel values, from high to low, and labeled as Habitat 1 and Habitat 2, respectively. Figure 2 illustrates the delineated WVOIs for three patients with pathological grades of Grade 1, Grade 2, and Grade 3, along with the two habitats derived from K-means clustering.
TABLE 2
| The number of clusters | Silhouette Score (mean ± SD) |
Davies-Bouldin Index (mean ± SD) |
|---|---|---|
| 2 | 0.71 ± 0.02 | 0.43 ± 0.04 |
| 3 | 0.65 ± 0.02 | 0.48 ± 0.01 |
| 4 | 0.61 ± 0.01 | 0.50 ± 0.01 |
Comparison of clustering metrics for various numbers of clusters.
FIGURE 2

Examples of lung tumor delineation and habitats division with different grades. (A) Grade 1; (B) Grade 2; (C) Grade 3; (D–F) Habitat 1 (Green) and habitat 2 (Red) examples corresponding to (A–C).
A total of 851 radiomics features were extracted from each of the WVOI, Habitat 1, and Habitat 2, respectively, using the PyRadiomics package (version 3.1). These features included 13 shape features, 19 first-order features, 75 texture features, and 744 wavelet-based high-order features. To address variability sources related to image acquisition and reconstruction among different cohorts, known as batch effects, the ComBat harmonization method was applied to harmonize radiomics features extracted from these three cohorts first. ComBat utilizes an empirical Bayesian framework to independently estimate and correct batch-specific mean and variance shifts for each feature while preserving true biological variation (18, 19). Harmonization was performed using the Python neuroComBat software (v0.2.9). Batch correction was applied separately to the concatenated radiomic datasets (WVOI, Habitat1, and Habitat2) for Model-1 and Model-2 with the following specifications: number of batches = 3, reference batch = NLST (largest sample size), no biological covariates adjusted, Empirical Bayes shrinkage enabled, and both location (mean) and scale (variance) adjustments applied.
2.6 Radiomics feature selection and model development
This study developed two-step binary classification models aimed at predicting the pathological grades of NSCLC. The first model, referred to as Model-1, was designed to distinguish between pathological Grade 3 and the combined Grades 1 and 2. The second model, referred to as Model-2, aimed to further differentiate between pathological Grade 1 and Grade 2. The workflow for model construction is illustrated in Figure 3.
FIGURE 3

The workflow for model construction.
This study utilized samples from three cohorts to train both Model-1 and Model-2. The sample data were randomly stratified into training and testing sets in a 7:3 ratio during model training. Five-fold cross-validation was conducted to evaluate model performance and optimize hyperparameters, as shown in Figure 4.
FIGURE 4

Train and test datasets division.
Based on various combinations of radiomics features extracted from WVOI, Habitat 1, Habitat 2, and 13 clinical features, four classifiers were trained for both Model-1 and Model-2, respectively. The classifiers were as follows: (1) Clf WVOI, which utilized all radiomics features from WVOI only; (2) Clf Habitats, which included all radiomics features from Habitat 1 and Habitat 2 only; (3) Clf Clinical, which relied solely on the complete set of clinical features; and (4) Clf Total, which integrated all optimal features selected from the previous three single-modality models during the training process, as detailed in Table 3.
TABLE 3
| Name of classifier | Four classifiers to train with different feature | |||
|---|---|---|---|---|
| Clf WVOI | Clf Habitats | Clf Clinical | Clf total | |
| Feature composition | Radiomics features of WVOI | Radiomics features of Habitat1+Habitat2 | Clinical features | Total optimal features selected from the previous three models |
Features composition and classifier definitions.
Prior to training, outlier handling and Z-score standardization were applied to the radiomics feature data. These commonly used methods help reduce noise, equalize scales, and stabilize optimization, making the classification models more robust, reproducible, and trainable. To address the data imbalance issue in the training set, the synthetic minority over-sampling technique (SMOTE) was employed. Feature selection was performed primarily using the Least Absolute Shrinkage and Selection Operator (LASSO) and the Max-Relevance and Min-Redundancy (mRMR) algorithm. Finally, Logistic Regression (LR), a widely accepted traditional classification algorithm, was utilized to train the models. The mRMR was implemented using the mrmr_selection package (version 0.2.8). And outlier handling, Z-score, LASSO, and LR were all executed using scikit-learn (version 1.4.2).
2.7 Statistical analysis and classification performance evaluation
The independent samples t-test was utilized to compare normally distributed continuous variables between two groups; analysis of variance (ANOVA) was applied for comparisons among three or more groups. The Mann-Whitney U test was applied to continuous variables with non-normal distributions. The chi-square test was used for categorical variables, and the Kruskal-Wallis H test was used for ordinal variables. Spearman’s correlation was assessed for ordinal variables between two groups . A two-tailed p < 0.05 was considered statistically significant. All statistical analyses were conducted using Python 3.9 and R 4.2.
The performance of each classifier in the two-step classification models was evaluated using metrics such as the area under the receiver operating characteristic (ROC) curve (AUC), sensitivity (SENS), specificity (SPEC), and balanced accuracy (BACC) for an imbalanced dataset. BACC is calculated as the average of SENS and SPEC, ensuring that both categories contribute equally to the final prediction score in the binary classification. BACC provides a more reliable measure of model performance, particularly in the presence of class imbalance. Additionally, feature importances were analyzed using the SHAP (Shapley Additive Explanation) summary plot.
3 Results
3.1 Demographics and tumor characteristics
The demographic characteristics of the training and testing sets for Model-1 and Model-2 are summarized in Tables 4, 5, respectively. No significant differences were observed between the training set and testing set in terms of age, gender, smoking history, or tumor size.
TABLE 4
| Variable | Subjects (N) |
Train Set (N = 560) |
Test Set (N = 240) |
Statistics | P-value |
|---|---|---|---|---|---|
| Age (years, mean ± SD) | 800 | 63.24 ± 7.69 | 64.31 ± 8.20 | -1.763 | 0.078 |
| Gender, n (%) | |||||
| Female | 354 | 242 (43.21%) | 112 (46.67%) | 0.812 | 0.368 |
| Male | 446 | 318 (56.79%) | 128 (53.33%) | ||
| Smoke, n (%) | |||||
| No | 385 | 273 (48.75%) | 112 (46.67%) | 0.292 | 0.589 |
| Yes | 415 | 287 (51.25%) | 128 (53.33%) | ||
| Tumor size (mm, mean ± SD) | 800 | 21.63 ± 13.69 | 21.74 ± 12.62 | -0.106 | 0.916 |
Demographics and tumor characteristics for Model-1 (G3 vs. G1/G2).
TABLE 5
| Variable | Subjects (N) |
Train set (N = 394) |
Test set (N = 170) |
Statistics | P-Value |
|---|---|---|---|---|---|
| Age (years, mean ± SD) | 564 | 63.17 ± 8.37 | 63.35 ± 7.75 | -0.239 | 0.811 |
| Gender, n (%) | |||||
| Female | 278 | 193 (48.98%) | 85 (50.00%) | 0.049 | 0.825 |
| Male | 286 | 201 (51.02%) | 85 (50.00%) | ||
| Smoke, n (%) | |||||
| No | 292 | 196 (49.75%) | 90 (52.94%) | 2.151 | 0.143 |
| Yes | 272 | 198 (50.25%) | 80 (47.06%) | ||
| Tumor size (mm, mean ± SD) | 564 | 19.65 ± 10.40 | 19.34 ± 10.61 | 0.324 | 0.746 |
Demographics and tumor characteristics for Model-2 (G1 vs. G2).
3.2 Correlation analysis of clinical features
The associations between the 13 clinical features and pathological grade were assessed using Spearman’s rank correlation method. As shown in Table 6, age, lesion position, and pleural indentation showed no significant correlation with pathological grade. In contrast, the other ten clinical features exhibited significant correlations. Notably, lesion density showed the strongest positive correlation (coefficient = 0.42, p < 0.001).
TABLE 6
| Clinical features | Correlation coefficient |
P-value |
|---|---|---|
| Age (Year) | 0.05 | 0.17 |
| Size (mm) | 0.18 | < 0.001 |
| Gender (Female, Male) | 0.14 | < 0.001 |
| Smoke (Yes, No) | 0.12 | < 0.001 |
| Tumor-lung interface (Clear, blurred) | –0.25 | < 0.001 |
| Vacuole sign (Yes, No) | –0.13 | < 0.001 |
| Air bronchogram (Yes, No) | –0.18 | < 0.001 |
| Lobulation (Yes, No) | 0.13 | < 0.001 |
| Spiculation (Yes, No) | 0.23 | < 0.001 |
| Pleural indentation (Yes, No) | 0.03 | 0.39 |
| Vascular convergence (Yes, No) | 0.08 | 0.02 |
| Density (Ground glass, mixed, Solid) | 0.42 | < 0.001 |
| Position (Left hilum, Left upper lobe, Left lower lobe, Right hilum, Right upper lobe, Right middle lobe, Right lower lobe) | –0.05 | 0.18 |
Correlation analysis between Grade and clinical features.
3.3 Radiomics modeling performance
3.3.1 Performance of models
In Model-1 (G3 vs. G1/G2), the single-mode classifier Clf Habitats achieved the highest predictive performance among individual models, obtaining an AUC of 0.89 (95% CI: 0.86–0.93) and a BACC of 0.78 in the test set. This was followed by Clf_WVOI with an AUC of 0.83 (95% CI: 0.80–0.88) and a BACC of 0.75, whereas Clf Clinical performed the lowest performance, with an AUC of 0.79 (95% CI: 0.74–0.84) and a BACC of 0.75. Compared with single-modality classifiers, the multimodal integrated model (Clf Total), constructed from the optimal subset of WVOI, habitat, and clinical features, yielded superior predictive performance in the test set, with an AUC of 0.91 (95% CI: 0.87–0.94) and a BACC of 0.82.
In Model-2 (G1 vs. G2), Clf Habitats also significantly outperformed Clf WVOI and Clf Clinical, achieving an AUC of 0.87 (95% CI: 0.82–0.91) and a BACC of 0.79 in the test set. Clf Clinical again exhibited the lowest performance, with an AUC of 0.62 (95% CI: 0.55–0.70) and a BACC of 0.60. Clf Total achieved the highest performance in the test set, with an AUC of 0.88 (95% CI: 0.82–0.92) and a BACC of 0.81. The ROC curves and detailed performance metrics for all four classifiers in the training and test sets for both Model-1 and Model-2 are presented in Figure 5 and Table 7, respectively.
FIGURE 5
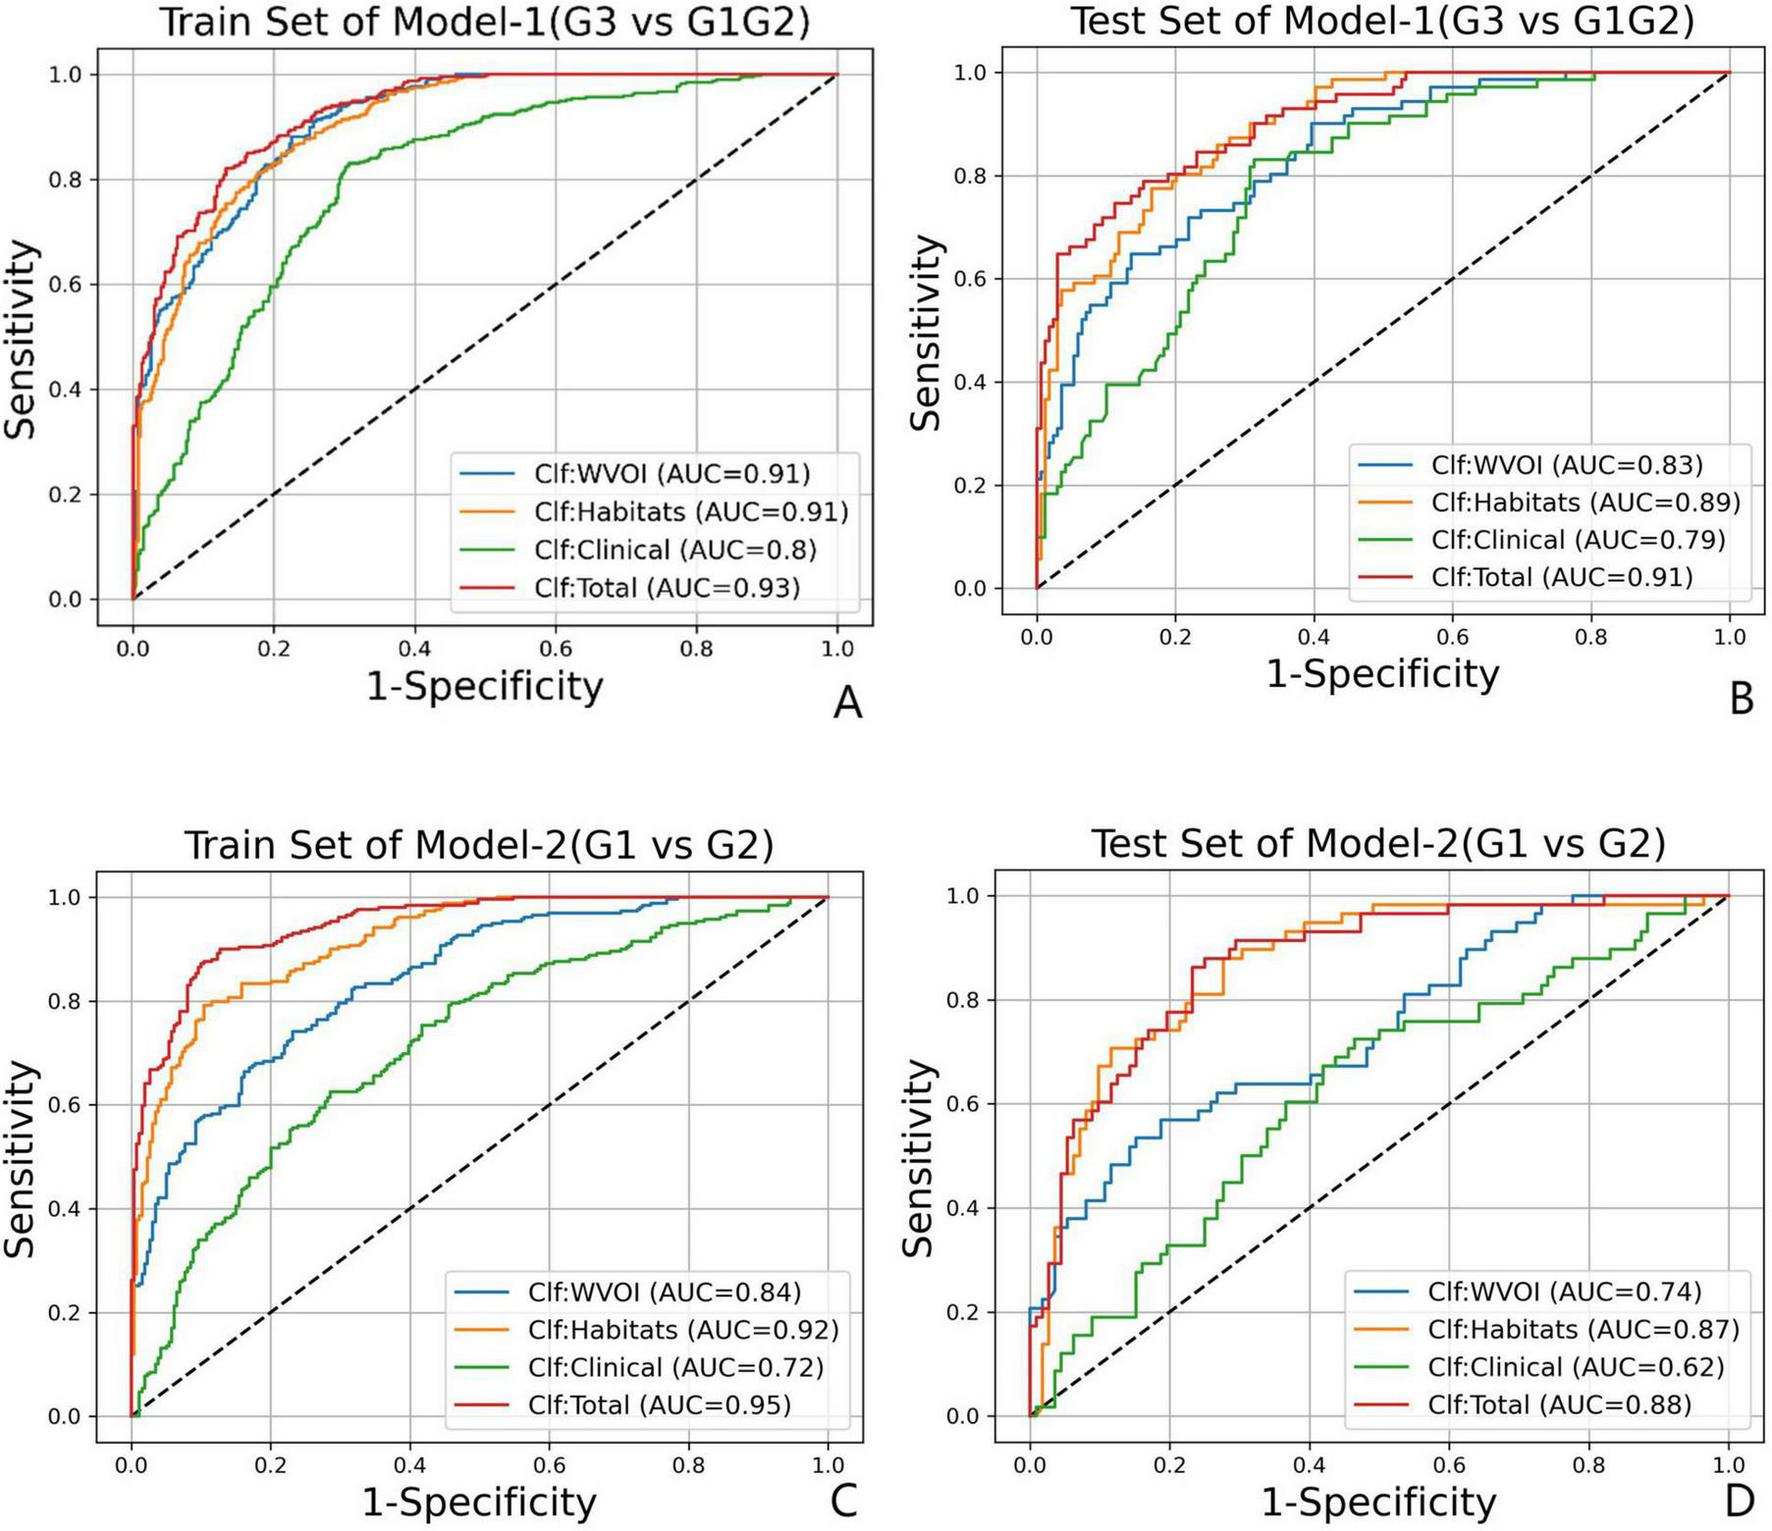
The ROC curves for Model-1(G3 vs. G1/G2) in (A) train set and (B) test set, and for Model-2(G1 vs. G2) in (C) train set and (D) test set.
TABLE 7
| Models | Classifier | Train set | Test set | ||||||
|---|---|---|---|---|---|---|---|---|---|
| AUC (95%CI) | Sensitivity | Specificity | Balanced accuracy |
AUC (95%CI) |
Sensitivity | Specificity | Balanced accuracy |
||
| Model-1 | Clf WVOI | 0.91 (0.89–0.93) | 0.88 | 0.78 | 0.83 | 0.83 (0.80–0.88) | 0.80 | 0.69 | 0.75 |
| Clf Habitats | 0.91 (0.89–0.92) | 0.85 | 0.79 | 0.82 | 0.89 (0.86–0.93) | 0.83 | 0.73 | 0.78 | |
| Clf Clinical | 0.80 (0.78–0.83) | 0.83 | 0.70 | 0.76 | 0.79 (0.74–0.84) | 0.83 | 0.67 | 0.75 | |
| Clf Total | 0.93 (0.91–0.94) | 0.82 | 0.87 | 0.84 | 0.91 (0.87–0.94) | 0.80 | 0.84 | 0.82 | |
| Model-2 | Clf WVOI | 0.84 (0.81–0.87) | 0.74 | 0.77 | 0.75 | 0.74 (0.67–0.81) | 0.64 | 0.61 | 0.62 |
| Clf Habitats | 0.92 (0.90–0.94) | 0.79 | 0.90 | 0.84 | 0.87 (0.82–0.91) | 0.84 | 0.73 | 0.79 | |
| Clf Clinical | 0.72 (0.68–0.76) | 0.62 | 0.71 | 0.67 | 0.62 (0.55–0.70) | 0.60 | 0.60 | 0.60 | |
| Clf Total | 0.95 (0.93–0.96) | 0.87 | 0.90 | 0.89 | 0.88 (0.82–0.92) | 0.86 | 0.77 | 0.81 | |
Classification performance of two-step models.
The DeLong test was used to compare the classification performance of the four classifiers in the test sets of Model-1 and Model-2. The results demonstrated that, in both Model-1 and Model-2, Clf Habitats significantly outperformed Clf WVOI and Clf Clinical (P < 0.001), whereas no statistically significant difference was observed between Clf Habitats and Clf Total. The comparative results are illustrated in Figure 6.
FIGURE 6

DeLong test p-value heatmap for (A) Model-1(G3 vs. G1/G2) and (B) Model-2(G1 vs. G2).
3.3.2 Interpreting Clf total model decisions via SHAP
SHAP summary plots were utilized to interpret the decision-making process of the overall classifier (Clf Total) in Model-1 and Model-2. Figure 7 displays the top ten most contributory features and quantifies the marginal contribution of each feature to the model output. In both models, texture features and high-order features derived from wavelet transformations constituted the majority of the feature weights. In Model-1, wavelet-HHL_glszm_LargeAreaLowGrayLevelEmphasis provided the greatest predictive contribution to Clf Total, whereas original_firstorder_Kurtosis was the most contributory feature in Model-2. Habitat-related features occupied two of the top feature positions in Model-1; this number increased to five in Model-2.
FIGURE 7

SHAP feature importance analysis for Clf Total of (A) Model-1(G3 vs. G1/G2) and (B) Model-2(G1 vs. G2) (top 10 features shown); prefix of H1 and H2 stand for Habitat1 and Habitat2.
4 Discussion
The imaging features of NSCLC correlate with tumor grade: G3 tumors show distinct characteristics relative to G1, whereas G2 presents intermediate features that often lead to misclassification as either G1 or G3. To overcome this diagnostic challenge, we designed a two-step binary classification framework. Model-1 classified G3 (positive) against combined G1/G2 (negative). Model-2 then differentiated G1 from G2. The results confirm the viability of this strategy. The stepwise design aligns with clinical decision-making, thereby improving model interpretability and acceptability.
Previous studies have demonstrated the value of radiomics in predicting the pathological grade of LUAD. For instance, Wang et al. (11) developed a radiomics-deep learning model to identify micropapillary/solid components, achieving an overall accuracy of 0.913. Ninomiya K. et al. (20) used high-resolution CT-based radiomics to predict solid and micropapillary components with an AUC of 0.902. However, these models only identify high-grade (G3) tumors and do not differentiate between G1 and G2 grades. Moreover, their study populations were restricted to LUAD, excluding other NSCLC subtypes. Another limitation is that their feature extraction methods may not adequately capture intratumoral spatial heterogeneity, which constrains the generalizability and clinical utility of these models. In contrast, habitat analysis employs unsupervised clustering to partition tumors into distinct habitats based on their imaging phenotypes. These habitats correspond to divergent proliferative, invasive, and metabolic profiles, which may predict variations in treatment response. Consequently, this approach yields more granular biomarkers, improving its potential to support precision diagnostics and guide therapy planning (7, 21, 22).
This study investigates habitat radiomics to predict pathological grading in NSCLC. The Clf Habitats showed advantages in single-modality tasks, achieving AUC values of 0.89 for Model-1 and 0.87 for Model-2, outperforming the WVOI and clinical models. These results highlight the superior predictive value of the habitat radiomics model for NSCLC pathological grading. The multimodal model (Clf Total) integrating WVOI, habitat, and clinical features achieved AUC values of 0.91 for G3 prediction and 0.88 for G1. While Clf Habitats exhibited high sensitivity, its specificity (0.73 for both Model-1 and Model-2) was lower than Clf Total (0.84 for Model-1, 0.77 for Model-2), making Clf Total more suitable for preoperative scenarios where controlling false positives is critical. Conversely, the simpler Clf Habitats model, with reduced data complexity and high sensitivity, may be more applicable for screening purposes where identifying all potential positive cases is a priority.
SHAP analysis revealed that the most predictive features were predominantly derived from wavelet-transformed texture metrics. In Model-1, the feature wavelet-HHL_glszm_LargeAreaLowGrayLevelEmphasis was the most influential predictor for classifying G3 tumors. This metric quantifies the predominance of large, interconnected regions with low signal intensity. Higher values indicate more extensive hypointense areas on imaging, which are highly suggestive of pathological findings such as necrosis—a well-documented characteristic of poorly differentiated tumors compared to their well-differentiated counterparts (23, 24). In Model-1, two habitat-based features ranked among the top 10 most important features. In contrast, in the more challenging task of Model-2, the contribution of habitat features increased significantly, with five such features ranking the top 10. Moreover, their SHAP absolute values were higher than those of habitat features in Model-1. This discrepancy suggests that spatial tumor heterogeneity may play a more critical role in distinguishing between G1 and G2 grades, while habitat features provide greater discriminatory power in clinical scenarios requiring subtle differentiation between pathological grades.
Our two-stage framework is supported by prior evidence highlighting the intrinsic complexity and heterogeneity of pathological grading in lung cancer. Histopathological studies have shown that multiple growth patterns and differentiation grades frequently coexist within the same tumor, particularly in intermediate-grade categories, resulting in substantial interobserver variability and limited reproducibility when grading is performed using a single-step strategy (4, 24). In line with this observation, Zheng et al. (25) proposed a two-step radiomics framework for IASLC grading of invasive pulmonary adenocarcinoma, in which an initial submodel identified the presence of any high-grade component, followed by a second submodel for predominant subtype differentiation. This staged design improved discrimination of higher-grade lesions compared with a one-step model. Furthermore, the superior performance of the habitat-based model indicates that such a two-step strategy effectively refines the accuracy of pathological grading. Most earlier radiomics studies addressing lung cancer grading have focused on adenocarcinoma and have relied on binary classification strategies to detect specific high-risk growth patterns, such as micropapillary or solid components (26–28). Although these approaches demonstrated reasonable accuracy when features were extracted from near-pure histopathological regions, they implicitly assume spatial homogeneity or require prior knowledge of subtype-dominant areas. Consequently, their applicability to tumors with mixed or ambiguous histology, or to broader NSCLC populations encompassing multiple histologic subtypes, remains limited.
Habitat-based radiomics provides a structured solution to this limitation by explicitly delineating spatially distinct intratumoral subregions based on voxel-wise radiomic patterns. Bernatowicz et al. (29) demonstrated that voxel-wise radiomics features characterizing texture heterogeneity, particularly entropy- and energy-based metrics, can be reproducibly computed across lung cancer CT datasets and yield stable imaging habitats when robust features are selected. These findings establish a methodological foundation for capturing biologically meaningful spatial heterogeneity beyond whole-tumor summary statistics. Recent NSCLC studies further support the clinical relevance of heterogeneity-aware imaging biomarkers, with habitat-based approaches improving prediction of recurrence, treatment response, and immune-related outcomes when integrated with complementary molecular or clinical data (10, 21, 30). Collectively, these results indicate that spatially resolved imaging phenotypes capture biologically relevant information lost in global analyses.
Recent advancements in molecular biology, immunology, and nanotherapy have underscored that NSCLC exhibits pronounced multidimensional heterogeneity across spatial, cellular, and molecular scales (31–37). Variations in receptor expression patterns, the extent of immune infiltration, and drug sensitivity collectively manifest the biological diversity within individual tumors and across patient cohorts, fundamentally influencing therapeutic outcomes and clinical prognosis. These insights align closely with the understanding of functional regional heterogeneity observed at the imaging level, suggesting that distinct intra-tumoral functional domains can be visualized and quantified via radiomics. Consequently, habitat-based radiomics establishes a robust conceptual bridge between biological complexity and macro-scale imaging phenotypes, facilitating the non-invasive evaluation of spatially heterogeneous tumor biology.
This study has several limitations. First, this study incorporated CT images from multiple centers and public datasets, resulting in heterogeneity in scanner models, acquisition protocols, and reconstruction parameters. Although ComBat harmonization was applied to mitigate batch effects, residual variability related to underlying physical imaging characteristics and reconstruction algorithms cannot be fully eliminated, which may influence radiomics feature stability and model generalizability. Second, the model was developed and validated using retrospective data, which may introduce selection bias. The two public datasets used also reflect imaging acquired over an earlier time period. Future studies may incorporate prospective, multi-center data for external validation to further improve model generalizability. Third, pathological grading of NSCLC was predicted based solely on non-contrast CT images. Future work may integrate additional imaging modalities, such as contrast-enhanced CT or spectral imaging, to improve predictive performance. Fourth, the clinical semantic model included only CT features and basic clinical parameters. In addition, this study did not include benchmarking against multiple alternative classifiers. The focus of this work was on assessing a two-stage, heterogeneity-aware framework rather than on algorithmic comparison, and direct classifier benchmarking is inherently confounded by differences in data composition, feature engineering, and grading definitions. Therefore, such comparisons were considered beyond the scope of the present study.
5 Conclusion
Habitat radiomics offers significant advantages over traditional radiomics in predicting the pathological grading of NSCLC by quantifying tumor spatial heterogeneity. The multimodal model developed in this study shows strong classification performance and greater specificity, providing essential evidence for developing personalized treatment strategies for NSCLC patients.
Statements
Data availability statement
The original contributions presented in the study are included in the article/supplementary material, further inquiries can be directed to the corresponding author.
Ethics statement
The studies involving humans were approved by the First Affiliated Hospital of Harbin Medical University. The studies were conducted in accordance with the local legislation and institutional requirements. The ethics committee/institutional review board waived the requirement of written informed consent for participation from the participants or the participants’ legal guardians/next of kin because this study was a retrospective observational study that was approved by the Ethics Committee of The First Affiliated Hospital of Harbin Medical University, with a waiver of the requirement for informed patient consent. All data were rigorously anonymized, with any personally identifiable information removed to ensure patient privacy and security.
Author contributions
DX: Investigation, Software, Methodology, Writing – original draft. CS: Writing – review & editing, Software. MX: Formal analysis, Writing – review & editing, Data curation. XX: Supervision, Conceptualization, Writing – review & editing.
Funding
The author(s) declared that financial support was not received for this work and/or its publication.
Conflict of interest
The author(s) declared that this work was conducted in the absence of any commercial or financial relationships that could be construed as a potential conflict of interest.
Generative AI statement
The author(s) declared that generative AI was not used in the creation of this manuscript.
Any alternative text (alt text) provided alongside figures in this article has been generated by Frontiers with the support of artificial intelligence and reasonable efforts have been made to ensure accuracy, including review by the authors wherever possible. If you identify any issues, please contact us.
Publisher’s note
All claims expressed in this article are solely those of the authors and do not necessarily represent those of their affiliated organizations, or those of the publisher, the editors and the reviewers. Any product that may be evaluated in this article, or claim that may be made by its manufacturer, is not guaranteed or endorsed by the publisher.
Footnotes
1.^ https://www.cancerimagingarchive.net/collection/nlst/
2.^ https://www.cancerimagingarchive.net/collection/nsclc- radiogenomics/
References
1.
Bray F Laversanne M Sung H Ferlay J Siegel R Soerjomataram I et al Global cancer statistics 2022: GLOBOCAN estimates of incidence and mortality worldwide for 36 cancers in 185 countries. CA Cancer J Clin. (2024) 74:229–63. 10.3322/caac.21834
2.
Rokutan-Kurata M Yoshizawa A Ueno K Nakajima N Terada K Hamaji M et al Validation study of the international association for the study of lung cancer histologic grading system of invasive lung adenocarcinoma. J Thorac Oncol. (2021) 16:1753–8. 10.1016/j.jtho.2021.04.008
3.
Fujikawa R Muraoka Y Kashima J Yoshida Y Ito K Watanabe H et al Clinicopathologic and genotypic features of lung adenocarcinoma characterized by the international association for the study of lung cancer grading system. J Thorac Oncol. (2022) 17:700–7. 10.1016/j.jtho.2022.02.005
4.
Yeh Y Nitadori J Kadota K Yoshizawa A Rekhtman N Moreira A et al Using frozen section to identify histological patterns in stage I lung adenocarcinoma of = 3 cm: accuracy and interobserver agreement. Histopathology. (2015) 66:922–38. 10.1111/his.12468
5.
Kim C Sari M Grimaldi E VanderLaan P Brook A Brook OR . CT-guided coaxial lung biopsy: number of cores and association with complications.Radiology. (2024) 313:e232168. 10.1148/radiol.232168
6.
Zhang L Wang Y Peng Z Weng Y Fang Z Xiao F et al The progress of multimodal imaging combination and subregion based radiomics research of cancers. Int J Biol Sci. (2022) 18:3458–69. 10.7150/ijbs.71046
7.
Ye G Wu G Zhang C Wang M Liu H Song E et al CT-based quantification of intratumoral heterogeneity for predicting pathologic complete response to neoadjuvant immunochemotherapy in non-small cell lung cancer. Front Immunol. (2024) 15:1414954. 10.3389/fimmu.2024.1414954
8.
Prior O Macarro C Navarro V Monreal C Ligero M Garcia-Ruiz A et al Identification of precise 3D CT radiomics for habitat computation by machine learning in cancer. Radiol Artif Intell. (2024) 6:e230118. 10.1148/ryai.230118
9.
Liu Z Mouni D Zhang S Du T Li C Grzegorzek M et al Predicting the early response to neoadjuvant chemotherapy in high-grade serous ovarian cancer by intratumoral habitat heterogeneity based on (18)F-FDG PET/CT. Eur J Nucl Med Mol Imaging. (2025) 53:979–91. 10.1007/s00259-025-07480-z
10.
Sujit S Aminu M Karpinets T Chen P Saad M Salehjahromi M et al Enhancing NSCLC recurrence prediction with PET/CT habitat imaging, ctDNA, and integrative radiogenomics-blood insights. Nat Commun. (2024) 15:3152. 10.1038/s41467-024-47512-0
11.
Wang X Zhang L Yang X Tang L Zhao J Chen G et al Deep learning combined with radiomics may optimize the prediction in differentiating high-grade lung adenocarcinomas in ground glass opacity lesions on CT scans. Eur J Radiol. (2020) 129:109150. 10.1016/j.ejrad.2020.109150
12.
Li Y Liu J Yang X Wang A Zang C Wang L et al An ordinal radiomic model to predict the differentiation grade of invasive non-mucinous pulmonary adenocarcinoma based on low-dose computed tomography in lung cancer screening. Eur Radiol. (2023) 33:3072–82. 10.1007/s00330-023-09453-y
13.
Zhou J Hu B Feng W Zhang Z Fu X Shao H et al An ensemble deep learning model for risk stratification of invasive lung adenocarcinoma using thin-slice CT. NPJ Digit Med. (2023) 6:119. 10.1038/s41746-023-00866-z
14.
Wasserthal J Breit H Meyer M Pradella M Hinck D Sauter A et al TotalSegmentator: robust segmentation of 104 anatomic structures in CT images. Radiol Artif Intell. (2023) 5:e230024. 10.1148/ryai.230024
15.
Xu J Liu L Ji Y Yan T Shi Z Pan H et al Enhanced CT-based intratumoral and peritumoral radiomics nomograms predict high-grade patterns of invasive lung adenocarcinoma. Acad Radiol. (2025) 32:482–92. 10.1016/j.acra.2024.07.026
16.
van Griethuysen J Fedorov A Parmar C Hosny A Aucoin N Narayan V et al Computational radiomics system to decode the radiographic phenotype. Cancer Res. (2017) 77:e104–7. 10.1158/0008-5472.Can-17-0339
17.
Zwanenburg A Vallières M Abdalah M Aerts H Andrearczyk V Apte A et al The image biomarker standardization initiative: standardized quantitative radiomics for high-throughput image-based phenotyping. Radiology. (2020) 295:328–38. 10.1148/radiol.2020191145
18.
Fortin J Parker D Tunç B Watanabe T Elliott M Ruparel K et al Harmonization of multi-site diffusion tensor imaging data. Neuroimage. (2017) 161:149–70. 10.1016/j.neuroimage.2017.08.047
19.
Khodabakhshi Z Amini M Hajianfar G Oveisi M Shiri I Zaidi H . Dual-centre harmonised multimodal positron emission tomography/computed tomography image radiomic features and machine learning algorithms for non-small cell lung cancer histopathological subtype phenotype decoding.Clin Oncol. (2023) 35:713–25. 10.1016/j.clon.2023.08.003
20.
Ninomiya K Yanagawa M Tsubamoto M Sato Y Suzuki Y Hata A et al Prediction of solid and micropapillary components in lung invasive adenocarcinoma: radiomics analysis from high-spatial-resolution CT data with 1024 matrix. Jpn J Radiol. (2024) 42:590–8. 10.1007/s11604-024-01534-2
21.
Wu Y Zhang W Liang X Zhang P Zhang M Jiang Y et al Habitat radiomics analysis for progression free survival and immune-related adverse reaction prediction in non-small cell lung cancer treated by immunotherapy. J Transl Med. (2025) 23:393. 10.1186/s12967-024-06057-y
22.
Park J Kim H Kim N Park S Kim Y Kim J . Spatiotemporal heterogeneity in multiparametric physiologic MRI is associated with patient outcomes in IDH-wildtype glioblastoma.Clin Cancer Res. (2021) 27:237–45. 10.1158/1078-0432.Ccr-20-2156
23.
Caruso R Parisi A Bonanno A Paparo D Quattrocchi E Branca G et al Histologic coagulative tumour necrosis as a prognostic indicator of aggressiveness in renal, lung, thyroid and colorectal carcinomas: a brief review. Oncol Lett. (2012) 3:16–8. 10.3892/ol.2011.420
24.
Mäkinen J Laitakari K Johnson S Mäkitaro R Bloigu R Pääkkö P et al Histological features of malignancy correlate with growth patterns and patient outcome in lung adenocarcinoma. Histopathology. (2017) 71:425–36. 10.1111/his.13236
25.
Zheng S Liu J Xie J Zhang W Bian K Liang J et al Differentiating high-grade patterns and predominant subtypes for IASLC grading in invasive pulmonary adenocarcinoma using radiomics and clinical-semantic features. Cancer Imaging. (2025) 25:42. 10.1186/s40644-025-00864-2
26.
Song S Park H Lee G Lee H Sohn I Kim H et al Imaging phenotyping using radiomics to predict micropapillary pattern within lung adenocarcinoma. J Thorac Oncol. (2017) 12:624–32. 10.1016/j.jtho.2016.11.2230
27.
Chen L Yang S Wang H Chen Y Lin M Hsieh M et al Prediction of micropapillary and solid pattern in lung adenocarcinoma using radiomic values extracted from near-pure histopathological subtypes. Eur Radiol. (2021) 31:5127–38. 10.1007/s00330-020-07570-6
28.
He B Song Y Wang L Wang T She Y Hou L et al A machine learning-based prediction of the micropapillary/solid growth pattern in invasive lung adenocarcinoma with radiomics. Transl Lung Cancer Res. (2021) 10:955–64. 10.21037/tlcr-21-44
29.
Bernatowicz K Grussu F Ligero M Garcia A Delgado E Perez-Lopez R . Robust imaging habitat computation using voxel-wise radiomics features.Sci Rep. (2021) 11:20133. 10.1038/s41598-021-99701-2
30.
Caii W Wu X Guo K Chen Y Shi Y Chen J . Integration of deep learning and habitat radiomics for predicting the response to immunotherapy in NSCLC patients.Cancer Immunol Immunother. (2024) 73:153. 10.1007/s00262-024-03724-3
31.
Ji Q Zhu H Qin Y Zhang R Wang L Zhang E et al GP60 and SPARC as albumin receptors: key targeted sites for the delivery of antitumor drugs. Front Pharmacol. (2024) 15:1329636. 10.3389/fphar.2024.1329636
32.
Wang W Ren S Wang Z Zhang C Huang J . Increased expression of TTC21A in lung adenocarcinoma infers favorable prognosis and high immune infiltrating level.Int Immunopharmacol. (2020) 78:106077. 10.1016/j.intimp.2019.106077
33.
Wang C Ding S Sun B Shen L Xiao L Han Z et al Hsa-miR-4271 downregulates the expression of constitutive androstane receptor and enhances in vivo the sensitivity of non-small cell lung cancer to gefitinib. Pharmacol Res. (2020) 161:105110. 10.1016/j.phrs.2020.105110
34.
Wang J Su G Yin X Luo J Gu R Wang S et al Non-small cell lung cancer-targeted, redox-sensitive lipid-polymer hybrid nanoparticles for the delivery of a second-generation irreversible epidermal growth factor inhibitor-Afatinib: In vitro and in vivo evaluation. Biomed Pharmacother. (2019) 120:109493. 10.1016/j.biopha.2019.109493
35.
Chen Z Huang K Ling Y Goto M Duan H Tong X et al Discovery of an oleanolic acid/hederagenin-nitric oxide donor hybrid as an EGFR tyrosine kinase inhibitor for non-small-cell lung cancer. J Nat Prod. (2019) 82:3065–73. 10.1021/acs.jnatprod.9b00659
36.
Cao M Long M Chen Q Lu Y Luo Q Zhao Y et al Development of β-elemene and cisplatin co-loaded liposomes for effective lung cancer therapy and evaluation in patient-derived tumor xenografts. Pharm Res. (2019) 36:121. 10.1007/s11095-019-2656-x
37.
Meng R Zuo L Zhou X . Delivery of PTEN protein into tumor cells as a promising strategy for cancer therapy via active albumin nanoparticles: a hypothesis.Med Hypotheses. (2024) 184:111271. 10.1016/j.mehy.2024.111271
Summary
Keywords
computed tomography, grading, habitat, non-small cell lung cancer, radiomics
Citation
Xie D, Sun C, Xue M and Xiao X (2026) Development and validation of a CT-based habitat radiomics model for predicting pathological grading in non-small cell lung cancer. Front. Med. 13:1722634. doi: 10.3389/fmed.2026.1722634
Received
11 October 2025
Revised
24 January 2026
Accepted
28 January 2026
Published
12 February 2026
Volume
13 - 2026
Edited by
Liang Zhao, Dalian University of Technology, China
Reviewed by
Petar Brlek, St. Catherine Specialty Hospital, Croatia
Run Meng, Nantong University, China
Updates
Copyright
© 2026 Xie, Sun, Xue and Xiao.
This is an open-access article distributed under the terms of the Creative Commons Attribution License (CC BY). The use, distribution or reproduction in other forums is permitted, provided the original author(s) and the copyright owner(s) are credited and that the original publication in this journal is cited, in accordance with accepted academic practice. No use, distribution or reproduction is permitted which does not comply with these terms.
*Correspondence: Xigang Xiao, xxgct_417@126.com
Disclaimer
All claims expressed in this article are solely those of the authors and do not necessarily represent those of their affiliated organizations, or those of the publisher, the editors and the reviewers. Any product that may be evaluated in this article or claim that may be made by its manufacturer is not guaranteed or endorsed by the publisher.