Abstract
Background:
The red blood cell distribution width-to-albumin ratio (RAR) has shown prognostic value in sepsis, diabetes comorbidities, and cancer (CA). However, its relevance to clinical outcomes in sepsis-associated acute kidney injury (SA-AKI) remains unclear. This study aimed to explore this relationship.
Methods:
A retrospective cohort study was conducted on SA-AKI patients admitted to the Intensive Care Unit of Baise People's Hospital, Guangxi, from May 2022 to May 2025. The primary endpoint was 28-day all-cause mortality. The prognostic utility of RAR was assessed using multivariable Cox regression, restricted cubic splines (RCS), Kaplan–Meier survival curves with log-rank tests, stratified analysis, receiver operating characteristic (ROC) curves, subgroup, and sensitivity analyses.
Results:
Among the 161 enrolled patients (mean age 63.7 ± 16.6 years), the mean RAR was 6.95 ± 2.81%/g/dl. A linear association between RAR and mortality was observed (non-linearity p = 0.162). After multivariable adjustment, the highest RAR quartile (Q4: >8.31) was associated with a hazard ratio (HR) of 7.52 (95% CI: 2.24–25.29) compared to Q1 (< 5.07). Kaplan–Meier analysis revealed significantly higher mortality in the high-RAR groups (p < 0.001). The area under the ROC curve (AUC) for RAR in predicting 28-day mortality was 0.694 (95% CI: 0.612–0.776). Combining RAR with the lactate-to-albumin ratio (LAR) significantly enhanced predictive accuracy (AUC: 0.777; 95% CI: 0.703–0.851; p = 0.043 vs. RAR alone).
Conclusion:
Elevated RAR independently predicts adverse early prognosis in SA-AKI, with higher levels correlating with increased 28-day mortality. The combination of RAR and LAR significantly improves mortality prediction in this cohort.
1 Introduction
Sepsis-associated acute kidney injury (SA-AKI) is a common and critical complication in intensive care settings, associated with significant mortality risk. The systemic inflammatory response triggered by sepsis leads to renal dysfunction through various mechanisms, with an increasing incidence observed in recent years (1). SA-AKI contributes to substantial morbidity and mortality (2). Following the Sepsis-3.0 definition update in 2016, international multicenter studies consistently show that sepsis patients who develop AKI have a 2–3-fold higher hospital mortality risk (3). Accurate prognostication in SA-AKI is critical for enabling timely and aggressive interventions (4).
While established scoring systems are correlated with SA-AKI outcomes (5, 6), their clinical applicability is hindered by operational complexity, reducing their effectiveness as bedside predictive tools. Consequently, there is an unmet need for readily available biomarkers with strong predictive power to identify high-risk patients and guide therapeutic decision-making.
Red blood cell distribution width (RDW), a routine hematological measure of erythrocyte size variability (anisocytosis), is a cost-effective prognostic indicator across various conditions, including cardiovascular, renal, metabolic, and hepatic disorders (7). Emerging evidence highlights RDW as a marker of inflammatory load and oxidative stress, with prognostic significance in both sepsis and AKI populations (8, 9). Serum albumin, an acute-phase reactant, reflects nutritional status and exerts anti-inflammatory effects by reducing oxidative stress and preventing endothelial apoptosis (10, 11). Its prognostic value in sepsis is well-established (12).
The red cell distribution width-to-albumin ratio (RAR) is a novel inflammatory biomarker that integrates these pathways. Previous studies have demonstrated its prognostic value in conditions such as diabetic ketoacidosis (13), diabetic retinopathy (14), malignancies (15), and sepsis (16). However, the relationship between RAR and clinical outcomes, specifically in SA-AKI patients, remains unexplored.
This retrospective cohort study aims to assess the prognostic value of RAR in SA-AKI patients admitted to the intensive care unit of Baise People's Hospital, Guangxi, from May 2022 to May 2025.
2 Methods
2.1 Data source
This retrospective cohort study included SA-AKI patients admitted to the ICU of Baise People's Hospital, Guangxi, China, from May 2022 to May 2025. Ethical approval was granted by the Institutional Review Board (KY2022030401), with a waiver of informed consent due to the study's retrospective design. The study adhered to the Declaration of Helsinki and followed STROBE reporting guidelines.
2.2 Study population
Inclusion criteria: First-time hospital and ICU admission with SA-AKI.
Exclusion criteria: Age < 18 years; missing RDW or albumin data; pre-existing CKD; ICU stay < 24 h; human albumin infusion within 48 h prior to ICU admission; >10% missing covariate data.
The diagnosis of SA-AKI required fulfillment of dual criteria: Sepsis-3 guidelines for sepsis (17) and KDIGO standards for acute kidney injury (AKI) (18). Additionally, AKI manifestation must occur within 7 days following sepsis identification (any stage). Sepsis was characterized as life-threatening organ dysfunction resulting from a dysregulated host response to infection. This required evidence of confirmed or suspected infection during the initial 24-h ICU admission period, accompanied by a Sequential Organ Failure Assessment (SOFA) score ≥2. AKI was established through meeting any single criterion below: (1) serum creatinine elevation ≥0.3 mg/dl (≥26.5 μmol/L) over a 2-day period; (2) creatinine levels rising to ≥1.5times baseline values within the preceding week; or (3) sustained urine production ≤ 0.5 ml/kg/h for six or more hours.
2.3 Data collection
To minimize confounding from subsequent treatments, the first available measurements within 24 h of ICU admission were collected, including RDW, blood lactate, and serum albumin. Potential confounders included: demographic variables (age, gender), comorbidities [coronary artery disease (CAD), diabetes mellitus (DM), cerebrovascular accident (CVA), cancer (CA), high blood pressure (HBP)], clinical parameters [heart rate (HR), body temperature (T), mean arterial pressure (MAP), respiratory rate (RR), SOFA score, mechanical ventilation (MV), vasoactive agents, Acute Physiology and Chronic Health Evaluation II (APACHE II) score, continuous renal-replacement therapy (CRRT)], laboratory indices [Hematology: white blood cells (WBC), hematocrit (HCT), platelets (PLT), hemoglobin (HGB), red-cell distribution width (RDW); Biochemistry: albumin (ALB), potassium (K), sodium (Na), lactate (lac), PaO2/FiO2 ratio, blood urea nitrogen (BUN); Coagulation: prothrombin time (PT), D-dimer, activated partial thromboplastin time (APTT); Liver function: aspartate aminotransferase (AST)], alanine aminotransferase (ALT), Total Bilirubin (TBil), Direct Bilirubin (DBil), Indirect Bilirubin (IBil), and derived ratios (RAR: RDW/albumin; LAR: lactate/albumin).
Missing continuous data were imputed using multiple imputation by chained equations (5 imputations), with covariates showing >10% missingness excluded from the analysis. All parameters reflect the first measurements obtained within 24 h of ICU admission. The primary endpoint was 28-day all-cause mortality.
2.4 Statistical analysis
Stratification was based on RAR quartiles (Q1–Q4). Descriptive statistics were calculated as follows: continuous variables were expressed as mean ± SD or median (IQR), and comparisons were made using ANOVA or t-tests; categorical variables were reported as n (%) with comparisons performed using χ2 or Fisher's exact tests. The primary analysis involved multivariable Cox regression to assess the association between RAR and mortality, reporting hazard ratios (HRs) with 95% confidence intervals (CIs). Covariates were selected based on the change-in-estimate criterion (>10% HR alteration) or clinical relevance.
Adjustment models were constructed as follows: Crude: Unadjusted; Model 1: Adjusted for CA, HR, RR; Model 2: Model 1 plus Na, PLT, BUN; Model 3: Model 2 plus PT, APTT.
Supplementary analyses included: Nonlinearity: Assessed using restricted cubic splines (RCS, four knots); Survival: Analyzed with Kaplan–Meier curves and log-rank tests; Discrimination: Evaluated using receiver operating characteristic (ROC) curves and AUC comparisons. The software used for analysis was Free Statistical Software v2.2. Significance was determined at a two-sided p-value of < 0.05.
2.5 Subgroup and sensitivity analyses
Subgroup analyses were performed for the following variables: age (< 60/≥60), gender, coronary artery disease, cerebrovascular accident, diabetes mellitus, high blood pressure, bloodstream infection, and MAP (< 65/≥65 mmHg). Sensitivity analyses included: Exclusion of cases with bloodstream infection; Exclusion of non-CRRT patients to address confounding by CRRT.
3 Results
3.1 Study population and baseline characteristics
A total of 220 first-time SA-AKI patients, both first-time hospital and first-time ICU admissions, were screened. After applying exclusion criteria−27 patients with missing RDW/albumin data or more than 10% missing covariate data, 19 patients aged < 18 years or with ICU stays < 24 h, and 13 patients who received human albumin infusion within 48 h before ICU admission or had pre-existing chronic kidney disease−161 patients were ultimately included (Figure 1).
Figure 1
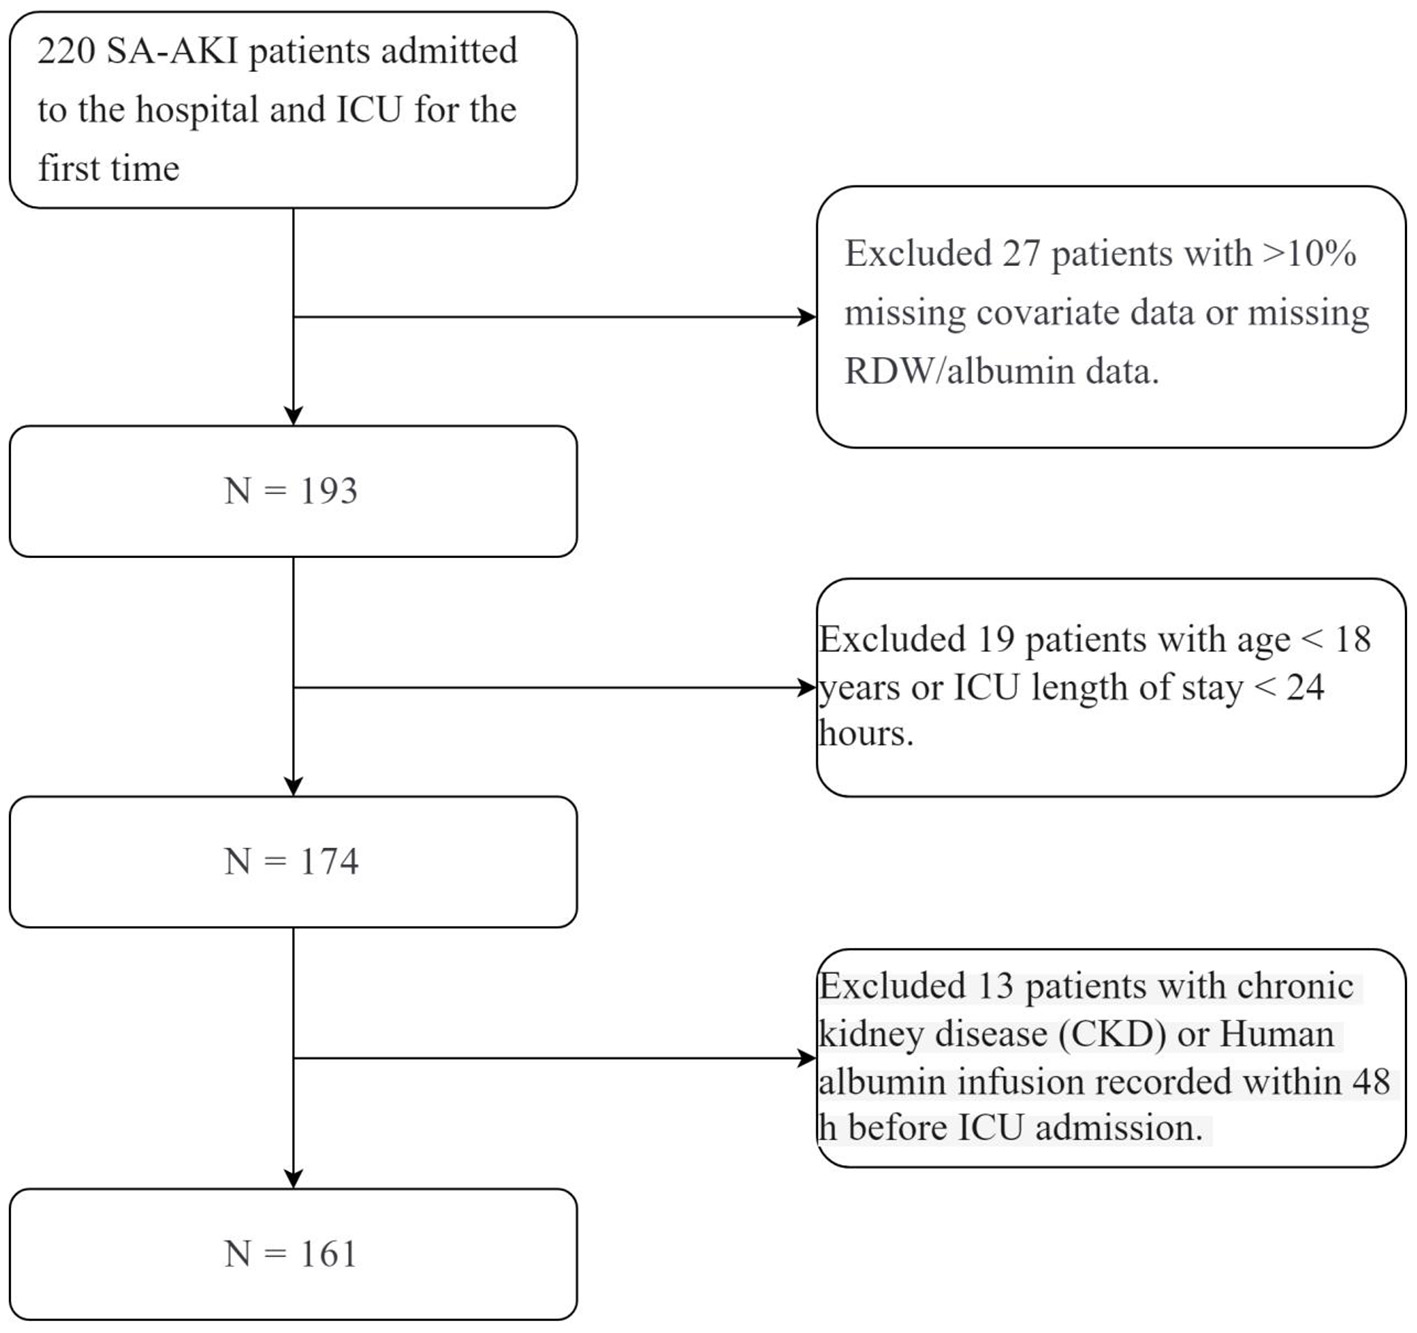
N = 161.
Baseline characteristics are summarized in Table 1: mean age was 63.7 years; 96 males (59.6%) and 65 females (40.4%); mean RAR was 6.95 ± 2.8 %/g/dl. The primary comorbidities were hypertension (39.8%), diabetes (30.4%), and cerebrovascular accident (24.8%). Stratification by RAR quartiles (Q1: < 5.07; Q2: 5.07–6.20; Q3: 6.20–8.31; Q4: >8.31) revealed that higher RAR groups exhibited: increased SOFA, APACHE II, lactate, LAR, and BNP; decreased hemoglobin, hematocrit, MAP, and albumin; and a higher incidence of mechanical ventilation use (all p < 0.05). Furthermore, there was an increased incidence of septic shock, vasopressor requirement, and CRRT utilization. The primary outcome, 28-day mortality, was 34.2% overall and increased progressively across RAR quartiles: 10% (RAR < 5.07), 32.5% (RAR 5.07–6.20), 42.5% (RAR 6.20–8.31), and 51.2% (RAR > 8.31). The inter-group comparison yielded a p-value < 0.001, indicating that higher RAR is associated with increased 28-day mortality in SA-AKI patients.
Table 1
| Variables | RAR | p | ||||
|---|---|---|---|---|---|---|
| Total | Tertile 1 | Tertile 2 | Tertile 3 | Tertile 4 | ||
| <5.07 | 5.07–6.20 | 6.20–8.31 | >8.31 | |||
| ( n = 161) | ( n = 40) | ( n = 40) | ( n = 40) | ( n = 41) | ||
| Age, mean ±SD | 63.7 ± 16.6 | 66.8 ± 15.4 | 65.5 ± 15.1 | 64.7 ± 16.6 | 58.0 ± 18.0 | 0.071 |
| Gender, n(%) | 0.885 | |||||
| Male | 96 (59.6) | 22 (55) | 25 (62.5) | 25 (62.5) | 24 (58.5) | |
| Female | 65 (40.4) | 18 (45) | 15 (37.5) | 15 (37.5) | 17 (41.5) | |
| CAD, n(%) | 0.105 | |||||
| No | 141 (87.6) | 33 (82.5) | 34 (85) | 34 (85) | 40 (97.6) | |
| Yes | 20 (12.4) | 7 (17.5) | 6 (15) | 6 (15) | 1 (2.4) | |
| CA, n(%) | 0.688 | |||||
| No | 152 (94.4) | 37 (92.5) | 37 (92.5) | 38 (95) | 40 (97.6) | |
| Yes | 9 ( 5.6) | 3 (7.5) | 3 (7.5) | 2 (5) | 1 (2.4) | |
| CVA, n(%) | 0.238 | |||||
| No | 121 (75.2) | 28 (70) | 27 (67.5) | 31 (77.5) | 35 (85.4) | |
| Yes | 40 (24.8) | 12 (30) | 13 (32.5) | 9 (22.5) | 6 (14.6) | |
| DM, n(%) | 0.148 | |||||
| No | 112 (69.6) | 27 (67.5) | 27 (67.5) | 24 (60) | 34 (82.9) | |
| Yes | 49 (30.4) | 13 (32.5) | 13 (32.5) | 16 (40) | 7 (17.1) | |
| HBP, n(%) | 0.215 | |||||
| No | 97 (60.2) | 22 (55) | 26 (65) | 20 (50) | 29 (70.7) | |
| Yes | 64 (39.8) | 18 (45) | 14 (35) | 20 (50) | 12 (29.3) | |
| Vasoactive agents, n(%) | < 0.001 | |||||
| No | 43 (26.7) | 21 (52.5) | 8 (20) | 9 (22.5) | 5 (12.2) | |
| Yes | 118 (73.3) | 19 (47.5) | 32 (80) | 31 (77.5) | 36 (87.8) | |
| MV, n(%) | 0.001 | |||||
| No | 40 (24.8) | 18 (45) | 12 (30) | 5 (12.5) | 5 (12.2) | |
| Yes | 121 (75.2) | 22 (55) | 28 (70) | 35 (87.5) | 36 (87.8) | |
| CRRT, n(%) | < 0.001 | |||||
| No | 99 (61.5) | 33 (82.5) | 27 (67.5) | 23 (57.5) | 16 (39) | |
| Yes | 62 (38.5) | 7 (17.5) | 13 (32.5) | 17 (42.5) | 25 (61) | |
| HR, mean ±SD | 117.8 ± 24.9 | 113.2 ± 24.9 | 116.9 ± 23.0 | 114.2 ± 21.7 | 126.6 ± 28.0 | 0.058 |
| T, mean ±SD | 38.0 ± 1.3 | 37.8 ± 1.3 | 38.2 ± 1.4 | 37.9 ± 1.2 | 38.1 ± 1.2 | 0.451 |
| RR, mean ±SD | 26.6 ± 9.1 | 24.1 ± 8.6 | 25.4 ± 8.7 | 27.9 ± 9.0 | 29.0 ± 9.8 | 0.067 |
| MAP, mean ±SD | 70.8 ± 18.5 | 80.4 ± 16.6 | 72.8 ± 17.3 | 70.2 ± 17.9 | 59.9 ± 16.6 | < 0.001 |
| APACHE II, mean ±SD | 23.8 ± 8.3 | 20.1 ± 5.6 | 23.4 ± 7.8 | 24.4 ± 8.4 | 27.2 ± 9.6 | 0.001 |
| SOFA, mean ±SD | 9.5 ± 4.4 | 6.8 ± 3.0 | 9.8 ± 4.1 | 9.8 ± 4.3 | 11.8 ± 4.8 | < 0.001 |
| WBC, mean ±SD | 17.3 ± 10.6 | 16.7 ± 7.8 | 20.2 ± 11.6 | 14.8 ± 9.1 | 17.3 ± 12.7 | 0.146 |
| PLT, median (IQR) | 139.0 (54.9, 229.0) | 180.9 (131.3, 238.6) | 127.3 (50.8, 207.5) | 142.0 (60.0, 232.2) | 68.0 (23.0, 159.0) | 0.004 |
| HGB, mean ±SD | 96.8 ± 26.7 | 111.9 ± 22.8 | 101.2 ± 26.8 | 91.5 ± 23.1 | 83.0 ± 25.5 | < 0.001 |
| HCT, mean ±SD | 34.1 ± 9.3 | 37.4 ± 8.4 | 35.2 ± 8.7 | 32.4 ± 8.3 | 31.3 ± 10.6 | 0.013 |
| TBil, median (IQR) | 17.8 (9.2, 37.1) | 10.1 (7.2, 19.1) | 22.4 (10.6, 51.5) | 16.9 (9.0, 35.7) | 28.5 (12.9, 51.1) | 0.002 |
| IBil, median (IQR) | 5.1 (2.9, 9.7) | 4.4 (2.9, 8.1) | 5.2 (3.4, 9.8) | 5.0 (2.9, 9.2) | 6.2 (2.9, 12.6) | 0.441 |
| ALT, median (IQR) | 31.0 (15.0, 106.0) | 19.0 (15.0, 31.0) | 91.0 (24.8, 205.8) | 26.5 (14.8, 77.2) | 56.0 (15.0, 130.0) | 0.001 |
| AST, median (IQR) | 54.0 (26.0, 191.0) | 28.5 (21.0, 49.0) | 90.5 (41.0, 402.0) | 53.0 (29.0, 93.2) | 116.0 (37.0, 347.0) | < 0.001 |
| ALB, mean ±SD | 27.3 ± 6.6 | 34.3 ± 5.3 | 28.4 ± 5.0 | 24.2 ± 3.5 | 22.4 ± 5.2 | < 0.001 |
| Lac, median (IQR) | 3.4 (2.0, 7.1) | 2.6 (1.8, 5.0) | 3.3 (1.7, 5.7) | 3.1 (1.9, 5.7) | 6.1 (3.1, 11.4) | < 0.001 |
| , mean ±SD | 18.3 ± 6.2 | 19.4 ± 6.8 | 20.0 ± 5.7 | 16.8 ± 6.2 | 16.9 ± 5.5 | 0.031 |
| BUN, mean ±SD | 15.2 ± 9.7 | 14.0 ± 12.2 | 15.3 ± 8.8 | 16.9 ± 9.6 | 14.6 ± 7.6 | 0.574 |
| BNP, median (IQR) | 3325.0 (1325.0, 10410.0) | 2125.0 (420.4, 5412.5) | 4499.0 (2010.8, 10449.8) | 2247.0 (1159.8, 7401.8) | 4458.0 (2320.0, 18838.0) | 0.01 |
| K, mean ±SD | 4.3 ± 1.5 | 4.1 ± 1.0 | 4.0 ± 1.1 | 4.4 ± 1.3 | 4.8 ± 2.1 | 0.064 |
| Na, mean ±SD | 141.2 ±12.7 | 141.6 ± 13.0 | 140.3 ± 12.3 | 141.2 ± 14.4 | 141.5 ±11.4 | 0.97 |
| PaO2/FiO2, mean ±SD | 212.3 ± 103.3 | 238.5 ± 111.1 | 212.9 ± 83.1 | 190.7 ± 82.2 | 207.2 ± 127.0 | 0.219 |
| CRP, median (IQR) | 144.5 (79.6, 200.0) | 109.0 (75.0, 203.2) | 157.8 (97.3, 204.2) | 147.8 (83.5, 200.0) | 143.9 (88.6,200.0) | 0.596 |
| PCT, median (IQR) | 11.0 (2.2, 87.2) | 4.5 (1.6, 17.4) | 24.8 (3.7, 81.5) | 20.1 (2.7, 100.0) | 12.9 (4.3, 90.8) | 0.104 |
| PT, median (IQR) | 15.6 (13.4, 19.1) | 13.9 (12.5, 17.0) | 15.6 (13.9, 19.5) | 15.2 (13.1, 17.8) | 18.0 (14.6, 23.9) | 0.002 |
| APTT, median (IQR) | 35.6 (30.8, 48.2) | 32.0 (28.0, 35.8) | 34.8 (31.2, 41.8) | 36.7 (32.0, 45.2) | 42.8 (36.0, 73.9) | < 0.001 |
| D dimer, median (IQR) | 2752.0 (1098.0, 5162.0) | 2713.5 (1119.8, 3626.2) | 3576.5 (1284.5, 7760.0) | 2543.5 (806.0, 3957.0) | 2742.0 (1234.0, 5637.0) | 0.13 |
| LAR, median (IQR) | 1.4 (0.8,2.2) | 0.8 (0.5, 1.4) | 1.2 (0.7, 2.0) | 1.4 (0.8, 2.3) | 2.7 (1.4,5.3) | < 0.001 |
| Mortality 28 day, n(%) | < 0.001 | |||||
| No | 106 (65.8) | 36 (90) | 27 (67.5) | 23 (57.5) | 20 (48.8) | |
| Yes | 55 (34.2) | 4 (10) | 13 (32.5) | 17 (42.5) | 21 (51.2) | |
Baseline clinical and laboratory characteristics of the study patients.
CAD, coronary artery disease; CA, cancer; CVA, cerebrovascular accident (stroke); DM, diabetes mellitus; HBP, high blood pressure; MV, mechanical ventilation; LAR, lactate-to- albumin ratio; T, body temperature; RR, respiratory rate; HR, heart rate; MAP, mean arterial pressure; SOFA, sequential organ failure assessment; APACHE II, acute physiology and chronic health evaluation II; WBC, white blood cell count; HCT, hematocrit; HGB, hemoglobin; PLT, platelet count; PCT, procalcitonin; RDW, red blood cell distribution width; RAR, RDW-to-albumin ratio; PT, prothrombin time; APTT, activated partial thromboplastin time; CRRT, continuous renal replacement therapy; IBil, indirect bilirubin.
3.2 Association between RAR and 28-day mortality
3.2.1 Nonlinear analysis
RCS analysis showed a linear relationship between RAR and mortality after covariate adjustment (non-linearity p = 0.162; Figure 2).
Figure 2
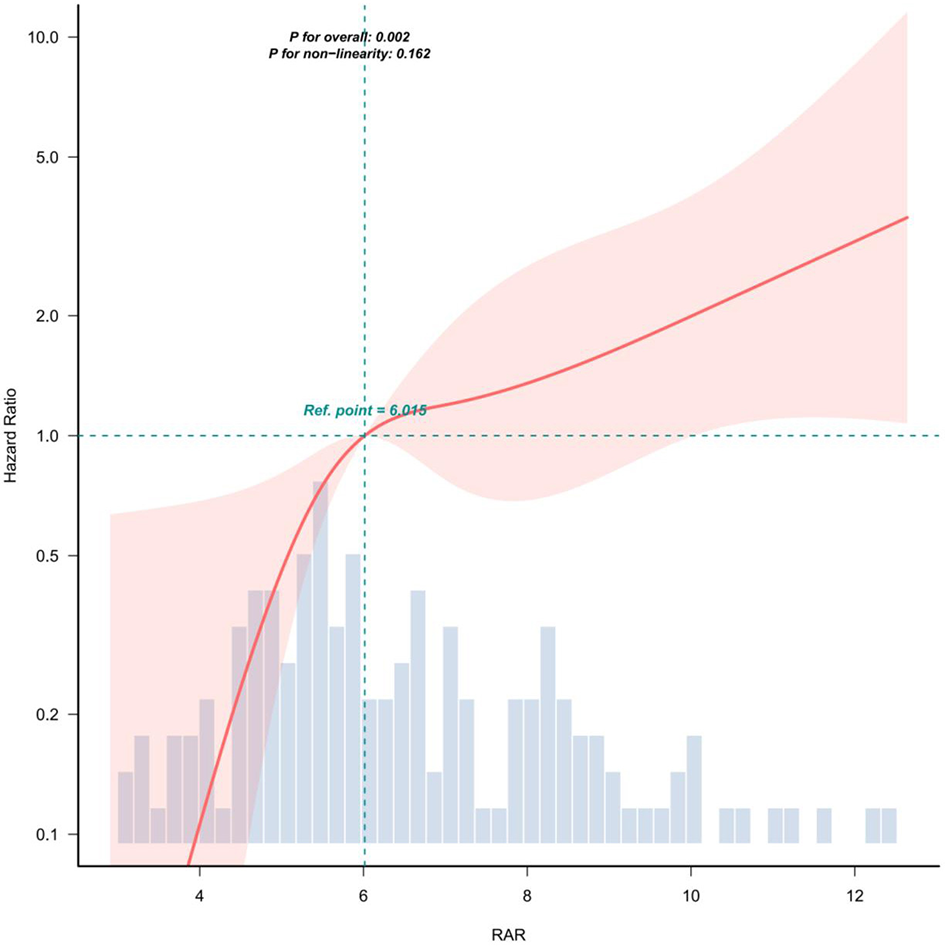
Covariate adjustments were consistent with model 3 in Table 3. The solid red line represents the estimated association, while the shaded red band indicates the corresponding 95% confidence interval (CI).
3.2.2 Survival analysis
Kaplan–Meier curves revealed significantly higher 28-day survival rates in low-RAR groups (log-rank p < 0.001; Figure 3).
Figure 3
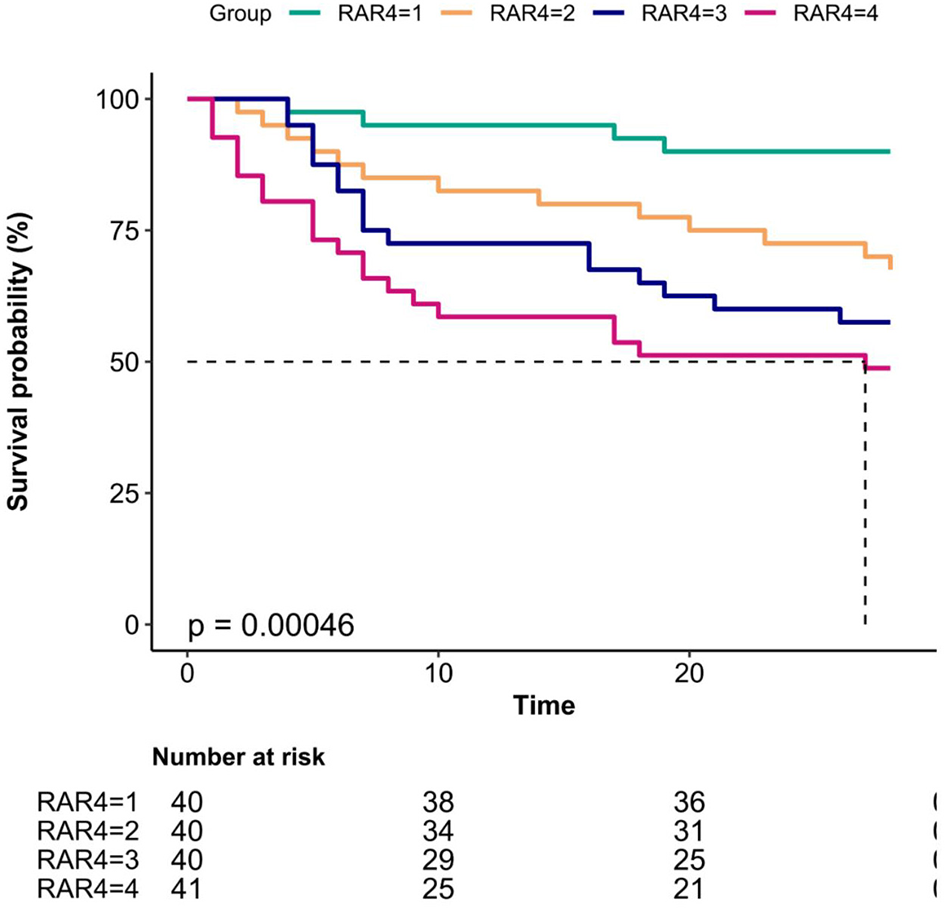
Kaplan–Meier curves for 28-day mortality in patients with sepsis-associated acute kidney injury (SA-AKI).
3.2.3 Multivariable cox regression
After univariate screening (Table 2), progressively adjusted models demonstrated the following results: in the crude model, the HR for Q4 vs. Q1 was 7.28 (2.5–21.22; p < 0.05); in the fully adjusted model (Model 3), the HR for Q4 vs. Q1 was 7.52 (2.24–25.29; p < 0.05), adjusted for CA, HR, Na, PLT, PT, APTT, BUN, and RR (Table 3).
Table 2
| Item | HR (95%CI) | p (Wald's test) |
|---|---|---|
| RAR (cont. var.) | 1.11 (1.03, 1.19) | 0.004 |
| RAR: ref. = Q1 | ||
| Q2 | 3.63 (1.18, 11.12) | 0.024 |
| Q3 | 5.14 (1.73, 15.29) | 0.003 |
| Q4 | 7.28 (2.5, 21.22) | < 0.001 |
| Age (cont. var.) | 1.01 (1, 1.03) | 0.101 |
| Female vs. male | 1.0002 (0.5831, 1.7154) | 1 |
| CAD: yes vs. no | 1.54 (0.76, 3.15) | 0.234 |
| CA: yes vs. no | 2.63 (1.12, 6.15) | 0.026 |
| CVA: yes vs. no | 1.29 (0.72, 2.3) | 0.397 |
| DM: yes vs. no | 1.01 (0.57, 1.79) | 0.971 |
| HBP: yes vs. no | 1.14 (0.67, 1.95) | 0.623 |
| Vasoactive agents: yes vs. no | 346499955 (0, Inf) | 0.996 |
| MV: yes vs. no | 326653859.8 (0, Inf) | 0.996 |
| HR (cont. var.) | 1.01 (1, 1.03) | 0.016 |
| TFR modify (cont. var.) | 1.06 (0.86, 1.3) | 0.575 |
| RR (cont. var.) | 1.04 (1.02, 1.07) | 0.002 |
| WBC (cont. var.) | 0.9908 (0.9653, 1.017) | 0.488 |
| HGB (cont. var.) | 0.9911 (0.9812, 1.0011) | 0.08 |
| TBil (cont. var.) | 1.0035 (0.9984, 1.0086) | 0.18 |
| ALT (cont. var.) | 1.0002 (0.9998, 1.0005) | 0.388 |
| AST (cont. var.) | 1 (0.9999, 1.0002) | 0.962 |
| Na (cont. var.) | 1.02 (1, 1.04) | 0.032 |
| PT (cont. var.) | 1.01 (1, 1.02) | 0.003 |
| APTT (cont. var.) | 1.0093 (1.0049, 1.0137) | < 0.001 |
| HCT (cont. var.) | 0.99 (0.96, 1.01) | 0.328 |
| PLT (cont. var.) | 0.9959 (0.993, 0.9987) | 0.005 |
| BUN (cont. var.) | 1.02 (1, 1.05) | 0.033 |
| (cont. var.) | 0.96 (0.92, 1.01) | 0.1 |
| CRP (cont. var.) | 1.0002 (0.9979, 1.0024) | 0.893 |
| PCT (cont. var.) | 1.0024 (0.9961, 1.0087) | 0.457 |
| D dimer (cont. var.) | 1 (1, 1) | 0.058 |
Univariate cox regression hazard ratio of 28-day mortality associated with RAR in SA-AKI patients.
CAD, coronary artery disease; CA, cancer; CVA, cerebrovascular accident (stroke); DM, diabetes mellitus; HBP, high blood pressure; MV, mechanical ventilation; HCT, hematocrit; PLT, platelet count; RAR, RDW-to-albumin ratio; T, body temperature; RR, respiratory rate; HR, heart rate; PCT, procalcitonin; PT, prothrombin time; APTT, activated partial thromboplastin time.
Table 3
| Variable | HR (95%CI) | ||||||||
|---|---|---|---|---|---|---|---|---|---|
| No. | crude | p -value | Model 1 | p -value | Model 2 | p -value | Model 3 | p -value | |
| RAR | 161 | 1.11 (1.03–1.19) | 0.004 | 1.1 (1.02–1.18) | 0.012 | 1.11 (1.02–1.21) | 0.016 | 1.1 (1–1.2) | 0.04 |
| Quartiles | |||||||||
| Q1 ( ≤ 5.07) | 40 | 1 (Ref) | 1 (Ref) | 1 (Ref) | 1 (Ref) | ||||
| Q2 (5.07–6.20) | 40 | 3.63 (1.18–11.12) | 0.024 | 4.1 (1.32–12.74) | 0.015 | 3.68 (1.17–11.55) | 0.026 | 4.6 (1.36–15.58) | 0.014 |
| Q3 (6.20–8.31) | 40 | 5.14 (1.73–15.29) | 0.003 | 5 (1.67–14.91) | 0.004 | 4.4 (1.47–13.19) | 0.008 | 5.38 (1.62–17.95) | 0.006 |
| Q4 (≥8.31) | 41 | 7.28 (2.5–21.22) | < 0.001 | 6.79 (2.28–20.16) | 0.001 | 6.01 (1.99–18.14) | 0.001 | 7.52 (2.24–25.29) | 0.001 |
| Trend test | 161 | < 0.001 | < 0.001 | 0.001 | 0.001 | ||||
Hazard ratio of 28-day mortality in SA-AKI patients associated with RAR among septic patients.
CA, cancer; HR, heart rate; RR, respiratory rate; PT, prothrombin time; APTT, activated partial thromboplastin time; PLT, platelet count; BUN, blood urea nitrogen.
Model 1: Adjusted for CA, HR, RR.
Model 2: Further adjusted for Na, PLT, BUN.
Model 3: Further adjusted for PT, APTT.
3.3 ROC curve analysis
RAR alone: AUC = 0.694 (95% CI: 0.612–0.776); RAR + LAR: AUC = 0.777 (95% CI: 0.703–0.851). The combined model significantly outperformed RAR alone (ΔAUC = 0.083, p = 0.043; Supplementary Figure S1).
3.4 Subgroup and sensitivity analyses
3.4.1 Subgroup analysis
No significant interaction effects were observed across subgroups (age, gender, coronary artery disease, stroke, diabetes, hypertension, bloodstream infection, MAP; all p for interaction >0.05; Figure 4).
Figure 4
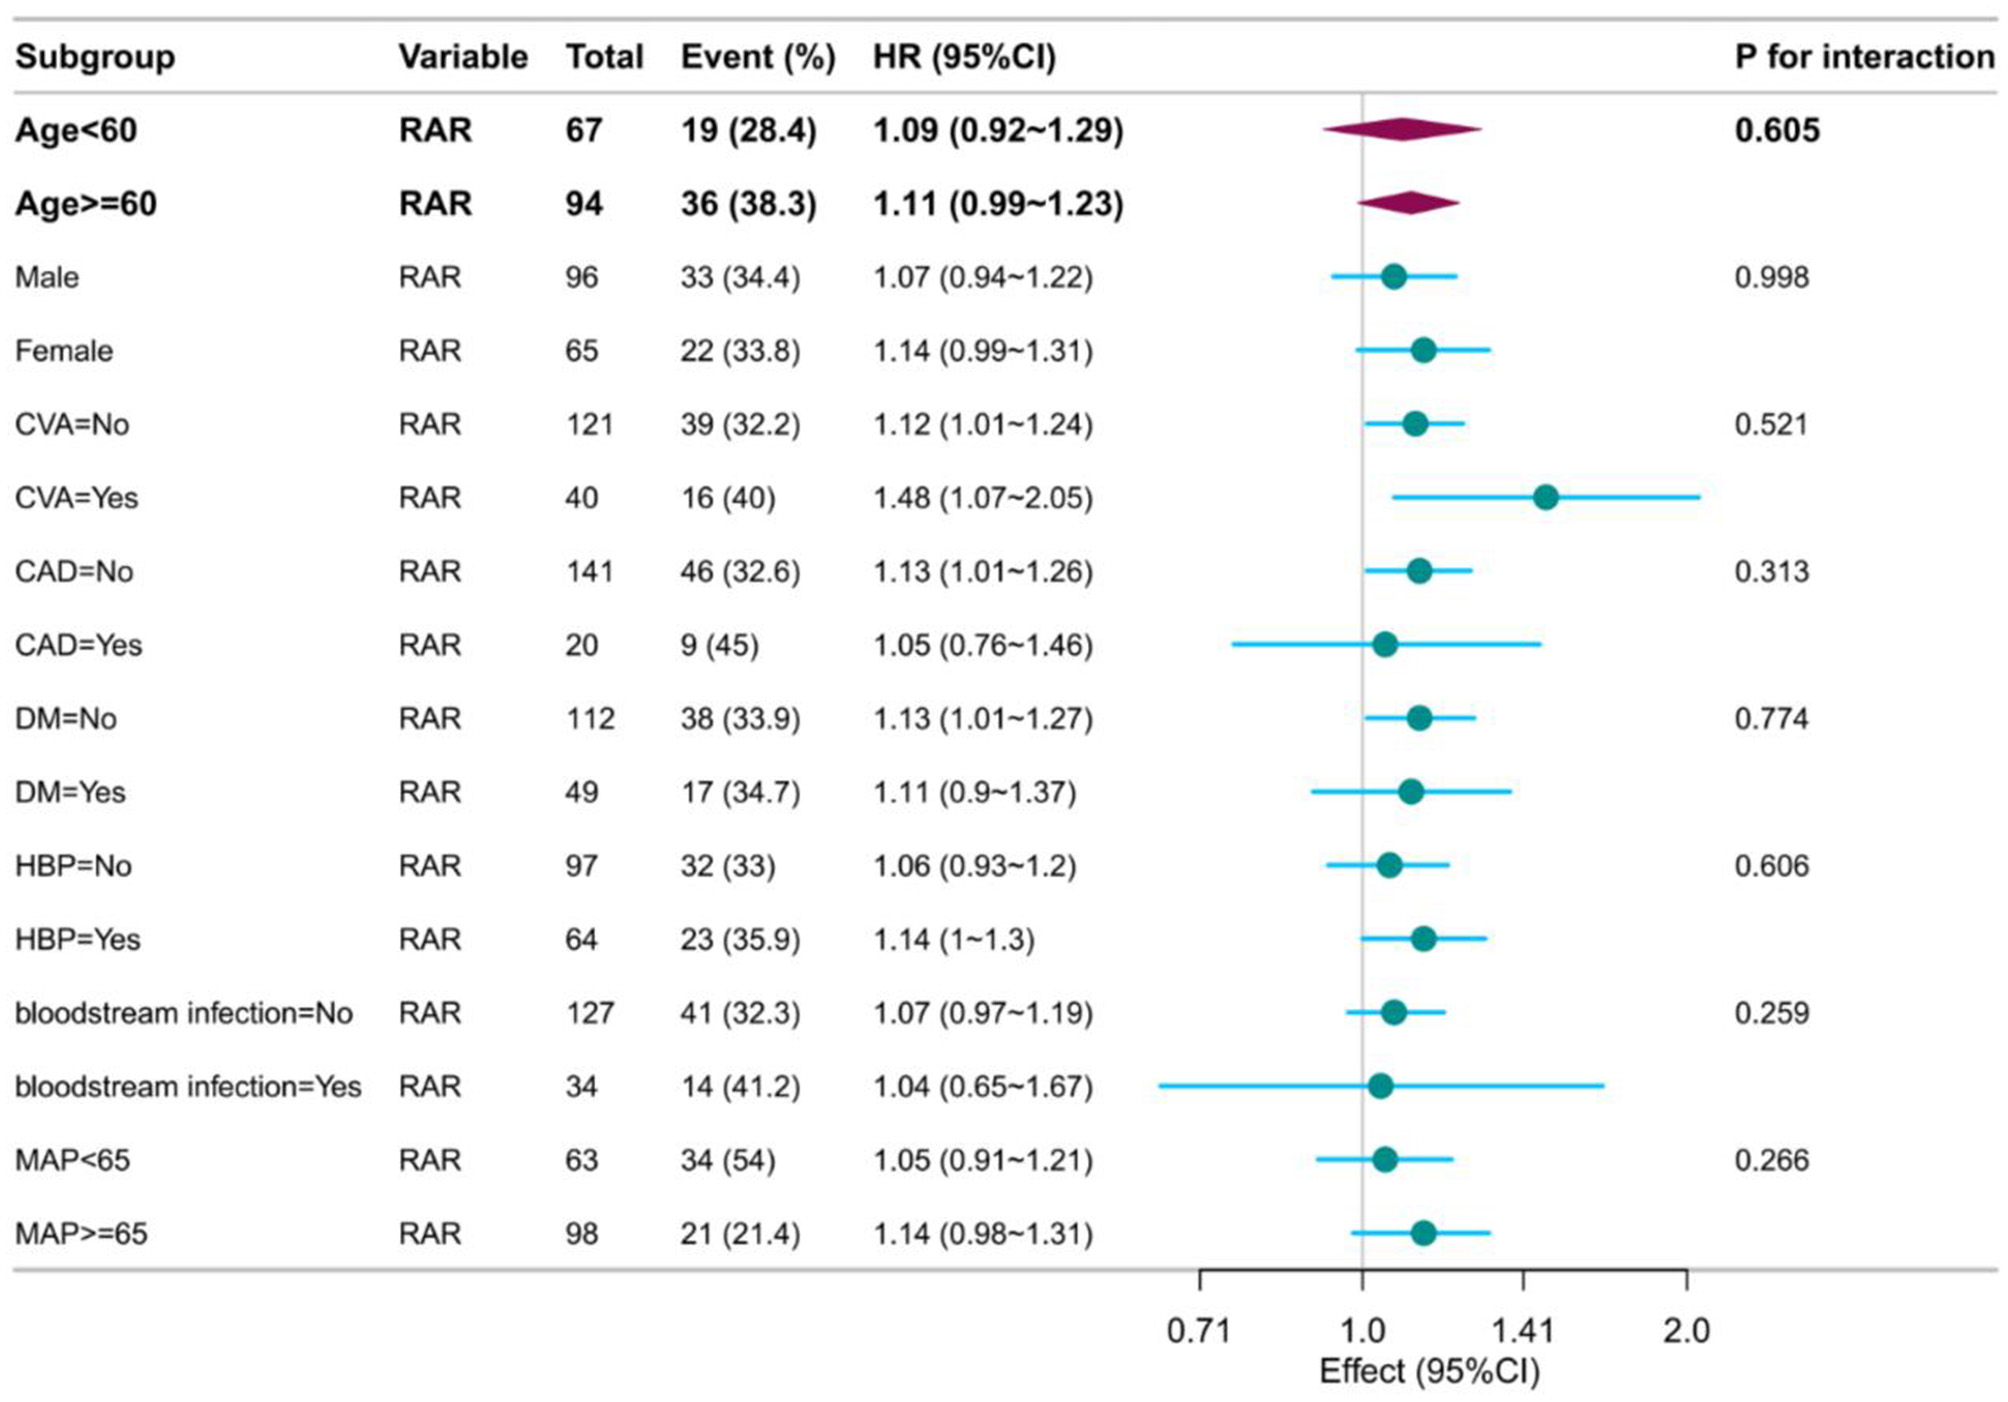
Forest plot of subgroup analysis.
3.4.2 Sensitivity analyses
Excluding bloodstream infection patients: The association remained robust (Supplementary Table S1). Excluding non-CRRT patients: Results were consistent with the primary findings (Supplementary Table S2).
4 Discussion
This study is the first to evaluate the prognostic value of the RAR in SA-AKI. A retrospective analysis of 161 SA-AKI patients revealed three key findings: (1) Elevated RAR was independently associated with increased 28-day all-cause mortality (adjusted HR = 7.52, 95% CI: 2.24–25.29 for Q4 [RAR > 8.31] vs. Q1); (2) RAR correlated positively with disease severity, with higher RAR groups showing significantly increased SOFA scores (11.8 vs. 6.8), APACHE II scores (27.2 vs. 20.1), mechanical ventilation rates (87.8% vs. 55%), and CRRT utilization (61% vs. 17.5%; all p < 0.05); (3) Combining RAR with the lactate-to-albumin ratio (LAR) significantly improved predictive accuracy (AUC = 0.777 vs. 0.694 for RAR alone; ΔAUC = 0.083, p = 0.043.
4.1 Novelty and pathophysiological insights
This study positions RAR as a novel independent prognostic marker for SA-AKI, addressing a critical knowledge gap in sepsis-induced renal injury—an area previously focused on conditions such as diabetic ketoacidosis (13), cancer (15), aortic aneurysm (19), and ARDS (20). Its innovation lies in integrating two key pathophysiological mechanisms of sepsis: (1) Elevated RDW reflects erythropoietic dysfunction: During sepsis, systemic infection and inflammation frequently impair hematopoiesis by suppressing erythropoietin production and disrupting red-cell maturation, which increases the proportion of immature erythrocytes in circulation (21). Inflammatory mediators reduce iron availability and accelerate erythrocyte apoptosis, contributing to sepsis-associated anemia (22, 23). Cytokines also alter erythrocyte membrane glycoproteins and ion channels, inducing morphological changes and compromising membrane stability (24, 25). This results in the release of immature, heterogeneous-sized red cells, explaining RDW's prognostic value in sepsis (8). (2) Hypoalbuminemia signals microcirculatory failure: Physiologically, serum albumin acts as an extracellular antioxidant, buffer, immune modulator, detoxifier, and transport protein. Its decline reflects the intensity of inflammation, oxidative stress, and capillary leak. Albumin modulates organ perfusion by inhibiting platelet activation (26, 27) and preserving endothelial integrity (28); lower levels correlate with worse AKI outcomes (29). (3) The integration of RAR (RDW/Alb) amplifies the pathological signal: RAR concurrently captures impaired erythropoiesis and hypoalbuminemia. The ratio of RDW (reflecting oxidative stress and marrow suppression) to albumin encapsulates the interplay between inflammation, microcirculatory compromise, and malnutrition (30, 31). When hematopoietic suppression (↑RDW) coexists with capillary leakage (↓Alb), RAR rises exponentially, becoming a sensitive indicator of combined “inflammatory-microcirculatory” derangement.
4.2 Clinical implications and comparative value
Complementarity to conventional scores: While SOFA and APACHE II effectively predict SA-AKI outcomes (5, 6), their multi-parameter nature limits clinical utility. This study demonstrates that RAR is a readily obtainable, independent prognosticator. Patients in the Q4 group (RAR > 8.31) required significantly more vasopressors (87.8% vs. 47.5%) and CRRT (61% vs. 17.5%), highlighting RAR's potential as an early-warning marker for treatment escalation.
Synergistic predictive model: The biological basis of the LAR can be explained from two perspectives. Lactate, the end product of anaerobic metabolism, directly reflects tissue hypoperfusion and cellular hypoxia (32, 33), with the systemic inflammatory response syndrome (SIRS) and microcirculatory failure induced by sepsis driving lactate elevation. Serum albumin serves as an extracellular antioxidant, buffer, immune modulator, detoxifier, and transport protein, and its decline parallels the intensity of inflammation, oxidative stress, and capillary leakage (34, 35). Therefore, LAR integrates the dual pathological signals of tissue hypoxia/under-perfusion (lactate) and antioxidant/immune-endothelial integrity loss (albumin), encapsulating the “ischaemia–reperfusion injury–SIRS” axis.
RAR + LAR achieves multi-dimensional coverage: RAR reflects erythrocyte damage (RDW) and inflammation (Alb), while LAR captures tissue hypoxia (Lac) and oxidative stress (Alb) (36). Together, they comprehensively encompass the central mechanisms driving SA-AKI progression, including systemic inflammation, microcirculatory collapse, and multiple organ dysfunction. The combined AUC of 0.777 (95% CI: 0.703–0.851) significantly outperformed RAR alone (p = 0.043).
Previous studies reported AUCs for SA-AKI mortality: 0.624 for neutrophil-lymphocyte ratio (NLR), 0.582 for platelet-lymphocyte ratio, 0.599 for monocyte-lymphocyte ratio, 0.590 for systemic immune-inflammation index, and 0.593 for systemic inflammatory response index (37). Serum cystatin C yielded an AUC of 0.690 (38). Both RAR and the RAR-LAR combination outperform these traditional indices, laying the groundwork for a simple yet robust prognostic tool in SA-AKI.
4.3 Generalizability and future directions
Prespecified subgroup analyses (age, gender, diabetes, coronary artery disease, bloodstream infection, etc.) confirmed consistent prognostic associations (all interaction p > 0.05). Notably, predictive power remained in high-risk subgroups, including diabetes (n = 49, HR = 1.11) and hypertension (n = 64, HR = 1.14), highlighting the robustness of RAR against potential confounding.
Future research directions: (1) Dynamic trajectory analysis: Investigating whether changes in RAR during treatment outperform baseline values; (2) Mechanistic validation: Animal models to explore RAR's causal links to renal medullary hypoxia and ferroptosis.
4.4 Limitations and mitigation strategies
(1) Single-center retrospective design: Despite rigorous multivariable adjustment, the findings require multicenter prospective validation, ideally across diverse ICU populations; (2) Sample size constraints (n = 161): Limited power for rare subgroups (e.g., malignancy cohort, n = 9); (3) Lack of serial measurements: An expanded cohort (target N = 500) is underway to track RAR dynamics over time.
5 Conclusion
Elevated RAR independently predicts adverse early prognosis in SA-AKI, with higher levels correlating with increased 28-day mortality. The combination of RAR and LAR significantly improves mortality prediction in this cohort.
Statements
Data availability statement
The raw data supporting the conclusions of this article will be made available by the authors, without undue reservation.
Ethics statement
The studies involving humans were approved by Baise People's Hospital Clinical Trial Ethics Committee. The studies were conducted in accordance with the local legislation and institutional requirements. The participants provided their written informed consent to participate in this study. Written informed consent was obtained from the individual(s) for the publication of any potentially identifiable images or data included in this article.
Author contributions
KW: Data curation, Methodology, Supervision, Writing – original draft, Software, Conceptualization, Investigation, Resources, Formal analysis, Validation, Writing – review & editing, Funding acquisition, Project administration, Visualization. HH: Validation, Writing – review & editing, Formal analysis, Resources, Methodology, Data curation, Project administration, Visualization, Writing – original draft, Supervision. ZS: Writing – original draft, Formal analysis, Resources, Data curation, Visualization, Supervision, Validation, Methodology, Writing – review & editing. HZ: Validation, Project administration, Supervision, Writing – review & editing, Investigation, Data curation, Resources, Writing – original draft. JC: Supervision, Data curation, Methodology, Validation, Resources, Writing – original draft, Writing – review & editing, Investigation. HL: Software, Data curation, Conceptualization, Visualization, Writing – original draft, Methodology, Project administration, Resources, Validation, Writing – review & editing, Supervision, Formal analysis.
Funding
The author(s) declared that financial support was received for this work and/or its publication. This work was supported by the Baise Science and Technology Program (Grant No. Baike 20243447). The funder had no role in study design, data collection/analysis, interpretation of results, or manuscript preparation.
Acknowledgments
We extend our sincere gratitude to all study participants and the clinical scientist team for their invaluable contributions to this project.
Conflict of interest
The author(s) declared that this work was conducted in the absence of any commercial or financial relationships that could be construed as a potential conflict of interest.
Generative AI statement
The author(s) declared that generative AI was used in the creation of this manuscript. During the preparation of this work, the author(s) used [DeepL Seek] to improve the language and readability of the manuscript. After using this tool, the author(s) reviewed and edited the content as needed and take full responsibility for the content of the published article.
Any alternative text (alt text) provided alongside figures in this article has been generated by Frontiers with the support of artificial intelligence and reasonable efforts have been made to ensure accuracy, including review by the authors wherever possible. If you identify any issues, please contact us.
Publisher’s note
All claims expressed in this article are solely those of the authors and do not necessarily represent those of their affiliated organizations, or those of the publisher, the editors and the reviewers. Any product that may be evaluated in this article, or claim that may be made by its manufacturer, is not guaranteed or endorsed by the publisher.
Supplementary material
The Supplementary Material for this article can be found online at: https://www.frontiersin.org/articles/10.3389/fmed.2026.1724095/full#supplementary-material
References
1.
Zarbock A Nadim MK Pickkers P Gomez H Bell S Joannidis M et al . Sepsis-associated acute kidney injury: consensus report of the 28th Acute Disease Quality Initiative workgroup. Nat Rev Nephrol. (2023) 19:401–17. doi: 10.1038/s41581-023-00683-3
2.
Takeuchi T Flannery AH Liu LJ Ghazi L Cama-Olivares A Fushimi K et al . Epidemiology of sepsis-associated acute kidney injury in the ICU with contemporary consensus definitions. Crit Care. (2025) 29:128. doi: 10.1186/s13054-025-05351-5
3.
Peters E Antonelli M Wittebole X Nanchal R François B Sakr Y et al . A worldwide multicentre evaluation of the influence of deterioration or improvement of acute kidney injury on clinical outcome in critically ill patients with and without sepsis at ICU admission: results from The Intensive Care Over Nations audit. Crit Care. (2018) 22:188. doi: 10.1186/s13054-018-2112-z
4.
Liu R Fan Y Jia B Li P . The aggregate index of systemic inflammation is positively correlated with the risk of all-cause mortality in sepsis-associated acute kidney injury. Sci Rep. (2025) 15:29962. doi: 10.1038/s41598-025-16081-7
5.
Zhou W Zhang N Zhao T Ma Q Ma X . Predictive value of inflammatory indicator and serum cystatin C for the prognosis of patients with sepsis-associated acute kidney injury. Zhonghua Wei Zhong Bing Ji Jiu Yi Xue. (2025) 37:275–9. doi: 10.3760/cma.j.cn121430-20240908-00759
6.
Gao T Nong Z Luo Y Mo M Chen Z Yang Z et al . Machine learning-based prediction of in-hospital mortality for critically ill patients with sepsis-associated acute kidney injury. Ren Fail. (2024) 46:2316267. doi: 10.1080/0886022X.2024.2316267
7.
Salvagno GL Sanchis-Gomar F Picanza A Lippi G . Red blood cell distribution width: a simple parameter with multiple clinical applications. Crit Rev Clin Lab Sci. (2015) 52:86–105. doi: 10.3109/10408363.2014.992064
8.
Zhang L Yu CH Guo KP Huang CZ Mo LY . Prognostic role of red blood cell distribution width in patients with sepsis: a systematic review and meta-analysis. BMC Immunol. (2020) 21:40. doi: 10.1186/s12865-020-00369-6
9.
Wang RR He M Ou XF Xie XQ Kang Y . The predictive value of RDW in AKI and mortality in patients with traumatic brain injury. J Clin Lab Anal. (2020) 34:e23373. doi: 10.1002/jcla.23373
10.
Wang X Wang J Wu S Ni Q Chen P . Association between the neutrophil percentage-to-albumin ratio and outcomes in cardiac intensive care unit patients. Int J Gen Med. (2021) 14:4933–43. doi: 10.2147/IJGM.S328882
11.
Zhao N Hu W Wu Z Wu X Li W Wang Y et al . The red blood cell distribution width-albumin ratio: a promising predictor of mortality in stroke patients. Int J Gen Med. (2021) 14:3737–47. doi: 10.2147/IJGM.S322441
12.
Yin M Si L Qin W Li C Zhang J Yang H et al . Predictive value of serum albumin level for the prognosis of severe sepsis without exogenous human albumin administration: a prospective cohort study. J Intens Care Med. (2018) 33:687–94. doi: 10.1177/0885066616685300
13.
Zhou D Wang J Li X . The red blood cell distribution width-albumin ratio was a potential prognostic biomarker for diabetic ketoacidosis. Int J Gen Med. (2021) 14:5375–80. doi: 10.2147/IJGM.S327733
14.
Zhao F Liu M Kong L . Association between red blood cell distribution width-to-albumin ratio and diabetic retinopathy. J Clin Lab Anal. (2022) 36:e24351. doi: 10.1002/jcla.24351
15.
Lu C Long J Liu H Xie X Xu D Fang X et al . Red blood cell distribution width-to-albumin ratio is associated with all-cause mortality in cancer patients. J Clin Lab Anal. (2022) 36:e24423. doi: 10.1002/jcla.24423
16.
Xu W Huo J Chen G Yang K Huang Z Peng L et al . Association between red blood cell distribution width to albumin ratio and prognosis of patients with sepsis: a retrospective cohort study. Front Nutr. (2022) 9:1019502. doi: 10.3389/fnut.2022.1019502
17.
Singer M Deutschman CS Seymour CW Shankar-Hari M Annane D Bauer M et al . The third international consensus definitions for sepsis and septic shock (Sepsis-3). JAMA. (2016) 315:801–10. doi: 10.1001/jama.2016.0287
18.
Khwaja A . KDIGO clinical practice guidelines for acute kidney injury. Nephron Clin Pract. (2012) 120:c179–84. doi: 10.1159/000339789
19.
Weng C Yu C Yang GW Jiang JS Wu H . Association of red blood cell distribution width-albumin ratio with in-hospital mortality in abdominal aortic aneurysm patients. Medicine (Baltimore). (2024) 103:e40785. doi: 10.1097/MD.0000000000040785
20.
Yoo JW Ju S Lee SJ Cho YJ Lee JD Kim HC . Red cell distribution width/albumin ratio is associated with 60-day mortality in patients with acute respiratory distress syndrome. Infect Dis (Lond). (2020) 52:266–70. doi: 10.1080/23744235.2020.1717599
21.
Macdougall IC Cooper AC . Erythropoietin resistance: the role of inflammation and pro-inflammatory cytokines. Nephrol Dial Transplant. (2002) 17:39–43. doi: 10.1093/ndt/17.suppl_11.39
22.
Bateman RM Sharpe MD Singer M Ellis CG . The effect of sepsis on the erythrocyte. Int J Mol Sci. (2017) 18:1932. doi: 10.3390/ijms18091932
23.
Ekregbesi P Shankar-Hari M Bottomley C Riley EM Mooney JP . Relationship between anaemia, haemolysis, inflammation and haem oxygenase-1 at admission with sepsis: a pilot study. Sci Rep. (2018) 8:11198. doi: 10.1038/s41598-018-29558-5
24.
Piagnerelli M Boudjeltia KZ Brohee D Piro P Carlier E Vincent JL et al . Alterations of red blood cell shape and sialic acid membrane content in septic patients. Crit Care Med. (2003) 31:2156–62. doi: 10.1097/01.CCM.0000079608.00875.14
25.
Serroukh Y Djebara S Lelubre C Zouaoui Boudjeltia K Biston P Piagnerelli M . Alterations of the erythrocyte membrane during sepsis. Crit Care Res Pract. (2012) 2012:702956. doi: 10.1155/2012/702956
26.
Ozcan Cetin EH Könte HC Temizhan A . Blood viscosity should not be overlooked when evaluating the fibrinogen to albumin ratio. Angiology. (2019) 70:465–66. doi: 10.1177/0003319718822244
27.
Gresele P Deckmyn H Huybrechts E Vermylen J . Serum albumin enhances the impairment of platelet aggregation with thromboxane synthase inhibition by increasing the formation of prostaglandin D2. Biochem Pharmacol. (1984) 33:2083–8. doi: 10.1016/0006-2952(84)90577-X
28.
Joles JA Willekes-Koolschijn N Koomans HA . Hypoalbuminemia causes high blood viscosity by increasing red cell lysophosphatidylcholine. Kidney Int. (1997) 52:761–70. doi: 10.1038/ki.1997.393
29.
Zhang L Shi X Li L Shi R An S Zeng Z . Association between serum albumin levels after albumin infusion and 28-day mortality in critically ill patients with acute kidney injury. Nan Fang Yi Ke Da Xue Xue Bao. (2025) 45:1074–81. doi: 10.12122/j.issn.1673-4254.2025.05.21
30.
Tan Y Li Y Huang X Zhai Z Wang Q Guo Y et al . The ratio of red blood cell distribution width to albumin as a predictor for rehospitalization risk and rehospitalization all-cause mortality in middle-aged and elderly survivors with sepsis: an ambispective ICU cohort study. J Inflamm Res. (2024) 17:1227–40. doi: 10.2147/JIR.S451769
31.
Chen X Luo Y Liu S . Association between red cell distribution width to albumin ratio and all-cause mortality in patients with acute pancreatitis admitted to the intensive care unit: a retrospective study based on the MIMIC-IV database. Front Med (Lausanne). (2025) 12:1503378. doi: 10.3389/fmed.2025.1503378
32.
Haas SA Lange T Saugel B Petzoldt M Fuhrmann V Metschke M et al . Severe hyperlactatemia, lactate clearance and mortality in unselected critically ill patients. Intensive Care Med. (2016) 42:202–10. doi: 10.1007/s00134-015-4127-0
33.
Karampela I Kounatidis D Vallianou NG Panagopoulos F Tsilingiris D Dalamaga M . Kinetics of the lactate to albumin ratio in new onset sepsis: prognostic implications. Diagnostics (Basel). (2024) 14:1988. doi: 10.3390/diagnostics14171988
34.
Artigas A Wernerman J Arroyo V Vincent JL Levy M . Role of albumin in diseases associated with severe systemic inflammation: pathophysiologic and clinical evidence in sepsis and in decompensated cirrhosis. J Crit Care. (2016) 33:62–70. doi: 10.1016/j.jcrc.2015.12.019
35.
Goh SL De Silva RP Dhital K Gett RM . Is low serum albumin associated with postoperative complications in patients undergoing oesophagectomy for oesophageal malignancies?Interact Cardiovasc Thorac Surg. (2015) 20:107–13. doi: 10.1093/icvts/ivu324
36.
Wang Y ., and Yu, H. Association between lactate to albumin ratio and mortality among sepsis associated acute kidney injury patients. BMC Infect Dis. (2025) 25:414. doi: 10.1186/s12879-025-10838-1
37.
Shangguan X Zhang Z Shangguan X Wang J Gong Y . Association between whole blood cell-derived inflammatory markers and all-cause mortality in patients with sepsis-associated acute kidney injury: a retrospective study based on the MIMIC-IV database. J Intensive Care Med. (2025) 25:8850666251363853. doi: 10.1177/08850666251363853
38.
Nagy E Abdelfattah AH Sayed-Ahmed N Ahmed S . Cystatin C as a predictor of renal recovery and in hospital mortality in patients with acute kidney injury and liver cirrhosis. BMC Nephrol. (2025) 26:413. doi: 10.1186/s12882-025-04341-7
Summary
Keywords
clinical outcomes, cohort study, LAR ratio, RAR ratio, SA-AKI
Citation
Wei K, Huang H, Su Z, Zeng H, Cen J and Li H (2026) Association between red blood cell distribution width to albumin ratio and prognosis in patients with sepsis-associated acute kidney injury: a retrospective cohort study. Front. Med. 13:1724095. doi: 10.3389/fmed.2026.1724095
Received
18 October 2025
Revised
13 January 2026
Accepted
16 January 2026
Published
03 February 2026
Volume
13 - 2026
Edited by
Lorenzo Pelagatti, Careggi University Hospital, Italy
Reviewed by
Huan Wu, Affiliated Hospital of Guizhou Medical University, China
Jinshuai Lu, People's Hospital of Xinjiang Uygur Autonomous Region, China
Updates
Copyright
© 2026 Wei, Huang, Su, Zeng, Cen and Li.
This is an open-access article distributed under the terms of the Creative Commons Attribution License (CC BY). The use, distribution or reproduction in other forums is permitted, provided the original author(s) and the copyright owner(s) are credited and that the original publication in this journal is cited, in accordance with accepted academic practice. No use, distribution or reproduction is permitted which does not comply with these terms.
*Correspondence: Hui Li, lihui19943165898x@qq.com
Disclaimer
All claims expressed in this article are solely those of the authors and do not necessarily represent those of their affiliated organizations, or those of the publisher, the editors and the reviewers. Any product that may be evaluated in this article or claim that may be made by its manufacturer is not guaranteed or endorsed by the publisher.