Abstract
Introduction:
Esophageal cancer remains a major global health burden and is among the leading causes of cancer-related deaths. Accurate evaluation of tumor regression grade (TRG) after neoadjuvant therapy is essential for assessing treatment response and guiding postoperative management. However, conventional TRG assessment relies heavily on subjective histopathological assessments, leading to considerable inter-observer variability and limited reproducibility. We aimed to develop an objective and automated TRG assessment framework using artificial intelligence for digital pathology.
Methods:
A retrospective analysis was conducted on 157 patients with esophageal cancer and 1,298 hematoxylin and eosin-stained whole-slide images. Three slide-level pathology foundation models and three multiple instance learning methods were evaluated within a patient-level multiple instance learning framework, enabling weakly supervised TRG prediction based solely on patient-level labels.
Results:
The proposed framework achieved a classification accuracy of 82.7% and demonstrated strong agreement with manual pathologist grading. Notably, artificial intelligence-derived TRG score provided superior prognostic stratification compared with conventional assessments, showing significant associations with progression-free and overall survival.
Discussion:
This study presents a foundation-model-driven, patient-level multiple instance learning framework for automated evaluation of TRG in esophageal cancer. This approach offers a standardized, reproducible, and clinically interpretable solution that reduces the workload of pathologists and improves prognostic precision. These findings highlight the potential of weakly supervised AI pathology in advancing personalized treatment assessment and decision-making in digital oncology.
1 Introduction
Esophageal cancer (EC) is a prevalent malignant tumor of the digestive tract, ranking seventh in incidence and sixth in mortality globally (1). In clinical practice, most patients with EC are diagnosed at locally advanced stages. Because of its poor prognosis, multimodal treatment strategies combining neoadjuvant therapy (NAT) with surgical resection have recently become the standard approach, replacing surgical treatment alone (2–5). The primary objective of NAT is to improve the complete resection rate of tumors and eliminate potential micrometastases through preoperative downstaging, significantly improving patient prognosis (6, 7). Accurate assessment of pathological response after NAT is essential for evaluating therapeutic efficacy and determining optimal postoperative management strategies. Tumor regression grade (TRG) is a crucial histopathological indicator of NAT efficacy and for informing clinical decision-making (8, 9). However, traditional TRG assessments are subjective and rely on visual estimates of the proportion of residual tumor cells relative to fibrosis, or the percentage of residual tumor area within whole-slide images (WSIs) (10). Such manual evaluations are associated with significant inter-observer variability and limited reproducibility. Moreover, pathologists typically need to carefully review dozens, or even hundreds, of histopathological slides to complete the TRG assessment of a single patient with EC, which is extremely time-consuming and imposes a heavy burden on increasingly strained pathologic resources. Therefore, there is an urgent need to develop an objective, accurate, efficient, and reproducible automated tool for evaluating TRG in EC.
The integration of whole-slide imaging with artificial intelligence (AI), particularly deep learning, has recently shown notable potential in various tumor diagnostic and prognostic tasks (11–16). In the field of TRG, several studies have explored the feasibility of AI-assisted assessment following NAT. Tolkach et al. (17) developed an AI system that can be used to automatically detect tumor regions and grade histological regression in esophageal adenocarcinoma, achieving a strong correlation with clinical outcomes and performance comparable to expert pathologists’ assessments. Wang et al. (18) further proposed a semi-supervised knowledge distillation framework to evaluate the pathological response of esophageal squamous cell carcinoma after NAT, demonstrating a strong agreement with pathologists’ assessments of residual tumor percentage. However, their approach required manually labeled image patches and primarily focused on continuous residual tumor quantification rather than direct TRG score prediction.
To address these limitations, we developed an accurate and efficient weakly supervised AI framework for the automated assessment of TRG score after NAT in EC. Compared with the fully supervised methods adopted in previous studies, weakly supervised approaches, such as multiple instance learning (MIL), have emerged as powerful alternatives in computational pathology. As highlighted in a recent comprehensive survey by Waqas et al. (19), MIL has gained significant traction in medical image analysis by drastically reducing the annotation burden while maintaining robust performance across diverse diagnostic tasks. This paradigm enables efficient model training without detailed pixel- or region-level annotations (20–22). Our framework relies solely on patient-level labels provided by pathologists, eliminating the need for precise tumor annotations or manual slide-level grading. Specifically, we first incorporated pathology foundation models into our workflow and systematically compared several state-of-the-art slide-level encoders, including CHIEF (23), Prov-Gigapath (24), and TITAN (25) to identify the optimal feature extractor for WSI representation. Subsequently, we implemented an MIL-based architecture, in which each patient was treated as a “bag” comprising multiple WSIs from the same patient as “instances.” Next, several advanced attention-based MIL algorithms were evaluated to construct a robust patient-level TRG assessment model.
In this study, we demonstrated that AI-predicted TRG score at the patient level were highly consistent with manual pathologist grading across cross-validation folds. Notably, the AI-derived grade exhibited superior prognostic power compared with manual TRG score, indicating the model’s capacity to capture clinically meaningful histological patterns beyond human perception. This framework effectively mitigates the challenges of subjectivity, limited reproducibility, and time-intensive evaluations inherent in traditional TRG assessments. Moreover, by providing enhanced prognostic stratification, it holds strong potential to inform personalized adjuvant treatment decisions for patients with EC, underscoring its clinical applicability and translational significance in the era of pathological AI.
2 Materials and methods
2.1 Study participants
Eligible patients were aged 18–75 years of either sex, with an Eastern Cooperative Oncology Group performance status of 0–1. All cases were pathologically confirmed as esophageal squamous cell carcinoma, and the patients had radiologically and clinically resectable locally advanced disease that was treated with NAT. Only patients with complete clinicopathological and follow-up data were included in the analyses.
Patients were excluded if they had non-squamous histological subtypes of EC, severe systemic comorbidities that contraindicated standard treatment, or synchronous malignancies in other organs.
2.2 Ethical approval
This study was conducted in accordance with the principles of the Declaration of Helsinki. Ethical approval and a waiver of informed consent were obtained from the Ethics Committee of Zhongshan Hospital Affiliated to Xiamen University.
2.3 Observation indicators
Histopathological examination was conducted by two experienced pathologists who analyzed the hematoxylin and eosin (H&E)-stained slides to evaluate the resection margins and lymph nodes. Tumor staging was based on the 8th edition of the American Joint Committee on Cancer staging system (26). The tumor response to NAT was assessed using the College of American Pathologists (CAP) grading system (modified Ryan scheme) (8). The specific category-to-criteria mapping is defined as follows: TRG 0 (no viable cancer cells); TRG 1 [single cells or rare small groups of cancer cells, <10% viable residual tumor cells (VRTCs)]; TRG 2 (residual cancer cells outgrown by fibrosis, 10–50% VRTCs); and TRG 3 (minimal or no tumor regression, >50% VRTCs). Patients were categorized as good (TRG 0–1) or poor (TRG 2–3) responders. Overall survival (OS) was defined as the time from diagnosis to death, and progression-free survival (PFS) was defined as the time to tumor progression or death from any cause.
2.4 Histopathology data collection and scoring
All hematoxylin and eosin (H&E)-stained sections were digitally scanned and subjected to quality control. The TRG score of the patients was determined based on postoperative pathological assessment criteria and served as the primary source of the labels.
This study included 157 patients with EC who underwent NAT followed by surgical resection. H&E-stained WSIs were retrospectively collected, yielding 1,298 digital pathology slides. Patient-level TRG labels were obtained from pathology reports, and the final TRG score was determined by integrating multiple slides per patient. Given that TRG is inherently a case-level construct and patient-level labels may not represent the histology of individual slides (e.g., a slide with no tumor cells from a TRG 2 patient), direct inheritance of labels is imprecise. Therefore, to enable the evaluation of slide-level feature extraction capabilities, an independent dataset of 120 WSIs was randomly sampled. Two experienced pathologists manually assigned a “slide-level TRG” to each WSI solely based on the proportion of residual tumor area observed on that specific slide, following the CAP criteria. These slide-specific annotations served as the ground truth for the technical benchmarking of foundation models.
2.5 Foundation models for slide-level feature extraction
To extract discriminative features from the WSIs, we systematically evaluated three recently developed pathology foundation models: Prov-Gigapath, TITAN, and CHIEF, using 120 WSIs with slide-level TRG annotations.
Prov-Gigapath is a large-scale model trained on 170,000 WSIs. It integrates a tile encoder with a LongNet-based slide encoder to process gigapixel images. While it offers robustness through scale, its architecture is primarily patch-centric. TITAN, in contrast, adopts a multimodal framework (ConCH v1.5 encoder) designed to integrate images and language. Trained on WSIs paired with captions, it excels in cross-modal alignment and zero-shot predictions, focusing on semantic generalization rather than pure histological hierarchy.
CHIEF, however, introduces a hierarchical tokenization mechanism that allows the model to simultaneously capture fine-grained cellular morphology and broader tissue architecture. This architectural characteristic formed our primary a priori rationale for selecting CHIEF as the optimal backbone. Accurate TRG grading requires the simultaneous recognition of residual tumor cells (local features) and the surrounding fibrotic stroma (global context). CHIEF’s ability to integrate these multi-scale features makes it theoretically more suitable for TRG assessment compared to the patch-centric approach of Prov-Gigapath or the language-aligned focus of TITAN.
Consequently, CHIEF was selected as the designated feature extractor, with the empirical benchmarking serving primarily to validate this theoretical hypothesis. The pre-trained backbone generates a 768-dimensional representation for each slide. For all experiments, features were extracted using these foundation models at 20× resolution and subsequently subjected to downstream analysis.
For each WSI, features were extracted using all three foundation models at 20× resolution and subsequently underwent further analysis.
2.6 Feature visualization
To evaluate whether the learned embeddings reflected TRG-specific differences, we used nonlinear dimensionality reduction methods, namely t-distributed stochastic neighbor embedding and uniform manifold approximation and projection. These techniques project high-dimensional embeddings onto a two-dimensional space, enabling the qualitative visualization of class separation while preserving local neighborhood relationships and global data structures.
2.7 Slide-level classification
A quantitative evaluation of slide-level classification was performed using support vector machines trained on embeddings from each foundation model. The support vector machine classifier was chosen for its proven effectiveness in high-dimensional feature spaces and robustness against overfitting. A radial basis function kernel was used to capture the nonlinear class boundaries, and the hyperparameters were optimized within each training fold. To ensure robust estimation of model generalization, five-fold cross-validation was applied, with training and testing sets partitioned at the slide level. The performance metrics included overall accuracy, area under the receiver operating characteristic curve (AUC), precision, recall, F1-score, and confusion matrices.
2.8 Patient-level TRG prediction
Following the comparative evaluation of the foundation models at the slide level, the best-performing foundation model was incorporated into a patient-level predictive framework. Because TRG labels were available only at the case level, we adopted an MIL strategy that treats each patient as a bag and the associated WSIs as instances within that bag. The bag inherits the patient-level TRG label, whereas the labels of the individual instances remain unknown. This approach is particularly suitable for weakly supervised pathology tasks, in which detailed annotations are difficult to obtain.
Three MIL variants are implemented and compared. First, attention-based MIL aggregates slide-level embeddings using an attention mechanism that assigns variable importance weights to each instance, highlighting the most informative slides for prediction. Second, adaptive cross-instance MIL (ACMIL) extends this framework by modeling dependencies among slides and dynamically adjusting the weighting scheme to account for inter-instance relationships. Third, the clustering-constrained attention MIL (CLAM) imposes an additional constraint that partitions instances within a bag into clusters representing positive and negative evidence, thereby enhancing the interpretability and robustness of the aggregated representation. In all three cases, CHIEF was used as the feature extraction backbone because it demonstrated the strongest discriminative power in the preliminary experiments.
Patient-level MIL models were trained and evaluated using five-fold cross-validation, with data split at the patient level to avoid information leakage across the folds. The evaluation metrics included overall accuracy, macro-F1 score, and AUC, with confusion matrices providing detailed insights into class-specific performance.
2.9 Implementation details
For each patient, feature embeddings extracted from all available WSIs (ranging from 2 to 10 slides) were aggregated to form a single patient-level bag, enabling the MIL framework to capture intra-patient histological heterogeneity across different tissue sections. No padding or truncation was applied; all slides belonging to a patient were included during bag aggregation. Five-fold cross-validation was performed with patient-level splits to strictly prevent information leakage between training and test sets.
To address class imbalance between favorable (TRG 0–1) and poor (TRG 2–3) response groups, class-balanced resampling was applied at the patient (bag) level during training. Model optimization was conducted using the AdamW optimizer with an initial learning rate of 2 × 10⁻⁴ and a weight decay of 4 × 10⁻⁴. The batch size was set to 2 patients per iteration, and all models were trained for 100 epochs.
A cosine annealing learning rate scheduler with warm-up was employed. The warm-up phase lasted for six epochs with an initial learning rate of 1 × 10⁻⁶. The cosine schedule was initialized with a cycle length of two epochs, with the cycle length doubling after each restart up to a maximum of 20 epochs. The minimum learning rate was set to 1 × 10⁻⁷. To ensure stable optimization under weak supervision, each epoch consisted of a fixed number of 200 training iterations.
The training objective was defined as a label-smoothed cross-entropy loss with a smoothing factor of 0.2, which helped mitigate overconfidence and improve generalization in the presence of noisy patient-level supervision. All hyperparameters were kept identical across cross-validation folds, resulting in negligible variation and ensuring reproducible model training.
2.10 Statistical analysis
Statistical analyses were performed using MATLAB (MathWorks, Natick, MA, United States). Model performance was assessed using accuracy, precision, recall, F1-score, and AUC with 95% confidence intervals (CIs). Group-wise comparisons were performed using paired t-tests or Wilcoxon signed-rank tests, with significance set at p < 0.05. Uniform manifold approximation and projection were performed for feature visualization and implemented using MATLAB.
Deep learning experiments, including feature extraction from foundation models and MIL frameworks, were conducted in Python (version 3.10) using an NVIDIA GTX 3090 GPU.
3 Results
3.1 Baseline characteristics of study participants
We analyzed 157 patients with esophageal squamous cell carcinoma who received NAT treatment. Among them, 126 (80.3%) were male, and 100 (63.7%) were aged ≥60 years. Postoperative pathological outcomes showed that 41 and 116 patients achieved TRG 0–1 and TRG 2–3, respectively. The baseline characteristics of the patients are summarized in Table 1.
Table 1
| Characteristic | N | (%) |
|---|---|---|
| Age (years) | ||
| <60 | 57 | 36.3% |
| ≥60 | 100 | 63.7% |
| Sex | ||
| Male | 126 | 80.3% |
| Female | 31 | 19.7% |
| BMI | ||
| <18 | 31 | 19.8% |
| 18–24 | 105 | 66.8% |
| >24 | 21 | 13.4% |
| Tumor location | ||
| Upper | 14 | 9.0% |
| Middle | 93 | 59.2% |
| Lower | 50 | 31.8% |
| Clinical stage | ||
| II | 39 | 24.8% |
| III | 102 | 65.0% |
| IVa | 16 | 10.2% |
| Neoadjuvant therapy cycle | ||
| ≤2 | 121 | 77.1% |
| >2 | 36 | 22.9% |
| ypT stage | ||
| T0–T2 | 73 | 46.5% |
| T3–T4 | 84 | 53.5% |
| ypN stage | ||
| N0 | 91 | 58.0% |
| N1–N3 | 66 | 42.0% |
| TRG | ||
| TRG 0–1 | 41 | 26.1% |
| TRG 2–3 | 116 | 73.9% |
Baseline characteristics of patients with esophageal squamous cell carcinoma receiving neoadjuvant therapy.
TRG, tumor regression grade; BMI, body mass index.
We designed a two-stage analytical workflow to systematically evaluate the performance of the pathology foundation models and establish an interpretable AI framework for TRG score prediction (Figure 1). At the slide level, three large-scale pathology foundation models were evaluated using 120 annotated WSIs to extract high-dimensional histopathological embeddings. The best-performing model was integrated into a patient-level prediction framework based on MIL, in which slide-level embeddings served as instances, and patient-level TRG score served as weak supervisory labels.
Figure 1
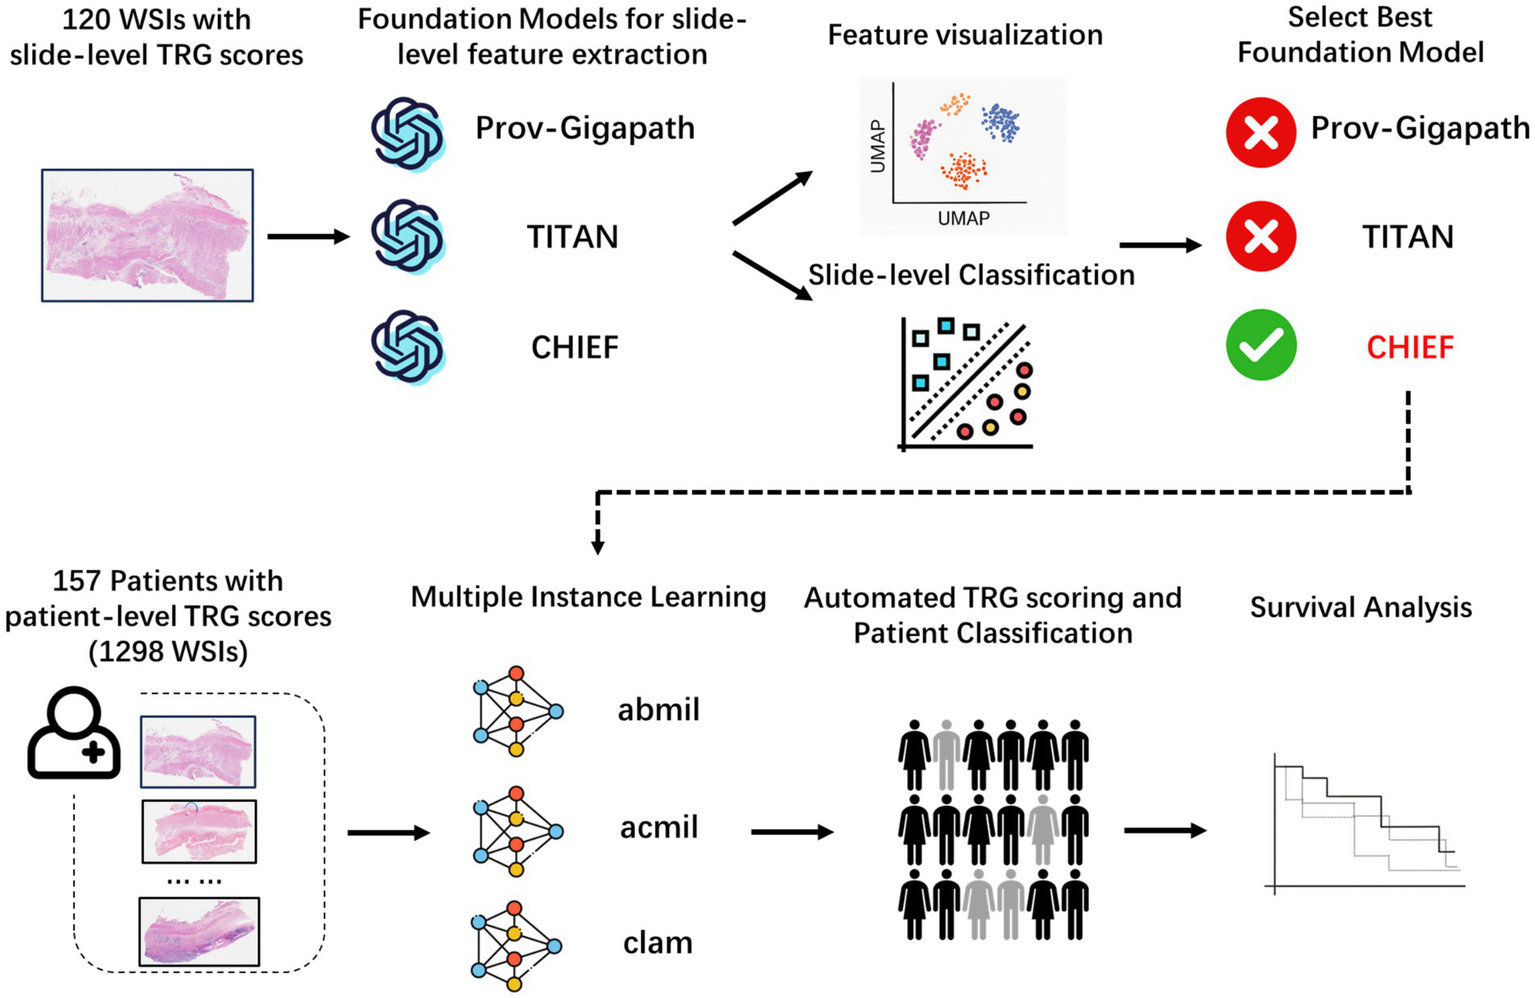
Overall analytical workflow for tumor regression grade prediction in esophageal cancer. Schematic illustration of the two-stage pipeline. In stage 1, slide-level embeddings were extracted from H&E WSIs using three pathology foundation models (CHIEF, Prov-Gigapath, and TITAN) and benchmarked using a five-fold cross-validated support vector machine (SVM) classification. In stage 2, the best-performing model (CHIEF) provided slide-level representations for patient-level MIL frameworks (ABMIL, ACMIL, and CLAM), enabling weakly supervised prediction of TRG. Quantitative evaluation and interpretability analyses were performed at the slide and patient levels. H&E, hematoxylin and eosin; WSIs, whole-slide images; MIL, multiple instance learning.
Furthermore, we projected high-dimensional slide-level embeddings onto 2D using uniform manifold approximation and projection to assess the discriminative capacity of slide-level features extracted with different pathology foundation models (Figure 2). The resulting visualization revealed that the embeddings generated by CHIEF and TITAN demonstrated a clearer separation between the TRG categories, particularly for the extreme classes, such as TRG 0 and TRG 3. In contrast, the features derived from Prov-Gigapath showed substantial overlap across categories, indicating limited discriminability for this specific task. These observations suggest that models pretrained with broader histological diversity (CHIEF) or multimodal objectives (TITAN) were more effective in capturing regression-related morphological variations than the patch-centric Prov-Gigapath model.
Figure 2
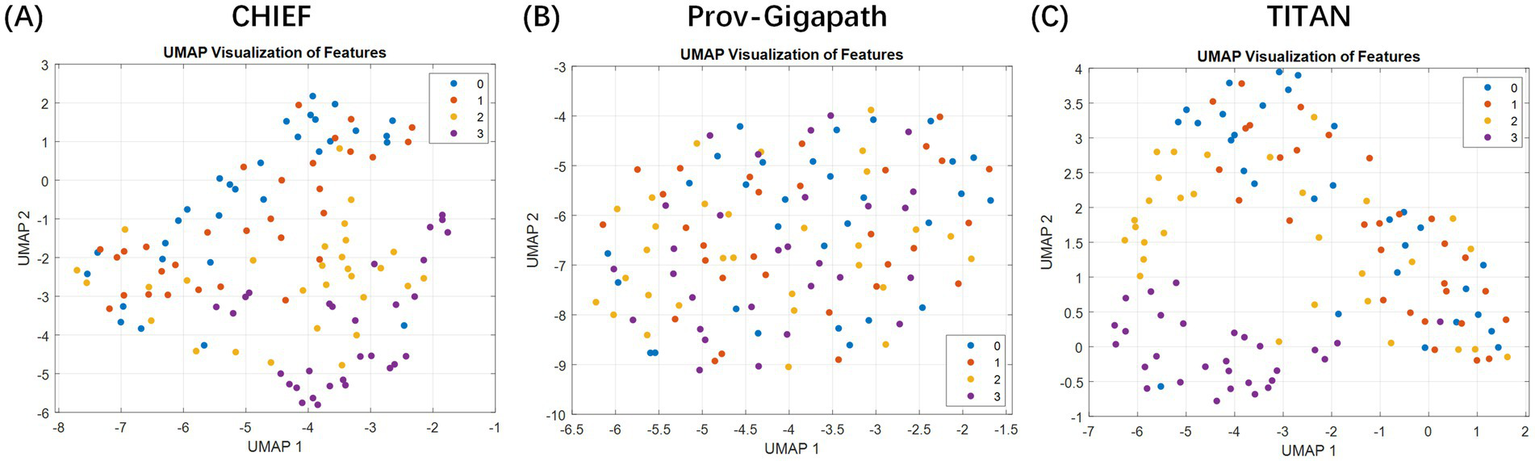
Two-dimensional visualization of slide-level embeddings generated using different pathology foundation models. The plots illustrate the feature space distributions extracted by three distinct backbones: (A) CHIEF, (B) Prov-Gigapath, and (C) TITAN. Method: High-dimensional slide representations (e.g., 768 dimensions for CHIEF) were projected onto a 2D plane using uniform manifold approximation and projection (UMAP). Data representation: Each individual point represents a single whole slide image (WSI) (slide-level), color-coded by its ground-truth TRG category (red: TRG 3; blue: TRG 0; etc.). Takeaway: The visualization demonstrates that the CHIEF model produces the most distinct separation between the extreme classes (TRG 0 vs. TRG 3) with minimal overlap compared to Prov-Gigapath and TITAN, visually validating its selection as the optimal feature extractor for the subsequent patient-level MIL framework.
The quantitative classification experiments further confirmed these qualitative trends (Table 2). In five-fold cross-validation, CHIEF consistently outperformed the other two models when using support vector machine classifiers trained on slide-level features. It achieved balanced precision, recall, and F1-scores across most TRG categories, with particularly high performance for TRG 3 (F1 = 0.933) and acceptable results for intermediate categories such as TRG 1 and TRG 2 (F1 ranging from 0.556 to 0.746). TITAN achieved competitive performance in TRG 2 and 3 but was less effective in the lower categories. Prov-Gigapath performed poorly overall, with most F1-scores of 0.40. These findings indicate that CHIEF is the most suitable backbone for downstream patient-level modeling (see Table 3).
Table 2
| TRG score | Precision | Recall | F 1-score |
|---|---|---|---|
| CHIEF | |||
| 0 | 0.686 | 0.801 | 0.738 |
| 1 | 0.625 | 0.500 | 0.556 |
| 2 | 0.733 | 0.759 | 0.746 |
| 3 | 0.933 | 0.933 | 0.933 |
| Prov-Gigapath | |||
| 0 | 0.286 | 0.333 | 0.308 |
| 1 | 0.133 | 0.067 | 0.089 |
| 2 | 0.242 | 0.267 | 0.254 |
| 3 | 0.361 | 0.448 | 0.400 |
| TITAN | |||
| 0 | 0.565 | 0.433 | 0.491 |
| 1 | 0.444 | 0.533 | 0.485 |
| 2 | 0.645 | 0.667 | 0.656 |
| 3 | 0.931 | 0.931 | 0.931 |
Slide-level classification performance of pathology foundation models.
Table 3
| ABMIL | ACMIL | CLAM | |||||||
|---|---|---|---|---|---|---|---|---|---|
| Class | AUC | 95% CI lower | 95% CI upper | AUC | 95% CI lower | 95% CI upper | AUC | 95% CI lower | 95% CI upper |
| Fold 1 | |||||||||
| TRG 0 | 0.918 | 0.817 | 1.000 | 0.866 | 0.695 | 1.000 | 0.970 | 0.903 | 1.000 |
| TRG 1 | 1.000 | 1.000 | 1.000 | 0.903 | 0.795 | 0.994 | 0.968 | 0.898 | 1.000 |
| TRG 2 | 0.689 | 0.332 | 0.971 | 0.748 | 0.414 | 1.000 | 0.696 | 0.425 | 0.964 |
| TRG 3 | 0.914 | 0.800 | 0.988 | 0.886 | 0.765 | 1.000 | 0.894 | 0.758 | 0.980 |
| Macro-average | 0.880 | 0.699 | 0.964 | 0.851 | 0.719 | 0.976 | 0.882 | 0.755 | 0.987 |
| Micro-average | 0.899 | 0.790 | 0.963 | 0.868 | 0.772 | 0.973 | 0.904 | 0.804 | 0.967 |
| Fold 2 | |||||||||
| TRG 0 | 0.964 | 0.839 | 1.000 | 0.973 | 0.875 | 1.000 | 0.973 | 0.903 | 1.000 |
| TRG 1 | 0.800 | 0.578 | 0.971 | 0.967 | 0.894 | 1.000 | 0.750 | 0.405 | 1.000 |
| TRG 2 | 0.698 | 0.397 | 0.937 | 0.620 | 0.410 | 0.889 | 0.604 | 0.398 | 0.784 |
| TRG 3 | 0.750 | 0.599 | 0.910 | 0.782 | 0.619 | 0.947 | 0.762 | 0.587 | 0.931 |
| Macro-average | 0.803 | 0.680 | 0.937 | 0.835 | 0.695 | 0.921 | 0.772 | 0.626 | 0.899 |
| Micro-average | 0.828 | 0.732 | 0.909 | 0.846 | 0.736 | 0.914 | 0.826 | 0.707 | 0.907 |
| Fold 3 | |||||||||
| TRG 0 | 0.962 | 0.862 | 1.000 | 0.969 | 0.889 | 1.000 | 0.969 | 0.877 | 1.000 |
| TRG 1 | 0.714 | 0.345 | 1.000 | 0.690 | 0.378 | 0.970 | 0.869 | 0.716 | 1.000 |
| TRG 2 | 0.613 | 0.259 | 0.920 | 0.727 | 0.286 | 1.000 | 0.667 | 0.375 | 0.981 |
| TRG 3 | 0.857 | 0.671 | 0.974 | 0.882 | 0.744 | 0.991 | 0.887 | 0.759 | 0.973 |
| Macro-average | 0.787 | 0.639 | 0.911 | 0.817 | 0.708 | 0.955 | 0.848 | 0.747 | 0.931 |
| Micro-average | 0.862 | 0.755 | 0.938 | 0.895 | 0.813 | 0.984 | 0.888 | 0.768 | 0.964 |
| Fold 4 | |||||||||
| TRG 0 | 0.931 | 0.778 | 1.000 | 0.977 | 0.907 | 1.000 | 1.000 | 1.000 | 1.000 |
| TRG 1 | 0.828 | 0.633 | 1.000 | 0.914 | 0.782 | 1.000 | 0.966 | 0.915 | 1.000 |
| TRG 2 | 0.815 | 0.631 | 0.965 | 0.755 | 0.565 | 0.985 | 0.772 | 0.519 | 1.000 |
| TRG 3 | 0.946 | 0.853 | 1.000 | 0.913 | 0.774 | 1.000 | 0.900 | 0.724 | 1.000 |
| Macro-average | 0.880 | 0.774 | 0.977 | 0.890 | 0.770 | 0.981 | 0.909 | 0.804 | 1.000 |
| Micro-average | 0.891 | 0.793 | 0.964 | 0.916 | 0.844 | 0.977 | 0.940 | 0.867 | 0.992 |
| Fold 5 | |||||||||
| TRG 0 | 0.905 | 0.813 | 1.000 | 0.917 | 0.773 | 1.000 | 0.964 | 0.869 | 1.000 |
| TRG 1 | 0.454 | 0.138 | 0.762 | 0.585 | 0.267 | 0.893 | 0.592 | 0.267 | 0.907 |
| TRG 2 | 0.877 | 0.759 | 0.995 | 0.709 | 0.500 | 0.877 | 0.727 | 0.535 | 0.889 |
| TRG 3 | 0.969 | 0.889 | 1.000 | 0.939 | 0.846 | 1.000 | 0.939 | 0.833 | 1.000 |
| Macro-average | 0.801 | 0.707 | 0.875 | 0.787 | 0.681 | 0.883 | 0.806 | 0.657 | 0.932 |
| Micro-average | 0.833 | 0.720 | 0.960 | 0.830 | 0.732 | 0.905 | 0.812 | 0.691 | 0.902 |
| Overall | |||||||||
| TRG 0 | 0.897 | 0.824 | 0.957 | 0.899 | 0.814 | 0.964 | 0.955 | 0.899 | 0.992 |
| TRG 1 | 0.707 | 0.516 | 0.847 | 0.735 | 0.567 | 0.868 | 0.771 | 0.628 | 0.879 |
| TRG 2 | 0.749 | 0.627 | 0.856 | 0.737 | 0.627 | 0.839 | 0.693 | 0.584 | 0.776 |
| TRG 3 | 0.877 | 0.814 | 0.939 | 0.870 | 0.799 | 0.919 | 0.859 | 0.804 | 0.913 |
| Macro-average | 0.807 | 0.746 | 0.865 | 0.810 | 0.745 | 0.868 | 0.820 | 0.771 | 0.880 |
| Micro-average | 0.860 | 0.817 | 0.913 | 0.873 | 0.828 | 0.911 | 0.870 | 0.829 | 0.904 |
Patient-level TRG prediction performance of multiple instance learning (MIL) models.
TRG, tumor regression grade; AUC, area under the receiver operating characteristic curve.
Based on the slide-level results, we constructed a patient-level TRG prediction framework using MIL. The dataset comprised 157 patients, each contributing 2–10 WSIs. Because only patient-level TRG labels were available, each patient was treated as a bag containing multiple instances (WSIs), with the CHIEF-extracted features of each slide serving as instance representations.
We implemented and compared three representative MIL approaches, namely attention-based MIL (ABMIL), ACMIL, and CLAM, to aggregate slide-level features into patient-level predictions. The model was trained using a five-fold cross-validation setting to ensure patient-level independence between the folds.
Across the five-fold cross-validation, the models demonstrated robust stability. We report the performance as the mean metrics across the folds. The MIL variants achieved a mean macro-average AUC of 0.810 (95% CI: 0.745–0.865) for ACMIL and 0.820 (95% CI: 0.771–0.880) for CLAM. The mean micro-average AUCs consistently exceeded 0.86. Specifically, the CLAM model achieved the highest mean macro-average AUC, while ACMIL demonstrated the most balanced performance with a mean overall accuracy of 82.7%.
The overall receiver operating characteristic curves (Figure 3) illustrated clear separability across the TRG categories, with TRG 0 and 3 achieving the highest discriminative power (AUCs of 0.955 and 0.859 for CLAM, respectively). Intermediate grades (TRG 1–2) showed moderate but consistent classification performance (AUCs = 0.693–0.771).
Figure 3
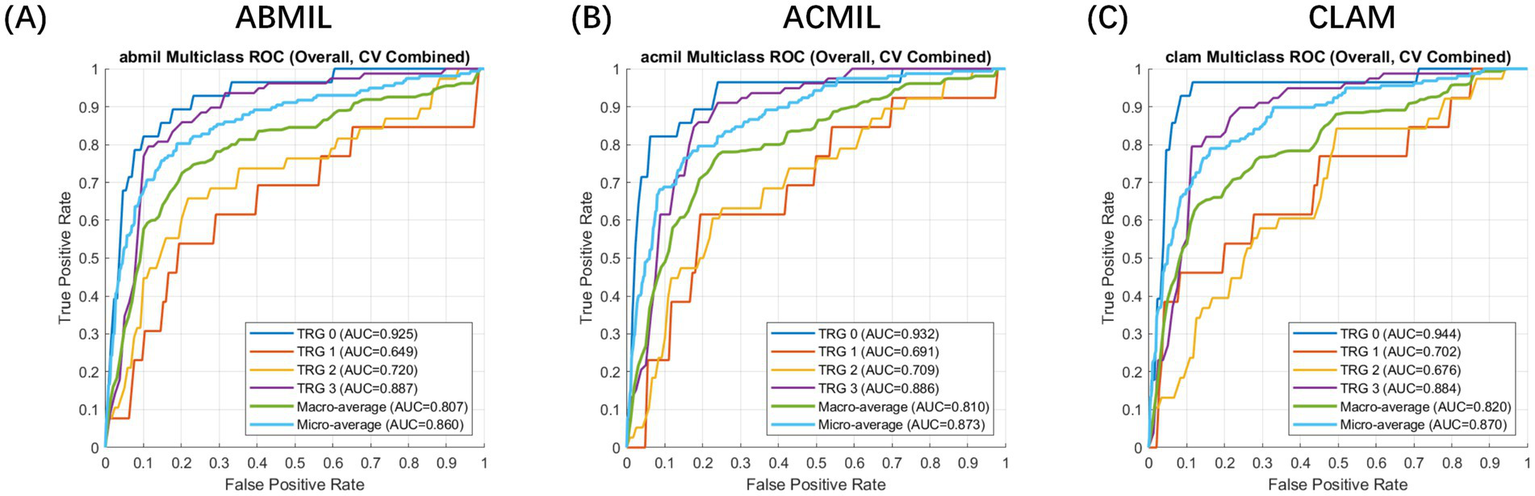
Receiver operating characteristic (ROC) curve analysis of patient-level multiple instance learning models for tumor regression grade prediction. Evaluation setting: The curves represent the patient-level classification performance evaluated using a 5-fold cross-validation scheme. Feature embeddings were extracted using the CHIEF foundation model. Metrics: The plots display the macro-average (blue) and micro-average (orange) ROC curves for the multi-class prediction (TRG 0–3). Model comparison: (A) ABMIL, (B) ACMIL, and (C) CLAM. The shaded areas (if applicable) or curves represent the mean performance across folds, demonstrating the robust discriminative ability of the MIL frameworks, with CLAM and ACMIL showing superior area under the curve (AUC) values.
The patient-level confusion matrices (Figure 4) revealed that most classification errors occurred between adjacent TRG categories, reflecting the inherent ambiguity in histological response assessment. Across all three MIL models, predictions of TRG 0 and TRG 3 showed high agreement with the ground truth (accuracy >0.85), whereas TRG 1 and TRG 2 were more prone to misclassification owing to overlapping morphological features such as mixed residual tumor and stromal fibrosis.
Figure 4
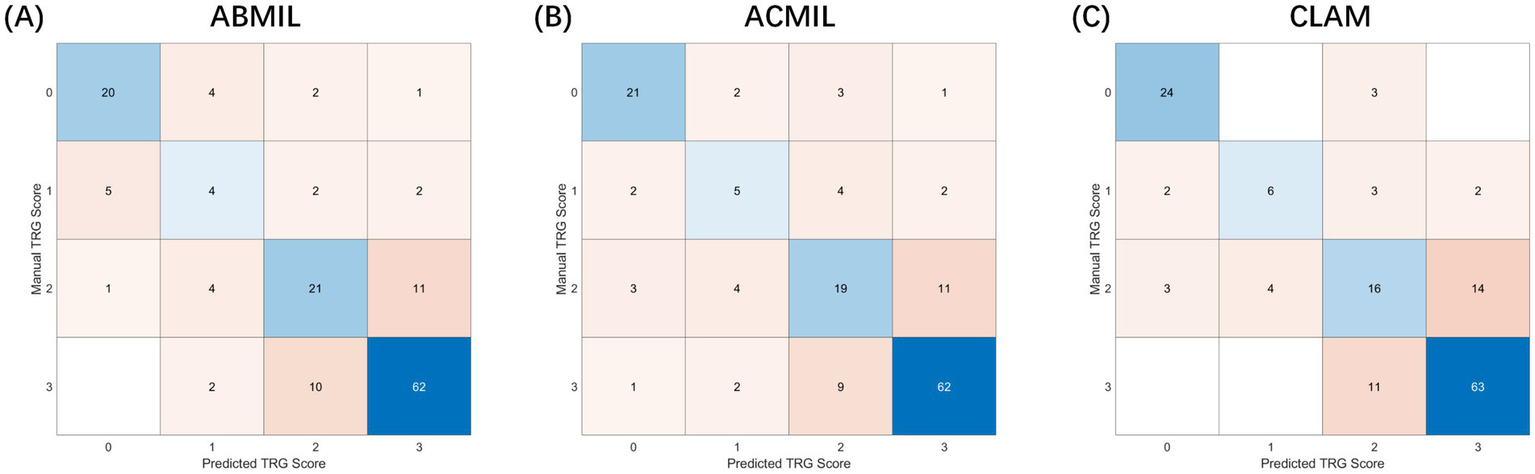
Confusion matrices of patient-level tumor regression grade classification. Experimental setup: The matrices visualize the classification results on the test sets accumulated across 5-fold cross-validation. Input features were extracted using the CHIEF backbone. Axes definition: The Y-axis represents the manual TRG score (ground truth) assigned by pathologists, while the X-axis represents the predicted TRG score generated by the AI models. Values: Numbers inside the cells indicate the raw count of patients. Darker colors represent higher density/agreement. Comparison: (A) ABMIL, (B) ACMIL, and (C) CLAM. Notably, the ACMIL model (B) demonstrates the strongest diagonal alignment (highest agreement with human graders) and the most balanced classification accuracy (82.7%) compared to other variants.
Notably, the ACMIL model demonstrated the most balanced performance, correctly classifying 84.6% of the TRG 0/1 cases and 80.3% of the TRG 2/3 cases, yielding an overall accuracy of 82.7%. The confusion matrices further revealed that the MIL models captured the ordinal structure of TRG grading, as most mispredictions deviated by only one grade, underscoring the biological continuity between adjacent TRG levels rather than the random errors.
To assess the prognostic relevance of TRG in EC, we examined whether pathologist-assigned or AI-predicted TRG score could stratify patients by long-term survival (Figure 5). Given the clinical convention that treatment responders exhibit lower TRG score, the patients were classified into two groups: TRG 0–1 (favorable response) and TRG 2–3 (poor response). Kaplan–Meier survival curves were generated for PFS and OS, and survival differences were evaluated using the log-rank test. Hazard ratios (HRs) and 95% CIs were estimated using Cox proportional hazard regression.
Figure 5
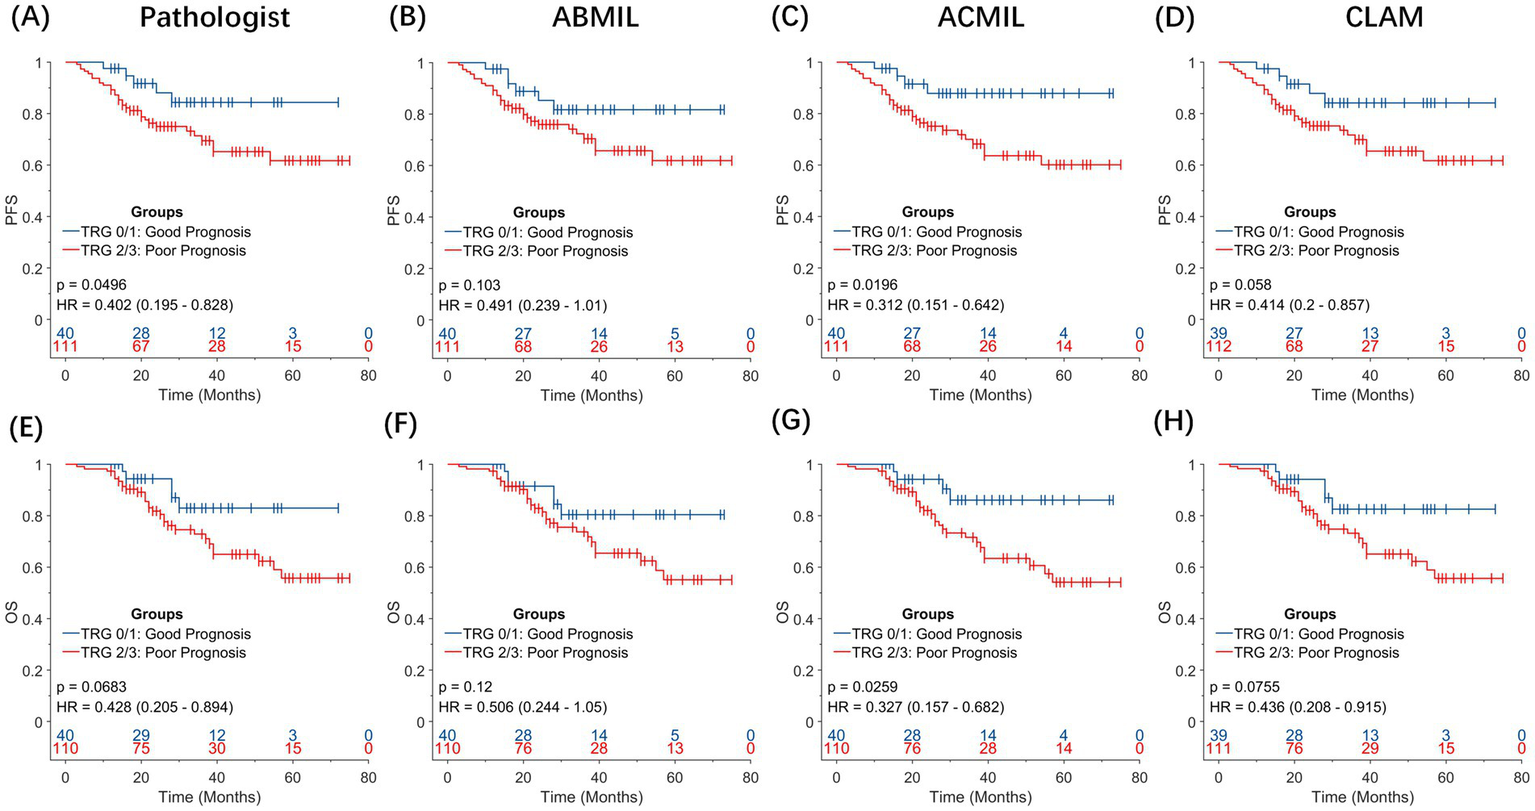
Prognostic significance of pathologist-assigned and artificial intelligence-predicted tumor grade. Kaplan–Meier survival curves for overall survival (OS) and progression-free survival (PFS) stratified by TRG 0–1 (favorable response) versus TRG 2–3 (poor response). (A,E) Pathologist-assigned TRG score for PFS and OS. (B,F) TRG predictions using the ABMIL model. (C,G) TRG predictions using the ACMIL model. (D,H) TRG predictions using the CLAM model. Among all comparisons, the ACMIL model (C,G) provides the most statistically significant prognostic stratification (PFS: p = 0.0196; OS: p = 0.0259), surpassing both manual pathologist grading (OS: p = 0.0683) and other MIL approaches.
When pathologist-assigned TRG score was used, the difference in OS between the TRG 0–1 and TRG 2–3 groups was not statistically significant (log-rank p = 0.068; HR = 0.428, 95% CI: 0.205–0.894).
In contrast, the AI-predicted TRG score, particularly those generated using the ACMIL model, demonstrated an improved ability to stratify patient outcomes. For PFS, the predicted TRG 0/1 group showed a sustained advantage over the predicted TRG 2/3 group throughout the follow-up period [HR = 0.312, 95% confidence interval (CI), 0.151–0.642; p = 0.0196]. A consistent pattern was observed in OS. Patients with predicted TRG 0/1 achieved longer OS than those with predicted TRG 2/3 (HR = 0.327, 95% CI: 0.157–0.682, p = 0.0259).
These results suggest that AI-derived TRG score captures the histopathological correlates of treatment response more effectively than conventional grading, providing superior discrimination of long-term outcomes. Specifically, ACMIL-predicted TRG has emerged as a robust surrogate biomarker for patient prognosis after NAT, offering potential value for response assessment and clinical trial endpoint refinement.
4 Discussion
In this study, we developed and validated a weakly supervised AI framework for the automated assessment of TRG in EC following NAT. Through combining large-scale pathology foundation models with MIL, the proposed approach achieved accurate, efficient, and reproducible patient-level TRG score prediction without the need for manual region annotations. The results demonstrated high consistency between AI-predicted and pathologist-assigned TRG score. Notably, the AI-derived TRG score exhibited superior prognostic value for PFS and OS. These findings highlight the potential of weakly supervised pathological AI systems in enhancing the objectivity and clinical utility of histopathological response assessments.
Conventional TRG evaluation remains the standard method for assessing histopathological responses after NAT; however, it is inherently limited by subjectivity, inter-observer variability, and workload intensity. The emergence of digital pathology and AI has provided new opportunities to overcome these challenges. Previous studies, such as those by Tolkach et al. (17) and Wang et al. (18), have demonstrated the feasibility of AI-assisted TRG evaluation in esophageal tumors. However, these approaches rely on manual patch-level labeling or continuous tumor percentage estimation, restricting scalability and clinical adoption.
Our framework overcomes these limitations through a fully weakly supervised design in which each patient is modeled as a “bag” containing multiple WSIs as instances. The model was trained directly on patient-level TRG labels that are readily available in clinical pathology reports, eliminating the need for manual slide- or pixel-level annotations. This strategy significantly reduces data preparation costs and enhances the feasibility of applying AI models to large-scale real-world cohorts.
The adoption of pathology foundation models played a central role in our framework. By evaluating three recent slide-level pretrained models, we identified CHIEF as the most discriminative and robust backbone for feature extraction at the slide level. The hierarchical vision transformer structure of CHIEF enables the simultaneous encoding of fine-grained cellular features and global tissue architecture, which are crucial for accurately characterizing tumor regression after NAT. These findings emphasize that model selection in computational pathology should be task-specific. Although Prov-Gigapath offers scalability through patch-level robustness, it lacks contextual integration. In contrast, CHIEF captures tissue-level organization more effectively, which is critical for TRG differentiation. This systematic comparison also contributes to a broader understanding of how foundation models can be leveraged and optimized for downstream clinical applications.
Building on CHIEF embeddings, we implemented and compared three representative MIL algorithms to integrate multiple WSIs per patient into a unified predictive model. Although the field is rapidly evolving with newer histology-focused MIL approaches, such as the method described in reference (27), which further optimize feature aggregation, we focused on established methods, including CLAM and ACMIL, to ensure robust reproducibility. In our comparative analysis, ACMIL achieved the best overall balance between accuracy and stability, reaching an accuracy of 82.7% and a macro-average AUC of 0.81 under five-fold cross-validation. Furthermore, confusion matrix analysis revealed that most classification errors occurred between adjacent TRG categories, reflecting the biological continuity of tumor regression rather than random misclassification.
Notably, AI-derived TRG score demonstrated stronger prognostic power than manual grading did. AI-predicted TRG (0–1 vs. 2–3) was used to effectively stratify patients according to PFS and OS, whereas the pathologist-assigned grades were not statistically significant. This superior prognostic stratification suggests that the AI model captures underlying histological complexities that extend beyond human visual perception, a conclusion validated within the emerging quantitative pathology paradigm. Li et al. (28) demonstrated that quantitative descriptors of tissue complexity, such as structural entropy, can provide biologically meaningful information about tumor structure by establishing an entropy-based comprehensive measurement framework in digital pathology. Li (29) improved interpretability in weakly supervised settings by decoding the potential spatial relationships between cells from pathological images through extracting spatial descriptors. Although manual TRG grading mainly quantifies the percentage of residual tumor burden, spatial tissue organization and tissue complexity are also key determinants of prognosis. The AI model can sensitively capture this information for prognostic prediction. Additionally, the MIL framework proposed in this study integrates the global information from multiple whole-slide images of the same patient, effectively capturing the spatial heterogeneity of individual patients. This heterogeneity, although known to have a significant impact on prognosis, is underestimated in manual TRG score. Clinically, AI-assisted TRG score could achieve standardized, objective and reproducible response assessments. Moreover, AI can capture the continuous biological spectrum of pathological responses. The TRG score predicted by AI are not a strictly ordered classification but a continuous severity grade, which can provide a more refined and biologically accurate reflection of treatment effects. This advantage helps to reduce inter-observer variability and facilitate multicenter clinical trials. Furthermore, the AI framework can provide more accurate survival stratification, offering information for individualized postoperative management decisions, including the need for adjuvant therapy or intensified surveillance in high-risk patients.
This study has several methodological and translational strengths. First, it introduces a fully weakly supervised paradigm for TRG assessment using only patient-level labels, eliminating the dependence on detailed annotations. Second, it leverages the representational capacity of pathology foundation models, allowing generalization to diverse histopathological patterns. Third, the model was prognostically validated, establishing its potential as a diagnostic tool and biomarker of clinical outcomes. Collectively, these advances provide a scalable and explainable framework suitable for real-world clinical deployment.
Despite its promising performance, this study has some limitations that highlight the directions for future studies. The model was developed and validated using data from a single medical center, which may limit its external generalizability owing to variations in slide preparation, staining, and scanning protocols across institutions. Although the foundation model (CHIEF) utilized in this study—pretrained on over 1 million diverse slides—provides inherent feature robustness against such variations, domain shifts caused by different scanners and staining intensities remain a potential challenge. Future studies should not only involve large-scale, multicenter validations but also incorporate rigorous stain normalization and domain adaptation techniques to ensure consistent performance across diverse clinical settings. The lack of multi-factor adjustment is another limitation. With larger sample sizes, subsequent research should assess the independent AI-TRG prognostic value while adjusting for key covariates such as ypT, ypN, and staging. Finally, the relatively small cohort of 157 patients, although cross-validated, underscores the need for larger datasets to further improve stability and representational capacity.
We proposed a weakly supervised AI framework for the automated assessment of TRG in post-NAT for EC. This framework performs well in classification accuracy and exhibits superior prognostic stratification compared with conventional manual assessment. By integrating the pathology foundation model with advanced MIL paradigms, our study provides a practical solution to the current challenges of labor-intensive annotations and subjective variability in TRG assessments. In addition to its direct clinical applicability for the precise diagnosis and treatment of EC, our study offers a methodological reference for similar pathological image analysis tasks in other cancer types that rely on patient-level weak labels.
Statements
Data availability statement
The original contributions presented in the study are included in the article/supplementary material, further inquiries can be directed to the corresponding authors.
Ethics statement
This study was conducted in accordance with the principles of the Declaration of Helsinki. Ethical approval and a waiver of informed consent were obtained from the Ethics Committee of Zhongshan Hospital Affiliated to Xiamen University. Written informed consent was not obtained from the individual(s) for the publication of any potentially identifiable images or data included in this article because identifiable personal information, such as names of the enrolled patients and name of hospital, was removed. This study was approved by the Ethics Committees of Zhongshan Hospital of Xiamen University.
Author contributions
ZL: Investigation, Writing – review & editing, Conceptualization, Writing – original draft, Visualization, Formal analysis, Resources, Validation. LZ: Data curation, Writing – original draft, Methodology, Formal analysis, Investigation. ZZ: Validation, Investigation, Resources, Funding acquisition, Writing – original draft. WQ: Resources, Investigation, Writing – original draft, Funding acquisition. JZ: Writing – original draft, Resources, Investigation. FL: Writing – original draft, Resources, Investigation. ML: Investigation, Writing – original draft, Resources. RG: Resources, Writing – original draft, Investigation. QG: Investigation, Writing – original draft, Resources. HX: Writing – original draft, Validation, Investigation, Resources. SL: Supervision, Writing – original draft, Investigation, Conceptualization, Project administration. HZ: Validation, Conceptualization, Supervision, Writing – original draft. HL: Conceptualization, Investigation, Funding acquisition, Supervision, Writing – original draft, Writing – review & editing.
Funding
The author(s) declared that financial support was received for this work and/or its publication. This study was sponsored by Fujian Provincial Health Technology Project (No. 2021CXB023 to HL), Natural Science Foundation of Fujian Province of China (Nos. 2021J011332 to WQ and 2022J0113440 to ZZ).
Acknowledgments
The authors thank Editage (www.editage.cn) for providing English language editing services.
Conflict of interest
The author(s) declared that this work was conducted in the absence of any commercial or financial relationships that could be construed as a potential conflict of interest.
Generative AI statement
The author(s) declared that Generative AI was not used in the creation of this manuscript.
Any alternative text (alt text) provided alongside figures in this article has been generated by Frontiers with the support of artificial intelligence and reasonable efforts have been made to ensure accuracy, including review by the authors wherever possible. If you identify any issues, please contact us.
Publisher’s note
All claims expressed in this article are solely those of the authors and do not necessarily represent those of their affiliated organizations, or those of the publisher, the editors and the reviewers. Any product that may be evaluated in this article, or claim that may be made by its manufacturer, is not guaranteed or endorsed by the publisher.
Abbreviations
EC, Esophageal cancer; NAT, Neoadjuvant therapy; TRG, Tumor regression grade; WSI, Whole-slide images; MIL, Multiple instance learning; VRTCs, Viable residual tumor cells; OS, Overall survival; PFS, Progression-free survival; H&E, Hematoxylin and eosin; AUC, Area under the receiver operating characteristic curve; ABMIL, Attention-based multiple instance learning; ACMIL, Adaptive cross-instance multiple instance learning; CLAM, Clustering-constrained attention multiple instance learning; CI, Confidence interval; HR, Hazard ratio.
References
1.
Obermannová R Alsina M Cervantes A Leong T Lordick F Nilsson M et al . Oesophageal cancer: ESMO clinical practice guideline for diagnosis, treatment and follow-up. Ann Oncol. (2022) 33:992–1004. doi: 10.1016/j.annonc.2022.07.003,
2.
Yang G Su X Yang H Luo G Gao C Zheng Y et al . Neoadjuvant programmed death-1 blockade plus chemotherapy in locally advanced esophageal squamous cell carcinoma. Ann Transl Med. (2021) 9:1254. doi: 10.21037/atm-21-3352,
3.
Wu Z Zheng Q Chen H Xiang J Hu H Li H et al . Efficacy and safety of neoadjuvant chemotherapy and immunotherapy in locally resectable advanced esophageal squamous cell carcinoma. J Thorac Dis. (2021) 13:3518–28. doi: 10.21037/jtd-21-340,
4.
Muro K Kojima T Moriwaki T Kato K Nagashima F Kawakami H et al . Second-line pembrolizumab versus chemotherapy in Japanese patients with advanced esophageal cancer: subgroup analysis from KEYNOTE-181. Esophagus. (2022) 19:137–45. doi: 10.1007/s10388-021-00877-3,
5.
Bolger JC Donohoe CL Lowery M Reynolds JV . Advances in the curative management of oesophageal cancer. Br J Cancer. (2022) 126:706–17. doi: 10.1038/s41416-021-01485-9,
6.
Qin J Xue L Hao A Guo X Jiang T Ni Y et al . Neoadjuvant chemotherapy with or without camrelizumab in resectable esophageal squamous cell carcinoma: the randomized phase 3 escort-NEO/NCCES01 trial. Nat Med. (2024) 30:2549–57. doi: 10.1038/s41591-024-03064-w,
7.
van Hagen P Hulshof MC van Lanschot JJB Steyerberg EW van Berge Henegouwen MI Wijnhoven BP et al . Preoperative chemoradiotherapy for esophageal or junctional cancer. N Engl J Med. (2012) 366:2074–84. doi: 10.1056/NEJMoa1112088
8.
Burgart LJ Chopp WV Jain D . (2022). Protocol for the examination of specimens from patients with carcinoma of the esophagus. Available online at: https://www.scribd.com/document/733338659/Esophagus-4-2-0-1-REL-CAPCP. (Accessed March 20, 2023)
9.
Lerttanatum N Tharavej C Chongpison Y Sanpavat A . Comparison of tumor regression grading system in locally advanced esophageal squamous cell carcinoma after preoperative radio-chemotherapy to determine the most accurate system predicting prognosis. J Gastrointest Oncol. (2019) 10:276–82. doi: 10.21037/jgo.2018.12.01,
10.
Xu L Wei XF Li CJ Yang ZY Yu YK Li HM et al . Pathologic responses and surgical outcomes after neoadjuvant immunochemotherapy versus neoadjuvant chemoradiotherapy in patients with locally advanced esophageal squamous cell carcinoma. Front Immunol. (2022) 13:1052542. doi: 10.3389/fimmu.2022.1052542,
11.
Kleppe A Skrede OJ De Raedt S Liestøl K Kerr DJ Danielsen HE . Designing deep learning studies in cancer diagnostics. Nat Rev Cancer. (2021) 21:199–211. doi: 10.1038/s41568-020-00327-9,
12.
Chen CL Chen CC Yu WH Chen SH Chang YC Hsu TI et al . An annotation-free whole-slide training approach to pathological classification of lung cancer types using deep learning. Nat Commun. (2021) 12:1193. doi: 10.1038/s41467-021-21467-y,
13.
Wang L Pan L Wang H Liu M Feng Z Rong P et al . DHUnet: dual-branch hierarchical global–local fusion network for whole slide image segmentation. Biomed Signal Process Control. (2023) 85:104976. doi: 10.1016/j.bspc.2023.104976
14.
Theocharopoulos C Davakis S Ziogas DC Theocharopoulos A Foteinou D Mylonakis A et al . Deep learning for image analysis in the diagnosis and management of esophageal cancer. Cancer. (2024) 16:3285. doi: 10.3390/cancers16193285,
15.
Diao S Luo W Hou J Lambo R Al-Kuhali HA Zhao H et al . Deep multi-magnification similarity learning for histopathological image classification. IEEE J Biomed Health Inform. (2023) 27:1535–45. doi: 10.1109/JBHI.2023.3237137,
16.
Abboretti F Mantziari S Didisheim L Schäfer M Teixeira Farinha H . Prognostic value of tumor regression grade (TRG) after oncological gastrectomy for gastric cancer. Langenbecks Arch Surg. (2024) 409:199. doi: 10.1007/s00423-024-03388-8,
17.
Tolkach Y Wolgast LM Damanakis A Pryalukhin A Schallenberg S Hulla W et al . Artificial intelligence for tumour tissue detection and histological regression grading in oesophageal adenocarcinomas: a retrospective algorithm development and validation study. Lancet Digit Health. (2023) 5:e265–75. doi: 10.1016/S2589-7500(23)00027-4,
18.
Wang Y Zhang W Chen L Xie J Zheng X Jin Y et al . Development of an interpretable deep learning model for pathological tumor response assessment after neoadjuvant therapy. Biol Proced Online. (2024) 26:10. doi: 10.1186/s12575-024-00234-5,
19.
Waqas M Ahmed SU Tahir MA Wu J Qureshi R . Exploring multiple instance learning (MIL): a brief survey. Expert Syst Appl. (2024) 250:123893. doi: 10.1016/j.eswa.2024.123893
20.
Lu MY Williamson DFK Chen TY Chen RJ Barbieri M Mahmood F . Data-efficient and weakly supervised computational pathology on whole-slide images. Nat Biomed Eng. (2021) 5:555–70. doi: 10.1038/s41551-020-00682-w,
21.
Zhang Y Li H Sun Y Zheng S Zhu C Yang L . Attention-challenging multiple instance learning for whole slide image classification In: LeonardisARicciERothSRussakovskyOSattlerTVarolG, editors. Computer vision—ECCV 2024. Lecture notes in computer science. Cham: Springer (2025). 125–43.
22.
Gao C Sun Q Zhu W Zhang L Zhang J Liu B . Transformer based multiple instance learning for WSI breast cancer classification. Biomed Signal Process Control. (2024) 89:105755. doi: 10.1016/j.bspc.2023.105755
23.
Wang X Zhao J Marostica E Yuan W Jin J Zhang J et al . A pathology foundation model for cancer diagnosis and prognosis prediction. Nature. (2024) 634:970–8. doi: 10.1038/s41586-024-07894-z,
24.
Xu H Usuyama N Bagga J Zhang S Rao R Naumann T et al . A whole-slide foundation model for digital pathology from real-world data. Nature. (2024) 630:181–8. doi: 10.1038/s41586-024-07441-w,
25.
Ding T Wagner SJ Song AH Chen RJ Lu MY Zhang A et al . (2024) Multimodal whole slide foundation model for pathology. arXiv. Available online at: https://doi.org/10.48550/arXiv.2411.19666. [Epub ahead of preprint]
26.
Sudo N Ichikawa H Muneoka Y Hanyu T Kano Y Ishikawa T et al . Clinical utility of ypTNM stage grouping in the 8th edition of the American Joint Committee on Cancer TNM staging system for esophageal squamous cell carcinoma. Ann Surg Oncol. (2021) 28:650–60. doi: 10.1245/s10434-020-09181-3,
27.
Waqas M Bandyopadhyay R Showkatian E Muneer A Zafar A Alvarez FR et al . (2025). The next layer: augmenting foundation models with structure-preserving and attention-guided learning for local patches to global context awareness in computational pathology. arXiv. Available online at: https://doi.org/10.48550/arXiv.2508.19914. [Epub ahead of preprint]
28.
Li X Ren X Venugopal R . Entropy measures for quantifying complexity in digital pathology and spatial omics. iScience. (2025) 28:112765. doi: 10.1016/j.isci.2025.112765,
29.
Li X . Deciphering cell to cell spatial relationship for pathology images using SpatialQPFs. Sci Rep. (2024) 14:29585. doi: 10.1038/s41598-024-81383-1,
Summary
Keywords
artificial intelligence, multiple instance learning, neoadjuvant therapy, pathology foundation model, tumor regression grade
Citation
Liu Z, Zhao L, Zhao Z, Qin W, Zhong J, Lin F, Lu M, Guo R, Guo Q, Xu H, Li S, Zheng H and Lu H (2026) Automated tumor regression grade assessment and survival prediction in esophageal cancer via weakly supervised multiple instance learning. Front. Med. 13:1751768. doi: 10.3389/fmed.2026.1751768
Received
22 November 2025
Revised
07 January 2026
Accepted
13 January 2026
Published
02 February 2026
Volume
13 - 2026
Edited by
Shuoyu Xu, Bio-totem Pte Ltd., China
Reviewed by
Xiao Li, Roche Diagnostics, United States
Muhammad Waqas, The University of Texas MD Anderson Cancer Center, United States
Updates
Copyright
© 2026 Liu, Zhao, Zhao, Qin, Zhong, Lin, Lu, Guo, Guo, Xu, Li, Zheng and Lu.
This is an open-access article distributed under the terms of the Creative Commons Attribution License (CC BY). The use, distribution or reproduction in other forums is permitted, provided the original author(s) and the copyright owner(s) are credited and that the original publication in this journal is cited, in accordance with accepted academic practice. No use, distribution or reproduction is permitted which does not comply with these terms.
*Correspondence: Shouguo Li, xmliyx@126.com; Hao Zheng, pojunayfy@gmail.com; Haijie Lu, luhaijie@xmu.edu.cn
†These authors have contributed equally to this work
Disclaimer
All claims expressed in this article are solely those of the authors and do not necessarily represent those of their affiliated organizations, or those of the publisher, the editors and the reviewers. Any product that may be evaluated in this article or claim that may be made by its manufacturer is not guaranteed or endorsed by the publisher.