Abstract
Introduction:
This study aimed to develop and validate a novel prediction model for in-hospital mortality among patients with cirrhosis and sepsis admitted to the intensive care unit (ICU).
Methods:
Data were obtained from three multicentre databases: the Medical Information Mart for Intensive Care IV (MIMIC-IV v3.1), the eICU Collaborative Research Database (eICU-CRD v2.0), and the Shenzhen People's Hospital ICU (SZPH-ICU). The MIMIC-IV cohort was chronologically divided into a training set (2008–2016) and a temporal validation set (2017–2022), whereas the eICU-CRD and SZPH-ICU cohorts were used for external validation. Variable selection was performed using the least absolute shrinkage and selection operator (LASSO) regression. A multivariable logistic regression model was constructed and visualized as a nomogram. Model performance was assessed using the area under the receiver operating characteristic curve (AUROC), Brier score, calibration plots, and decision curve analysis. A web-based calculator was developed to facilitate clinical implementation.
Results:
A total of 2,052 adult ICU patients with cirrhosis and sepsis from the MIMIC-IV database were included. The training cohort (2008–2016; n = 1,328) had a 24.0% in-hospital mortality rate, whereas the temporal validation cohort (2017–2022; n = 724) had a 35.9% in-hospital mortality rate. In the external validation cohorts, in-hospital mortality was 25.9% in the eICU-CRD (n = 657) and 38.2% in the SZPH-ICU (n = 131). The final model comprised 13 predictors: age, respiratory rate, body temperature, oxygen saturation, heart rate, total bilirubin, lactate, creatinine, white blood cell count, international normalized ratio (INR), vasopressor use, urine output, and the Glasgow Coma Scale (GCS) score. The model achieved an AUROC of 0.822 (95% confidence interval [CI]: 0.797–0.847) in the training cohort and 0.810 (95% CI: 0.777–0.843) in the temporal validation cohort. External validation yielded AUROCs of 0.777 (95% CI: 0.734–0.821) in the eICU-CRD cohort and 0.763 (95% CI: 0.680–0.846) in the SZPH-ICU cohort. The proposed model demonstrated superior discriminative performance compared with existing prognostic scores.
Conclusions:
This validated multivariable prediction model accurately estimates in-hospital mortality in ICU patients with cirrhosis and sepsis, supporting early risk stratification and more efficient allocation of clinical resources.
Introduction
Cirrhosis, the terminal stage of multiple chronic liver diseases, represents a major global public health burden owing to its high morbidity and mortality (1–3). Patients with cirrhosis are particularly susceptible to infections and subsequent sepsis as a result of intrinsic immune dysfunction, impaired intestinal barrier integrity, and systemic inflammation (4, 5). Sepsis is not only a frequent and severe complication in this patient population but also a leading cause of admission to the intensive care unit (ICU) (6–8). The concurrence of cirrhosis and sepsis initiates a vicious cycle that exacerbates multi-organ failure and significantly increases mortality risk (9–11). Notably, septic shock in patients with cirrhosis is associated with in-hospital mortality rates of up to 70% (12). Accordingly, early and accurate identification of high-risk patients is crucial for improving clinical outcomes and optimizing healthcare resource utilization.
In clinical practice, several scoring systems are used to estimate prognosis in critically ill patients. These systems encompass general ICU scores such as the Sequential Organ Failure Assessment (SOFA) and Simplified Acute Physiology Score II, as well as liver-specific models such as the Model for End-Stage Liver Disease (MELD) and Child-Pugh score (13–16). However, general scoring systems often fail to capture the pathophysiological complexity of cirrhosis, whereas liver-specific scores may not comprehensively reflect sepsis-induced systemic organ dysfunction. Consequently, their prognostic performance in cirrhotic patients with sepsis remains suboptimal. For example, SOFA and MELD-Na scores have demonstrated area under the receiver operating characteristic curve (AUROC) values of only 0.684 and 0.672, respectively (17). Recently, efforts have been made to develop more tailored predictive tools. Lin et al. developed a nomogram based on the MIMIC-IV database that achieved an AUROC of 0.827, outperforming SOFA and MELD-Na (17). Similarly, the LIVERAID-ICU score, proposed by Hoppmann et al. (18) integrates the Child-Pugh score, serum urea, and respiratory parameters to predict outcomes in cirrhotic patients with infections in the ICU, demonstrating an AUROC of 0.830 and superior performance compared with SOFA and MELD. Despite these advances, many existing models are often limited by single-center data, modest sample sizes, and insufficient external validation, which restricts their generalizability.
Therefore, this study aimed to develop and validate a novel, clinically practical, multivariable prediction model for in-hospital mortality among ICU patients with cirrhosis and sepsis. By incorporating readily available and objective parameters, we seek to provide a robust and reliable tool for early risk stratification and informed clinical decision-making in this high-risk population.
Materials and methods
Study design and data sources
This multicentre retrospective cohort study integrated data from three ICU databases: the Medical Information Mart for Intensive Care IV (MIMIC-IV v3.1), the eICU Collaborative Research Database (eICU-CRD v2.0), and the Shenzhen People's Hospital ICU (SZPH-ICU; a tertiary academic medical centre in China). The MIMIC-IV database contains data on over 90,000 ICU admissions at Beth Israel Deaconess Medical Centre, Boston, Massachusetts, USA, between 2008 and 2022 (19). The eICU-CRD is a multicentre database comprising over 200,000 ICU admissions from 208 hospitals across the United States between 2014 and 2015 (20). The SZPH-ICU database includes over 8,000 ICU admissions recorded between 2014 and 2023. All databases provided demographic characteristics, vital signs, treatment measures, nursing records, and laboratory data. The MIMIC-IV database was fully anonymized, with no personally identifiable information retained, and ethical approval was obtained from the Institutional Review Boards (IRBs) of Beth Israel Deaconess Medical Centre and the Massachusetts Institute of Technology. The eICU-CRD is a publicly available, de-identified database (HIPAA certification number 1031219-2) and was exempt from IRB review. The use of the SZPH-ICU dataset was approved by the local ethics committee (approval number: LL-KY-2025288-01), and the requirement for informed consent was waived because of the retrospective study design. This study strictly adhered to the Transparent Reporting of a Multivariable Prediction Model for Individual Prognosis or Diagnosis guidelines (21).
Study population
Patients with cirrhosis who met the Sepsis-3 criteria on the first day of ICU admission were included. Cirrhosis was identified using International Classification of Diseases (ICD-9 or ICD-10) codes from patient discharge records (Supplementary Table 1). Patients aged < 18 years or with an ICU stay of < 24 h were excluded. For patients with multiple ICU admissions, only data from the first admission were included.
Primary outcome
The primary outcome was all-cause in-hospital mortality. Out-of-hospital follow-up data were unavailable in both the eICU-CRD and SZPH-ICU databases, and only 28-day mortality was available in the MIMIC-IV database.
Variable selection and data extraction
Based on prior literature and data availability, 25 candidate variables were prespecified (13–18). These included demographic characteristics (age, sex, and body mass index); vital signs (mean arterial pressure, respiratory rate, body temperature, oxygen saturation, and heart rate); laboratory parameters [total bilirubin, albumin, lactate, creatinine, white blood cell count, sodium, and international normalized ratio (INR)]; clinical interventions (renal replacement therapy, vasopressor use, and invasive mechanical ventilation); emergency admission status; and cirrhosis-related complications (ascites, hepatic encephalopathy, viral hepatitis, and alcohol abuse). The Glasgow Coma Scale (GCS) score and urine output were also included. All variables were extracted from the first 24 h following ICU admission. Vital signs were averaged over this period, and laboratory values were recorded as the most extreme values reflecting disease severity (e.g., maximum or minimum values).
Data preprocessing and missing data imputation
For continuous variables (e.g., laboratory measurements and vital signs), outliers were defined as values below the first percentile or above the 99th percentile and were winsorized to the corresponding percentile thresholds. Missing values were imputed using multiple imputation via the “missForest” package in R, which implements a random forest-based algorithm (22).
Model development and validation
The MIMIC-IV cohort was chronologically divided into a training set (2008–2016) and a temporal validation set (2017–2022). External validation was performed using the eICU-CRD and SZPH-ICU cohorts. Variable selection was conducted exclusively in the MIMIC-IV training set. To simplify the model and enhance its applicability, least absolute shrinkage and selection operator (LASSO) regression with 10-fold cross-validation was applied to identify the most predictive variables. A multivariable logistic regression model was then constructed using the LASSO-selected variables and subsequently transformed into a nomogram for clinical use. Model performance was evaluated using AUROC values, the Brier score, calibration curves, and decision curve analysis. To convert the model's predicted probabilities into binary outcomes (high vs. low risk), the optimal probability threshold was determined using the Youden index. The Youden index (J = sensitivity + specificity – 1) identifies the point on the ROC curve that maximizes the combined sensitivity and specificity, thereby providing an optimal balance (23). A web-based risk calculator was developed to facilitate bedside application.
Comparison with existing scoring systems
The discriminatory performance of the proposed model was compared, using AUROC values, with the following established scoring systems: MELD, MELD-Na, SOFA, Albumin-Bilirubin (ALBI) score, Child-Pugh score, Chronic Liver Failure–Organ Failure (CLIF-OF) score, CLIF Consortium Acute-on-Chronic Liver Failure (CLIF-C ACLF) score, and CLIF-SOFA score (24–26). DeLong tests were used to compare the AUROC values between the different scoring systems. To further quantify the improvement in risk stratification capability of the new model compared to the traditional scoring systems, net reclassification improvement (NRI) was calculated (27).
Statistical analysis
Categorical variables are presented as frequencies (percentages), and continuous variables as medians (interquartile ranges). Group comparisons were conducted using the chi-square test for categorical variables and the t-test or Mann–Whitney U-test for continuous variables, as appropriate. All analyses were conducted using R software (version 4.4.0). A two-sided p-value < 0.05 was considered statistically significant.
Results
Non-survivors presented with worse clinical profiles and higher severity scores
A total of 2,052 adult ICU patients with cirrhosis or sepsis from the MIMIC-IV database were included in the analysis (Figure 1). The cohort was divided into a training set (2008–2016; n = 1,328) and a temporal validation set (2017–2022; n = 724). The overall median age was 60.0 years [interquartile range (IQR): 53.0–67.0 years], and 65.1% of patients were men. In the training set, 319 deaths were recorded, corresponding to an in-hospital mortality rate of 24.0%, whereas the temporal validation set comprised 260 deaths (mortality rate: 35.9%).
Figure 1
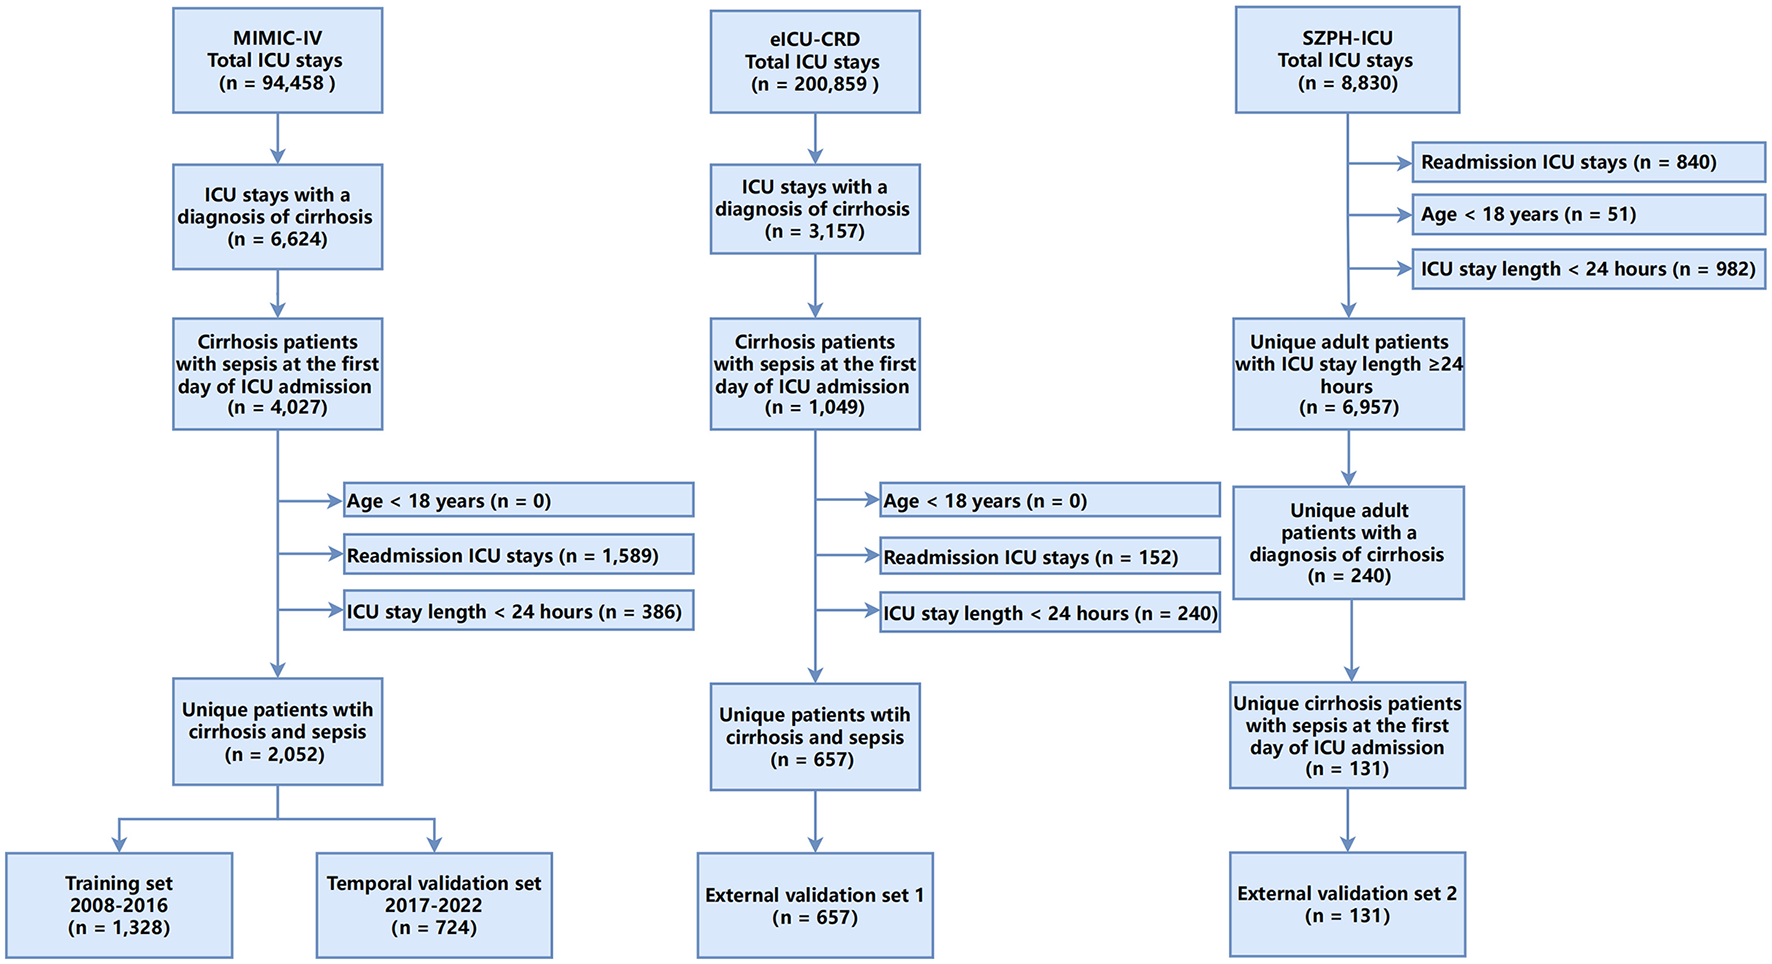
Flowchart of the study.
As Table 1 shows, patients who died during hospitalization exhibited significantly worse clinical indicators and higher disease severity scores than survivors in the training set. Non-survivors demonstrated greater haemodynamic instability, reflected by lower mean arterial pressure and higher heart rate. Respiratory impairment was also more pronounced among non-survivors, with elevated respiratory rates and reduced peripheral oxygen saturation. Laboratory indices indicated more severe hepatic and renal dysfunction as well as heightened systemic inflammation among non-survivors, including significantly higher levels of total bilirubin, lactate, creatinine, white blood cell counts, and INR, along with a higher proportion of patients with 24 h urine output < 400 ml. Therapeutic interventions, such as renal replacement therapy, vasopressor use, and invasive mechanical ventilation, were significantly more frequent in the non-survivor group. Similar patterns were observed in the temporal validation set (Table 1). In the eICU-CRD external validation cohort (n = 657), 170 deaths occurred (mortality rate: 25.9%); the median age was 59 years, and 61.6% of patients were men. The SZPH-ICU validation cohort (n = 131; 74.8% men) had a median age of 61 years and included 50 deaths (mortality rate: 38.2%). In both external validation cohorts, non-survivors consistently exhibited more severe organ dysfunction and higher disease severity scores (Supplementary Tables 2, 3). These findings are consistent with clinical expectations, whereby greater physiological derangement and more advanced organ dysfunction are typically associated with an increased risk of mortality.
Table 1
| Variable | Training set | Temporal validation set | ||||||
|---|---|---|---|---|---|---|---|---|
| Overall ( n = 1,328) | Survival ( n = 1,009) | Death ( n = 319) | p -value | Overall ( n = 724) | Survival ( n = 464) | Death ( n = 260) | p -value | |
| Age, years | 60.0 [53.0, 67.0] | 60.0 [53.0, 67.0] | 60.0 [53.0, 70.0] | 0.171 | 58.0 [49.8, 65.0] | 58.0 [50.0, 65.0] | 59.5 [49.0, 66.0] | 0.288 |
| Sex, male | 865 (65.1) | 655 (64.9) | 210 (65.8) | 0.817 | 468 (64.6) | 316 (68.1) | 152 (58.5) | 0.012 |
| BMI, kg/m3 | 28.2 [24.4, 33.0] | 28.1 [24.4, 32.8] | 28.4 [24.8, 33.6] | 0.332 | 28.7 [24.4, 33.7] | 28.4 [24.1, 33.0] | 30.2 [24.7, 35.7] | 0.005 |
| Mean arterial pressure, mmHg | 73.0 [68.0, 81.0] | 74.0 [68.0, 82.0] | 71.0 [66.0, 77.0] | < 0.001 | 74.0 [70.0, 81.0] | 75.0 [71.0, 82.0] | 72.0 [67.0, 77.0] | < 0.001 |
| Heart rate, beats/min | 87.4 [75.9, 99.2] | 85.5 [75.2, 97.0] | 94.9 [80.5, 104.5] | < 0.001 | 89.7 [78.9, 101.3] | 86.8 [77.5, 99.0] | 92.7 [83.4, 104.8] | < 0.001 |
| Respiratory rate, breaths/min | 18.0 [16.0, 21.0] | 18.0 [16.0, 21.0] | 20.0 [17.0, 24.0] | < 0.001 | 19.0 [16.0, 22.0] | 18.0 [16.0, 21.0] | 20.0 [17.0, 23.2] | < 0.001 |
| Body temperature, °C | 36.8 [36.5, 37.1] | 36.8 [36.6, 37.1] | 36.7 [36.4, 36.9] | < 0.001 | 36.8 [36.6, 37.1] | 36.9 [36.7, 37.1] | 36.7 [36.5, 36.9] | < 0.001 |
| SpO2, % | 97.0 [96.0, 99.0] | 98.0 [96.0, 99.0] | 97.0 [95.0, 98.0] | < 0.001 | 97.0 [95.0, 99.0] | 97.0 [96.0, 99.0] | 96.0 [95.0, 98.0] | < 0.001 |
| Urine output < 400 ml | 205 (15.4) | 101 (10.0) | 104 (32.6) | < 0.001 | 186 (25.7) | 77 (16.6) | 109 (41.9) | < 0.001 |
| GCS score | 15.0 [14.0, 15.0] | 15.0 [14.0, 15.0] | 15.0 [13.0, 15.0] | 0.001 | 15.0 [13.0, 15.0] | 15.0 [14.0, 15.0] | 14.0 [12.0, 15.0] | < 0.001 |
| Total bilirubin, μmol/L | 54.7 [27.4, 116.3] | 47.9 [23.9, 92.3] | 99.2 [39.3, 208.6] | < 0.001 | 80.4 [34.2, 199.7] | 68.6 [27.4, 132.1] | 156.5 [56.4, 342.4] | < 0.001 |
| Albumin, g/L | 28.0 [25.0, 31.6] | 28.3 [25.0, 32.0] | 27.0 [23.0, 30.3] | < 0.001 | 28.0 [24.0, 31.9] | 28.0 [24.0, 31.0] | 27.8 [23.0, 32.8] | 0.853 |
| Lactate, mmol/L | 3.3 [2.3, 4.6] | 3.2 [2.3, 4.2] | 4.0 [2.7, 6.2] | < 0.001 | 4.0 [2.9, 5.6] | 3.8 [2.9, 5.2] | 4.6 [3.3, 6.4] | < 0.001 |
| Creatinine, μmol/L | 114.9 [79.6, 212.2] | 106.1 [70.7, 176.8] | 176.8 [106.1, 291.7] | < 0.001 | 150.3 [97.2, 256.4] | 132.6 [79.6, 214.4] | 194.5 [130.4, 329.3] | < 0.001 |
| WBC, × 109/L | 11.4 [7.7, 17.1] | 10.9 [7.5, 16.2] | 13.0 [9.1, 20.3] | < 0.001 | 14.8 [9.9, 20.9] | 14.1 [9.2, 19.6] | 16.4 [12.1, 23.3] | < 0.001 |
| Sodium, mmol/L | 136.0 [131.0, 139.0] | 136.0 [132.0, 139.0] | 134.0 [129.0, 138.0] | < 0.001 | 135.0 [130.0, 139.0] | 135.0 [130.0, 138.0] | 134.0 [130.0, 140.0] | 0.825 |
| International normalized ratio | 1.8 [1.4, 2.3] | 1.7 [1.4, 2.1] | 2.1 [1.7, 3.0] | < 0.001 | 2.1 [1.6, 2.7] | 1.9 [1.5, 2.5] | 2.4 [2.0, 3.3] | < 0.001 |
| RRT | 120 (9.0) | 78 (7.7) | 42 (13.2) | 0.005 | 131 (18.1) | 54 (11.6) | 77 (29.6) | < 0.001 |
| Vasopressor | 629 (47.4) | 405 (40.1) | 224 (70.2) | < 0.001 | 344 (47.5) | 177 (38.1) | 167 (64.2) | < 0.001 |
| IMV | 1,101 (82.9) | 818 (81.1) | 283 (88.7) | 0.002 | 584 (80.7) | 360 (77.6) | 224 (86.2) | 0.007 |
| Presence of ascites | 615 (46.3) | 434 (43.0) | 181 (56.7) | < 0.001 | 449 (62.0) | 273 (58.8) | 176 (67.7) | 0.023 |
| Hepatic encephalopathy | 236 (17.8) | 172 (17.0) | 64 (20.1) | 0.252 | 105 (14.5) | 70 (15.1) | 35 (13.5) | 0.627 |
| Viral hepatitis history | 475 (35.8) | 369 (36.6) | 106 (33.2) | 0.308 | 118 (16.3) | 87 (18.8) | 31 (11.9) | 0.023 |
| Alcohol abuse history | 750 (56.5) | 557 (55.2) | 193 (60.5) | 0.11 | 497 (68.6) | 313 (67.5) | 184 (70.8) | 0.402 |
| Emergency admission | 1,158 (87.2) | 875 (86.7) | 283 (88.7) | 0.405 | 547 (75.6) | 332 (71.6) | 215 (82.7) | 0.001 |
| MELD | 21.0 [15.0, 29.0] | 20.0 [14.0, 26.0] | 29.0 [22.0, 35.0] | < 0.001 | 26.0 [19.0, 35.0] | 23.0 [17.0, 30.0] | 33.5 [25.0, 40.0] | < 0.001 |
| MELD-Na | 23.7 [16.6, 30.8] | 21.1 [15.0, 28.0] | 30.9 [24.1, 36.2] | < 0.001 | 28.5 [21.0, 35.6] | 25.3 [18.7, 32.0] | 34.0 [27.4, 40.0] | < 0.001 |
| SOFA | 8.0 [6.0, 11.0] | 8.0 [5.0, 10.0] | 11.0 [8.0, 14.0] | < 0.001 | 10.0 [7.0, 13.0] | 9.0 [6.0, 11.0] | 12.0 [9.0, 15.0] | < 0.001 |
| Albumin-bilirubin | −1.0 [−1.6, −0.3] | −1.1 [−1.7, −0.5] | −0.7 [−1.3, 0.0] | < 0.001 | −0.9 [−1.4, −0.3] | −1.0 [−1.5, −0.5] | −0.8 [−1.4, −0.1] | 0.001 |
| Child-Pugh | 9.0 [7.0, 11.0] | 8.0 [7.0, 10.0] | 10.0 [8.0, 11.0] | < 0.001 | 10.0 [8.0, 11.0] | 9.0 [7.0, 11.0] | 10.0 [9.0, 11.0] | < 0.001 |
| CLIF-OF | 10.0 [9.0, 12.0] | 10.0 [8.0, 11.0] | 12.0 [10.0, 14.0] | < 0.001 | 11.0 [9.0, 13.0] | 10.0 [9.0, 12.0] | 13.0 [11.0, 14.0] | < 0.001 |
| CLIF-C ACLF | 54.0 [47.0, 62.0] | 52.0 [45.0, 58.0] | 62.0 [55.0, 67.0] | < 0.001 | 56.0 [49.0, 63.0] | 53.0 [46.0, 59.0] | 63.0 [56.0, 68.0] | < 0.001 |
| CLIF-SOFA | 10.0 [7.0, 13.0] | 9.0 [7.0, 12.0] | 13.0 [10.0, 15.0] | < 0.001 | 10.0 [8.0, 14.0] | 9.0 [7.0, 12.0] | 13.0 [10.0, 15.0] | < 0.001 |
Patient characteristics in the training and temporal validation cohorts.
Values are detailed as N (%) or median [IQR].
Variable selection via LASSO regression identified 13 predictors for model construction
Variable selection was performed using LASSO regression in the training set to identify predictors most strongly associated with in-hospital mortality (Figure 2). The optimal regularization parameter (λ0.1se = 0.024) was determined via 10-fold cross-validation, yielding 13 variables with non-zero coefficients: age, respiratory rate, body temperature, oxygen saturation, heart rate, total bilirubin, lactate, creatinine, white blood cell count, INR, vasopressor use, urine output, and GCS score.
Figure 2
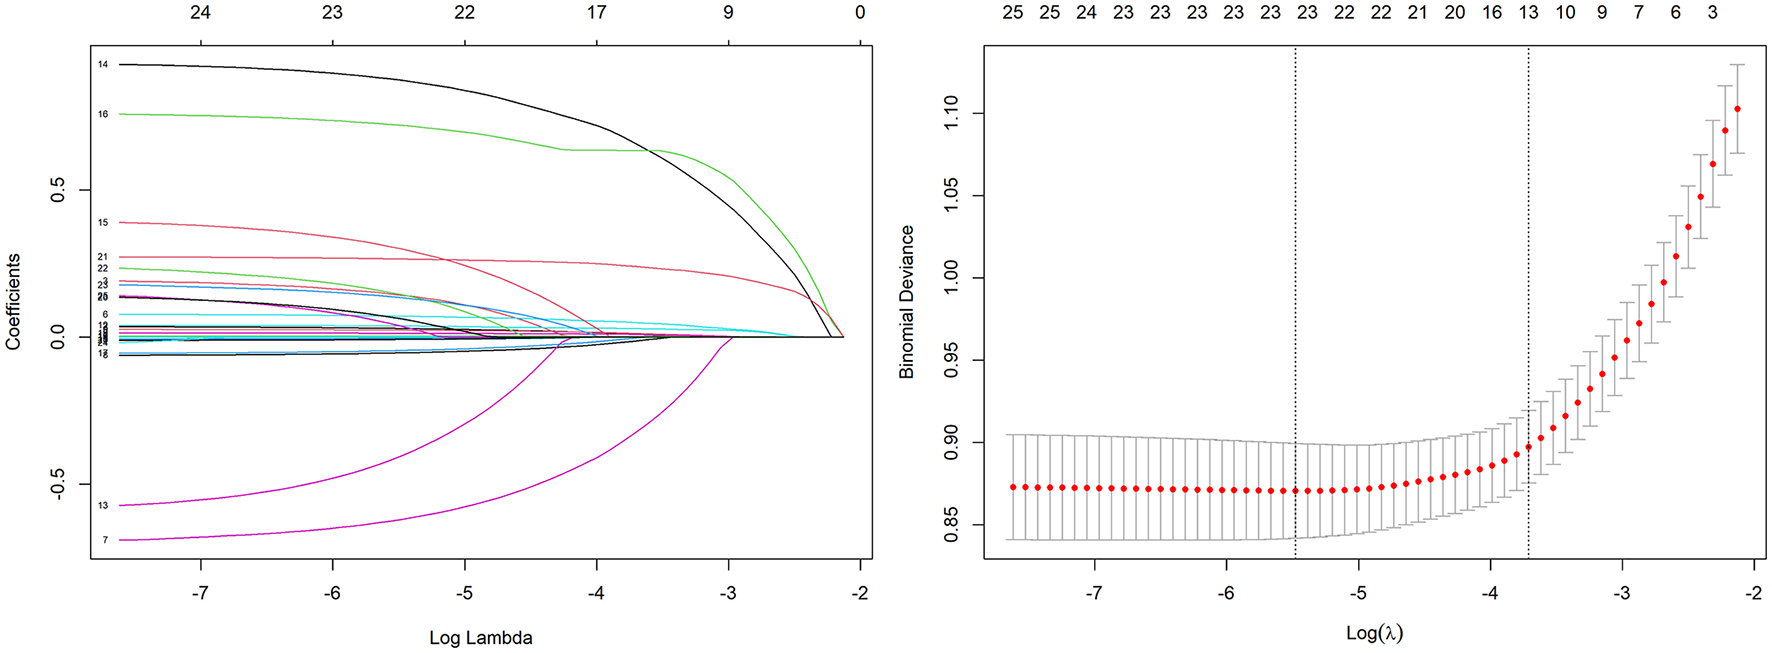
Variable selection using the LASSO regression with 10-fold cross-validation.
A multivariable prediction model was constructed and visualized as a nomogram
A multivariable logistic regression model was constructed using the 13 predictors identified by LASSO (coefficients presented in Table 2). For clinical applicability, the model was visualized as a nomogram (Figure 3). This nomogram serves as a graphical computational tool, enabling clinicians to assign scores to each variable (e.g., age, vital signs, laboratory values) according to an individual patient's characteristics. The scores are then summed to obtain a total score, which corresponds to the predicted probability of mortality on the total score axis. This approach visually quantifies the relative contribution of each predictor to mortality risk and facilitates rapid, individualized risk assessment.
Table 2
| Variable | Regression coefficient | Odds ratio (95% CI) | p-value |
|---|---|---|---|
| Intercept | 23.858 | – | – |
| Age | 0.034 | 1.035 (1.021–1.049) | < 0.001 |
| Respiratory rate | 0.077 | 1.080 (1.041–1.121) | < 0.001 |
| Body temperature | −0.713 | 0.490 (0.362–0.661) | < 0.001 |
| SpO2 | −0.066 | 0.936 (0.877–0.997) | 0.041 |
| Heart rate | 0.028 | 1.028 (1.018–1.039) | < 0.001 |
| Total bilirubin | 0.004 | 1.004 (1.003–1.006) | < 0.001 |
| Lactate | 0.036 | 1.037 (0.976–1.101) | 0.241 |
| Vasopressor | 0.971 | 2.640 (1.922–3.645) | < 0.001 |
| Urine output < 400 ml | 0.667 | 1.949 (1.284–2.959) | 0.002 |
| GCS score | −0.056 | 0.945 (0.899–0.996) | 0.031 |
| Creatinine | 0.001 | 1.001 (0.999–1.002) | 0.262 |
| WBC | 0.016 | 1.017 (0.998–1.036) | 0.085 |
| International normalized ratio | 0.292 | 1.339 (1.118–1.604) | 0.001 |
Multivariable logistic regression analysis of factors associated with in-hospital mortality in cirrhotic patients with sepsis, developed from LASSO-selected variables.
Figure 3
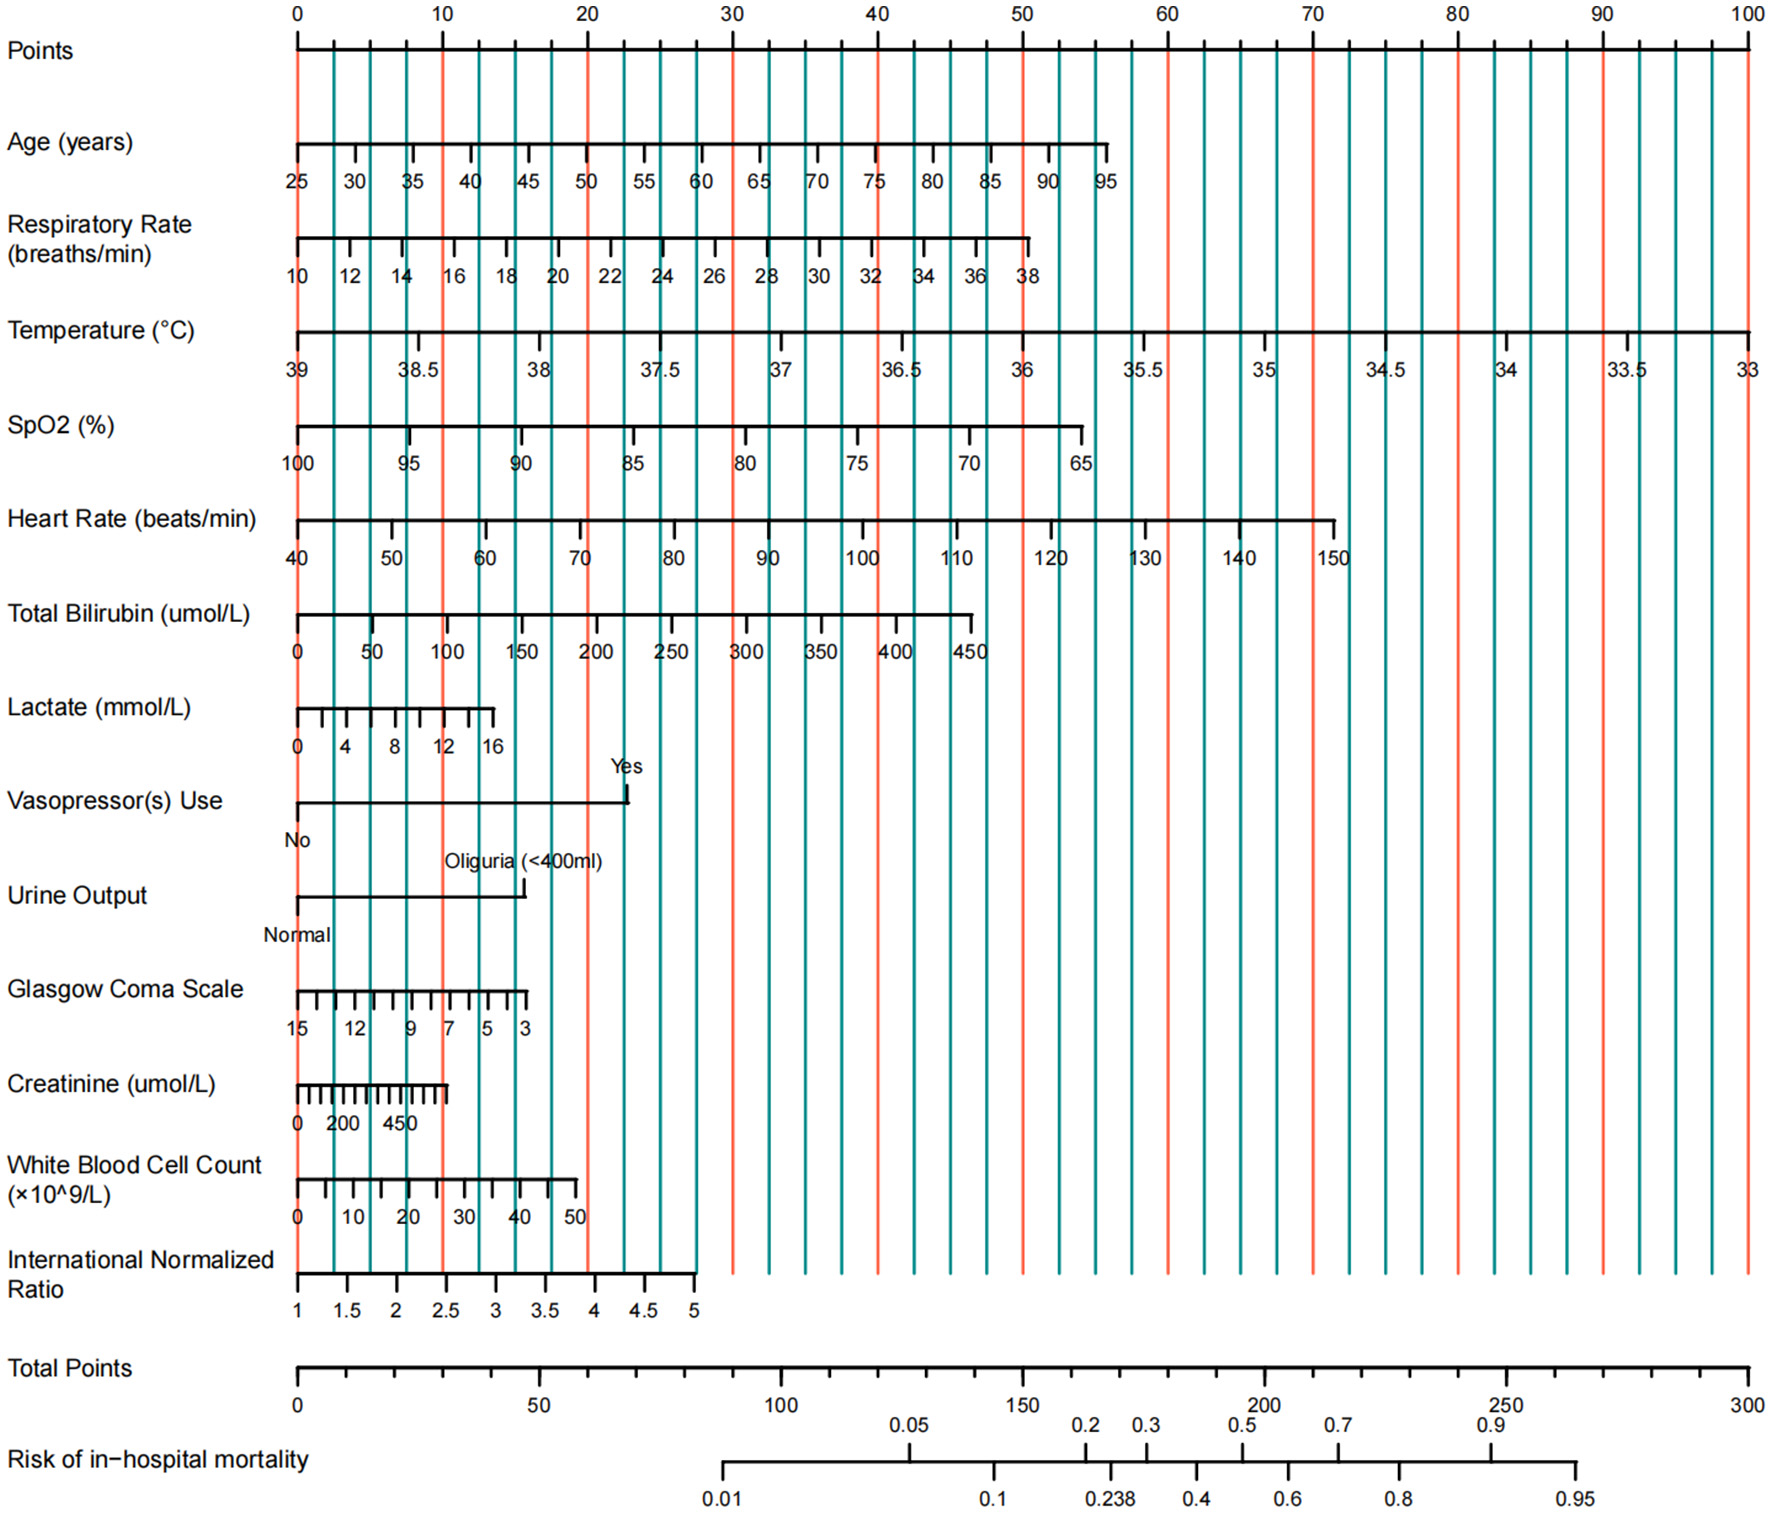
Nomogram for predicting in-hospital mortality in ICU patients with cirrhosis and sepsis.
The nomogram showed robust discriminative ability and calibration across all cohorts
The nomogram demonstrated strong predictive performance in both the training and validation cohorts (Table 3 and Figure 4). In the training set, an AUROC of 0.822 (95% CI: 0.797–0.847) and a Brier score of 0.135 indicated excellent discrimination and calibration. Despite differences in baseline characteristics between the temporal validation set and the training set (Table 1), performance remained stable in the temporal validation cohort (AUROC = 0.810, 95% CI: 0.777–0.843; Brier score = 0.169). External validation in the eICU-CRD cohort yielded an AUROC of 0.777 (95% CI: 0.734–0.821; Brier score = 0.150), while validation in the SZPH-ICU cohort yielded an AUROC of 0.763 (95% CI: 0.680–0.846; Brier score = 0.200). Figure 5 presents the calibration curves for all datasets, illustrating the concordance between the model's predicted probabilities and the actual observed mortality rates. Across all datasets, the calibration curves closely aligned with the diagonal line, signifying a high degree of calibration in the model's predictions. In the training dataset, the Youden index was computed across a range of probability thresholds. The maximum value (0.48), corresponding to a sensitivity of 73% and a specificity of 75%, was observed at a threshold of 0.238. This value was therefore selected as the optimal cut-off for distinguishing high-risk and low-risk patients.
Table 3
| Datasets | AUROC (95% CI) | Brier score |
|---|---|---|
| Training set | 0.822 (0.797–0.847) | 0.135 |
| Temporal validation set | 0.810 (0.777–0.843) | 0.169 |
| eICU-CRD validation set | 0.777 (0.734–0.821) | 0.150 |
| SZPH-ICU validation set | 0.763 (0.680–0.846) | 0.200 |
Performance of the nomogram in predicting in-hospital mortality in the training and validation sets.
Figure 4
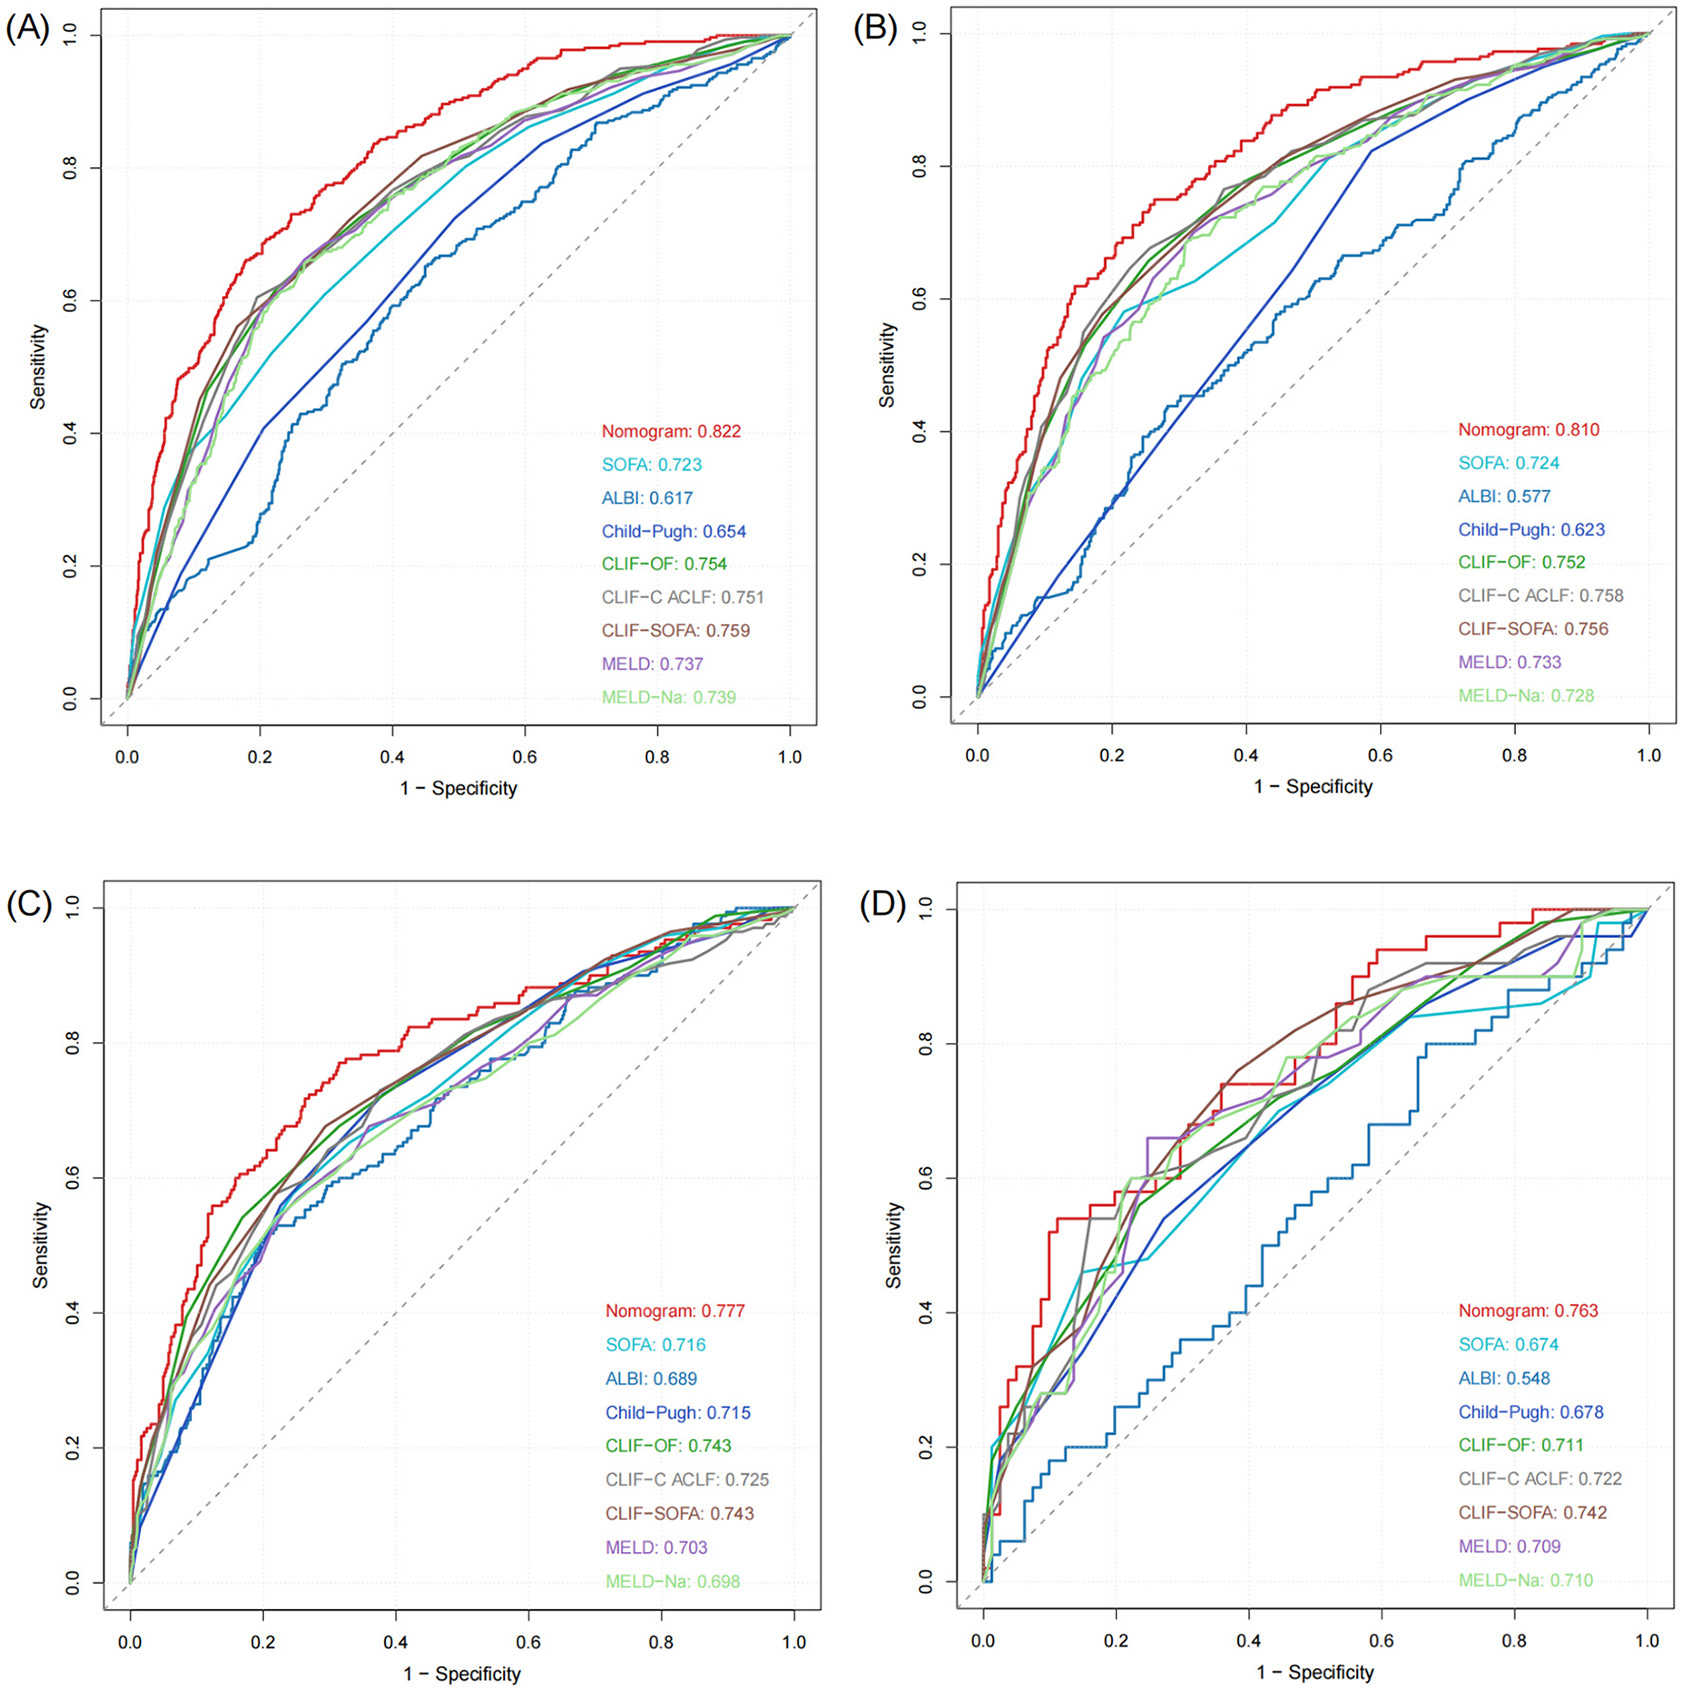
ROC curves of the model in the training and validation sets. (A) Training set. (B) Temporal validation set. (C) External validation set (eICU-CRD). (D) External validation set (SZPH-ICU).
Figure 5
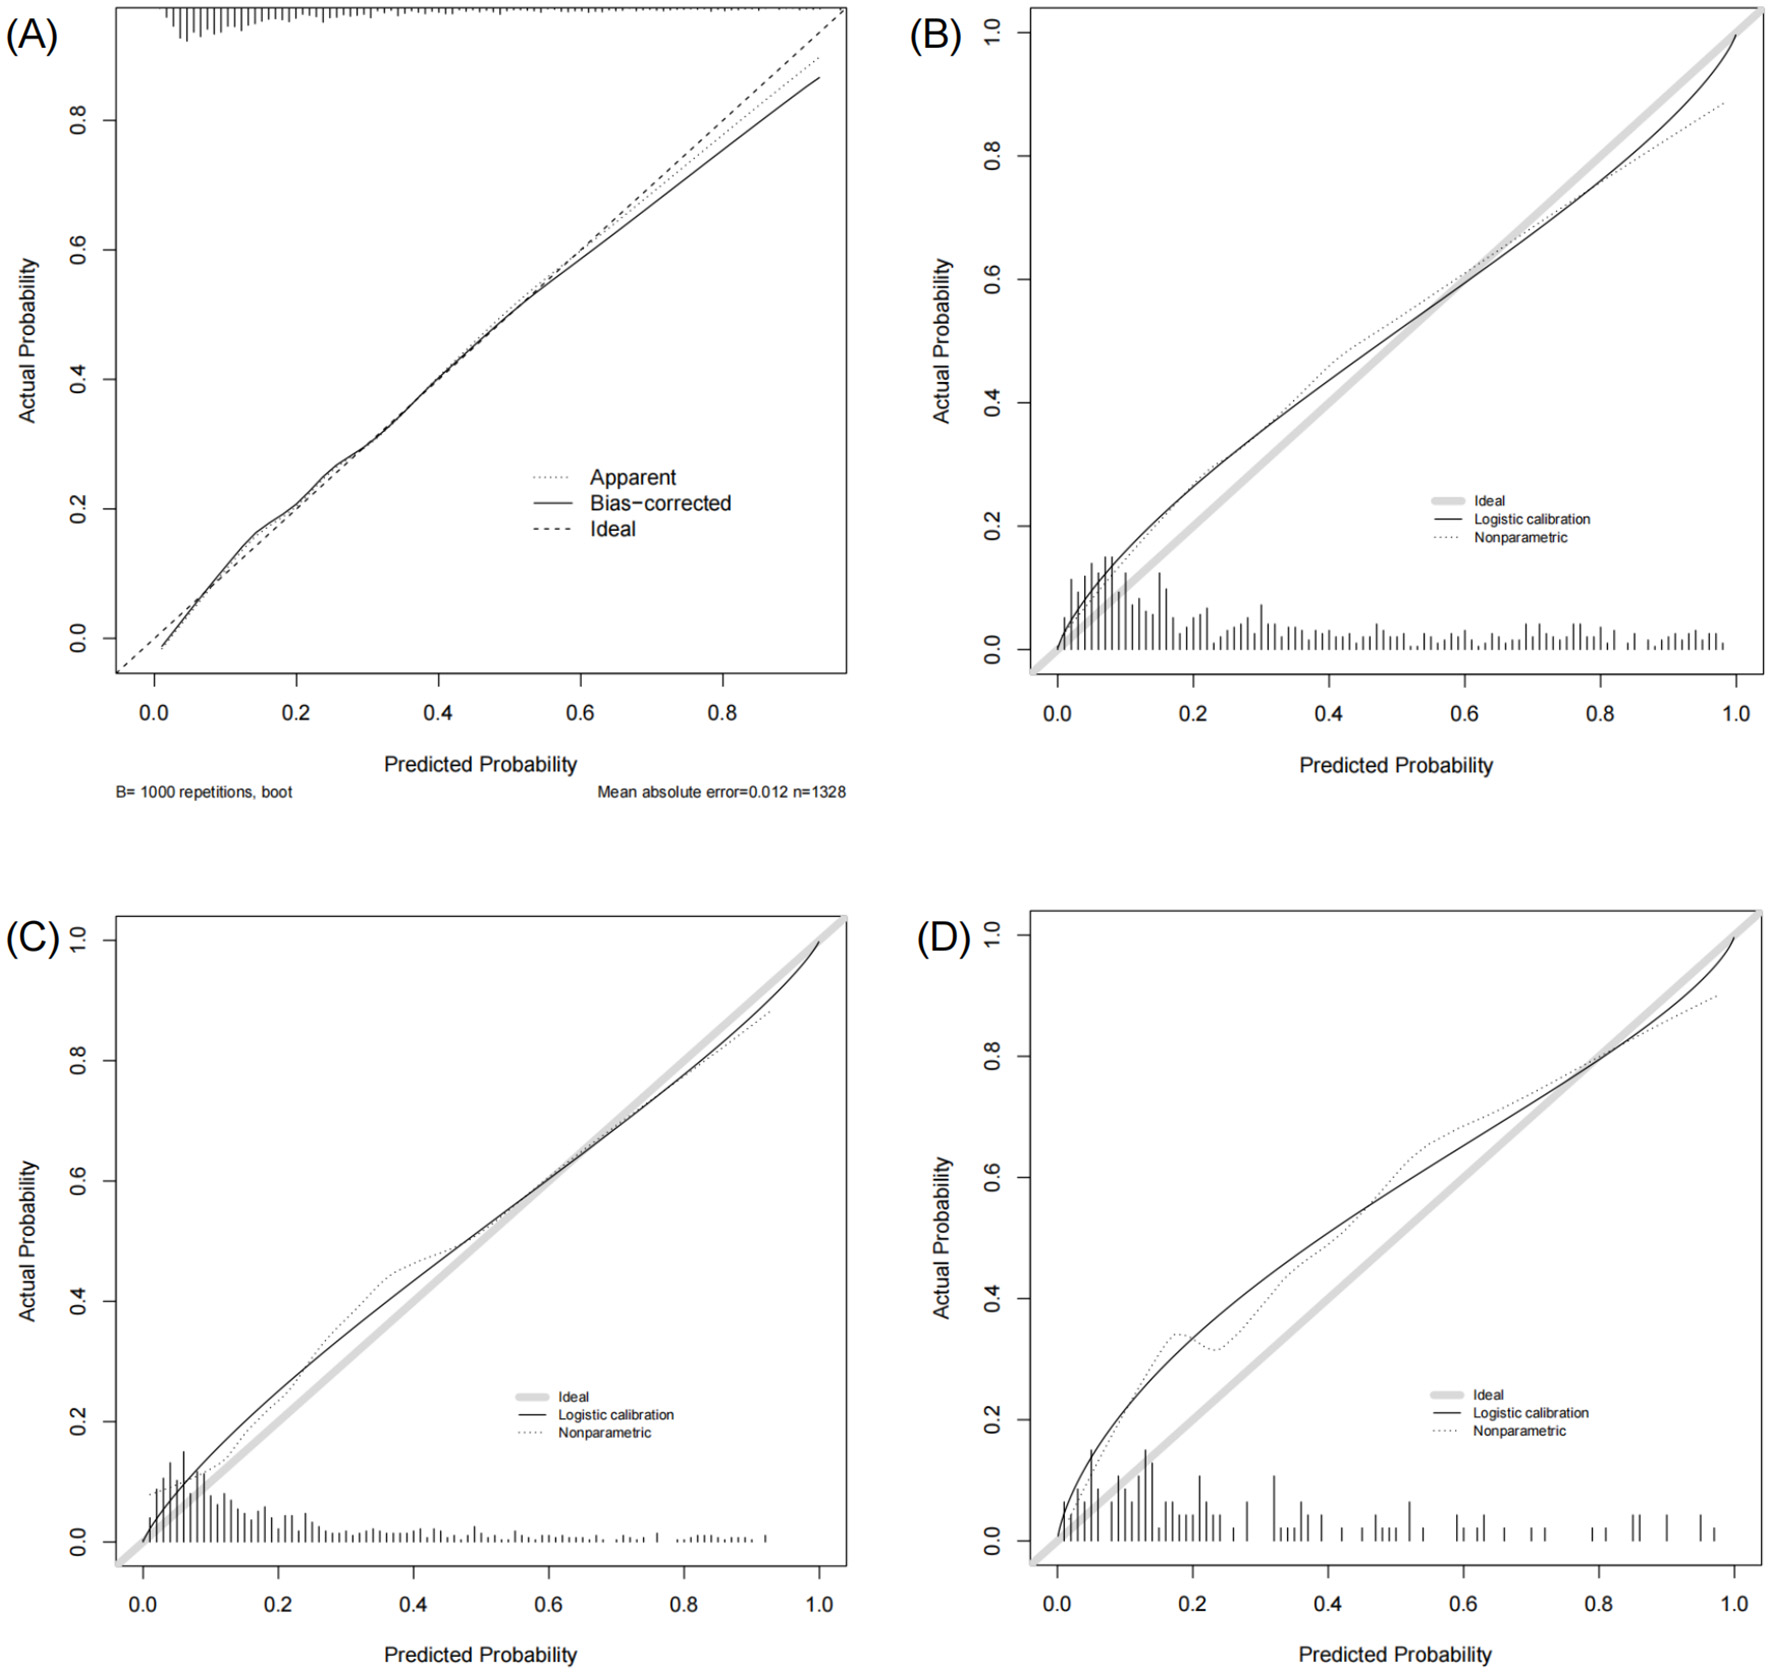
Calibration curves of the model in the training and validation sets. (A) Training set. (B) Temporal validation set. (C) External validation set (eICU-CRD). (D) External validation set (SZPH-ICU).
The nomogram showed superior predictive accuracy compared to existing clinical scores
The nomogram was systematically compared with eight established scoring systems: SOFA, ALBI, Child–Pugh, CLIF-OF, CLIF-C ACLF, CLIF-SOFA, MELD, and MELD-Na (Figure 4). In the training set, the nomogram (AUROC = 0.822) significantly outperformed all comparator scores (p < 0.05), with the best-performing conventional score (CLIF-SOFA) achieving an AUROC of 0.759. Similar superiority was observed in the temporal validation set (AUROC = 0.810; p < 0.05 for all comparisons).
In the eICU-CRD cohort, the nomogram achieved an AUROC of 0.777, which was significantly higher than those of SOFA, ALBI, Child–Pugh, CLIF-C ACLF, MELD, and MELD-Na (all p < 0.05). Although the differences compared with CLIF-OF (p = 0.105) and CLIF-SOFA (p = 0.107) were not statistically significant, the nomogram still exhibited numerical superiority. In the SZPH-ICU cohort, the nomogram (AUROC = 0.763) did not differ significantly from SOFA (p = 0.062), Child–Pugh (p = 0.093), CLIF-OF (p = 0.158), CLIF-C ACLF (p = 0.194), MELD (p = 0.218), or MELD-Na (p = 0.223), but significantly outperformed ALBI (p < 0.05) and consistently yielded the highest AUROC among all scores.
The incremental value of the nomogram over CLIF-SOFA was further assessed using the NRI index. Table 4 shows that in both the training and temporal validation sets, the NRI was significantly greater than zero (training set: NRI = 0.097, p = 0.002; temporal validation set: NRI = 0.092, p = 0.011), indicating that approximately 9–10% of patients were more accurately reclassified by the nomogram. In the external validation cohorts, the eICU-CRD cohort dataset showed a positive but non-significant NRI (NRI = 0.053, p = 0.234), whereas the SZPH-ICU cohort (n = 131) demonstrated no reclassification benefit (NRI = −0.001, p = 0.994). Overall, the NRI findings were consistent with the AUROC comparisons, supporting the nomogram's superior risk reclassification performance over CLIF-SOFA in the primary cohorts.
Table 4
| Datasets | Sample size | NRI | p-value |
|---|---|---|---|
| Training set | 1,328 | 0.097 | 0.002 |
| Temporal validation set | 724 | 0.092 | 0.011 |
| eICU-CRD validation set | 657 | 0.053 | 0.234 |
| SZPH-ICU validation set | 131 | −0.001 | 0.994 |
The NRI of the developed model compared with the CLIF-SOFA score.
Decision curve analysis confirmed the clinical net benefit of the model over default strategies
Decision curve analysis was used to evaluate the clinical net benefit of the model across a range of decision thresholds. As Figure 6 illustrates, over a broad range of threshold probabilities (approximately 0.05–0.78), employing this model for risk stratification—by intervening in patients whose predicted probabilities exceed the selected threshold—yielded a higher net clinical benefit than either treating all patients or treating none. At threshold probabilities above 0.78, the model's net benefit diminished, aligning closely with the “treat-none” strategy. This outcome is anticipated, as such high thresholds are rarely adopted in routine clinical practice when initiating therapy. Overall, these findings underscore the clinical utility of applying the proposed model.
Figure 6
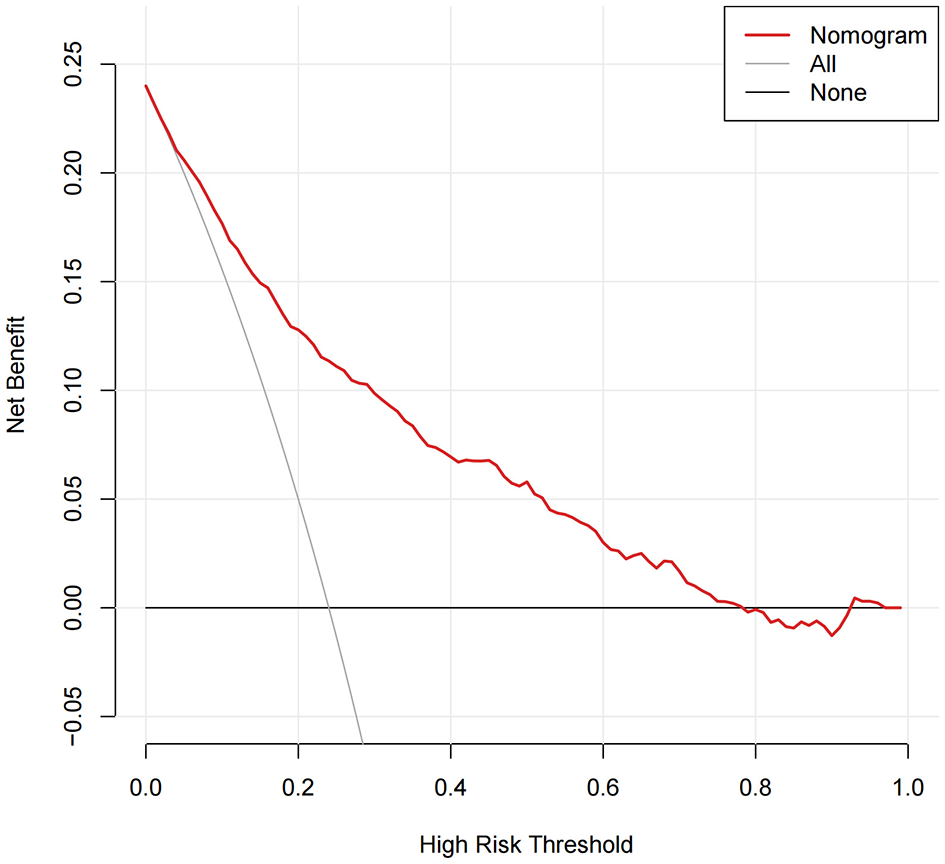
Clinical utility of the model as assessed using decision curve analysis across a range of threshold probabilities.
The model was implemented as an accessible web-based tool for clinical decision support
To facilitate clinical translation, an interactive web-based calculator was developed using the nomogram and is accessible at https://szph-icu.shinyapps.io/Cirrhosis-Sepsis-ICU/ (Figure 7). This tool enables clinicians to input patient-specific parameters, including age, vital signs, and laboratory parameters, to generate real-time estimates of in-hospital mortality risk. Consequently, it aids bedside decision-making and facilitates individualized treatment planning.
Figure 7
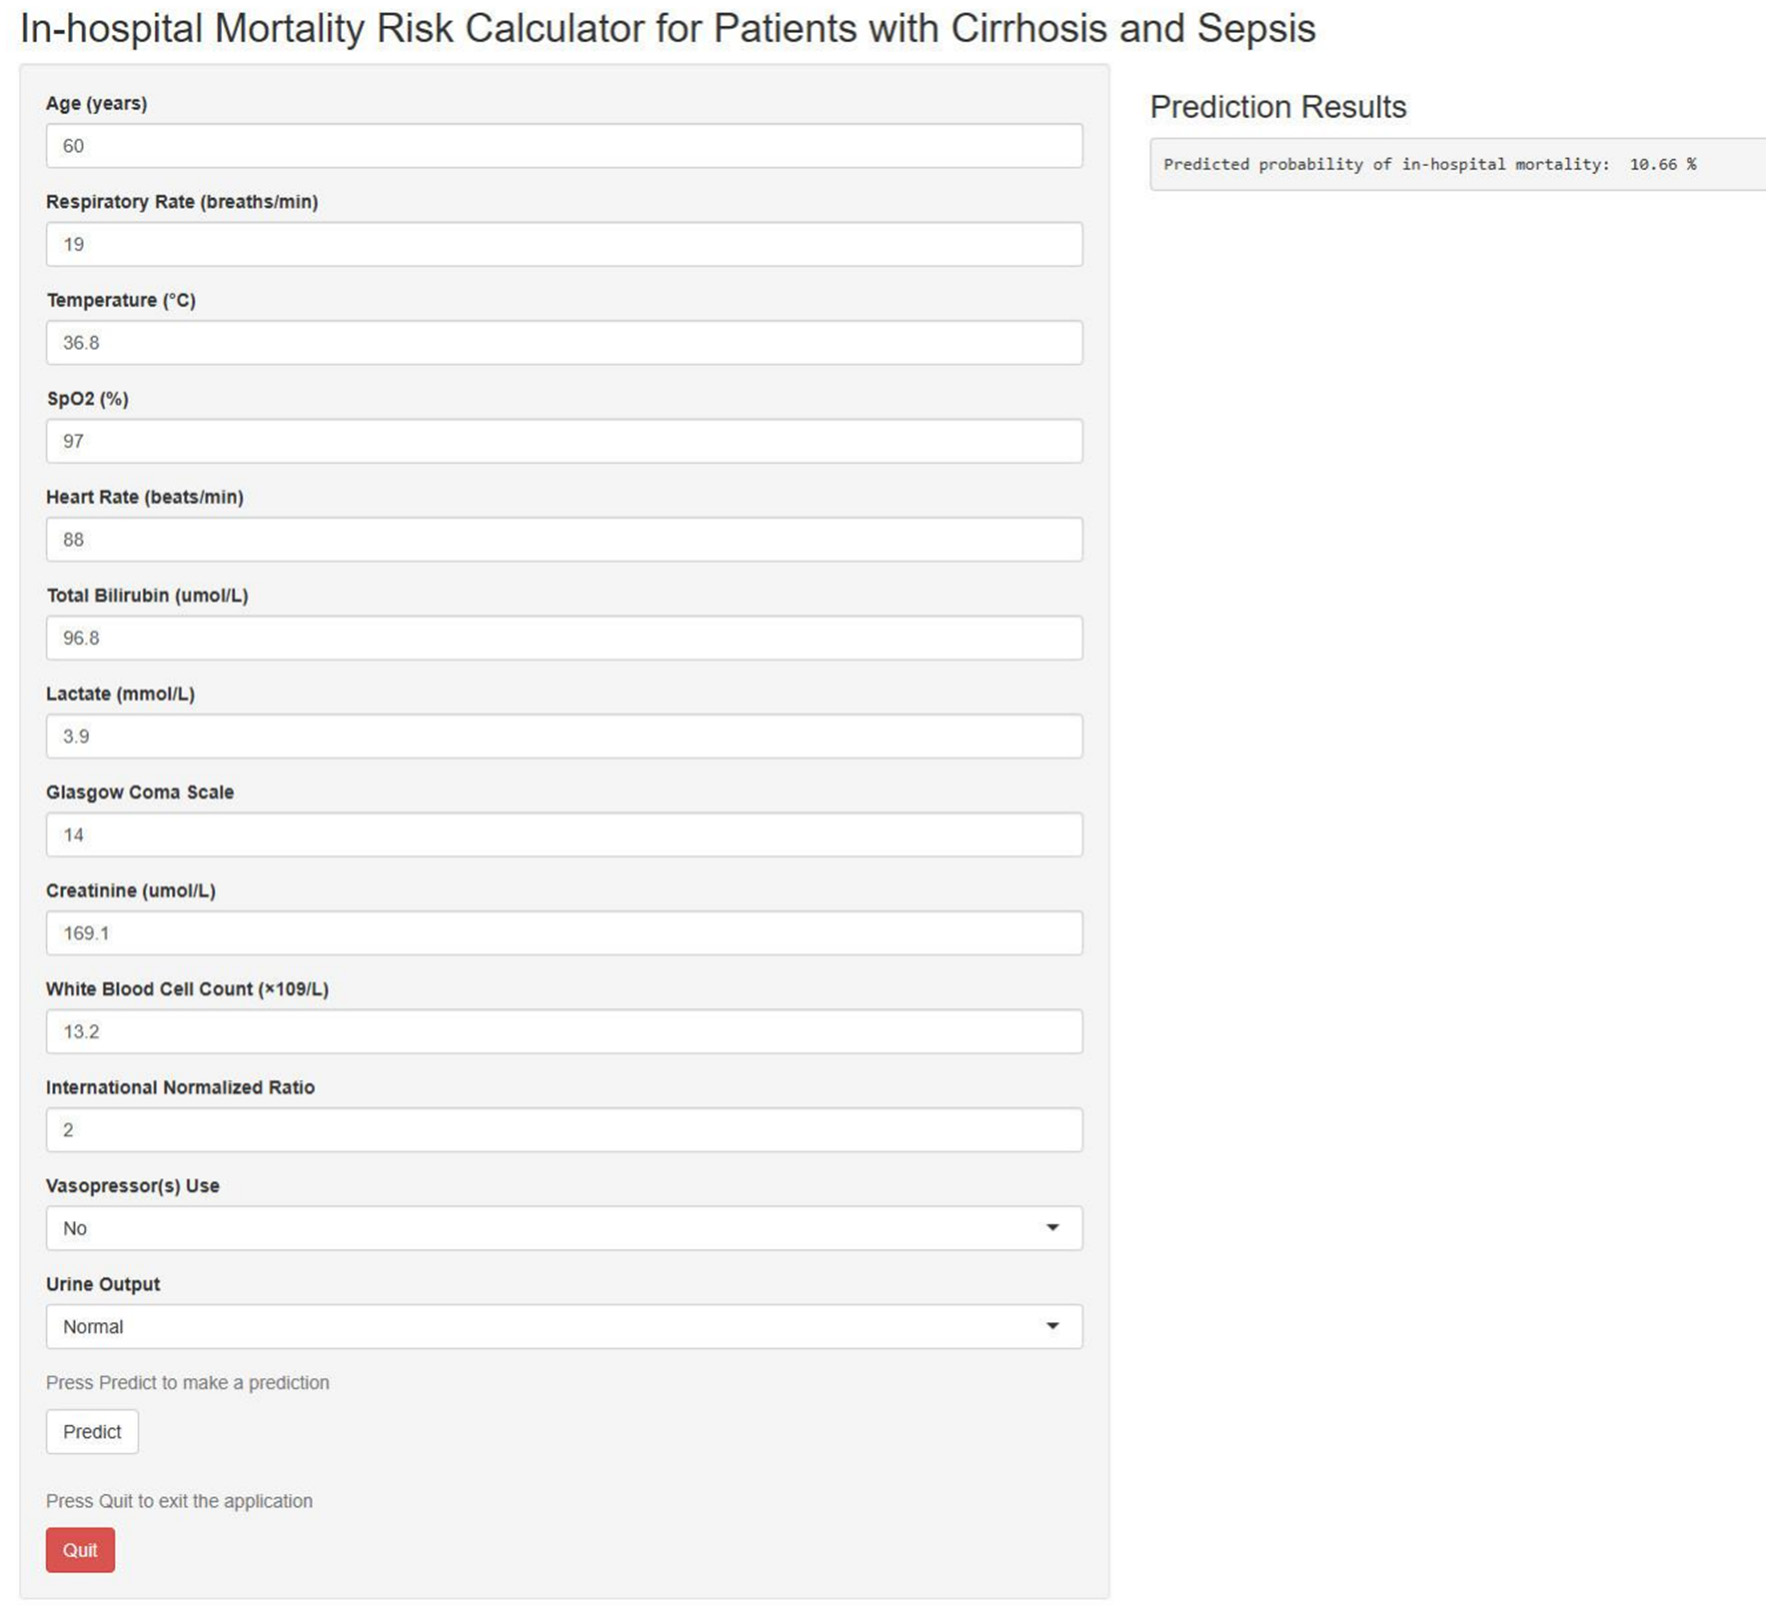
Web-based in-hospital mortality prediction calculator.
Discussion
In this multicentre retrospective study, we successfully developed and validated a novel multivariable logistic regression model to predict in-hospital mortality in ICU patients with cirrhosis and sepsis. The model incorporated 13 routinely available clinical variables and demonstrated excellent and stable predictive performance in both internal and external validation cohorts (eICU-CRD and SZPH-ICU), with AUROCs ranging from 0.763 to 0.822. This performance is comparable with the AUROC (0.830) reported for a recently published predictive model in ICU patients with cirrhosis and infection (18). Compared with eight existing general or liver-specific prognostic scoring systems (SOFA, ALBI, Child–Pugh, CLIF-OF, CLIF-C ACLF, CLIF-SOFA, MELD, and MELD-Na), our model exhibited significantly superior or at least comparable discriminative ability. This advantage was not only evident in AUROC comparisons but was further supported by the NRI metric, indicating enhanced risk stratification. Furthermore, decision curve analysis demonstrated a meaningful net clinical benefit across a wide range of threshold probabilities. Application of the model for risk stratification may facilitate more individualized clinical management. High-risk patients may benefit from earlier and more intensive monitoring and interventions, including enhanced haemodynamic surveillance, timely organ support, and optimisation of antimicrobial therapy. Conversely, identification of low-risk patients may help avoid unnecessary overtreatment, thereby improving resource utilization and enabling prioritization of patients with the greatest clinical need (28).
Patients with cirrhosis and sepsis typically have a poor prognosis, with mortality largely driven by the combined effects of hepatic dysfunction and sepsis-induced multiorgan failure (7, 29–31). Consistent with previous research, the predictors identified by our model—including GCS score, renal function (creatinine), hyperbilirubinaemia, coagulation status (INR), requirement for circulatory support (vasopressor use), and indicators of inflammation and metabolism (lactate)—are well-established determinants of outcome in critically ill patients with cirrhosis (32–34). These findings reinforce the central role of multi-organ dysfunction, particularly involving the liver, kidneys, cardiovascular system, and central nervous system, in shaping prognosis in this population. The novelty of our model lies in its comprehensive and generalizable design, integrating indicators of hepatic dysfunction (e.g., total bilirubin and INR) with key physiological parameters reflecting systemic inflammatory responses, such as respiratory rate, temperature, and heart rate. This integrative approach addresses the limitations of traditional liver-based scoring systems in capturing the systemic manifestations of sepsis and may explain the superior performance of our model compared with scores focused primarily on organ failure (e.g., SOFA) or hepatic function alone (e.g., MELD). In summary, our model highlights the pivotal importance of multisystem parameters, including neurological, hepatic, renal, and cardiovascular functions, in enhancing the accuracy of outcome predictions for patients with cirrhosis and sepsis.
Notably, body temperature emerged as one of the strongest predictors and was inversely associated with in-hospital mortality. Patients with decompensated cirrhosis often exhibit an attenuated febrile response due to immune dysfunction (4). Previous studies have shown that hypothermia is associated with increased mortality in sepsis, potentially reflecting profound immune suppression (35, 36). Hypothermic septic phenotypes have been linked to reduced levels of both pro-inflammatory and anti-inflammatory cytokines, suggesting a globally suppressed immune response. In cirrhotic patients with pre-existing immunodeficiency, hypothermia may be even more detrimental (37). Another key variable identified was heart rate. Tachycardia is a fundamental criterion of the systemic inflammatory response syndrome and also reflects the hyperdynamic circulatory state associated with portal hypertension in cirrhosis (38, 39). In cirrhotic patients with sepsis, an elevated heart rate captures both underlying haemodynamic alterations and the magnitude of the systemic stress response to infection, making it a clinically relevant indicator of disease severity and prognosis (40, 41). Age also emerged as an independent adverse prognostic factor. Aging is associated with immunosenescence, characterized by declines in both innate and adaptive immunity, increased susceptibility to infections, and reduced physiological reserve (42). Older patients with cirrhosis frequently have multiple comorbidities and limited capacity to tolerate septic insults, predisposing them to organ failure and poorer clinical outcomes (43).
Previous research has shown that commonly used prognostic models, such as the SOFA and MELD, often demonstrate limited specificity and accuracy when applied to specific subpopulations of cirrhotic patients with sepsis (17). Although several novel scoring systems, including the LIVERAID-ICU score, have been proposed, the present study advances this field in several important respects (17, 18). First, our model was developed using a larger sample size and more diverse data sources, including the MIMIC-IV, eICU-CRD, and SZPH-ICU databases, thereby enhancing robustness and generalizability. Second, we conducted a comprehensive temporal, spatial, and external validation, demonstrating strong generalizability across various time periods and healthcare settings—a crucial step toward clinical implementation that is frequently lacking in previous studies. Notably, the model exhibited stable discriminative performance across internal validation sets from different time frames and across external validation sets from diverse healthcare systems, indicating its ability to capture the core pathophysiological characteristics common to this patient population. Although a modest reduction in the AUROC was observed in the single-center SZPH-ICU external validation cohort (0.763), model performance remained comparable to or superior to that of the leading traditional scoring systems, highlighting its extensive clinical applicability. Such attenuation in external validation is common and may reflect differences in patient characteristics, clinical practice patterns, or data collection procedures. Furthermore, the development of a web-based calculator markedly enhances usability and accessibility, thereby promoting its integration into bedside clinical decision-making processes.
Several limitations should be acknowledged. First, the study relied on retrospectively collected electronic health record data that were not originally designed for this specific research purpose, introducing the potential for information bias due to incomplete recordings or coding errors. Second, although this study utilized multicentre data, the SZPH-ICU cohort originated from a single institution; therefore, further validation in larger, more diverse, and geographically representative populations is warranted. Third, several potentially important prognostic variables, such as the specific etiology of cirrhosis and specific sites of infection, were not consistently available across the included databases. Final, our model, which is based on data from the first 24 h of ICU admission, is static and similar to traditional critical illness scores, allowing early risk identification. However, it doesn't account for treatment responses or disease progression over time. Future research should focus on collecting data at key intervals (e.g., days 7, 14, and 28) and using time-dependent models to create dynamic tools. These tools could offer continuously updated risk assessments, improving the precision and timeliness of clinical decisions.
Conclusions
We successfully developed and validated a novel multivariable predictive model for in-hospital mortality in ICU patients with cirrhosis and sepsis. This model exhibited robust discrimination, satisfactory calibration, and significant clinical utility, outperforming several existing prognostic scoring systems. By integrating the model into a web-based calculator, we provide clinicians with a user-friendly and bedside-compatible tool for timely risk assessment, enabling early identification of high-risk patients, supporting optimized allocation of treatment resources, and facilitating individualized clinical decision-making. Prospective studies are necessary to further confirm the model's performance and generalizability across diverse clinical settings.
Statements
Data availability statement
Publicly available datasets were analyzed in this study. This data can be found here: MIMIC-IV: https://physionet.org/content/mimiciv/3.1/ and eICU-CRD: https://physionet.org/content/eicu-crd/2.0/.
Ethics statement
The studies involving humans were approved by Shenzhen People's Hospital Ethics Committee. The studies were conducted in accordance with the local legislation and institutional requirements. The ethics committee/institutional review board waived the requirement of written informed consent for participation from the participants or the participants' legal guardians/next of kin because the retrospective design of the study.
Author contributions
ZX: Writing – original draft, Conceptualization, Formal analysis. QY: Data curation, Validation, Writing – original draft. DP: Writing – original draft, Validation, Data curation. YJ: Data curation, Validation, Writing – original draft. YS: Visualization, Writing – review & editing. BW: Data curation, Writing – review & editing. ZC: Writing – review & editing, Data curation. JH: Data curation, Writing – review & editing. XL: Writing – review & editing, Methodology, Supervision.
Funding
The author(s) declared that financial support was received for this work and/or its publication. This work was supported by the Shenzhen Medical Research Fund (D2402002), Shenzhen Science and Technology Program (JCYJ20241202124903006, KCXFZ20230731093559005), and the Shenzhen Key Laboratory of Prevention and Treatment of Severe Infections (ZDSYS20200811142804014).
Acknowledgments
The authors thank the PhysioNet team at MIT for providing access to the MIMIC-IV and eICU-CRD datasets. We also acknowledge Editage (www.editage.cn) for English language editing.
Conflict of interest
The author(s) declared that this work was conducted in the absence of any commercial or financial relationships that could be construed as a potential conflict of interest.
Generative AI statement
The author(s) declared that generative AI was not used in the creation of this manuscript.
Any alternative text (alt text) provided alongside figures in this article has been generated by Frontiers with the support of artificial intelligence and reasonable efforts have been made to ensure accuracy, including review by the authors wherever possible. If you identify any issues, please contact us.
Publisher’s note
All claims expressed in this article are solely those of the authors and do not necessarily represent those of their affiliated organizations, or those of the publisher, the editors and the reviewers. Any product that may be evaluated in this article, or claim that may be made by its manufacturer, is not guaranteed or endorsed by the publisher.
Supplementary material
The Supplementary Material for this article can be found online at: https://www.frontiersin.org/articles/10.3389/fmed.2026.1759988/full#supplementary-material
References
1.
Ginès P Krag A Abraldes JG Solà E Fabrellas N Kamath PS . Liver cirrhosis. Lancet. (2021) 398:1359–76. doi: 10.1016/S0140-6736(21)01374-X
2.
Asrani SK Devarbhavi H Eaton J Kamath PS . Burden of liver diseases in the world. J Hepatol. (2019) 70:151–71. doi: 10.1016/j.jhep.2018.09.014
3.
Allen AM Kim WR Moriarty JP Shah ND Larson JJ Kamath PS . Time trends in the health care burden and mortality of acute on chronic liver failure in the United States. Hepatology. (2016) 64:2165–72. doi: 10.1002/hep.28812
4.
Bajaj JS Kamath PS Reddy KR . The evolving challenge of infections in cirrhosis. N Engl J Med. (2021) 384:2317–30. doi: 10.1056/NEJMra2021808
5.
Piano S Bunchorntavakul C Marciano S Rajender Reddy K . Infections in cirrhosis. Lancet Gastroenterol Hepatol. (2024) 9:745–57. doi: 10.1016/S2468-1253(24)00078-5
6.
Choi C Choi DH Spears GM Peeraphatdit TB Serafim LP Gajic O et al . Relationship between etiology of cirrhosis and survival among patients hospitalized in intensive care units. Mayo Clin Proc. (2022) 97:274–84. doi: 10.1016/j.mayocp.2021.08.025
7.
Wong F Bernardi M Balk R Christman B Moreau R Garcia-Tsao G et al . Sepsis in cirrhosis: report on the 7th meeting of the International Ascites Club. Gut. (2005) 54:718–25. doi: 10.1136/gut.2004.038679
8.
Navasa M Fernández J Rodés J . Bacterial infections in liver cirrhosis. Ital J Gastroenterol Hepatol. (1999) 31:616–25.
9.
Arvaniti V D'Amico G Fede G Manousou P Tsochatzis E Pleguezuelo M et al . Infections in patients with cirrhosis increase mortality four-fold and should be used in determining prognosis. Gastroenterology. (2010) 139:1246–56.e5. doi: 10.1053/j.gastro.2010.06.019
10.
Dasgupta A Jones TK Giannini H Bennett R Emre G Ittner CAG et al . Identifying a unique signature of sepsis in patients with pre-existing cirrhosis. Crit Care. (2025) 29:199. doi: 10.1186/s13054-025-05423-6
11.
Gustot T Felleiter P Pickkers P Sakr Y Rello J Velissaris D et al . Impact of infection on the prognosis of critically ill cirrhotic patients: results from a large worldwide study. Liver Int. (2014) 34:1496–503. doi: 10.1111/liv.12520
12.
Galbois A Aegerter P Martel-Samb P Housset C Thabut D Offenstadt G et al . Improved prognosis of septic shock in patients with cirrhosis. Crit Care Med. (2014) 42:1666–75. doi: 10.1097/CCM.0000000000000321
13.
Vincent J-L Moreno R Takala J Willatts S De Mendonça A Bruining H et al . The SOFA (sepsis-related organ failure assessment) score to describe organ dysfunction/failure. Intensive Care Med. (1996) 22:707–10. doi: 10.1007/s001340050156
14.
Le Gall J-R A A new simplified acute physiology score (SAPS II) based on a European/North American multicenter study. JAMA J Am Med Assoc. (1993) 270:2957. doi: 10.1001/jama.1993.03510240069035
15.
Kamath PS Wiesner RH Malinchoc M Kremers W Therneau TM Kosberg CL et al . Model to predict survival in patients with end–stage liver disease. Hepatology. (2001) 33:464–70. doi: 10.1053/jhep.2001.22172
16.
Pugh RNH Murray-Lyon IM Dawson JL Pietroni MC Williams R . Transection of the oesophagus for bleeding oesophageal varices. J Br Surg. (1973) 60:646–9. doi: 10.1002/bjs.1800600817
17.
Lin H Liao Q Lin X Zhou Y Lin J Xiao X . Development of a nomogram for predicting in-hospital mortality in patients with liver cirrhosis and sepsis. Sci Rep. (2024) 14:9759. doi: 10.1038/s41598-024-60305-1
18.
Hoppmann H Zeman F Wittmann D Stöckert P Schlosser-Hupf S Mehrl A et al . The LIVERAID (LIVER and infectious diseases)-ICU score predicts in-hospital mortality in liver cirrhosis patients with infections in the intensive care unit. BMJ Open Gastroenterol. (2024) 11:e001482. doi: 10.1136/bmjgast-2024-001482
19.
Johnson AEW Bulgarelli L Shen L Gayles A Shammout A Horng S et al . MIMIC-IV, a freely accessible electronic health record dataset. Sci Data. (2023) 10:1. doi: 10.1038/s41597-022-01899-x
20.
Pollard TJ Johnson AEW Raffa JD Celi LA Mark RG Badawi O . The eICU collaborative research database, a freely available multi-center database for critical care research. Sci Data. (2018) 5:180178. doi: 10.1038/sdata.2018.178
21.
Collins GS Reitsma JB Altman DG Moons KGM . Transparent reporting of a multivariable prediction model for individual prognosis or diagnosis (TRIPOD): the TRIPOD statement. BMJ. (2015) 350:g7594. doi: 10.1136/bmj.g7594
22.
Stekhoven DJ Bühlmann P . MissForest—non-parametric missing value imputation for mixed-type data. Bioinformatics. (2012) 28:112–8. doi: 10.1093/bioinformatics/btr597
23.
Staffa SJ Zurakowski D . Statistical development and validation of clinical prediction models. Anesthesiology. (2021) 135:396–405. doi: 10.1097/ALN.0000000000003871
24.
Johnson PJ Berhane S Kagebayashi C Satomura S Teng M Reeves HL et al . Assessment of liver function in patients with hepatocellular carcinoma: a new evidence-based approach-the ALBI grade. J Clin Oncol. (2015) 33:550–8. doi: 10.1200/JCO.2014.57.9151
25.
Jalan R Saliba F Pavesi M Amoros A Moreau R Ginès P et al . Development and validation of a prognostic score to predict mortality in patients with acute-on-chronic liver failure. J Hepatol. (2014) 61:1038–47. doi: 10.1016/j.jhep.2014.06.012
26.
Moreau R Jalan R Gines P Pavesi M Angeli P Cordoba J et al . Acute-on-chronic liver failure is a distinct syndrome that develops in patients with acute decompensation of cirrhosis. Gastroenterology (2013) 144:1426–37.e9. doi: 10.1053/j.gastro.2013.02.042
27.
Leening MJG Vedder MM Witteman JCM Pencina MJ Steyerberg EW . Net reclassification improvement: computation, interpretation, and controversies. Ann Intern Med. (2014) 160:122–31. doi: 10.7326/M13-1522
28.
Kamran F Tang S Otles E McEvoy DS Saleh SN Gong J et al . Early identification of patients admitted to hospital for covid-19 at risk of clinical deterioration: model development and multisite external validation study. BMJ (2022) 376:e068576. doi: 10.1136/bmj-2021-068576
29.
Gustot T Durand F Lebrec D Vincent J Moreau R . Severe sepsis in cirrhosis. Hepatology. (2009) 50:2022–33. doi: 10.1002/hep.23264
30.
McLaughlin D Shellenback L . Sepsis in patients with cirrhosis. AACN Adv Crit Care. (2016) 27:408–19. doi: 10.4037/aacnacc2016716
31.
Simonetto DA Piccolo Serafim L Gallo de Moraes A Gajic O Kamath PS . Management of sepsis in patients with cirrhosis: current evidence and practical approach. Hepatology. (2019) 70:418–28. doi: 10.1002/hep.30412
32.
Piccolo Serafim L Simonetto DA Choi DH Weister TJ Hanson AC Kamath PS et al . Derivation of a mortality prediction model in critical care patients with cirrhosis and sepsis. Shock. (2024) 61:382–6. doi: 10.1097/SHK.0000000000002323
33.
Chebl RB Tamim H Sadat M Qahtani S Dabbagh T Arabi YM . Outcomes of septic cirrhosis patients admitted to the intensive care unit. Medicine (Baltimore). (2021) 100:e27593. doi: 10.1097/MD.0000000000027593
34.
Drolz A Horvatits T Rutter K Landahl F Roedl K Meersseman P et al . Lactate improves prediction of short-term mortality in critically ill patients with cirrhosis: a multinational study. Hepatology. (2019) 69:258–69. doi: 10.1002/hep.30151
35.
Kushimoto S Gando S Saitoh D Mayumi T Ogura H Fujishima S et al . The impact of body temperature abnormalities on the disease severity and outcome in patients with severe sepsis: an analysis from a multicenter, prospective survey of severe sepsis. Crit Care. (2013) 17:R271. doi: 10.1186/cc13106
36.
Chen J Zhang W Yang Y . Hypothermia association with all-cause mortality in critically ill patients with sepsis based on the MIMIC-IV database. Sci Rep. (2025) 15:44902. doi: 10.1038/s41598-025-29166-0
37.
Bhavani SV Spicer A Sinha P Malik A Lopez-Espina C Schmalz L et al . Distinct immune profiles and clinical outcomes in sepsis subphenotypes based on temperature trajectories. Intensive Care Med. (2024) 50:2094–104. doi: 10.1007/s00134-024-07669-0
38.
Bone RC Balk RA Cerra FB Dellinger RP Fein AM Knaus WA et al . Definitions for sepsis and organ failure and guidelines for the use of innovative therapies in sepsis. Chest. (1992) 101:1644–55. doi: 10.1378/chest.101.6.1644
39.
Philips CA Ahamed R Rajesh S George T Mohanan M Augustine P . Update on diagnosis and management of sepsis in cirrhosis: current advances. World J Hepatol. (2020) 12:451–74. doi: 10.4254/wjh.v12.i8.451
40.
Ning Y-L Li W-J Lu X Zhang Y Zhang J-W Zhou J-H . Association between heart rate and mortality in patients with septic shock: an analysis revealed by time series data. BMC Infect Dis. (2024) 24:1088. doi: 10.1186/s12879-024-10004-z
41.
Kim JH Jun BG Lee M Lee HA Kim TS Heo JW et al . Reappraisal of sepsis-3 and CLIF-SOFA as predictors of mortality in patients with cirrhosis and infection presenting to the emergency department: a multicenter study. Clin Mol Hepatol. (2022) 28:540–52. doi: 10.3350/cmh.2021.0169
42.
Ibarz M Haas LEM Ceccato A Artigas A . The critically ill older patient with sepsis: a narrative review. Ann Intensive Care. (2024) 14:6. doi: 10.1186/s13613-023-01233-7
43.
Lominchar PL Orue-Echebarria MI Martín L Lisbona CJ Salcedo MM Olmedilla L et al . Cirrhotic patients and older people. World J Hepatol. (2019) 11:663–77. doi: 10.4254/wjh.v11.i9.663
Summary
Keywords
cirrhosis, sepsis, mortality, prediction model, nomogram, intensive care unit
Citation
Xu Z, Yang Q, Peng D, Jiang Y, Su Y, Wu B, Chen Z, Huang J and Liu X (2026) Development and validation of a prediction model for in-hospital mortality in intensive care unit patients with cirrhosis and sepsis: a multicentre retrospective cohort study. Front. Med. 13:1759988. doi: 10.3389/fmed.2026.1759988
Received
03 December 2025
Revised
15 January 2026
Accepted
20 January 2026
Published
09 February 2026
Volume
13 - 2026
Edited by
Jaswinder Singh Maras, The Institute of Liver and Biliary Sciences (ILBS), India
Reviewed by
Liang Shan, Anhui Medical University, China
Xiaojun Li, Guangdong Institute of Traditional Chinese Medicine, China
Updates
Copyright
© 2026 Xu, Yang, Peng, Jiang, Su, Wu, Chen, Huang and Liu.
This is an open-access article distributed under the terms of the Creative Commons Attribution License (CC BY). The use, distribution or reproduction in other forums is permitted, provided the original author(s) and the copyright owner(s) are credited and that the original publication in this journal is cited, in accordance with accepted academic practice. No use, distribution or reproduction is permitted which does not comply with these terms.
*Correspondence: Xueyan Liu, 13554843721@163.com
†These authors have contributed equally to this work
Disclaimer
All claims expressed in this article are solely those of the authors and do not necessarily represent those of their affiliated organizations, or those of the publisher, the editors and the reviewers. Any product that may be evaluated in this article or claim that may be made by its manufacturer is not guaranteed or endorsed by the publisher.