 Zhihua Zuo
 Junjun Xiong
 Chuyi Zeng1
 Yao Jiang
- 1Department of Clinical Laboratory, The Affiliated Hospital of Southwest Medical University, Luzhou, China
- 2Department of Gynaecology, The Affiliated Hospital of Southwest Medical University, Luzhou, China
- 3Department of Oncology, The Affiliated Hospital of Southwest Medical University, Luzhou, China
- 4Department of Clinical Laboratory, Traditional Chinese Medicine Hospital Affiliated to Southwest Medical University, Luzhou, China
Background: Cervical squamous cell carcinoma (CESC) is one of the most frequent malignancies in women worldwide. The level of immune cell infiltration and immune-related genes (IRGs) can significantly affect the prognosis and immunotherapy of CESC patients. Thus, this study aimed to identify an immune-related prognostic signature for CESC.
Methods: TCGA-CESC cohorts, obtained from TCGA database, were divided into the training group and testing group; while GSE44001 dataset from GEO database was viewed as external validation group. ESTIMATE algorithm was applied to evaluate the infiltration levels of immune cells of CESC patients. IRGs were screened out through weighted gene co-expression network analysis (WGCNA). A multi-gene prognostic signature based on IRGs was constructed using LASSO penalized Cox proportional hazards regression, which was validated through Kaplan–Meier, Cox, and receiver operating characteristic curve (ROC) analyses. The abundance of immune cells was calculated using ssGSEA algorithm in the ImmuCellAI database, and the response to immunotherapy was evaluated using immunophenoscore (IPS) analysis and the TIDE algorithm.
Results: In TCGA-CESC cohorts, higher levels of immune cell infiltration were closely associated with better prognoses. Moreover, a prognostic signature was constructed using three IRGs. Based on this given signature, Kaplan–Meier analysis suggested the significant differences in overall survival (OS) and the ROC analysis demonstrated its robust predictive potential for CESC prognosis, further confirmed by internal and external validation. Additionally, multivariate Cox analysis revealed that the three IRGs signature served as an independent prognostic factor for CESC. In the three-IRGs signature low-risk group, the infiltrating immune cells (B cells, CD4/8 + T cells, cytotoxic T cells, macrophages and so on) were much more abundant than that in high-risk group. Ultimately, IPS and TIDE analyses showed that low-risk CESC patients appeared to present with a better response to immunotherapy and a better prognosis than high-risk patients.
Conclusion: The present prognostic signature based on three IRGs (CD3E, CD3D, LCK) was not only reliable for survival prediction but efficient to predict the clinical response to immunotherapy for CESC patients, which might assist in guiding more precise individual treatment in the future.
Introduction
Cervical cancer ranks as the fourth most frequent malignancy and the fourth leading cause of cancer-related death in women worldwide, with approximately 570,000 new cases and 311,000 deaths reported by the International Agency for Research on Cancer (IARC) in 2018 alone (Bray et al., 2018). Cervical squamous cell carcinoma (CESC) comprises the primary histological type of cervical cancer, accounting for more than 80% of cases. Although recent advances in comprehensive treatments, including surgical resection, chemotherapy, and radiotherapy, have been made, the overall mortality has increased annually around the world (Jemal et al., 2011; Torre et al., 2015; Bray et al., 2018). For instance, in China, the number of deaths increased at an annual percentage change of 5.9% from 2001 to 2011 (Chen et al., 2016). Notably, the high risk of metastasis and recurrence makes it challenging for CESC patients with traditional therapies to maintain a good prognosis; thus, the development of a reliable prognostic assessment and novel therapeutic strategies is urgently needed (Pfaendler and Tewari, 2016).
In recent years, immunotherapy, especially the use of immune checkpoint inhibitors (ICIs), has made appreciable progress in antitumor practice and is becoming the new first-line therapeutic option in oncology (Fillon, 2020); e.g., for treatment of bladder cancer (Patel et al., 2020), melanoma (Zaretsky et al., 2016), renal cancer (Curti, 2018). Distinct from traditional treatments, the clinical benefits for immunotherapy patients are achieved by stimulating the persistent antitumor immune response (Kennedy and Salama, 2020), which depends on immunomodulation between the tumor microenvironment (TME) and cancer cells. Numerous studies have reported that infiltrating immune cells, a vital part of the TME, are closely related to cancer progression and the efficacy of immunotherapy (Hanahan and Coussens, 2012; Byrne et al., 2020). For instance, the mechanism of immune checkpoint blockade (ICB) therapy is to enhance a patient’s anti-tumor immune response by blocking the inhibitory effect of tumor cells on immune cells. In this process, programmed cell death 1 (PD1) and cytotoxic T lymphocyte antigen 4 (CTLA-4) are the most common targets of ICIs, which generally inhibit the activation and amplification of T cells that render the anti-tumor response ineffective. Although ICIs were expected to exhibit great potential in the immunotherapy of CESC patients, the clinical outcomes and prognosis were far from satisfactory, as only less than 20% patients achieved a partial or complete response where most had a PD-L1-positive tumors (Frenel et al., 2017; Chung et al., 2019). Meanwhile, the heterogeneity of increased levels of tumor infiltrating lymphocytes and tumor mutational burden in CESC participants also gives the additional explanation for it (Otter et al., 2019). Therefore, to achieve precise personalized decision-making for ICI treatment, a robust prognostic signature will be important to determine the prognosis and predict the sensitivity of immunotherapy in CESC patients.
Although several risk models have been developed to predict the prognosis of CESC patients (Yang et al., 2019; Liu et al., 2020), these have been based on differentially expressed genes, which ignored the complicated interactions of genes, as well as hub genes that showed no significant differences between tumor and normal tissues, but were closely linked to clinical features. Additionally, a promising prognostic signature based on immune-related genes (IRGs) has been confirmed great potential to predict prognosis and immunotherapy responsiveness in cancers but were less reported in CESC. In the present study, weighted gene co-expression network analysis (WGCNA) was the first time to be applied to identify significant IRGs for CESC patients, which were highly associated with infiltration levels of immune cells calculated by the use of ESTIMATE algorithm. Furthermore, hub IRGs were selected to construct a promising prognostic signature through the least absolute shrinkage and selection operator (LASSO) penalized Cox proportional hazards regression. Ultimately, internal and external validations further demonstrated that this robust prognostic signature based on IRGs in this study was not only reliable for survival prediction but efficient to predict the clinical response of ICIs for CESC patients, which might facilitate personalized counseling for immunotherapy in the future.
Methods
Data Acquisition and Preprocessing
The RNA-seq datasets (FPKM profiles) and clinical information of the CESC cohorts were retrieved from The Cancer Genome Atlas (TCGA) website (https://portal.gdc.cancer.gov/). Then, the gene expression matrix was formed via Perl script based on the CMD command. IDs were converted to gene symbols according to the Ensembl database (http://asia.ensembl.org/index.html). Meanwhile, mRNA expression profiles (GSE44001) were also downloaded from Gene Expression Omnibus (GEO) database to be viewed as the external validation group, where the matrix profile was conducted by Robust Multi-Array Average (RMA) algorithm in R affyPLM package (Irizarry et al., 2003). But of note, any patients with the follow-up time less than 1 day were excluded. In addition, if matched with multiple IDs in two matrix profiles, the gene expression values were averaged. Finally, log2 processing of the matrix data was performed for further analyses.
Evaluation of Tumor Microenvironment in The Cancer Genome Atlas-Cervical Squamous Cell Carcinoma Cohort
ESTIMATE algorithm (Yoshihara et al., 2013) has been popularly applied to predict infiltration levels of immune cells and stromal cells in the TME based on specific gene expression, of which the final results were evaluated using the immune score and stromal score, respectively. The ESTIMATE score was also calculated to measure the overall tumor immunity of CESC. Then, all patients were divided into two groups (high score and low score) based on the mean score, and survival analyses were performed to explore whether the overall survival were related with the immune infiltration levels.
Construction of Weighted Gene Co-expression Networks
In the present study, the top 25% most-varying genes calculated by the mean absolute deviation (MAD) algorithm were selected for subsequent analysis. The outlier samples were firstly identified and removed using the goodSamplesGenes function in the WGCNA package. Next, Pearson correlation coefficients were calculated between any two genes to construct the gene expression similarity matrix with the following formula:
Identification of Significant Modules and Genes Related to Clinical Features
The clinical traits of each sample were combined with module eigengenes (MEs) to construct the relevant clinical modules. MEs were defined as the first principal component of the module, representing the gene expression profile of the entire module. The clustering modules that were the most closely associated with immune cell infiltration were selected as the significant modules. Gene significance (GS) and module membership (MM) were also calculated to screen significant genes. GS represents the correlation between gene expression and clinical traits, and MM reflects the correlation between gene expression profile and genes within given modules. Ultimately, GS > 0.4 and MM > 0.8 were set as the criteria to identify hub genes that were strongly related to the clinically significant traits. (Zhang and Horvath, 2005).
To further screen potential genes that play an essential role in immune cell infiltration of CESC, a total of 1811 IRGs were obtained from the ImmPort database (https://immport.niaid.nih.gov) (Bhattacharya et al., 2014), and these overlapping genes were selected as hub IRGs for subsequent analysis.
Functional Enrichment and Interactions Analyses
The functional enrichment analyses including Gene Ontology (GO) enrichment and Kyoto Encyclopedia of Genes and Genomes (KEGG) pathway analyses were performed using the R clusterProfiler package (Yu et al., 2012). GO terms were further divided into biological process (BP), molecular function (MF), and cellular component (CC). Adj. p. value <0.05 were considered significant. To identify the interactive relationships of hub genes, a protein–protein interaction (PPI) network was constructed using the STRING database (https://string-db.org/) with the minimum required interaction score being 0.7. In addition, the R corrplot package was applied to conduct Pearson correlation analysis between hub IRGs.
Development and Validation of the Prognostic Signature
CESC patients were randomly divided into training and test groups with a 7:3 ratio (Table 1). In the training set, univariate Cox regression analysis was performed to explore the relationship between the expression of each key IRG and overall survival (OS). Then, these genes with a p-value < 0.05 were selected as hub IRGs, which were further analyzed by using LASSO penalized Cox proportional hazards regression to find the best risk model in the R package “glmnet” (Wang et al., 2019a). The risk score was calculated using the following formula:
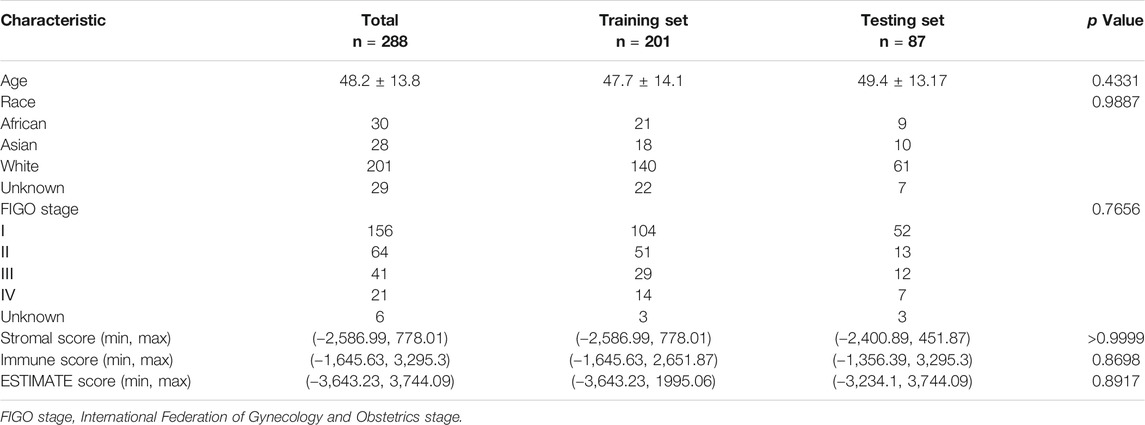
TABLE 1. Clinical variables in the training and testing sets.
To further verify the predictive performance of the prognostic model, the risk scores were also calculated in the testing group and external groups using the same prognostic formula, and the Kaplan–Meier survival curve and ROC curve were generated with a cutoff value of the mean risk score.
Immune Infiltration Patterns with Prognostic Signature
Immune infiltrating cells, such as T cells, B cells, and monocytes, have been shown to be important in the TME and to significantly affect cancer progression. Thus, ImmuCellAI (http://bioinfo.life.hust.edu.cn/web/ImmuCellAI/) (Miao et al., 2020), a novel and efficient tool based on the ssGSEA algorithm that can estimate the abundance of 24 immune infiltrate cells (18 T-cell subtypes and B cells, natural killer cells, monocytes, macrophages, neutrophils, and dendritic cells) from the gene expression data set (Bindea et al., 2013), was applied to calculate the abundance of immune cells and to compare the differences in infiltrated patterns between low- and high-risk groups. Meanwhile, we also employed TIMER database to explore the correlation of the expression levels of hub IRGs with the expression of immune checkpoint molecules and infiltrating levels of immune cells (Li et al., 2017).
Immunogenicity and Immunotherapeutic Sensitivity with Prognostic Signature
To further validate the predictive performance of the given prognostic signature for the response to ICIs, two independent methods including immunophenoscore (IPS) analysis and the Tumor Immune Dysfunction and Exclusion (TIDE) algorithm were employed to assess the immunogenicity and immunotherapeutic sensitivity of CESC patients, respectively.
The immunogenicity of a patient was determined by four main parts (effector cells, immunosuppressive cells, MHC molecules, and immunomodulators), which could be calculated without bias using machine learning methods by IPS analysis (Charoentong et al., 2017). Higher IPS scores (range 0–10) represent increased immunogenicity. The IPSs of patients with CESC were obtained from The Cancer Immunome Atlas (TCIA) (https://tcia.at/home).
The TIDE algorithm, designed by Dr. Shirley Liu and colleagues, was considered as highly reliable method to predict the clinical response of patients to ICB therapy (PD1 and CTLA-4 inhibitor) in recent studies (Jiang et al., 2018). The results were measured by TIDE score. According to the default settings, a patient with a TIDE value <0 was defined as a responder (positive sensitivity to immunotherapy), whereas a patient with a TIDE value >0 was defined as a non-responder (negative sensitivity to immunotherapy). Furthermore, a correlation analysis of CESC samples was performed to explore the correlation between the given prognostic signature and immune function.
Statistical Analysis
The WGCNA method and all statistical analyses were performed in R software (3.6.1) and GraphPad Prism (8.0). The Mann–Whitney test was applied to compare differences of continuous data between two groups, whereas ANOVA was used for more than two groups. A Chi square test was used to test for differences between categorical variables. p values <0.05 were considered to be statistically significant.
Results
Correlation of ESTIMATE Score and Clinical Characteristics
The flow diagram of the present study is shown in Figure 1. A total of 291 and 301 CESC samples were enrolled from TCGA and GEO database according to the inclusion criteria, respectively. The ESTIMATE score of each patient, which reflects the landscape of the TME and overall immune-infiltration degree was calculated with the ESTIMATE algorithm. As shown in Figure 2, patients with high immune and ESTIMATE scores demonstrated a better OS than those with low scores (p < 0.05). Nevertheless, all scores showed no statistical significance between different race, age, and International Federation of Gynecology and Obstetrics (FIGO) stage (Supplementary Figure S1 and Supplementary Table S1).
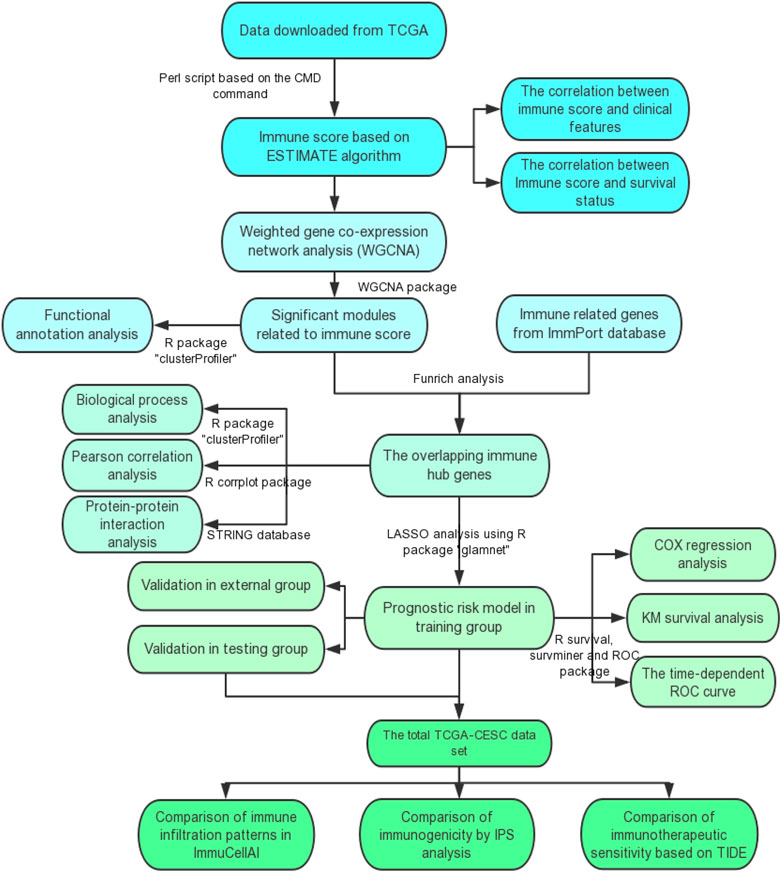
FIGURE 1. The flow diagram of this study. TCGA, the Cancer Genome Atlas; GO, Gene Ontology; KEGG, Kyoto Encyclopedia of Genes and Genomes; ROC curve, receiver operating characteristic curve; IPS, Immunophenoscore; TIDE, the Tumor Immune Dysfunction and Exclusion.
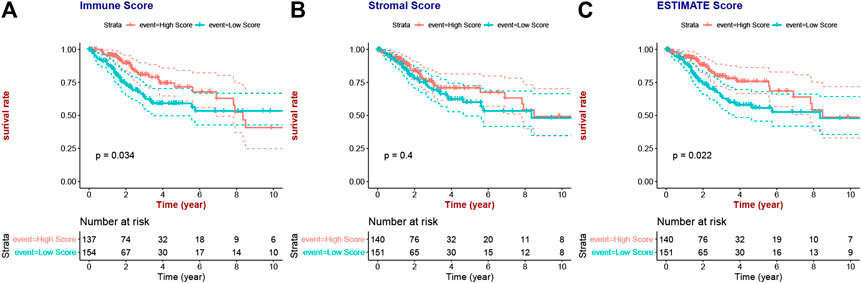
FIGURE 2. Associations between immune/stromal/ESTIMATE scores and CESC patients’ prognosis.
Identification of Immune-Related Modules and Hub Genes by Weighted Gene Co-Expression Network Analysis
First, three outlier samples were excluded by the goodSamplesGenes function. The dendrogram and heatmap (Supplementary Figure S2) display the distribution and clinical traits of the remaining 288 samples in detail. The soft-threshold power β = 4, the first parameter to meet the requirements of scale-free R2 > 0.9, was selected to construct the scale-free networks (Supplementary Figure S3). Furthermore, after similar modules were merged with a cut-height of 0.35, a total of 21 modules was ultimately identified for further analyses (Figure 3). Interestingly, the green and dark turquoise modules were found to be most associated with immune cell infiltration levels of CESC in the TME (Figure 4A), in which the correlation coefficients were 0.97 and 0.85, respectively. Therefore, the green (Figure 4B) and dark turquoise (Figure 4C) modules were considered immune-related key modules, and significant genes were selected with cut-off criteria of GS > 0.4 and MM > 0.8.

FIGURE 3. The cluster dendrogram of module eigengenes.
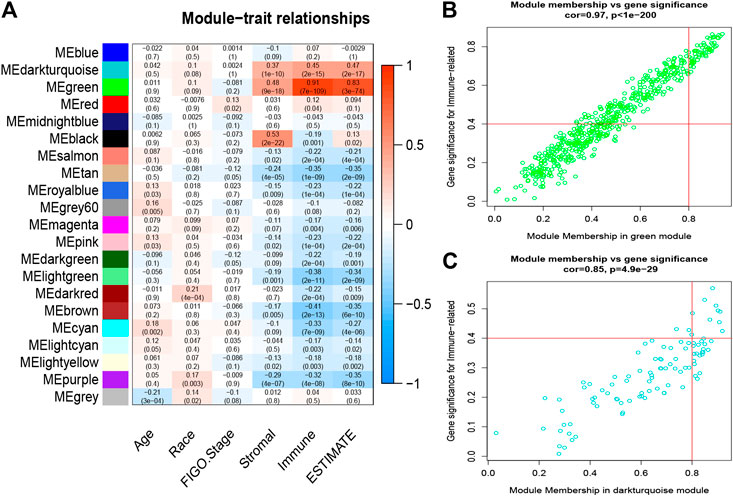
FIGURE 4. Analysis of key immune-related modules. (A), The correlation between modules and traits was displayed. (B–C) The correlation between GS and MM in the green and dark-turquoise modules. GS, gene significance; MM, module membership.
Function Analyses of Immune-Related Modules and Hub Genes
As shown in Figure 5A, most genes within immune-related modules were highly enriched in the inflammatory response, immune response, and proteolysis in the BP category, while chemokine activity, immunoglobulin receptor binding, and antigen binding; and plasma membrane, extracellular exosome, and cytosol were enriched in the MF and CC categories, respectively. Moreover, KEGG pathway analysis (Figure 5B) indicated that virus infection, cytokine−cytokine receptor interaction, antigen processing and presentation, and chemokine signaling pathway were significant. Therefore, the above results suggested that most defined genes in immune modules positively participated in immune-related biological processes in CESC.
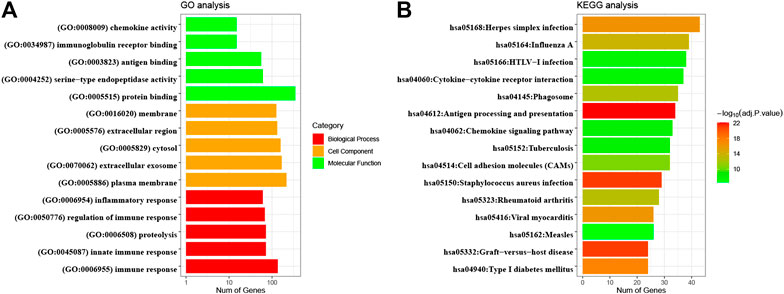
FIGURE 5. GO enrichment and KEGG pathway analyses of significant module genes. GO, Gene Ontology; KEGG, Kyoto Encyclopedia of Genes and Genomes.
Establishment and Validation of the Prognostic Signature
A total of 31 common genes were identified between significant module genes and IRGs obtained from the ImmPort database (Figure 6A). Subsequently, TCGA-CESC datasets were randomly divided into a training set (n = 201) and testing set (n = 87); basic clinical information is provided in Table 1. Using univariate Cox regression analysis in the training group, 20 genes were correlated with CESC patient survival (p < 0.05) (Table 2). The PPI network is shown in Figure 6B, and the results of Pearson correlation analysis indicated that 20 hub IRGs were significantly co-expressed in CESC samples (Figure 6C). GO analysis (Figure 6D) illustrated that the biological process terms were highly focused on T cell activation, positive regulation of leukocyte activation, leukocyte cell−cell adhesion, lymphocyte differentiation, and T cell differentiation, which further confirmed the important role of identified hub IRGs in the activities of immune infiltration and response.
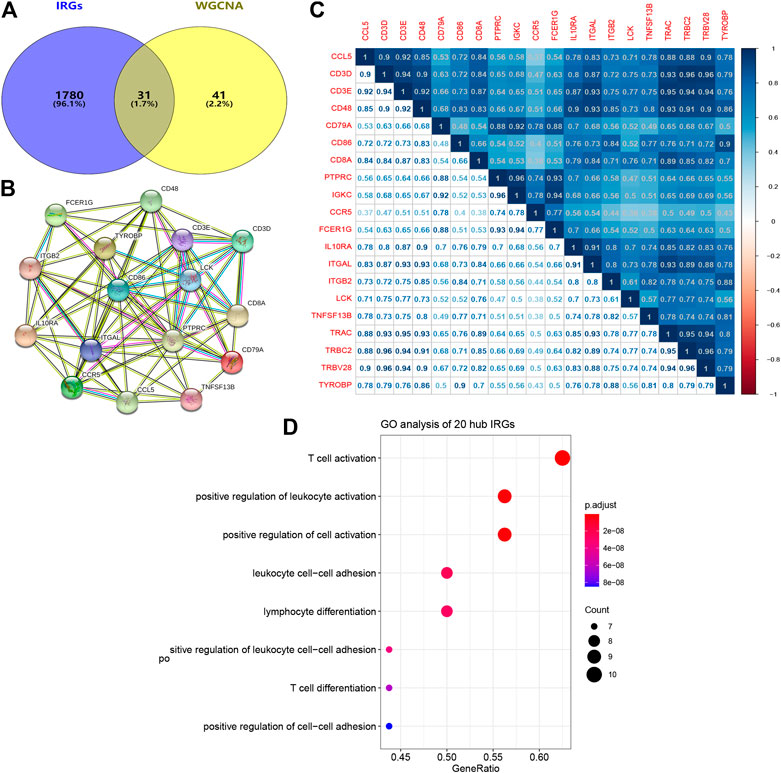
FIGURE 6. PPI network and biological process analyses of hub IRGs related to prognosis. (A) The common genes between modules genes and IRGs from ImmPort database. (B) PPI network of 20 hub IRGs. (C) Correlation analysis of 20 hub IRGs. (D) Biological process analysis of 20 hub IRGs. PPI network, protein-protein interaction network; IRGs, immune-related genes.
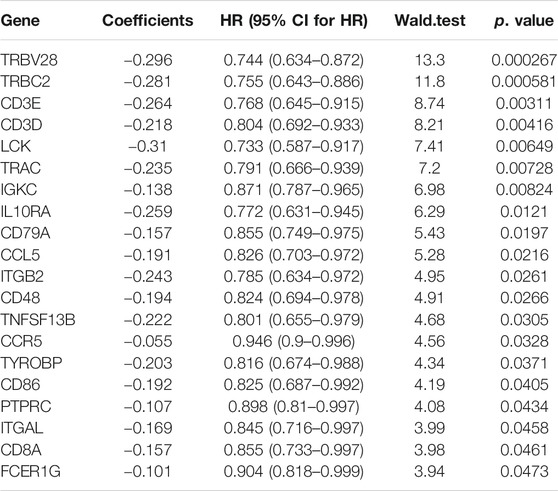
TABLE 2. Identification of 20 immune-related prognostic genes by univariate Cox regression analysis. HR, hazard ratio; CI, Confidence interval.
After the optimal model of prognostic prediction, the individualized risk scores were calculated with coefficient values extracted by LASSO Cox regression analysis. The formula was as follows: risk score = expression of CD3E*(−0.11337) + CD3D*(−0.01026) + LCK*(−0.0523). The LASSO plot is shown in Supplementary Figure S4, and the distribution of patient risk scores and survival status is shown in Figure 7A. The survival analysis indicated that the prognosis of high-risk patients was significantly worse than that of low-risk patients (Figure 7B). Additionally, the time-dependent ROC showed that the AUC values of 1-, 3-, and 5-year OS were 0.705, 0.641, and 0.662, respectively (Figure 7C). Ultimately, the 3-IRGs prognostic signature was validated using OS data from the testing set, of which the results remained consistent (Figure 8D), with the AUC values of 1-, 3-, and 5-year OS of 0.767, 0.770, and 0.702, respectively. Interestingly, the AUC values of 1-, 3-, and 5-year OS were 0.651, 0.648, 0.612 in external group (Figure 9), indicated the reliable predictive potential of the given prognostic signature. Meanwhile, the FIGO stage and prognostic model (low/high) were confirmed as independent risk factors for survival of CESC patients by the univariate and multivariate Cox regression analyses (Table 3).
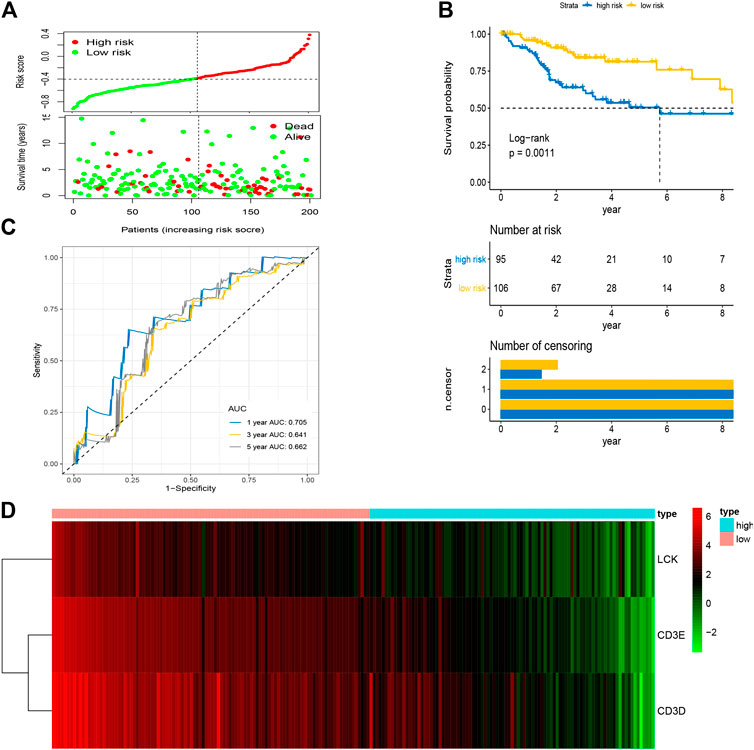
FIGURE 7. Construction of prognostic signature based on four hub IRGs in training group. (A) The distribution of risk scores and survival status between low- and high-risk groups, and mean level of risk score was set as the cut-off value. (B) The overall survival analysis of patients in two subgroups. (C) ROC curve analysis for the prediction of 1-, 3-, and 5-year OS as the defining point of the four-hub IRGs signature. (D) Heatmap of four prognostic IRGs. IRGs, immune-related genes; ROC curve, receiver operating characteristic curve; OS, overall survival.
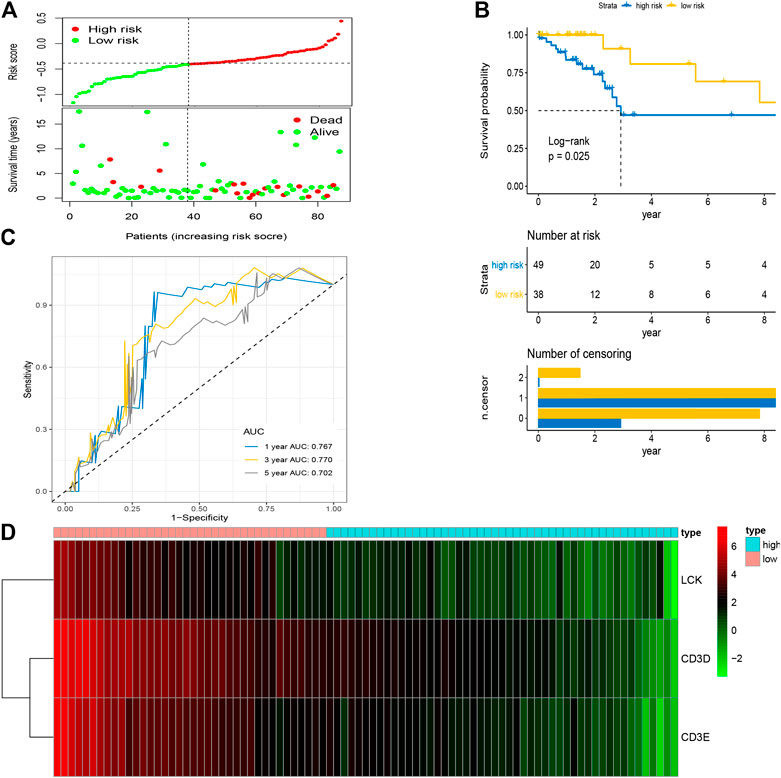
FIGURE 8. Validation of prognostic signature based on four hub IRGs in testing group. (A) The distribution of risk scores and survival status between low- and high-risk groups, and mean level of risk score was set as the cut-off value. (B) The overall survival analysis of patients in two subgroups. (C) ROC curve analysis for the prediction of 1-, 3-, and 5-year OS as the defining point of the four-hub IRGs signature. (D) Heatmap of four prognostic IRGs. IRGs, immune-related genes; ROC curve, receiver operating characteristic curve; OS, overall survival.
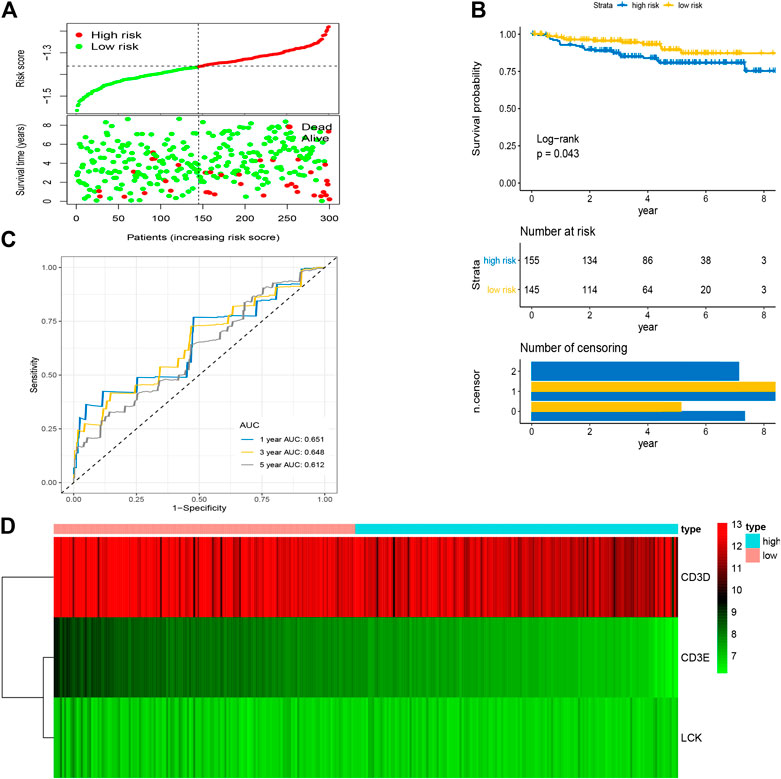
FIGURE 9. Validation of prognostic signature based on four hub IRGs in external group. (A) The distribution of risk scores and survival status between low- and high-risk groups, and mean level of risk score was set as the cut-off value. (B) The overall survival analysis of patients in two subgroups. (C) ROC curve analysis for the prediction of 1-, 3-, and 5-year OS as the defining point of the four-hub IRGs signature. (D) Heatmap of four prognostic IRGs. IRGs, immune-related genes; ROC curve, receiver operating characteristic curve; OS, overall survival.
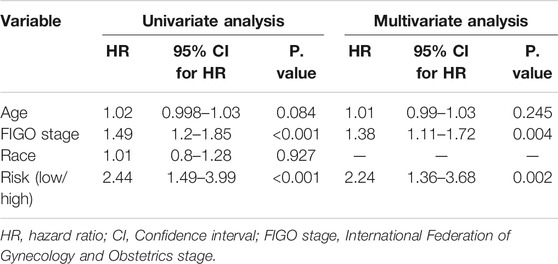
TABLE 3. Univariable and multivariable Cox regression analyses of clinical characteristics.
Immune Infiltration Patterns with Prognostic Signature
As shown in Figure 10, the expression levels of CD3D, CD3E and LCK were significantly positively correlation with the expression of three immune checkpoint molecules, including PD1(PDCD1), PDL1(CD274), and CTLA4, respectively. In addition, we also found that the CD3D, CD3E and LCK expression was significantly negatively related to tumor purity while positively associated with the infiltrating levels of immune cells, such as B cell, CD8 + T cell, and CD4 + T cell (Supplementary Figure S5). Thus, these results suggested that CESC patients with higher expression of three IRGs may had a better response to immunotherapy.
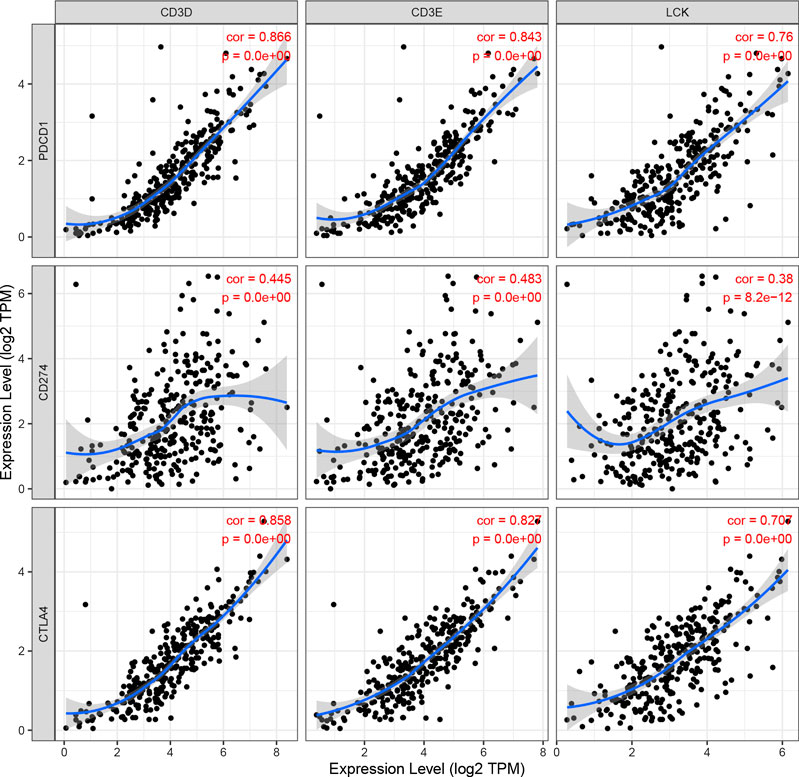
FIGURE 10. The correlation of CD3D, CD3E, LCK expression with immune checked molecular, including PDCD1(PD1), CD274(PD-L1), and CTLA4.
The correlation of prognostic signature and ESTIMATE score was shown in Supplementary Figure S6. To further investigate whether there were significant differences in immune cell infiltration between low- and high-risk groups, the abundance of 24 immune cells of each patient was determined using the ssGSEA algorithm in the ImmunCellAI database. As shown in Figure 11, the abundance of immune infiltrating cells, such as CD4/8 naïve T cells, neutrophils, monocytes, and NK T cells, was increased (p < 0.05) in the high risk group compared to the low risk group; whereas the infiltrating levels of B cells, CD4/8+ T cells, Th1/2 cells, iTregs, macrophages, and Cytotoxic T cells in the low-risk group were markedly higher than those of the high-risk group. These results are shown in detail in Supplementary Table S2.
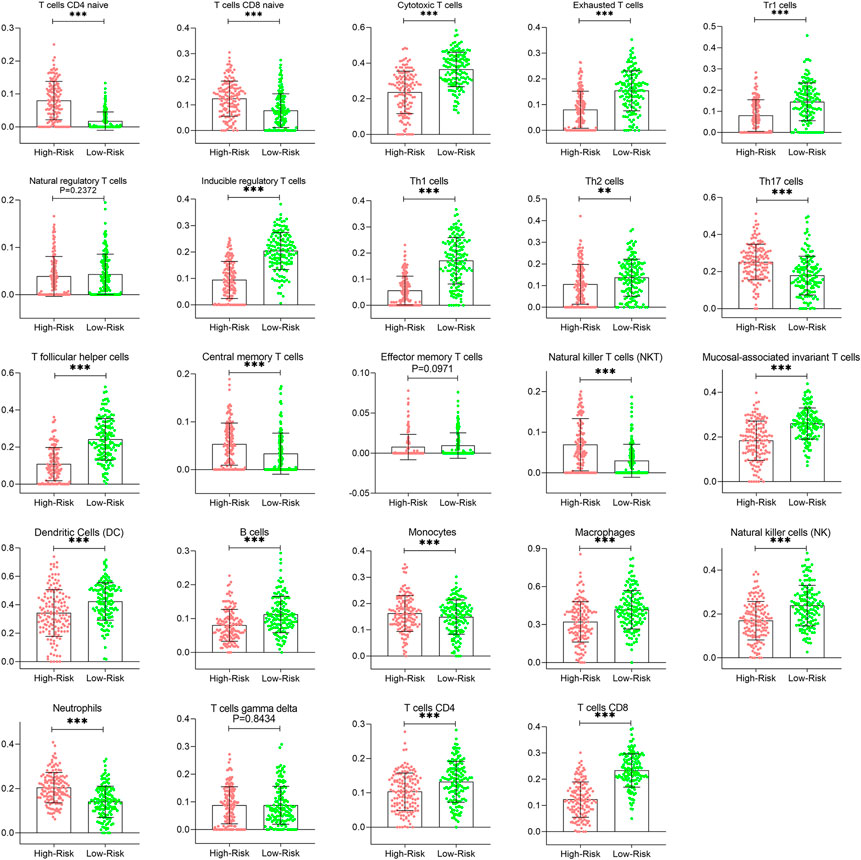
FIGURE 11. Comparison of immune infiltration patterns of CESC patients between low- and high-risk groups. CESC, cervical squamous cell carcinoma.
Immunogenicity and Immunotherapeutic Sensitivity with Prognostic Signature
In this work, the IPS of each CESC patient was evaluated to explore the association between immunogenicity and the two prognostic risk subgroups. As shown in Figures 12A–D, the IPS, IPS-CTLA4, IPS-PD1-PD-L1-PD-L2, and IPS-PD1-PD-L1-PD-L2-CTLA4 scores in the low-risk group were significantly higher than those of the high-risk group (p < 0.05), indicating a more immunogenic phenotype in the low-risk group. In addition, according to the TIDE algorithm, the response to ICIs of CESC patients was measured by the TIDE value (Supplementary Figure S7). The results also indicated that risk scores were significantly negatively correlated with IFNG, CD274 (PD-L1), CD8+ T cells, and dysfunction, and positively correlated with exclusion and MDSC (Figure 12E), which further confirmed our findings; the details are provided in Supplementary Table S3. Moreover, the number of CESC patients that exhibited a positive response to ICIs in the low-risk group was higher than that in the high-risk group (p < 0.05) (Figure 12F). The Kaplan–Meier survival curve showed improved survival in the responder group compared with the non-responder group (p = 0.036) (Figure 12G). Overall, the results demonstrate that the low-risk group identified by the three IRGs appeared to present with a more positive response to immunotherapy and a better prognosis.
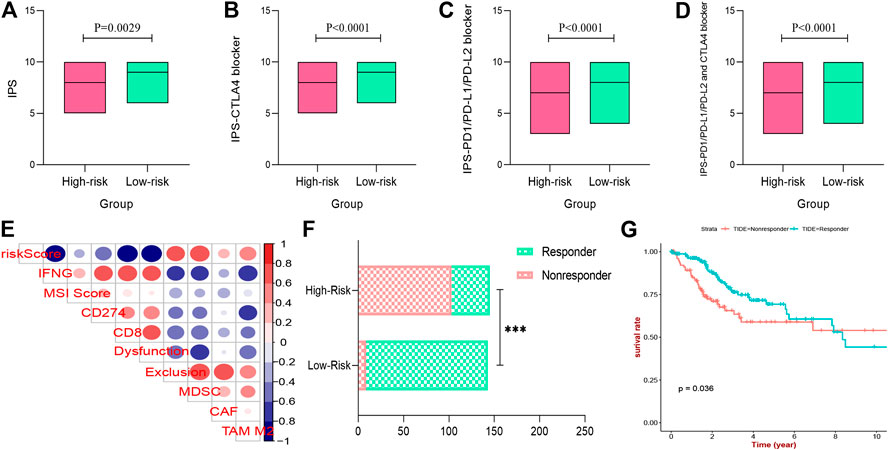
FIGURE 12. Immunogenicity and immunotherapeutic sensitivity with prognostic signature. (A–D) the IPS, IPS-CTLA4 blocker, IPS-PD1-PD-L1-PD-L2 blocker, and IPS-PD1-PD-L1-PD-L2-CTLA4 blocker scores between low- and high-risk groups. (E) Immune infiltrating cell profile of tumor microenvironment of CESC patients. (F) The differences of immunotherapy sensitivity between low- and high-risk groups. (G) Survival analysis of different immunotherapy sensitivity. IPS, Immunophenoscore; ICIs, immune check inhibitors; CESC, cervical squamous cell carcinoma.
Discussion
Although advanced diagnostic methods and molecular anticancer therapies have been rapidly developed, the overall prognosis of CESC patients remains poor (McLachlan et al., 2017). ICB therapy was expected to be a breakthrough in CESC treatment (Hamanishi et al., 2017). In several early-phase randomized clinical trials, the application of pembrolizumab and nivolumab (PD-L1/PD-1 blockage) suggested promising clinical outcomes for CESC patients with metastasis and recurrence (Frenel et al., 2017; Chung et al., 2019). However, only a small portion of CESC patients showed a positive response to ICI treatments. Therefore, we identified a robust prognostic signature based on IRGs to forecast prognosis and immunotherapy sensitivity for CESC patients, which may facilitate personalized counseling.
In the present study, the abundance of immune cells and stromal cells in the TME was first investigated using the ESTIMATE algorithm, which was considered a clinical trait for further analysis. The results also indicated that the high infiltration of immune cells showed a better prognosis for CESC patients, indicating that the TME plays an essential role in the prognosis of CESC patients. GO enrichment and KEGG pathway analyses demonstrated that most genes identified as closely related to immune cell infiltration by WGCNA were enriched in immunomodulatory activities, such as the inflammatory response, immune response, and chemokine signaling pathway. By performing univariate and LASSO Cox regression analyses, three hub IRGs (CD3E, CD3D, and LCK) were selected to establish an immune-related prognostic signature for CESC patients, where the AUC values of 1-, 3-, and 5-year OS were 0.705, 0.641, and 0.662 in the training group, and 0.767, 0.770, and 0.702 in the testing group and 0.651, 0.648, 0.612 in the external validation, respectively, indicating the reliably predictive capacity for CESC patient prognosis.
Additionally, functional annotation further suggested that CD3E, CD3D, and LCK were involved in positive regulation of T cell activation and leukocyte cell-cell adhesion that were known as the chief determinant for the efficacy of tumor immunotherapy (Ding and Chen, 2019; Alvarez et al., 2020). Meanwhile, existing evidence has accumulated demonstrating the important role of three hub IRGs in the regulation of immune responses of tumor tissues. The promising tumor immunotherapy mainly depends on the recognition of T-cell receptor (TCR) to special tumor antigens to stimulate the activation of self T cells in order to attack cancer cells (Kennedy and Salama, 2020). Notably, the CD3 co-receptor complex is vital for signal transduction after specific binding of TCR, of which the integrity is considered as the crucial factor for cytotoxic T cell responses to tumor antigens (Fuehrer et al., 2014). CD3E usually participates in encoding the CD3ε chain, one of the major components (γ-, δ-, ε- and ζ-chain) of the CD3 co-receptor complex, whose deficiency will cause the severe combined immunodeficiency (Firtina et al., 2017; Erman et al., 2020). Hart et al. has reported that a reduced cell surface abundance of CD3E could lead to a significant inhibition of T cell killing capacity (Hart et al., 2019). In contrast, the increased expression of CD3E was found markedly related to the effective response in 31 cancer types patients who received anti-PD1 immunotherapy (Gaffney et al., 2019). CD3D has been reported as a potential biomarker for the response to ICIs and prognosis in cancers, including colon cancer and muscle-invasive bladder cancer (Klintman et al., 2016; Shi et al., 2019; Yang et al., 2020). Homozygous mutations in the CD3D gene can lead to markedly abnormal T-cell development, and thus, to early-onset immunodeficiency (Fischer et al., 2005; Gil et al., 2011). Moreover, high expression of CD3E and CD3D gene were reported significantly related to positive OS in CESC (Wang et al., 2019b). LCK, also known as lymphocyte-specific protein tyrosine kinase p56, was found as a key molecule in T cell activation by phosphorylating the TCR/CD3 complex to initiate TCR signaling (Wei et al., 2020). Recent studies showed that the improved LCK activity was contributed to improve the efficacy of chimeric antigen receptors (CARs) immunotherapy in cancers (Gulati et al., 2018; Bommhardt et al., 2019; Suryadevara et al., 2019). In contrast, the inhibited targeted drugs of LCK was reported that could cause the loss of T-cell immune response and result in immunosuppression for patients cancer (Zhao et al., 2008). Therefore, these defined three hub IRGs were expected as immunotherapeutic biomarkers and potential therapeutic targets for CESC patients; this will be the subject of future studies.
The number and proportion of infiltrating immune cells in the TME are recognized as important factors affecting cancer progression and immunotherapy response. To further elucidate the role of the TME associated with this given prognostic signature, the ImmunCellAI database based on ssGSEA algorithm was the first time to be employed to analyze the immune cell infiltrating landscape in CESC patients. We found that most immune cells in low risk groups were more abundant than in high risk group, such as cytotoxic T cell, exhausted T cells, Th1/2 cells, and NK cells, suggesting a more potent immune defense in low risk CESC patients. Additionally, the increased B cells, CD4+ T cell, and CD8+ T cell infiltration indicated that better therapeutic outcomes may be achieved with ICI immunotherapy in low risk groups compared to high risk groups (Liu et al., 2019b; Matsuzaki et al., 2019). Dr. Joy et al. (Hsu et al., 2018) reported that NK cells, in addition to T cells, could enhance the effect of ICI immunotherapy, whereas that efficacy may be weakened due to competition between NK cells and T cells shown in a recent study (Alvarez et al., 2020). In contrast, Tregs and tumor-related macrophages have been reported to be immunosuppressive cells that can form an immunosuppressive atmosphere to facilitate tumor progression by disrupting the adaptive immune response (Milowsky et al., 2016).
Ultimately, to further explore the predictive value of the prognostic signature in ICI immunotherapy, two independent methods, IPS analysis and TIDE algorithm, were applied to calculate the response of CESC patients to ICIs. The results showed that IPS, IPS-CTLA4, IPS-PD1/PD-L1/PD-L2, and IPS/PD1/PD-L1/PD-L2 + CTLA4 scores were significantly increased in this prognostic signature low-risk group. And TIDE algorithm indicated that low risk patients appeared to present with more positive response to anti-ICIs immunotherapy. Both of these founding further support the potential of this given immune-related prognostic signature to determine the immunotherapy sensitivity for CESC patients.
This study represents the first application of WGCNA to identify hub IRGs linked to immune cell infiltration in an effort to develop a prognostic signature for predicting CESC patients prognosis. And it is the first study that employs ImmunCellAI and TIDE algorithm to analyze the immune cell infiltrating landscape and predict immunotherapy sensitivity for CESC, respectively. Compared with individual biomarkers (e.g., PD1 and PDL1) that were more susceptible to interference, the multiple genes signature showed a more reliable stability. In addition, the performance of our three IRGs signature to predict the progression and immune response was better than that in previous study (Liu et al., 2020). Importantly, the versatility of this prognostic model was further verified using external validation, which was less reported in previous study. Nevertheless, some limitations in this work still remain. Firstly, the relative values of gene expression and the difference of FIGO stages between TCGA and GEO database may contribute to the discrepancies in verification groups (e.g., the limited performance in external validation) or in further clinical trails. Secondly, the prognostic signature of CESC patients was developed based on the OS rate, but some external factors such as the TMN degrees were not extensively evaluated due to a lack of relevant data. Thirdly, although bioinformatics tools are helpful to display the interaction of hub IRGs, the external experiments are also important to further elucidate the molecular mechanisms. Finally, TCGA-CESC patients have not received relevant immunotherapy, and the response to ICI treatment was calculated by cutting-edge bioinformatics technologies. Although the potential of this prognostic signature to stratify CESC patients with different immune response was verified reliable by the consistent results of two independent and powerful approaches, a multicenter and large-scale study is still needed to evaluate its practicality in clinical tests and to strengthen its the clinical evidence.
Conclusion
In the present study, we have identified hub genes related to the immune infiltration in CESC microenvironment and constructed a robust three IRGs (CD3E, CD3D, and LCK) signature to predict the prognosis of CESC patients. Meanwhile, the versatility of the signature was verified by using internal and external validation groups. In the further exploration, we also found that this model had a reliable potential to forecast the sensitivity to ICI immunotherapy for CESC patients, which was able to facilitate personalized counseling for immunotherapy. Further testing of this model in clinical practice will be necessary for prognostic stratification and treatment management in the future.
Data Availability Statement
Publicly available datasets were analyzed in this study. These data can be found here: TCGA: https://portal.gdc.cancer.gov/; GEO: https://www.ncbi.nlm.nih.gov/geo/.
Author Contributions
ZZ and JX collected and analyzed the data, wrote the manuscript. CZ, YJ, and KX analyzed the data and reviewed the manuscript. HT and YG designed the study and revised the manuscript. All the authors read and approved the final manuscript.
Funding
This study was supported by Luzhou Municipal People’s Government & Southwest Medical University (Grant No. 2018LZXNYD-ZK08), Southwest Medical University (Grant No. 2018-ZRQN-125) and Sichuan Provincial Health Commission (Grant No. 20PJ144).
Conflict of Interest
The authors declare that the research was conducted in the absence of any commercial or financial relationships that could be construed as a potential conflict of interest.
Supplementary Material
The Supplementary Material for this article can be found online at: https://www.frontiersin.org/articles/10.3389/fmolb.2021.625470/full#supplementary-material.
Supplementary Figure 1 | Association between clinical traits of CESC patients and immune/stromal/ESTIMATE scores. CESC, cervical squamous cell carcinoma; FIGO stage, International Federation of Gynecology and Obstetrics stage.
Supplementary Figure 2 | Sample dendrogram and trait heatmap. Each branch in the image represents one CESC patient and gray below represents missing data.
Supplementary Figure 3 | Analysis of the scale-free fit index for multifarious soft-thresholding powers (β).
Supplementary Figure 4 | LASSO plot of hub IRGs of the prognostic signature. (A) The best lambda was selected at the lowest point of the curve (minimal partial likelihood deviance). LASSO compresses the coefficients of some covariates to 0, leaving thirteen non-zero coefficients. (B) Penalty graph of characteristic thirteen variable coefficients. Three variables (CD3D, CD3E, LCK) with non-zero coefficients were identified at the best lambda, and the feature parameters without information are removed to realize the automatic selection of feature parameters.
Supplementary Figure 5 | The correlation of CD3D, CD3E, LCK expression with tumor purity and immune infiltrating cells.
Supplementary Figure 6 | The correlation of prognostic signature and ESTIMATA ESTIMATE score.
Supplementary Figure 7 | TIDE value of CESC patients to predict the immunotherapy sensitivity. Responder represents positive immunotherapy sensitivity while non-responder represents negative immunotherapy sensitivity. TIDE, Tumor Immune Dysfunction and Exclusion; CESC, cervical squamous cell carcinoma.
Supplementary Table 1 | The clinical/pathological factors between Estimate high score group and low score group.
Supplementary Table 2 | The infiltrating immune cells with the given prognostic signature.
Supplementary Table 3 | The immune functions with the given prognostic signature.
References
Alvarez, M., Simonetta, F., Baker, J., Morrison, A. R., Wenokur, A. S., Pierini, A., et al. (2020). Indirect impact of PD-1/PD-L1 blockade on a murine model of NK cell exhaustion. Front. Immunol. 11, 7. doi:10.3389/fimmu.2020.00007 |
Bhattacharya, S., Andorf, S., Gomes, L., Dunn, P., Schaefer, H., Pontius, J., et al. (2014). ImmPort: disseminating data to the public for the future of immunology. Immunol. Res. 58 (2–3), 234–239. doi:10.1007/s12026-014-8516-1 |
Bindea, G., Mlecnik, B., Tosolini, M., Kirilovsky, A., Waldner, M., Obenauf, A. C., et al. (2013). Spatiotemporal dynamics of intratumoral immune cells reveal the immune landscape in human cancer. Immunity 39 (4), 782–795. doi:10.1016/j.immuni.2013.10.003 |
Bommhardt, U., Schraven, B., and Simeoni, L. (2019). Beyond TCR signaling: emerging functions of lck in cancer and immunotherapy. Int. J. Mol. Sci. 20 (14), 3500. doi:10.3390/ijms20143500
Bray, F., Ferlay, J., Soerjomataram, I., Siegel, R. L., Torre, L. A., and Jemal, A. (2018). Global cancer statistics 2018: GLOBOCAN estimates of incidence and mortality worldwide for 36 cancers in 185 countries. CA Cancer J. Clin. 68 (6), 394–424. doi:10.3322/caac.21492 |
Byrne, A., Savas, P., Sant, S., Li, R., Virassamy, B., Luen, S. J., et al. (2020). Tissue-resident memory T cells in breast cancer control and immunotherapy responses. Nat. Rev. Clin. Oncol. 17 (6), 341–348. doi:10.1038/s41571-020-0333-y |
Charoentong, P., Finotello, F., Angelova, M., Mayer, C., Efremova, M., Rieder, D., et al. (2017). Pan-cancer immunogenomic analyses reveal genotype-immunophenotype relationships and predictors of response to checkpoint blockade. Cell Rep. 18 (1), 248–262. doi:10.1016/j.celrep.2016.12.019 |
Chen, W., Zheng, R., Baade, P. D., Zhang, S., Zeng, H., Bray, F., et al. (2016). Cancer statistics in China, 2015. CA Cancer J. Clin. 66 (2), 115–132. doi:10.3322/caac.21338 |
Chung, H. C., Ros, W., Delord, J. P., Perets, R., Italiano, A., Shapira-Frommer, R., et al. (2019). Efficacy and safety of pembrolizumab in previously treated advanced cervical cancer: results from the phase II KEYNOTE-158 study. J. Clin. Oncol. 37 (17), 1470–1478. doi:10.1200/JCO.18.01265 |
Curti, B. D. (2018). Immunotherapy in advanced renal cancer–is cure possible? N. Engl. J. Med. 378 (14), 1344–1345. doi:10.1056/NEJMe1801682 |
Ding, L., and Chen, F. (2019). Predicting tumor response to PD-1 blockade. N. Engl. J. Med. 381 (5), 477–479. doi:10.1056/NEJMcibr1906340 |
Erman, B., Fırtına, S., Fışgın, T., Bozkurt, C., and Çipe, F. E. (2020). Biallelic form of a known CD3E mutation in a patient with severe combined immunodeficiency. J. Clin. Immunol. 40 (3), 539–542. doi:10.1007/s10875-020-00752-3 |
Fillon, M. (2020). Immune checkpoint inhibitors may be safe for patients with preexisting autoimmune disease. CA Cancer J. Clin. 70 (1), 3–4. doi:10.3322/caac.21587 |
Firtina, S., Ng, Y. Y., Ng, O. H., Nepesov, S., Yesilbas, O., Kilercik, M., et al. (2017). A novel pathogenic frameshift variant of CD3E gene in two T-B+ NK+ SCID patients from Turkey. Immunogenetics 69 (10), 653–659. doi:10.1007/s00251-017-1005-7 |
Fischer, A., de Saint Basile, G., and Le Deist, F. (2005). CD3 deficiencies. Curr. Opin. Allergy Clin. Immunol. 5 (6), 491–495. doi:10.1097/01.all.0000191886.12645.79 |
Frenel, J. S., Le Tourneau, C., O’Neil, B., Ott, P. A., Piha-Paul, S. A., Gomez-Roca, C., et al. (2017). Safety and efficacy of pembrolizumab in advanced, programmed death ligand 1-positive cervical cancer: results from the phase Ib KEYNOTE-028 trial. J. Clin. Oncol. 35 (36), 4035–4041. doi:10.1200/JCO.2017.74.5471 |
Fuehrer, M., Pannicke, U., Schuetz, C., Jacobsen, E. M., Schulz, A., Friedrich, W., et al. (2014). Successful haploidentical hematopoietic stem cell transplantation in a patient with SCID due to CD3ε deficiency: need for IgG-substitution 6 years later. Klin Padiatr 226 (3), 149–153. doi:10.1055/s-0033-1361142 |
Gaffney, S. G., Perry, E. B., Chen, P. M., Greenstein, A., Kaech, S. M., and Townsend, J. P. (2019). The landscape of novel and complementary targets for immunotherapy: an analysis of gene expression in the tumor microenvironment. Oncotarget 10 (44), 4532–4545. doi:10.18632/oncotarget.27027 |
Gil, J., Busto, E. M., Garcillán, B., Chean, C., García-Rodríguez, M. C., Díaz-Alderete, A., et al. (2011). A leaky mutation in CD3D differentially affects αβ and γδ T cells and leads to a Tαβ-Tγδ + B + NK + human SCID. J. Clin. Invest. 121 (10), 3872–3876. doi:10.1172/JCI44254 |
Gulati, P., Rühl, J., Kannan, A., Pircher, M., Schuberth, P., Nytko, K. J., et al. (2018). Aberrant lck signal via CD28 costimulation augments antigen-specific functionality and tumor control by redirected T cells with PD-1 blockade in humanized mice. Clin. Cancer Res. 24 (16), 3981–3993. doi:10.1158/1078-0432.CCR-17-1788 |
Hamanishi, J., Mandai, M., and Konishi, I. (2017). Immune checkpoint (PD-1 and CTIA-4) signal inhibitors for gynecologic oncology; up to date. Nihon Rinsho 75 (2), 234–244.
Hanahan, D., and Coussens, L. M. (2012). Accessories to the crime: functions of cells recruited to the tumor microenvironment. Cancer Cell 21 (3), 309–322. doi:10.1016/j.ccr.2012.02.022 |
Hart, M., Walch-Rückheim, B., Friedmann, K. S., Rheinheimer, S., Tänzer, T., Glombitza, B., et al. (2019). miR-34a: a new player in the regulation of T cell function by modulation of NF-κB signaling. Cell Death Dis. 10 (2), 46. doi:10.1038/s41419-018-1295-1 |
Hsu, J., Hodgins, J. J., Marathe, M., Nicolai, C. J., Bourgeois-Daigneault, M. C., Trevino, T. N., et al. (2018). Contribution of NK cells to immunotherapy mediated by PD-1/PD-L1 blockade. J. Clin. Invest. 128 (10), 4654–4668. doi:10.1172/JCI99317 |
Irizarry, R. A., Hobbs, B., Collin, F., Beazer-Barclay, Y. D., Antonellis, K. J., Scherf, U., et al. (2003). Exploration, normalization, and summaries of high density oligonucleotide array probe level data. Biostatistics 4 (2), 249–264. doi:10.1093/biostatistics/4.2.249 |
Jemal, A., Bray, F., Center, M. M., Ferlay, J., Ward, E., and Forman, D. (2011). Global cancer statistics. CA Cancer J. Clin. 61 (2), 69–90. doi:10.3322/caac.20107 |
Jiang, P., Gu, S., Pan, D., Fu, J., Sahu, A., Hu, X., et al. (2018). Signatures of T cell dysfunction and exclusion predict cancer immunotherapy response. Nat. Med. 24 (10), 1550–1558. doi:10.1038/s41591-018-0136-1 |
Kamarudin, A. N., Cox, T., and Kolamunnage-Dona, R. (2017). Time-dependent ROC curve analysis in medical research: current methods and applications. BMC Med. Res. Methodol. 17 (1), 53. doi:10.1186/s12874-017-0332-6 |
Kennedy, L. B., and Salama, A. K. S. (2020). A review of cancer immunotherapy toxicity. CA Cancer J. Clin. 70 (2), 86–104. doi:10.3322/caac.21596 |
Klintman, M., Buus, R., Cheang, M. C., Sheri, A., Smith, I. E., and Dowsett, M. (2016). Changes in expression of genes representing key biologic processes after neoadjuvant chemotherapy in breast cancer, and prognostic implications in residual disease. Clin. Cancer Res. 22 (10), 2405–2416. doi:10.1158/1078-0432.CCR-15-1488 |
Li, T., Fan, J., Wang, B., Traugh, N., Chen, Q., Liu, J. S., et al. (2017). TIMER: a web server for comprehensive analysis of tumor-infiltrating immune cells. Cancer Res. 77 (21), e108–e110. doi:10.1158/0008-5472.CAN-17-0307 |
Liu, J., Wu, Z., Wang, Y., Nie, S., Sun, R., Yang, J., et al. (2020). A prognostic signature based on immune-related genes for cervical squamous cell carcinoma and endocervical adenocarcinoma. Int. Immunopharmacol. 88, 106884. doi:10.1016/j.intimp.2020.106884 |
Liu, M., Sun, Q., Wang, J., Wei, F., Yang, L., and Ren, X. (2019b). A new perspective: exploring future therapeutic strategies for cancer by understanding the dual role of B lymphocytes in tumor immunity. Int. J. Cancer 144 (12), 2909–2917. doi:10.1002/ijc.31850 |
Matsuzaki, J., Tsuji, T., Chodon, T., Ryan, C., Koya, R. C., and Odunsi, K. (2019). A rare population of tumor antigen-specific CD4 + CD8 + double-positive αβ T lymphocytes uniquely provide CD8-independent TCR genes for engineering therapeutic T cells. J. Immunother. Cancer 7 (1), 7. doi:10.1186/s40425-018-0467-y |
McLachlan, J., Boussios, S., Okines, A., Glaessgen, D., Bodlar, S., Kalaitzaki, R., et al. (2017). The impact of systemic therapy beyond first-line treatment for advanced cervical cancer. Clin. Oncol. (R Coll. Radiol.) 29 (3), 153–160. doi:10.1016/j.clon.2016.10.002 |
Miao, Y. R., Zhang, Q., Lei, Q., Luo, M., Xie, G. Y., Wang, H., et al. (2020). ImmuCellAI: a unique method for comprehensive T-cell subsets abundance prediction and its application in cancer immunotherapy. Adv. Sci. (Weinh) 7 (7), 1902880. doi:10.1002/advs.201902880 |
Milowsky, M. I., Rumble, R. B., Booth, C. M., Gilligan, T., Eapen, L. J., Hauke, R. J., et al. (2016). Guideline on muscle-invasive and metastatic bladder cancer (European association of urology guideline): American society of clinical oncology clinical practice guideline endorsement. J. Clin. Oncol. 34 (16), 1945–1952. doi:10.1200/JCO.2015.65.9797 |
Otter, S. J., Chatterjee, J., Stewart, A. J., and Michael, A. (2019). The role of biomarkers for the prediction of response to checkpoint immunotherapy and the rationale for the use of checkpoint immunotherapy in cervical cancer. Clin. Oncol. (R Coll. Radiol.) 31 (12), 834–843. doi:10.1016/j.clon.2019.07.003 |
Patel, V. G., Oh, W. K., and Galsky, M. D. (2020). Treatment of muscle-invasive and advanced bladder cancer in 2020. CA Cancer J. Clin. 70 (5), 404–423. doi:10.3322/caac.21631 |
Pfaendler, K. S., and Tewari, K. S. (2016). Changing paradigms in the systemic treatment of advanced cervical cancer. Am. J. Obstet. Gynecol. 214 (1), 22–30. doi:10.1016/j.ajog.2015.07.022 |
Shi, M. J., Meng, X. Y., Wu, Q. J., and Zhou, X. H. (2019). High CD3D/CD4 ratio predicts better survival in muscle-invasive bladder cancer. Cancer Manag. Res. 11, 2987–2995. doi:10.2147/CMAR.S191105 |
Suryadevara, C. M., Desai, R., Farber, S. H., Choi, B. D., Swartz, A. M., Shen, S. H., et al. (2019). Preventing lck activation in CAR T cells confers treg resistance but requires 4-1BB signaling for them to persist and treat solid tumors in nonlymphodepleted hosts. Clin. Cancer Res. 25 (1), 358–368. doi:10.1158/1078-0432.CCR-18-1211 |
Torre, L. A., Bray, F., Siegel, R. L., Ferlay, J., Lortet-Tieulent, J., and Jemal, A. (2015). Global cancer statistics, 2012. CA Cancer J. Clin. 65 (2), 87–108. doi:10.3322/caac.21262 |
Wang, H., Lengerich, B. J., Aragam, B., and Xing, E. P. (2019a). Precision Lasso: accounting for correlations and linear dependencies in high-dimensional genomic data. Bioinformatics 35 (7), 1181–1187. doi:10.1093/bioinformatics/bty750 |
Wang, Q., Li, P., and Wu, W. (2019b). A systematic analysis of immune genes and overall survival in cancer patients. BMC Cancer 19 (1), 1225. doi:10.1186/s12885-019-6414-6
Wei, Q., Brzostek, J., Sankaran, S., Casas, J., Hew, L. S., Yap, J., et al. (2020). Lck bound to coreceptor is less active than free Lck. Proc. Natl. Acad. Sci. U S A. 117 (27), 15809–15817. doi:10.1073/pnas.1913334117 |
Yang, S., Wu, Y., Deng, Y., Zhou, L., Yang, P., Zheng, Y., et al. (2019). Identification of a prognostic immune signature for cervical cancer to predict survival and response to immune checkpoint inhibitors. Oncoimmunology 8 (12), e1659094. doi:10.1080/2162402X.2019.1659094 |
Yang, Y., Zang, Y., Zheng, C., Li, Z., Gu, X., Zhou, M., et al. (2020). CD3D is associated with immune checkpoints and predicts favorable clinical outcome in colon cancer. Immunotherapy 12 (1), 25–35. doi:10.2217/imt-2019-0145 |
Yoshihara, K., Shahmoradgoli, M., Mart¨nez, E., Vegesna, R., Kim, H., Torres-Garcia, W., et al. (2013). Inferring tumour purity and stromal and immune cell admixture from expression data. Nat. Commun. 4, 2612. doi:10.1038/ncomms3612 |
Yu, G., Wang, L. G., Han, Y., and He, Q. Y. (2012). clusterProfiler: an R package for comparing biological themes among gene clusters. Omics 16 (5), 284–287. doi:10.1089/omi.2011.0118 |
Zaretsky, J. M., Garcia-Diaz, A., Shin, D. S., Escuin-Ordinas, H., Hugo, W., Hu-Lieskovan, S., et al. (2016). Mutations associated with acquired resistance to PD-1 blockade in melanoma. N. Engl. J. Med. 375 (9), 819–829. doi:10.1056/NEJMoa1604958 |
Zhang, B., and Horvath, S. (2005). A general framework for weighted gene co-expression network analysis. Stat. Appl. Genet. Mol. Biol. 4, Article17. doi:10.2202/1544-6115.1128 |
Keywords: cervical squamous cell carcinoma, weighted gene co-expression network analysis, immune cells infiltration, prognosis, immunotherapy sensitivity
Citation: Zuo Z, Xiong J, Zeng C, Jiang Y, Xiong K, Tao H and Guo Y (2021) Exploration of a Robust and Prognostic Immune Related Gene Signature for Cervical Squamous Cell Carcinoma. Front. Mol. Biosci. 8:625470. doi: 10.3389/fmolb.2021.625470
Received: 03 November 2020; Accepted: 14 January 2021;
Published: 03 March 2021.
Edited by:
Matteo Becatti, University of Firenze, ItalyReviewed by:
Robert J. Canter, University of California, Davis, United StatesHubert Hackl, Medical University of Innsbruck, Austria
Copyright © 2021 Zuo, Xiong, Zeng, Jiang, Xiong, Tao and Guo. This is an open-access article distributed under the terms of the Creative Commons Attribution License (CC BY). The use, distribution or reproduction in other forums is permitted, provided the original author(s) and the copyright owner(s) are credited and that the original publication in this journal is cited, in accordance with accepted academic practice. No use, distribution or reproduction is permitted which does not comply with these terms.
*Correspondence: Hualin Tao, bHp5eHlqeXhAMTYzLmNvbQ==; Yongcan Guo, Z3VveW9uZ2Nhbl8yMDA0QDE2My5jb20=