 C. M. Santosh Kumar1*
 Kritika Chugh2
 Anirban Dutta3
 Vishnuvardhan Mahamkali4
 Tungadri Bose3
 Sharmila S. Mande3Shekhar C. Mande5
 Peter A. Lund1
- 1School of Biosciences and Institute of Microbiology and Infection, University of Birmingham, Birmingham, United Kingdom
- 2Department of Biotechnology and Bioinformatics, University of Rajasthan, Jaipur, India
- 3TCS Research, Tata Consultancy Services Ltd., Pune, India
- 4Australian Institute for Bioengineering and Nanotechnology (AIBN), The University of Queensland, Brisbane, QLD, Australia
- 5Laboratory of Structural Biology, National Centre for Cell Science (NCCS), Pune, India
The ability of chaperonins to buffer mutations that affect protein folding pathways suggests that their abundance should be evolutionarily advantageous. Here, we investigate the effect of chaperonin overproduction on cellular fitness in Escherichia coli. We demonstrate that chaperonin abundance confers 1) an ability to tolerate higher temperatures, 2) improved cellular fitness, and 3) enhanced folding of metabolic enzymes, which is expected to lead to enhanced energy harvesting potential.
Introduction
Chaperonins are found in nearly every organism across all domains of life, and are essential in all cases tested to date, although in some cases non-essential paralogues are found (Lund, 2009; Kumar, 2017). The GroE chaperonin system of E. coli, consisting of the 60 kDa GroEL and the 10 kDa GroES proteins assembled into ring complexes of 14 and seven sub-units, respectively, is encoded by the groE operon (Tilly and Georgopoulos, 1982; Bukau and Horwich, 1998; Balchin et al., 2016). This operon is expressed principally from two promoters, one utilized in the presence of housekeeping sigma factor σ70, and the other, which is strongly induced due to the accumulation of unfolded proteins, in the presence of the alternative sigma factor, σ32 (RpoH) (Kusukawa and Yura, 1988; Lund, 2001; Kumar et al., 2015; Schumann, 2017). As σ32 levels respond to unfolded protein, this provides a feedback loop to maintain proteostasis (Kim et al., 2013). When cells are shifted to heat shock temperatures between 42 and 46°C, GroEL levels increase by 5–10 fold, reaching up to 12% of the entire cellular proteome (Martin et al., 1992). These increased levels interact more extensively with the proteome and are assumed to prevent misfolding or assist refolding of heat-stressed proteins (Martin et al., 1992; Llorca et al., 1998; Houry et al., 1999). Cells that cannot mount an unfolded protein response due to rpoH deletion are extremely temperature sensitive, and selection for pseudo-revertants of these strains at elevated temperatures yields up-promoter mutations in the groE promoter (Kusukawa and Yura, 1988). GroE is thus important even under normal growth conditions, and indeed GroEL and GroES are respectively the 20th and 21st most abundant proteins in E. coli (excluding ribosomal proteins), with sufficient protein being made under non-stressed conditions to produce approximately 2,800 complexes of GroEL and 5,700 complexes of GroES (Li et al., 2014). Other chaperones that are also abundant include the ribosome bound trigger factor (TF), which is the 19th, and the Hsp70 homologue, DnaK, which is the 27th most abundant. The high levels of all these chaperones indicates their key roles in cell growth. Although combined loss of TF and DnaK is deleterious to cells, groEL and groES are the only chaperone encoding genes in E. coli that are essential under all conditions (Fayet et al., 1989).
GroE (GroEL and GroES) assists the folding of 10–15% cellular proteins (Houry et al., 1999), many of which are essential (Kerner et al., 2005). GroE’s ability to fold “folding-compromised” proteins (Houry et al., 1999; Fares et al., 2002; Kerner et al., 2005; Tokuriki and Tawfik, 2009) is consistent with a “genetic capacitance” function. Many studies with different heterologous proteins have shown that GroE can enhance their folding (Tokuriki et al., 2008; Tokuriki and Tawfik, 2009; Wyganowski et al., 2013; Ishimoto et al., 2014; Durao et al., 2015). In addition, some deleterious mutations are retained in the genome upon overexpression of groE, probably due to chaperonin-buffered folding of polypeptides whose folding pathway has been perturbed (Van Dyk et al., 1989; Fares et al., 2002; Williams and Fares, 2010; Sabater-Munoz et al., 2015). However, since GroE is an active ATPase, its overproduction could be deleterious to the cell, owing to the depletion of cellular energy pools. Here, we have assessed the effect of GroE overproduction on the growth characteristics and thermal tolerance of E. coli and used proteomics and in silico flux balance analysis (FBA) to determine the likely impact of chaperonin overproduction on the metabolic advantage and consequent fitness of the organism.
Materials and Methods
Materials, Plasmids, Bacterial Strains and Growth Conditions
All chemicals were from Sigma, Inc. Bacterial growth media and media supplements were from HiMedia Laboratories, Inc., Mumbai, India. Phusion polymerase for colony PCR was purchased from New England Biolabs Inc., United States. GroE expression plasmids, pBAD-GSL and pTrc-GSL were generated by cloning GroE operon into NcoI and HindIII sites on plasmids pBAD24 (Guzman et al., 1995) and pTrc99A (Amann et al., 1988), respectively. The groE conditional mutant strain, E. coli LG6, was a kind gift from Arthur Horwich, Yale University, United States (Horwich et al., 1993). This strain produces GroE at levels similar to the wildtype at 30°C upon induction (Supplementary Figure 1). Oligonucleotide primers were purchased from Integrated DNA Technologies, Inc., Coralville, IA, United States.
Construction and Validation of Strains Producing High and Low GroE Levels
To enable control of GroE levels independently from the growth temperature, two strains that differentially express groE were generated from the E. coli strain LG6, in which the chromosomal groE promoter has been replaced with a Plac promoter (Horwich et al., 1993). A high level GroE expression strain, GL-Ht (for GroEL High pTrc), was obtained by transforming LG6 with pTrc-GSL and a lower level GroE expression strain, GL-Lt (for GroEL Low pTrc) was obtained by transforming with the control plasmid pTrc99A (Amann et al., 1988). The scheme for the generation of these phenotypes is illustrated in Figure 1. To confirm the expression levels, these strains were cultured in the presence of 0.2% D-lactose to induce chromosome and plasmid borne groE operons, for 3 h at 30°C. The resulting cells were suspended in lysis buffer containing 50 mM HEPES:KOH pH 7.5 and 150 mM NaCl, 1 mM EDTA, and 1 mM PMSF, mixed with Lysing Matrix E and lysed by homogenization in FastPrep (M. P. Biomedicals, Irvine, CA, United States). Lysates were centrifuged at 13,000 rpm for 20 min to obtain soluble lysates. The soluble lysates were resolved on 12.5% SDS-PAGE and 12% Tricine gel followed by Coomassie Brilliant Blue staining to detect the levels of GroEL and GroES, respectively. In parallel, these lysates were probed with an anti-GroEL monoclonal antibody (1.10B) at 1:100 dilution and the blots were developed by BCIP/NBT-Purple Liquid Substrate System (Sigma Aldrich Inc., St. Louis, MO, United States). In addition to these strains, two strains that enable independent regulation of the chromosome and plasmid borne copies of groE operon were generated by transforming LG6 with pBAD-GSL and pBAD24 to result in high and low expression strains, GL-Hb and GL-Lb, respectively. These strains were cultured in the presence of 0.2% lactose plus 0.2% arabinose to obtain the high and low expression levels (Supplementary Figure 2A).
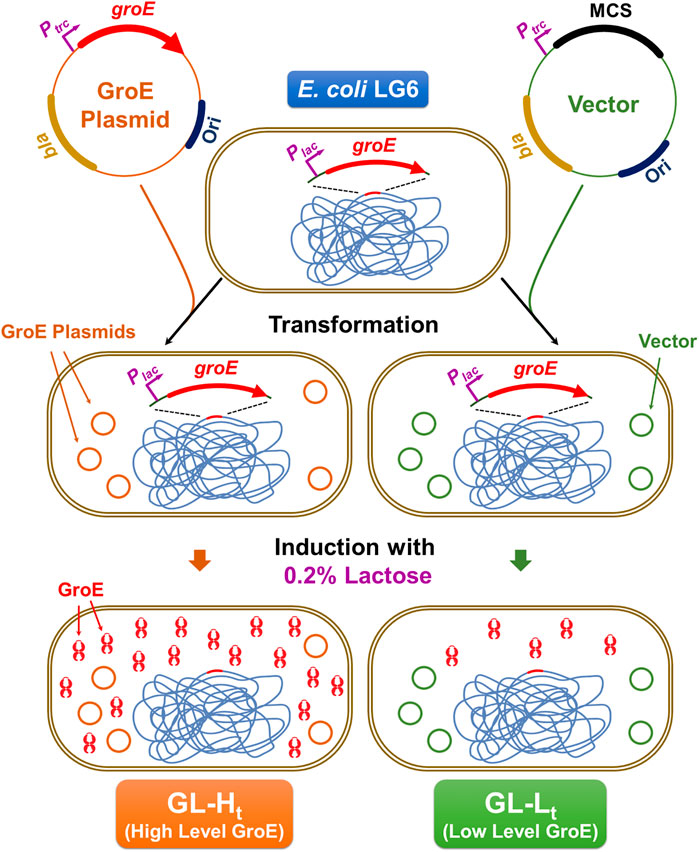
FIGURE 1. Construction of GL-Lt and GL-Ht Strains. In E. coli LG6, the groE operon is under the control of the inducible Ptrc promoter. This strain was transformed with either a plasmid expressing groE under the control of lactose (GroE Plasmid), pTrc-GSL or its empty vector (Vector), pTrc99a. Upon culturing in the presence of lactose, GL-Ht produces elevated levels of GroEL and GroES, due to the induction of chromosomal and plasmid-borne groE operon, while GL-Lt will have lower production of GroES and GroEL due to the induction of only the chromosomal groE copy.
Temperature Sensitivity Assessment
The extent to which GroE overproduction enables temperature tolerance was assessed using a complementation assay (Kumar et al., 2009; Chilukoti et al., 2015). Actively growing cultures of GL-Ht and GL-Lt were normalized for OD600, serially diluted, and spotted onto eight LB agar plates supplemented with 0.2% D-lactose. The plates were incubated at 17, 20, 22, 25, 30, 37, 40, 42, 45, 46, and 48°C. Wild type MG1655 harboring pTrc-GSL or empty vector (pTrc99A), respectively, were included as controls.
Competition and Estimation of Relative Fitness
GL-Hb and GL-Lb cells were subjected to competitive serial culturing as described previously (Zambrano et al., 1993; Vulic and Kolter, 2001; Smith, 2011). Briefly, equal number of cells from these two cultures were mixed and grown in fresh LB supplemented with 0.2% L-arabinose and 0.2% D-lactose. This mixed culture was grown to stationary phase at 30°C, recovered, labelled Passage-1 and used to generate the second passage (Figure 3A). Serial sub-culturing was repeated for a further 20 passages (∼700 generations). At each passage, a fraction of the cultures was serially diluted up to 10−7 dilution in LB broth and spread on LB agar plates supplemented with 0.2% D-lactose, which supports the growth of the cells derived from either strain. The resulting colonies at each passage, in the range of 23–28 colonies, were screened using colony PCR to identify whether colonies were derived from either GL-Hb or GL-Lb cells. Colony PCR with the PBADF (5′-CTGTTTCTCCATACCCGTT-3′) and PBADR (5′-CTCATCCGCCAAAACAG-3′) primers, which bind upstream and downstream of the MCS on the parental vector pBAD24, results in the amplification of 2.1 and 0.3 kb fragments from the pBAD-GSL and pBAD24 vectors, harbored by the GL-Hb and GL-Lb cells, respectively. Relative competitive index (CI), a measure of relative fitness, was calculated for each phenotype as the ratio of the proportion of a particular cell type at the final and initial generations (Monk et al., 2008; Macho et al., 2010; van Opijnen and Camilli, 2013).
Proteomic Analysis
Equal number of cells from exponentially growing cultures (OD600 = ∼0.6) of GL-Hb or GL-Lb strains were harvested, suspended in lysis buffer (50 mM HEPES:KOH pH: 7.5 and 150 mM NaCl, 1 mM EDTA, and 1 mM PMSF), lysed by sonication, and the soluble protein fractions were recovered by centrifugation at 12,000 rpm for 20 min 200 µg protein from the soluble fractions of each lysate were resolved through 2D PAGE following the standard protocols. Briefly, the lysates were resolved on the first dimension through a 7 cm Immobilized pH Gradient (IPG) strip of 3–10 pH range, followed by 10% SDS-PAGE on the second dimension. The separated proteins were stained with Coomassie brilliant blue and intensities of the stained protein spots were compared between the two gels using densitometry. This experiment was repeated three times to identify the spots that exhibited consistent differential enrichment between the strains. Differentially enriched spots between the two lysates were picked and identified by tandem mass-spectrometry in an LTQ Orbitrap Mass Spectrometer (Thermo Fisher Scientific Inc., Waltham, MA, United States). The differentially enriched proteins were identified using MASCOT (Hirosawa et al., 1993) search against UniProtKB/TrEMBL (UniProt, 2019) and RefSeq (O'Leary et al., 2016) databases. The spot identification was done in collaboration with the Centre for Cellular and Molecular Platforms, Bangalore, India.
Flux Balance Analysis of the GL-Hb and GL-Lb Strains
E. coli genome-scale metabolic network iJO1366 (Blais et al., 2013) was used for performing the FBA simulations. The iJO1366 model was first simulated using a standard energy source (equivalent of a glucose-supplemented minimal media) to obtain the steady state fluxes through each of the reactions (Orth et al., 2011). The objective function of this FBA simulation was to maximize the biomass production, while using some “default constraints” (lower- and upper-bounds of fluxes through each reaction) derived from the literature (Blais et al., 2013). Following this preliminary assessment of the E. coli cell’s metabolic potential, two independent FBA simulations were performed, each of which corresponded to the enzyme expression/enrichment profiles of the GL-Hb and GL-Lb strains. During each of these simulations the reaction flux values were appropriately constrained, based on the results from the preliminary assessment and the corresponding enzyme expression/enrichment profiles (Supplementary File 2). Incorporating enzyme expression profiles into FBA simulations was performed with our software tool “TransFlux,” developed in-house, and housed at http://www.nccs.res.in/TrasFlux/index.jsp. Details of the parameters and the principles applied in FBA are presented in the Supplementary Material methods section.
Results
Construction of GroE Overproducing Strains
To investigate the effect of chaperonin overproduction on E. coli, we constructed two chaperonin producing strains, GL-Ht and GL-Lt, which produce high and low levels of GroE (Figure 1). These strains were derived from strain E. coli LG6 (Horwich et al., 1993), in which the PgroE promoter is replaced by the Plac promoter, by transforming with pTrc-GSL, which overexpress groE operon upon induction with lactose, or its parental plasmid pTrc99A. SDS-PAGE confirmed significant overproduction of GroEL (Supplementary Figure 1A) in GL-Ht compared to GL-Lt. From Western blotting of the lysates, we estimate that GroEL levels are twenty-fold greater in GL-Ht than in GL-Lt (Supplementary Figure 1B). The expression levels of GroEL in GL-Lt were lower than the MG1655, where wildtype PgroE promoter drives the expression (Supplementary Figure 1) (Chapman et al., 2006). Further, GroES was significantly overproduced in GL-Ht compared to GL-Lt (Supplementary Figure 1C).
GroEL-GroES Overproducing Strains Showed Enhanced Temperature Tolerance
As GroE is involved in protection against thermal stress, we analyzed the impact of different GroE levels in GL-Ht and GL-Lt on growth at temperatures ranging from 17 to 48°C (Figure 2) (Chilukoti et al., 2015). E. coli MG1655 and MG1655 hosting pTrc-GSL were included for comparison. As expected, GL-Lt cells exhibited heat and cold sensitive phenotypes and consequently showed poor growth at many temperatures, consistent with previous observations that sufficient levels of GroE are required for growth over a wide temperature range (Ferrer et al., 2003). Further, MG1655 showed much better temperature tolerance than GL-Lt, showing the importance of the heat-shock regulation of the PgroE promoter. The strains harboring pTrc-GSL tolerated higher temperatures, up to 48°C, than the vector-only MG1655, where groE expression is temperature regulated, suggesting that higher levels of GroE enable higher temperature tolerance.
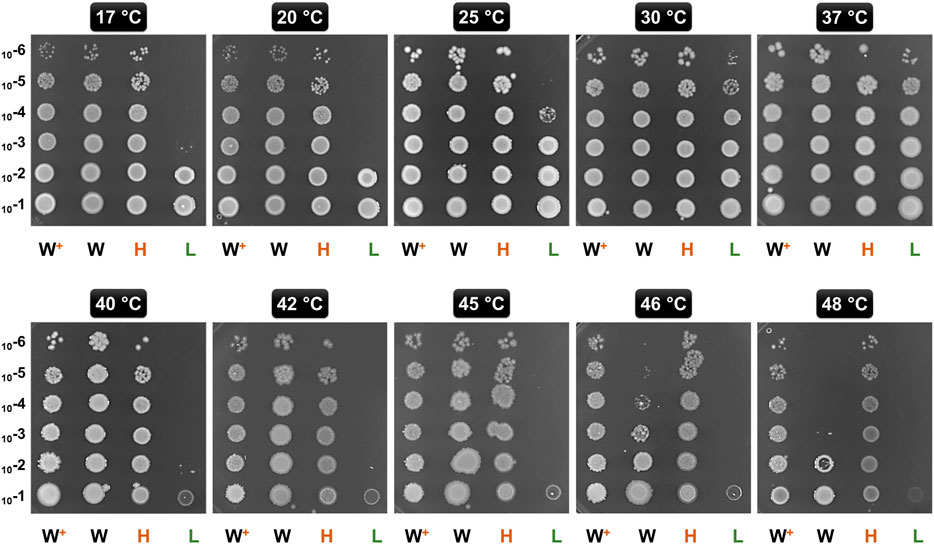
FIGURE 2. Temperature Tolerance upon Chaperonin Overproduction. Ten-fold serially diluted (10−1 through 10−6) exponentially growing cultures of GL-Ht (H), GL-Lt (L), MG16155 (W), and MG1655 with pTrc-GSL (W+) were spotted onto LB agar plates supplemented with lactose. These plates were incubated at the indicated temperatures.
GroEL-GroES Overproducing Strain Exhibited Fitness Advantage in Competition Culture
Since higher levels of chaperonins led to a growth advantage, we examined whether this translated to a fitness advantage even under low stress conditions, by competing two strains with different GroE levels. Since the two strains showed similar growth profiles on the plates (Figure 2) and in independent liquid cultures at 30°C (Supplementary Figure 3), we chose this temperature for the competition culture. To do these experiments, we needed to be able to control the plasmid borne and chromosomal copies of the groE operon independently. Therefore, we constructed two new strains with a PBAD based plasmid expression system, called GL-Hb (high expression) and GL-Lb (low expression) strains. Similar to GL-Ht, GL-Hb showed several folds higher GroE induction levels (Supplementary Figure 2A) and temperature resistance (Supplementary Figure 2B). The cultures of GL-Hb and GL-Lb were competed for 20 passages (∼700 generations) and their relative fitness(s) were estimated (Figure 3A) as described in Materials and Methods (Monk et al., 2008; Macho et al., 2010; van Opijnen and Camilli, 2013). The high groE expressing GL-Hb outcompeted GL-Lb (Figure 3B), indicating that chaperonin level is an important fitness determinant.
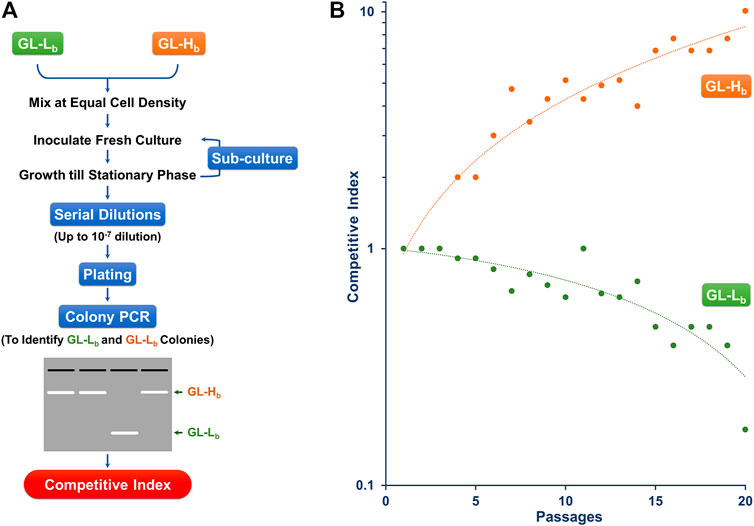
FIGURE 3. Chaperonin Depletion leads to Lower CI (A) Strategy for Determining the CI for GL-Lb and GL-Hb strains. Stationary phase cultures of GL-Lb and GL-Hb strains were mixed at equal cell density, grown to stationary phase and sub-cultured in fresh media for 20 continuous passages. Cells recovered at each passage were serially diluted as indicated, spread on LB agar plates and the resulting colonies were scored for their phenotype (GL-Lb or GL-Hb), by colony PCR, using vector specific oligonucleotide primers (B) CI, as a degree of fitness, was calculated at every passage from a ratio of proportion of the cells with a particular phenotype and plotted as a function of number of passages. CI trend was similar among the three independent experiments.
Proteomic Analysis Revealed Preferential Enrichment of Metabolic Enzymes in GroEL-GroES Overproducing Strains
Overproduction of a chaperonin is likely to enrich the levels of folded proteins in the cells, while unfolded or misfolded proteins tend to remain insoluble and thereby targeted to either the inclusion bodies or marked for degradation (Samuelson, 2011). Given this context, we investigated the proteomes of GL-Hb and GL-Lb cells, to identify what might account for the differences in fitness. Both strains were grown under identical conditions and their soluble proteome profiles (on 2D PAGE) were compared for relative abundance (Supplementary Figure 4; Table 1). Many of the identified proteins were known chaperonin clients belonging to either classes I and II (Kerner et al., 2005), class IV (Fujiwara et al., 2010) or the clients identified exclusively in Chapman et al. (2006), which here we have denoted as class V. However, several proteins that were identified as being differentially expressed were not known clients (Table 1), suggesting that either chaperonin overexpression can indirectly affect the folding of these non-client proteins or that the chaperonin client base is larger than currently understood. We noted that none of the obligate class III GroEL clients (Kerner et al., 2005) were relatively enriched in either strain, showing that there is sufficient chaperonin activity for folding these clients in the GL-Lb strain. Notably, the outer membrane proteins, OmpC and OmpF, which are involved in metabolite import and are known GroE clients (Kerner et al., 2005), were enriched in the soluble proteome of GL-Lb. The higher level of OmpC and OmpF in the soluble fraction of GL-Lb suggested a lower proportion of these proteins might be reaching the outer membrane in these strains. We therefore quantified the relative levels of OmpC and OmpF in membrane fractions of both pairs of strains, and confirmed that the levels were lower in both GL-Lb and GL-Lt (Supplementary Figure 5). Further, a higher instability index (obtained from Expasy ProtParam tool), which is a reverse measure of protein stability (Guruprasad et al., 1990; Gasteiger et al., 2005) was observed for the proteins enriched in GL-Hb strain, suggesting that their enrichment in the chaperonin overexpressing condition may be linked to lower stability and hence a greater chaperonin requirement. The enrichment of TF in GL-Lb (Supplementary Figure 1A; Table 1), is consistent with previously reported interactions between TF and GroE (Kandror et al., 1995; Kandror et al., 1997) and suggests TF may be able to partially compensate for low levels of chaperonin function in GL-Lb. Furthermore, enrichment of several metabolic enzymes in the GL-Hb strain, suggested a higher rate of metabolism in this strain. To evaluate this hypothesis, we collated publicly available E. coli proteomic data from the paxdb database (Wang et al., 2012), screened for proteins that were co-enriched with GroE across different experiments and identified 404 proteins that showed significant correlation, in expression levels, with GroE (Pearson correlation co-efficient ≥ 0.7, p < 0.05). Interestingly, a GO enrichment analysis of this set of proteins revealed that majority of these proteins were involved in metabolism and energy production, including multiple GO terms related to carbohydrate metabolism (Table 2).
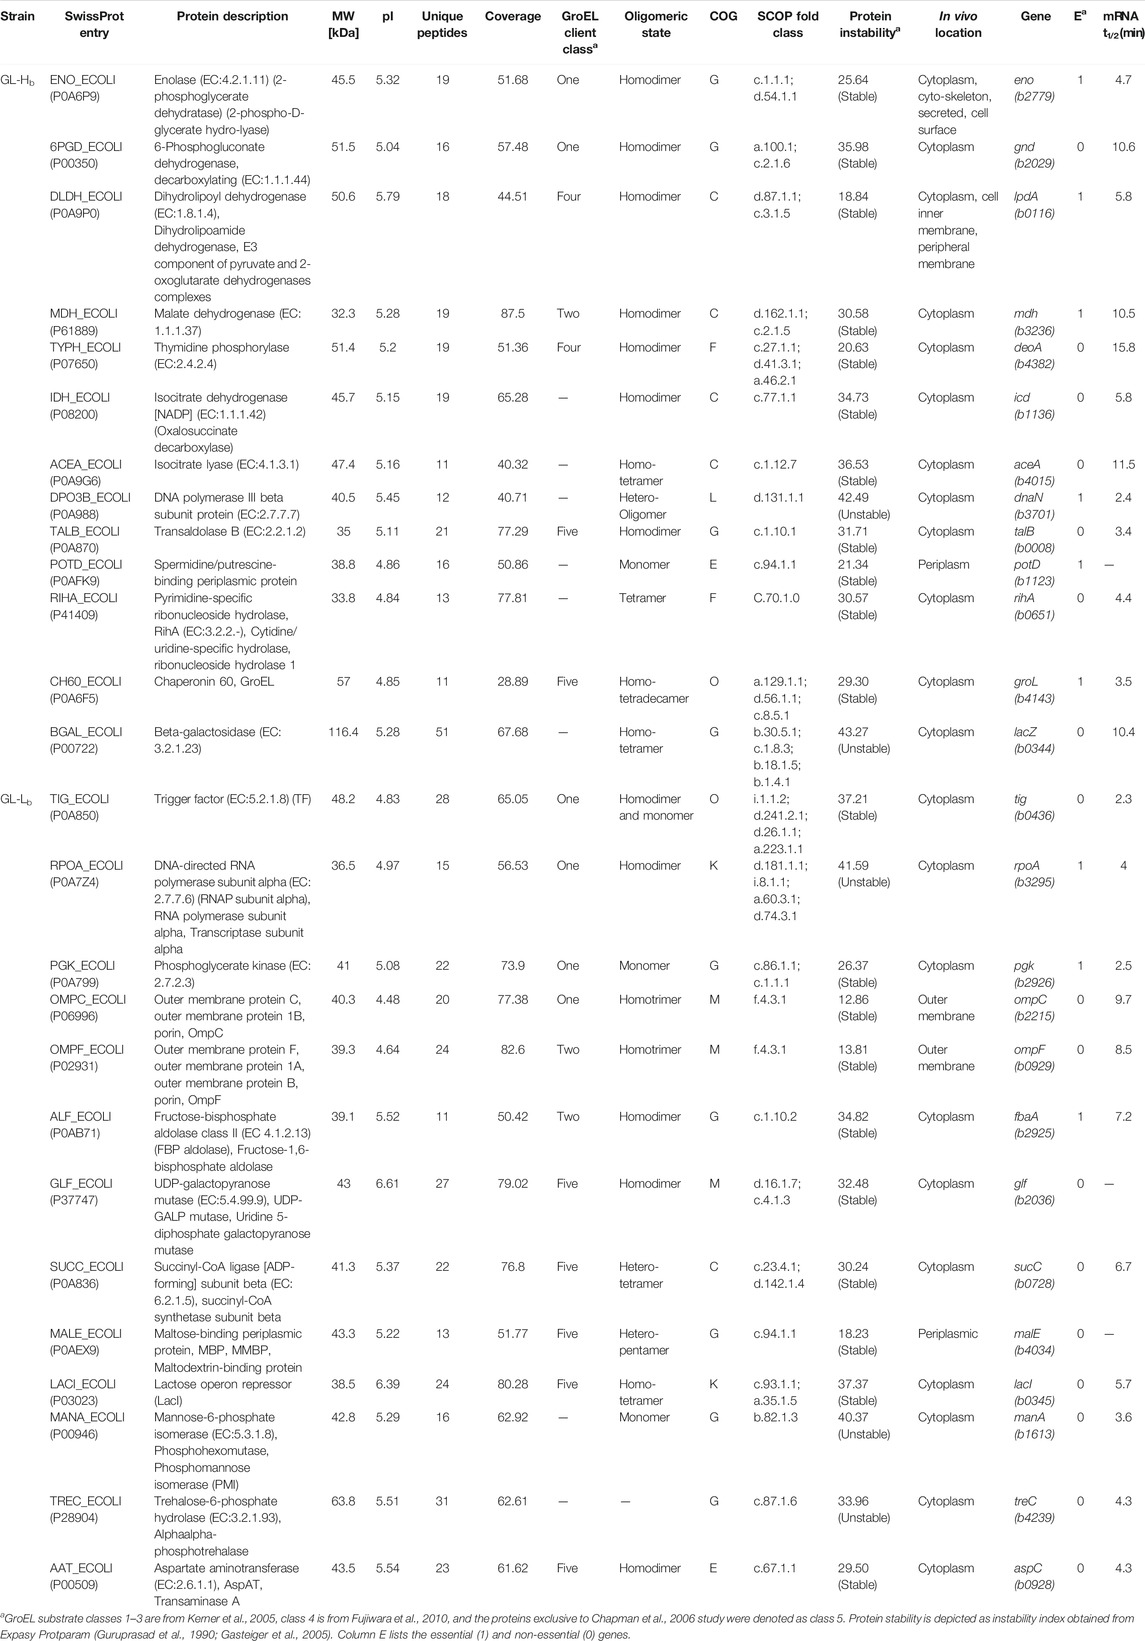
TABLE 1. Properties of the differentially enriched proteins in GL-Hb and GL-Lb strains.
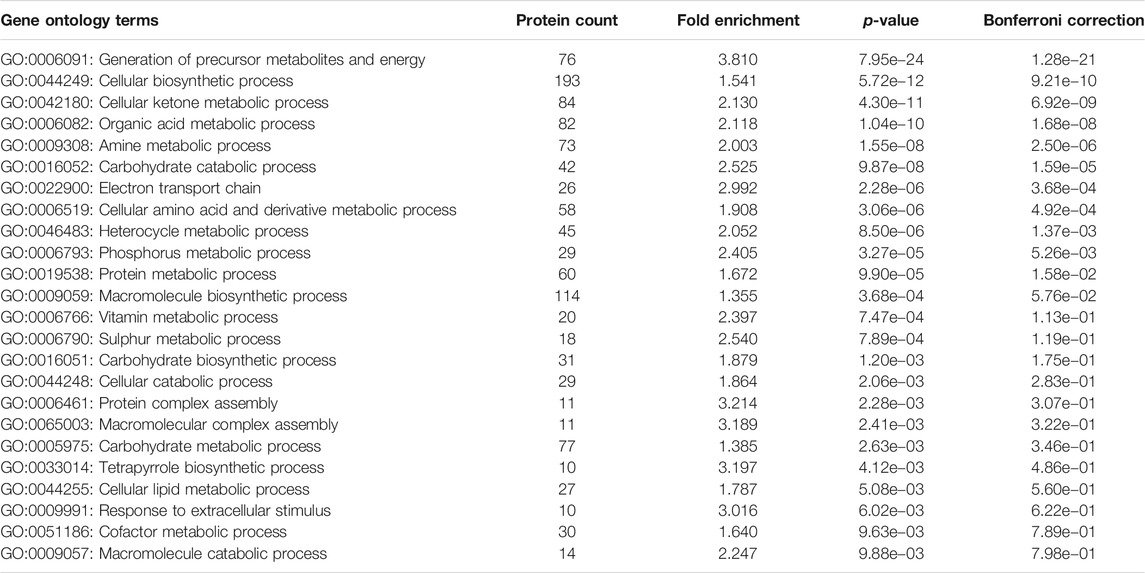
TABLE 2. Enriched Gene Ontology terms (level 3 - biological process terms), associated with the 404 proteins that were co-enriched/expressed with GroE across different experiments.
Flux Balance Analysis of Oxidative Phosphorylation in High- and Low-GroEL Strains.
Considering the preferential enrichment of metabolic enzymes upon GroE overproduction, we adopted an FBA approach (Orth et al., 2011; Blais et al., 2013) to assess how the differential enrichment of metabolic enzymes in the GL-Lb and GL-Hb strains would translate into altered metabolic states and cellular fitness. The FBA simulation analyses were carried out using “TransFlux” (available at: http://www.nccs.res.in/TransFlux/index.jsp), an in-house tool with a module to incorporate gene expression/proteomic profiles in the FBA framework. The proteomic profiles (Table 1) and observations from E. coli gene expression microarray studies, derived from the Many Microbe Microarrays database (M3D, www.m3d.mssm.edu) (Faith et al., 2008) were utilized to constrain fluxes though respective reactions, while performing two independent FBA simulations, each of which corresponded to the expression/enrichment profiles of the enzymes enriched in GL-Lb and GL-Hb strains. As expected, higher flux was observed through several pathways of carbon metabolism including glycolysis, gluconeogenesis, citric acid cycle (TCA cycle) and its anaplerotic reactions, and alternate carbon metabolism, in the simulated GL-Hb strain (Table 3). These pathways appear to be supported by enhanced import of glucose and glycerol (Supplementary File 2). Pathways corresponding to several glucogenic amino acids metabolism and energy generating oxidative phosphorylation were enriched in this strain. However, the pathways leading to the toxic methylglyoxal synthesis were also enriched in the GL-Hb strain (Table 3). We also noted that pathways leading to the metabolism of membrane lipids, pyruvic acid, pentose sugars, ubiquinone and salvage of nucleotides are enriched in the GL-Lb strain. Overall, FBA simulations indicated that the metabolic enzymes that were enriched in GL-Hb may lead to higher metabolic flux in this strain (Table 3; Supplementary Material).
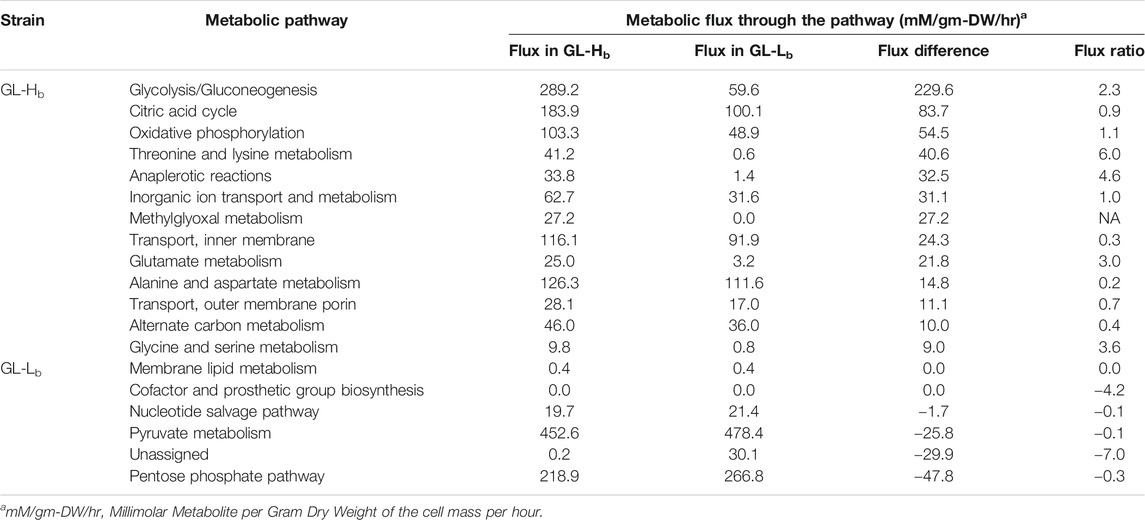
TABLE 3. Cumulative metabolic flux through major pathways in simulated GL-Lb and GL-Hb strains as obtained through Flux Balance Analysis. Log two fold-change of fluxes of GL-Hb and GL-Lb are indicated in the Flux Ratio column.
Discussion
Over- or under-production of chaperonins in several organisms has been demonstrated to perturb rates of proteolysis (Martinez-Alonso et al., 2010), influence growth rates, and alter the expression levels of compensatory chaperones like DnaK (Lemos et al., 2007). Here we present a simple model system to study the effects of GroE overproduction (Figure 1). We demonstrate that the overexpression of GroE chaperonin results in enhanced thermal tolerance (Figure 2) and competitive advantage (Figure 3). GroEL is known to be required for growth at low (Ferrer et al., 2003) and high (Guisbert et al., 2004) temperatures. Consistent with this, the GL-Lb and GL-Lt strains exhibited both cold and heat sensitive phenotypes (Figure 2). Proteomic studies (Table 1) followed by FBA (Tables 2, 3) suggest that the acquired fitness advantage could be attributed to an enriched set of metabolic enzymes. Chaperonin depletion was observed to induce the enrichment of the compensatory chaperone, TF (Supplementary Figure 1A; Table 1), which may act as a holdase for the GroE client proteins (Hartl and Hayer-Hartl, 2002). Interestingly, while GroE is more abundant than TF in E. coli (Zou et al., 2014), TF is observed to be abundant in mycoplasma which lack the groE operon (Bang et al., 2000; Weiner et al., 2003; Musatovova et al., 2006; Lund, 2009), suggesting that higher levels of TF might be needed in such bacteria to compensate for the chaperonin deficiency. The TF - GroEL interplay, owing to their overlapping functions and client-base (Bhandari and Houry, 2015; Avellaneda et al., 2017), has been demonstrated both in vitro (Kandror et al., 1995) and in vivo in E. coli (Kandror et al., 1997). Therefore, it seems likely that TF enrichment in GL-Lb is compensating for GroE depletion and that TF may be acting on some clients as a holdase (Singhal et al., 2015). Further, the enrichment of the outer-membrane proteins OmpC and OmpF in the soluble proteome of GL-Lb suggests that these known GroEL client proteins failed to reach their normal final cellular destination (the outer membrane) and may have remained soluble, possibly in a TF-bound state. The reduced levels of these porins in the membranes of GL-Lb and GL-Lt strains (Supplementary Figure 5) might be responsible, in part, for the lower metabolite transport and metabolic flux in this strain (Table 3). TF was not upregulated in the wildtype strain (MG1655), despite lower GroE levels (Supplementary Figure 1), as GroE levels in this strain respond directly to levels of unfolded proteins. Furthermore, a different mode of GroE depletion resulted in the enrichment of DnaK (Calloni et al., 2012), which exhibits significant functional overlap with TF (Teter et al., 1999; Deuerling et al., 2003; Genevaux et al., 2004). The higher fitness of the GroES and GroEL over-producing strains under the conditions of our experiments is likely to be associated with fitness costs under other conditions (Figures 2, 3), otherwise it would be expected that higher expression would have evolved.
We demonstrate a direct relation between chaperonin abundance and competitive fitness. However, the evolution has not selected for intracellular chaperonin levels as high as the ones used in our experiments. The predictions from FBA simulations provide some clues that may explain why this has not occurred. Although enhanced glycolysis, TCA cycle and oxidative phosphorylation in the GL-Hb cells increase cellular energy currency, FBA simulations for the GL-Hb strain predicted an enhanced production of a toxic side product, methylglyoxal (Table 3), a very toxic three-carbon aldehyde that can inhibit E. coli growth at millimolar concentrations (Kayser et al., 2005; Weber et al., 2005). Therefore, evolution might have selected a balance in metabolic states between energy production and methylglyoxal toxicity, which would have, in turn, selected for an optimal level of chaperonin production. The fact that chaperonins are active ATPases provides another possible answer to this question. Overabundance of chaperonins might be linked to ATP depletion and consequent reduced growth (Sabater-Munoz et al., 2015). Thus, very high levels of chaperonin expression may have been selected against during the course of evolution. These explanations are not exhaustive, and the final level of chaperonin expression selected for is likely to result from a balance of optimizing fitness, due to multiple different factors.
Our analysis showed that GroE over-production results in several pleiotropic consequences that can enhance cellular fitness under the tested conditions. These observations need to be probed further to enhance our understanding of the precise role of the chaperone-client interactions in influencing fitness and, ultimately, evolution. A similar system could be advantageous in studying the effect of chaperonin overproduction in different microbes, especially the pathogenic bacteria with multiple chaperonins (Lund, 2009; Kumar, 2017).
Data Availability Statement
The original contributions presented in the study are included in the article/Supplementary Material, further inquiries can be directed to the corresponding author.
Author Contributions
CK did principal experiments. KC did proteomics experiments, AD, TB, VM, and SSM did the FBA, SCM and PL monitored the initial and later parts of the experiments.
Funding
The project is currently funded by the Biotechnology and Biological Sciences Research Council Responsive mode grant (BB/S017526/1). CK was a Newton International Fellow (NF161469) sponsored by the Royal Society, British Academy and Academy of Medical Sciences, United Kingdom. Initial part of this work was supported by grants from the Department of Biotechnology, India (BT/PR3260/BRB/10/967/2011).
Conflict of Interest
Authors AD, TB, and SSM are employed by the company TCS Research division in the Tata Consultancy Services Ltd.
The remaining authors declare that the research was conducted in the absence of any commercial or financial relationships that could be construed as a potential conflict of interest.
Publisher’s Note
All claims expressed in this article are solely those of the authors and do not necessarily represent those of their affiliated organizations, or those of the publisher, the editors and the reviewers. Any product that may be evaluated in this article, or claim that may be made by its manufacturer, is not guaranteed or endorsed by the publisher.
Acknowledgments
We would like to acknowledge the support from Biotechnology and Biological Sciences Research Council Responsive mode grant (BB/S017526/1). CK was a Newton International Fellow (NF161469) sponsored by the Royal Society, British Academy and Academy of Medical Sciences, United Kingdom. We would like to thank, Arthur Horwich for the GroE depletion strain, E. coli LG6 and cCAMP, Bangalore for assistance in proteomic studies. We thank Abhijit Sardesai and Gaurang Mahajan for helpful discussions, Melanie Swannell, Amanda Rossiter, Ian Henderson, Anna Schager, Chistopher Icke, Shahida Rafique, Nitin Bayal, Sapna Sugandhi and Surbhi Dhingra for support in the initial studies, and Ishita Verma for helping in designing the TransFlux website. SSM, AD, and TB are employees of TCS Research (Tata Consultancy Services Ltd., Pune, India), and would like to acknowledge TCS for its support. Initial part of this work was supported by grants from the Department of Biotechnology, India (BT/PR3260/BRB/10/967/2011).
Supplementary Material
The Supplementary Material for this article can be found online at: https://www.frontiersin.org/articles/10.3389/fmolb.2021.669996/full#supplementary-material
References
Amann, E., Ochs, B., and Abel, K.-J. (1988). Tightly Regulated Tac Promoter Vectors Useful for the Expression of Unfused and Fused Proteins in Escherichia coli. Gene 69 (2), 301–315. doi:10.1016/0378-1119(88)90440-4
Avellaneda, M. J., Koers, E. J., Naqvi, M. M., and Tans, S. J. (2017). The Chaperone Toolbox at the Single-Molecule Level: From Clamping to Confining. Protein Sci. 26 (7), 1291–1302. doi:10.1002/pro.3161
Balchin, D., Hayer-Hartl, M., and Hartl, F. U. (2016). In Vivo aspects of Protein Folding and Quality Control. Science 353 (6294), aac4354. doi:10.1126/science.aac4354
Bang, H., Pecht, A., Raddatz, G., Scior, T., Solbach, W., Brune, K., et al. (2000). Prolyl Isomerases in a Minimal Cell. Eur. J. Biochem. 267 (11), 3270–3280. doi:10.1046/j.1432-1327.2000.01355.x
Bhandari, V., and Houry, W. A. (2015). Substrate Interaction Networks of the Escherichia coli Chaperones: Trigger Factor, DnaK and GroEL. Adv. Exp. Med. Biol. 883, 271–294. doi:10.1007/978-3-319-23603-2_15
Blais, E. M., Chavali, A. K., and Papin, J. A. (2013). Linking Genome-Scale Metabolic Modeling and Genome Annotation. Methods Mol. Biol. 985, 61–83. doi:10.1007/978-1-62703-299-5_4
Bukau, B., and Horwich, A. L. (1998). The Hsp70 and Hsp60 Chaperone Machines. Cell 92 (3), 351–366. doi:10.1016/s0092-8674(00)80928-9
Calloni, G., Chen, T., Schermann, S. M., Chang, H.-c., Genevaux, P., Agostini, F., et al. (2012). DnaK Functions as a central Hub in the E. coli Chaperone Network. Cel Rep. 1 (3), 251–264. doi:10.1016/j.celrep.2011.12.007
Chapman, E., Farr, G. W., Usaite, R., Furtak, K., Fenton, W. A., Chaudhuri, T. K., et al. (2006). Global Aggregation of Newly Translated Proteins in an Escherichia coli Strain Deficient of the Chaperonin GroEL. Proc. Natl. Acad. Sci. 103 (43), 15800–15805. doi:10.1073/pnas.0607534103
Chilukoti, N., Kumar, C. M. S., and Mande, S. C. (2016). GroEL2 of Mycobacterium tuberculosis Reveals the Importance of Structural Pliability in Chaperonin Function. J. Bacteriol. 198 (3), 486–497. doi:10.1128/JB.00844-15
Deuerling, E., Patzelt, H., Vorderwülbecke, S., Rauch, T., Kramer, G., Schaffitzel, E., et al. (2003). Trigger Factor and DnaK Possess Overlapping Substrate Pools and Binding Specificities. Mol. Microbiol. 47 (5), 1317–1328. doi:10.1046/j.1365-2958.2003.03370.x
Durão, P., Aigner, H., Nagy, P., Mueller-Cajar, O., Hartl, F. U., and Hayer-Hartl, M. (2015). Opposing Effects of Folding and Assembly Chaperones on Evolvability of Rubisco. Nat. Chem. Biol. 11 (2), 148–155. doi:10.1038/nchembio.1715
Faith, J. J., Driscoll, M. E., Fusaro, V. A., Cosgrove, E. J., Hayete, B., Juhn, F. S., et al. (2008). Many Microbe Microarrays Database: Uniformly Normalized Affymetrix Compendia with Structured Experimental Metadata. Nucleic Acids Res. 36, D866–D870. doi:10.1093/nar/gkm815
Fares, M. A., Ruiz-González, M. X., Moya, A., Elena, S. F., and Barrio, E. (2002). GroEL Buffers against Deleterious Mutations. Nature 417 (6887), 398. doi:10.1038/417398a
Fayet, O., Ziegelhoffer, T., and Georgopoulos, C. (1989). The groES and groEL Heat Shock Gene Products of Escherichia coli Are Essential for Bacterial Growth at All Temperatures. J. Bacteriol. 171 (3), 1379–1385. doi:10.1128/jb.171.3.1379-1385.1989
Ferrer, M., Chernikova, T. N., Yakimov, M. M., Golyshin, P. N., and Timmis, K. N. (2003). Chaperonins Govern Growth of Escherichia coli at Low Temperatures. Nat. Biotechnol. 21 (11), 1266–1267. doi:10.1038/nbt1103-1266
Fujiwara, K., Ishihama, Y., Nakahigashi, K., Soga, T., and Taguchi, H. (2010). A Systematic Survey of In Vivo Obligate Chaperonin-dependent Substrates. EMBO J. 29 (9), 1552–1564. doi:10.1038/emboj.2010.52
Gasteiger, E., Hoogland, C., Gattiker, A., Duvaud, S. e., Wilkins, M. R., Appel, R. D., et al. (2005). “Protein Identification and Analysis Tools on the ExPASy Server,” in The Proteomics Protocols Handbook. Editor J. M. Walker 1 ed (Totowa, NJ: Humana Press), 571–607. doi:10.1385/1-59259-890-0:571
Genevaux, P., Keppel, F., Schwager, F., Langendijk‐Genevaux, P. S., Hartl, F. U., and Georgopoulos, C. (2004). In Vivo analysis of the Overlapping Functions of DnaK and Trigger Factor. EMBO Rep. 5 (2), 195–200. doi:10.1038/sj.embor.7400067
Guisbert, E., Herman, C., Lu, C. Z., and Gross, C. A. (2004). A Chaperone Network Controls the Heat Shock Response in E. coli. Genes Dev. 18 (22), 2812–2821. doi:10.1101/gad.1219204
Guruprasad, K., Reddy, B. V. B., and Pandit, M. W. (1990). Correlation between Stability of a Protein and its Dipeptide Composition: a Novel Approach for Predicting In Vivo Stability of a Protein from its Primary Sequence. Protein Eng. Des. Sel 4 (2), 155–161. doi:10.1093/protein/4.2.155
Guzman, L. M., Belin, D., Carson, M. J., and Beckwith, J. (1995). Tight Regulation, Modulation, and High-Level Expression by Vectors Containing the Arabinose PBAD Promoter. J. Bacteriol. 177 (14), 4121–4130. doi:10.1128/jb.177.14.4121-4130.1995
Hartl, F. U., and Hayer-Hartl, M. (2002). Molecular Chaperones in the Cytosol: from Nascent Chain to Folded Protein. Science 295 (5561), 1852–1858. doi:10.1126/science.1068408
Hirosawa, M., Hoshida, M., Ishikawa, M., and Toya, T. (1993). MASCOT: Multiple Alignment System for Protein Sequences Based on Three-Way Dynamic Programming. Bioinformatics 9 (2), 161–167. doi:10.1093/bioinformatics/9.2.161
Horwich, A. L., Low, K. B., Fenton, W. A., Hirshfield, I. N., and Furtak, K. (1993). Folding In Vivo of Bacterial Cytoplasmic Proteins: Role of GroEL. Cell 74 (5), 909–917. doi:10.1016/0092-8674(93)90470-b
Houry, W. A., Frishman, D., Eckerskorn, C., Lottspeich, F., and Hartl, F. U. (1999). Identification of In Vivo Substrates of the Chaperonin GroEL. Nature 402 (6758), 147–154. doi:10.1038/45977
Ishimoto, T., Fujiwara, K., Niwa, T., and Taguchi, H. (2014). Conversion of a Chaperonin GroEL-independent Protein into an Obligate Substrate. J. Biol. Chem. 289 (46), 32073–32080. doi:10.1074/jbc.M114.610444
Kandror, O., Sherman, M., Moerschell, R., and Goldberg, A. L. (1997). Trigger Factor Associates with GroEL In Vivo and Promotes its Binding to Certain Polypeptides. J. Biol. Chem. 272 (3), 1730–1734. doi:10.1074/jbc.272.3.1730
Kandror, O., Sherman, M., Rhode, M., and Goldberg, A. L. (1995). Trigger Factor Is Involved in GroEL-dependent Protein Degradation in Escherichia coli and Promotes Binding of GroEL to Unfolded Proteins. EMBO J. 14 (23), 6021–6027. doi:10.1002/j.1460-2075.1995.tb00290.x
Kayser, A., Weber, J., Hecht, V., and Rinas, U. (2005). Metabolic Flux Analysis of Escherichia coli in Glucose-Limited Continuous Culture. I. Growth-rate-dependent Metabolic Efficiency at Steady State. Microbiology 151 (Pt 3), 693–706. doi:10.1099/mic.0.27481-0
Kerner, M. J., Naylor, D. J., Ishihama, Y., Maier, T., Chang, H.-C., Stines, A. P., et al. (2005). Proteome-wide Analysis of Chaperonin-dependent Protein Folding in Escherichia coli. Cell 122 (2), 209–220. doi:10.1016/j.cell.2005.05.028
Kim, Y. E., Hipp, M. S., Bracher, A., Hayer-Hartl, M., and Ulrich Hartl, F. (2013). Molecular Chaperone Functions in Protein Folding and Proteostasis. Annu. Rev. Biochem. 82, 323–355. doi:10.1146/annurev-biochem-060208-092442
Kumar, C. M. S., Khare, G., Srikanth, C. V., Tyagi, A. K., Sardesai, A. A., and Mande, S. C. (2009). Facilitated Oligomerization of Mycobacterial GroEL: Evidence for Phosphorylation-Mediated Oligomerization. J. Bacteriol. 191 (21), 6525–6538. doi:10.1128/JB.00652-09
Kumar, C. M. S., Mande, S. C., and Mahajan, G. (2015). Multiple Chaperonins in Bacteria-Novel Functions and Non-canonical Behaviors. Cell Stress and Chaperones 20 (4), 555–574. doi:10.1007/s12192-015-0598-8
Kumar, C. M. S. (2017). “Prokaryotic Multiple Chaperonins: The Mediators of Functional and Evolutionary Diversity,” in Prokaryotic Chaperonins: Multiple Copies and Multitude Functions. Editors C. M. S. Kumar, and S. C. Mande (Singapore: Springer Singapore), 39–51. doi:10.1007/978-981-10-4651-3_3
Kusukawa, N., and Yura, T. (1988). Heat Shock Protein GroE of Escherichia coli: Key Protective Roles against thermal Stress. Genes Dev. 2 (7), 874–882. doi:10.1101/gad.2.7.874
Lemos, J. A., Luzardo, Y., and Burne, R. A. (2007). Physiologic Effects of Forced Down-Regulation of dnaK and groEL Expression in Streptococcus Mutans. J. Bacteriol. 189 (5), 1582–1588. doi:10.1128/JB.01655-06
Li, G.-W., Burkhardt, D., Gross, C., and Weissman, J. S. (2014). Quantifying Absolute Protein Synthesis Rates Reveals Principles Underlying Allocation of Cellular Resources. Cell 157 (3), 624–635. doi:10.1016/j.cell.2014.02.033
Llorca, O., Galán, A., Carrascosa, J. L., Muga, A., and Valpuesta, J. M. (1998). GroEL under Heat-Shock. J. Biol. Chem. 273 (49), 32587–32594. doi:10.1074/jbc.273.49.32587
Lund, P. A. (2009). Multiple Chaperonins in Bacteria - Why So many? FEMS Microbiol. Rev. 33 (4), 785–800. doi:10.1111/j.1574-6976.2009.00178.x
Macho, A. P., Guidot, A., Barberis, P., Beuzón, C. R., and Genin, S. (2010). A Competitive index Assay Identifies Several Ralstonia Solanacearum Type III Effector Mutant Strains with Reduced Fitness in Host Plants. Mpmi 23 (9), 1197–1205. doi:10.1094/MPMI-23-9-1197
Martin, J., Horwich, A., and Hartl, F. (1992). Prevention of Protein Denaturation under Heat Stress by the Chaperonin Hsp60. Science 258 (5084), 995–998. doi:10.1126/science.1359644
Martínez-Alonso, M., García-Fruitós, E., Ferrer-Miralles, N., Rinas, U., and Villaverde, A. (2010). Side Effects of Chaperone Gene Co-expression in Recombinant Protein Production. Microb. Cel Fact 9, 64. doi:10.1186/1475-2859-9-64
Monk, I. R., Casey, P. G., Cronin, M., Gahan, C. G., and Hill, C. (2008). Development of Multiple Strain Competitive index Assays for Listeria Monocytogenes Using pIMC; a New Site-specific Integrative Vector. BMC Microbiol. 8, 96. doi:10.1186/1471-2180-8-96
Musatovova, O., Dhandayuthapani, S., and Baseman, J. B. (2006). Transcriptional Heat Shock Response in the Smallest Known Self-Replicating Cell, Mycoplasma Genitalium. J. Bacteriol. 188 (8), 2845–2855. doi:10.1128/JB.188.8.2845-2855.2006
O'Leary, N. A., Wright, M. W., Brister, J. R., Ciufo, S., Haddad, D., McVeigh, R., et al. (2016). Reference Sequence (RefSeq) Database at NCBI: Current Status, Taxonomic Expansion, and Functional Annotation. Nucleic Acids Res. 44 (D1), D733–D745. doi:10.1093/nar/gkv1189
Orth, J. D., Conrad, T. M., Na, J., Lerman, J. A., Nam, H., Feist, A. M., et al. (2011). A Comprehensive Genome‐scale Reconstruction of Escherichia coli Metabolism-2011. Mol. Syst. Biol. 7, 535. doi:10.1038/msb.2011.65
Sabater-Muñoz, B., Prats-Escriche, M., Montagud-Martínez, R., López-Cerdán, A., Toft, C., Aguilar-Rodríguez, J., et al. (2015). Fitness Trade-Offs Determine the Role of the Molecular Chaperonin GroEL in Buffering Mutations. Mol. Biol. Evol. 32, 2681–2693. doi:10.1093/molbev/msv144
Samuelson, J. C. (2011). Recent Developments in Difficult Protein Expression: a Guide to E. coli Strains, Promoters, and Relevant Host Mutations. Methods Mol. Biol. 705, 195–209. doi:10.1007/978-1-61737-967-3_11
Schumann, W. (2017). “Regulation of the Heat Shock Response in Bacteria,” in Prokaryotic Chaperonins: Multiple Copies and Multitude Functions. Editors C. M. S. Kumar, and S. C. Mande (Singapore: Springer Singapore), 21–36. doi:10.1007/978-981-10-4651-3_2
Singhal, K., Vreede, J., Mashaghi, A., Tans, S. J., and Bolhuis, P. G. (2015). The Trigger Factor Chaperone Encapsulates and Stabilizes Partial Folds of Substrate Proteins. Plos Comput. Biol. 11 (10), e1004444. doi:10.1371/journal.pcbi.1004444
Smith, H. L. (2011). Bacterial Competition in Serial Transfer Culture. Math. Biosciences 229 (2), 149–159. doi:10.1016/j.mbs.2010.12.001
Teter, S. A., Houry, W. A., Ang, D., Tradler, T., Rockabrand, D., Fischer, G., et al. (1999). Polypeptide Flux through Bacterial Hsp70. Cell 97 (6), 755–765. doi:10.1016/s0092-8674(00)80787-4
Tilly, K., and Georgopoulos, C. (1982). Evidence that the Two Escherichia coli groE Morphogenetic Gene Products Interact In Vivo. J. Bacteriol. 149 (3), 1082–1088. doi:10.1128/jb.149.3.1082-1088.1982
Tokuriki, N., Stricher, F., Serrano, L., and Tawfik, D. S. (2008). How Protein Stability and New Functions Trade off. Plos Comput. Biol. 4 (2), e1000002. doi:10.1371/journal.pcbi.1000002
Tokuriki, N., and Tawfik, D. S. (2009). Chaperonin Overexpression Promotes Genetic Variation and Enzyme Evolution. Nature 459 (7247), 668–673. doi:10.1038/nature08009
UniProt, C. (2019). UniProt: a Worldwide Hub of Protein Knowledge. Nucleic Acids Res. 47 (D1), D506–D515. doi:10.1093/nar/gky1049
Van Dyk, T. K., Gatenby, A. A., and LaRossa, R. A. (1989). Demonstration by Genetic Suppression of Interaction of GroE Products with many Proteins. Nature 342 (6248), 451–453. doi:10.1038/342451a0
van Opijnen, T., and Camilli, A. (2013). Transposon Insertion Sequencing: a New Tool for Systems-Level Analysis of Microorganisms. Nat. Rev. Microbiol. 11 (7), 435–442. doi:10.1038/nrmicro3033
Vulic, M., and Kolter, R. (2001). Evolutionary Cheating in Escherichia coli Stationary Phase Cultures. Genetics 158 (2), 519–526.
Wang, M., Weiss, M., Simonovic, M., Haertinger, G., Schrimpf, S. P., Hengartner, M. O., et al. (2012). PaxDb, a Database of Protein Abundance Averages across All Three Domains of Life. Mol. Cell Proteomics 11 (8), 492–500. doi:10.1074/mcp.O111.014704
Weber, J., Kayser, A., and Rinas, U. (2005). Metabolic Flux Analysis of Escherichia coli in Glucose-Limited Continuous Culture. II. Dynamic Response to Famine and Feast, Activation of the Methylglyoxal Pathway and Oscillatory Behaviour. Microbiology 151 (Pt 3), 707–716. doi:10.1099/mic.0.27482-0
Weiner, J., Zimmerman, C. U., Göhlmann, H. W., and Herrmann, R. (2003). Transcription Profiles of the Bacterium Mycoplasma Pneumoniae Grown at Different Temperatures. Nucleic Acids Res. 31 (21), 6306–6320. doi:10.1093/nar/gkg841
Williams, T. A., and Fares, M. A. (2010). The Effect of Chaperonin Buffering on Protein Evolution. Genome Biol. Evol. 2, 609–619. doi:10.1093/gbe/evq045
Wyganowski, K. T., Kaltenbach, M., and Tokuriki, N. (2013). GroEL/ES Buffering and Compensatory Mutations Promote Protein Evolution by Stabilizing Folding Intermediates. J. Mol. Biol. 425 (18), 3403–3414. doi:10.1016/j.jmb.2013.06.028
Zambrano, M., Siegele, D., Almiron, M., Tormo, A., and Kolter, R. (1993). Microbial Competition: Escherichia coli Mutants that Take over Stationary Phase Cultures. Science 259 (5102), 1757–1760. doi:10.1126/science.7681219
Keywords: metabolic flux, GroEL, evolution, proteomics, metabolism, competitive index
Citation: Kumar CMS, Chugh K, Dutta A, Mahamkali V, Bose T, Mande SS, Mande SC and Lund PA (2021) Chaperonin Abundance Enhances Bacterial Fitness. Front. Mol. Biosci. 8:669996. doi: 10.3389/fmolb.2021.669996
Received: 19 February 2021; Accepted: 01 July 2021;
Published: 26 July 2021.
Edited by:
Kürşad Turgay, Max-Planck-Gesellschaft (MPG), GermanyReviewed by:
Hideki Taguchi, Tokyo Institute of Technology, JapanMarie-Pierre Castanié-Cornet, UMR5100 Laboratoire de Microbiologie et Génétique Moléculaires (LMGM), France
Copyright © 2021 Kumar, Chugh, Dutta, Mahamkali, Bose, Mande, Mande and Lund. This is an open-access article distributed under the terms of the Creative Commons Attribution License (CC BY). The use, distribution or reproduction in other forums is permitted, provided the original author(s) and the copyright owner(s) are credited and that the original publication in this journal is cited, in accordance with accepted academic practice. No use, distribution or reproduction is permitted which does not comply with these terms.
*Correspondence: C. M. Santosh Kumar, cy5rLmNtQGJoYW0uYWMudWs=