 Aruana F. F. Hansel-Frose1
 Jens Allmer2
 Marcel Friedrichs3
 Hellen Geremias dos Santos4
 Bruno Dallagiovanna1
 Lucía Spangenberg5,6*
- 1Laboratory of Basic Stem Cell Biology, Carlos Chagas Institute, Oswaldo Cruz Foundation (FIOCRUZ/PR), Curitiba, Brazil
- 2Department of Medical Informatics and Bioinformatics, University of Applied Sciences Ruhr West, Mülheim, Germany
- 3Bioinformatics and Medical Informatics Department, University of Bielefeld, Bielefeld, Germany
- 4Carlos Chagas Institute, Oswaldo Cruz Foundation (FIOCRUZ/PR), Curitiba, Brazil
- 5Bioinformatics Unit, Pasteur Institute of Montevideo, Montevideo, Uruguay
- 6Departamento Basico de Medicina, Hospital de Clinicas, Universidad de la República (Udelar), Montevideo, Uruguay
Alternative polyadenylation (APA) increases transcript diversity through the generation of isoforms with varying 3′ untranslated region (3′ UTR) lengths. As the 3′ UTR harbors regulatory element target sites, such as miRNAs or RNA-binding proteins, changes in this region can impact post-transcriptional regulation and translation. Moreover, the APA landscape can change based on the cell type, cell state, or condition. Given that APA events can impact protein expression, investigating translational control is crucial for comprehending the overall cellular regulation process. Revisiting data from polysome profiling followed by RNA sequencing, we investigated the cardiomyogenic differentiation of pluripotent stem cells by identifying the transcripts that show dynamic 3′ UTR lengthening or shortening, which are being actively recruited to ribosome complexes. Our findings indicate that dynamic 3′ UTR lengthening is not exclusively associated with differential expression during cardiomyogenesis but rather with recruitment to polysomes. We confirm that the differentiated state of cardiomyocytes shows a preference for shorter 3′ UTR in comparison to the pluripotent stage although preferences vary during the days of the differentiation process. The most distinct regulatory changes are seen in day 4 of differentiation, which is the mesoderm commitment time point of cardiomyogenesis. After identifying the miRNAs that would target specifically the alternative 3′ UTR region of the isoforms, we constructed a gene regulatory network for the cardiomyogenesis process, in which genes related to the cell cycle were identified. Altogether, our work sheds light on the regulation and dynamic 3′ UTR changes of polysome-recruited transcripts that take place during the cardiomyogenic differentiation of pluripotent stem cells.
1 Introduction
There are a few ways by which the repertoire of transcripts in a cell can be increased from the expression of the same set of genes. Alternative polyadenylation (APA) is a process that plays an important role in transcript diversity during post-transcriptional regulation. With alternative polyadenylation sites (PASs), isoforms of the same gene are generated, which differ by the length of the untranslated region at the 3′ end (3′ UTR). Subsequently, the 3′ UTR of an mRNA contributes to the post-transcriptional regulation of this transcript since it can impact protein localization and/or abundance. In addition, the region can contain several regulatory elements, such as microRNA target sites. Once the length of this region is changed through APA, it can, therefore, influence or modify the said regulatory process in the cell (Turner et al., 2018; Mayr, 2019; Sommerkamp et al., 2021).
Alternative polyadenylated transcripts can be differentially expressed between various conditions, not only during diseases but also in healthy tissues and throughout development (Gruber and Zavolan, 2019; MacDonald, 2019). Studies have shown that differential APA expression can be seen during stem cell differentiation (Spangenberg et al., 2013; Sommerkamp et al., 2021). The dynamic APA site usage can change depending on the cell state: active proliferating stem or progenitor cells exhibit short 3′ UTRs, while long 3′ UTRs are mostly seen in quiescent stem cells (Sommerkamp et al., 2021).
Since APA events can influence protein expression, the study of translational control is important to understand the whole regulation process that takes place inside the cell. Translational control can be regulated by the association or dissociation of transcripts to polysome complexes, which are composed of various ribosomes bound to the same transcript being actively translated. Using the polysome profiling technique followed by high-throughput transcriptome sequencing, it is possible to specifically identify which transcripts are bound or unbound to polysomes, allowing a better understanding of the translational control of the cell (Schwanhüusser et al., 2011; Tebaldi et al., 2012). In the context of stem cell research, this strategy has the potential to enhance our understanding of the dynamics of post-transcriptional regulation during cell fate commitment (Pereira et al., 2018; 2019).
Considering that stem cells’ self-renewal and differentiation potential are interesting characteristics regarding regenerative medicine (Trounson and McDonald, 2015), understanding the process of differentiation into various tissues is essential for addressing diseases in the future. According to the World Health Organization, cardiovascular disease is still the global leading cause of death, which supports the need for more research in cardiomyogenic differentiation to improve possible therapies (Bhagavati, 2015; Trounson and McDonald, 2015). Pluripotent stem cells are good models for cardiomyogenesis research, and they can differentiate into cardiomyocytes while reflecting the development of the embryonic heart (Beqqali et al., 2006; Brade et al., 2013; Leitolis et al., 2019). Notably, pluripotent stem cells are also good candidates for future applications in cell therapy (Trounson and McDonald, 2015; Zhang et al., 2015).
As previously shown by our group, during cardiomyogenic differentiation, there is extensive post-transcriptional regulation, fine-tuned by not only coding but also non-coding transcripts bound to polysomes (Pereira et al., 2019; 2020). To add a new layer of understanding to this process, in this work, we investigated the same process while focusing on the dynamic 3′ UTR length changes due to APA through the days of differentiation.
Here, we aim to assess whether post-transcriptional regulation of mRNA is influenced by dynamic UTR lengthening and shortening through the events of alternative polyadenylation. This event might alter the availability of miRNA target sites in 3′ UTR during human embryonic stem cell (hESC) cardiac differentiation.
2 Materials and methods
2.1 RNA sequencing analysis
The hESC line hES-NKX2-5eGFP/w differentiation to cardiomyocytes, RNA sequencing, and polysome profiling were previously carried out by our group (Pereira et al., 2018). In summary, the transcriptomes of both fractions that were free of polysomes and polysome-bound from the days of cardiomyogenic differentiation of days 0, 1, 4, 9, and 15 were sequenced. The reanalysis of the unstranded RNA-seq began with quality control with FastQC (Andrews, 2015) and trimming of reads with Trim Galore (v. 0.4.0) (Krueger, 2015). The alignment of reads was performed with HISAT2 (v. 2.1.0) (Kim et al., 2015) against the human genome hg38/GRCh38 v.103, with read counts performed by HTSeq (v. 0.11.1) (Anders et al., 2015). Differential gene expression was calculated with DESeq2 (v. 1.24.0) (Love et al., 2014) at a gene level considering an adjusted p-value cutoff of 0.05 and log2FoldChange cutoff of |2|. The counts per million (CPM) normalization of reads was carried out in R (R Team, 2018).
2.2 Differential 3′ UTR length identification
Both the identification of the 3′ UTR sequence, with the start and end sites of alternative polyadenylation, and the differential 3′ UTR lengthening were performed with APAtrap (Ye et al., 2018). First, the alignment files and the human genome hg38/GRCh38 v.103 were converted to bedGraph using bedtools (v. 2.28.0) (Quinlan and Hall, 2010). The identification of annotated 3′ UTRs and the prediction of 3′ UTR lengthening and shortening through the identification of alternative polyadenylation sites were performed based on the annotation of the human genome hg38/GRCh38 v.103. The default 3′ UTR annotation provided by Ensembl was used, and APAtrap calculated the lengthening and shortening of the 3′ UTR at the isoform level.
The comparison of differential 3′ UTR length usage executed by APAtrap was calculated considering day 0 of differentiation as the control, such as D0P vs. D15P, D0P vs. D9P, D0P vs. D4P, and D0P vs. D1P. In addition, each sample’s replicates 1, 2, and 3 were considered as part of one group of the day of cardiomyogenic differentiation. The results from APAtrap indicated the expressed transcript ID, gene ID, additional predicted APA sites if available, percentage difference between the groups (perc_diff), and preference for longer or shorter 3′ UTR through the Pearson correlation coefficient (r).
The results were filtered according to APAtrap’s default requirements for genes that show differential APA site usage, which considers the threshold for the adjusted p-value of 0.05 and the percentage difference (perc_diff) of expression between the control and the group of more than 20% (Ye et al., 2018).
The results were subsequently filtered using the differential gene expression obtained previously from DESeq2 (Love et al., 2014). Since differential expression was carried out at a gene level with DESeq2 and the 3′ UTR analysis was conducted at a transcript level with APAtrap, we filtered the dynamic 3′ UTR transcripts when the gene was a protein-coding gene, and it was significantly upregulated or downregulated according to the DESeq2 differential expression analysis (at 0.05 significance level).
The genes with log2FoldChange ≥2 were considered upregulated genes, while the ones with log2FoldChange ≤ −2 were considered downregulated genes. Both groups were filtered for the adjusted p-value (padj) ≤ 0.05.
In order to identify the preference for the use of longer or shorter 3′ UTR, we observed the Pearson correlation coefficient (r) that also results from the APAtrap analysis. In detail, r < 0 indicates a preference for that transcript with short 3′ UTR in polysome-bound group 2 in relation to D0, and r > 0 indicates a preference for long 3′ UTR transcripts in polysome-bound group 2 in relation to D0.
2.3 Relation between differential gene expression and differential 3′ UTR length
The identification of the genes that simultaneously showed differential gene expression and differential 3′ UTR lengthening usage was carried out by plotting log2FoldChange and the Pearson correlation coefficient, discerning the 3′ UTR lengthening and shortening by r > 0 and r < 0, respectively. The comparison of the days of differentiation considered day 0 as the control. The genes were divided into four distinct groups: upregulated genes that also showed 3′ UTR lengthening, upregulated genes that also showed 3′ UTR shortening, downregulated genes that also showed 3′ UTR lengthening, and downregulated genes that also showed 3′ UTR shortening. Venn diagrams of these common transcripts or genes between the days of differentiation were created with InteractiVenn (Heberle et al., 2015).
2.4 Descriptive statistics of polysome recruitment
To calculate the recruitment of polysomes, raw reads were normalized to CPM and filtered for genes that have at least one CPM in at least three samples. The relative frequency (RF) of polysome recruitment was calculated as the polysomal fraction divided by the total RNA (polysomal + free of ribosomes) for each time point, R0, R1, R4, R9, and R15. Then, relative risk (RR) was calculated considering the RF of each time point divided by the RF of day zero (D0) as the control. Therefore, the interpretation of polysomal recruitment through the RF is in relation to the same day of differentiation, and through the RR, it is in relation to D0. When RR > 1, the gene shows a higher risk of being recruited into the polysomal fraction of the day of differentiation compared to D0. When RR < 1, the gene shows a lower risk of being recruited to polysomes compared to D0. When RR = 1, there is no difference in the risk of being recruited to polysomes in one day compared to D0. Finally, the results were filtered to transcripts that also showed dynamic 3′ UTR lengthening through the Pearson correlation coefficient (r) to associate the short 3′ UTR or long 3′ UTR changes to the recruitment of polysomes. Calculations were performed in R (R Team, 2018).
2.5 miRNA targets in 3′ UTR sequences
We searched for miRNA target sites in the 3′ UTR sequence of the differentially expressed genes that simultaneously showed differential expression and differential 3′ UTR length. To predict miRNA target sites in the 3′ UTR, the sequence from the 3′ UTR coordinates was retrieved from the human genome hg38/GRCh38 v.103, and the compilation of human miRNAs seed sites was retrieved from miRBase. The prediction between the two datasets was executed with psRNATarget (Dai et al., 2018). Afterward, the miRNAs–target matches were filtered, maintaining only the miRNAs expressed in each specific day of cardiomyogenic differentiation, using the miRNAome of cardiac differentiation as a reference (Garate et al., 2018). Relevant miRNAs were filtered according to a log2FoldChange of |2| and adjusted p-value of |0.05|. In silico confirmations of miRNA regulations were carried out in miRWalk and the Encyclopedia of RNA Interactome (ENCORI) (Li et al., 2014; Sticht et al., 2018).
2.6 Gene regulatory networks
Differentially expressed genes, their miRNA targets, and their corresponding APA isoforms were visualized in a gene regulatory network using igraph in R (Csardi and Nepusz, 2006; R Core Team, 2018). The details are given as follows.
First, the relevant data were merged in R (R Team, 2018) so that the following related columns were available in the same dataframe: the significant differentially expressed genes (log2FoldChange |2| and padj ≤0.05), their significantly expressed APA isoforms (perc_diff greater than 20% and p-value ≤0.05), and their respective significant miRNA targets (miRNAs that were differentially expressed with a log2FoldChange cutoff of |2| and padj ≤0.05, only when both miRNA and the gene target were expressed in the same day of cardiomyogenic differentiation). The dataframe was then adapted to a network format with the following specificities: the name vertex as the microRNAs, gene as the target gene, and UTR vertex as the APA isoform. A non-directed graph named “g” was created using igraph (Csardi and Nepusz, 2006) with the function graph_from_data_frame with the directed option as “False.” Labels of “miRNA,” “DNA” for the gene targets, and “mRNA” for the APA isoforms to the vertex were then added to the object V(g) of the graph. The log2FoldChange values were added to the corresponding vertex (miRNA, DNA, or mRNA) of the logFC label of the graph vertex (V(g)$logFC). Similarly, the short and long 3′ UTR attributes were added to the correct APA isoform through the r values obtained from APAtrap and incorporated into the graph object vertex with the label V(g)$r. Colors were attributed considering the values of the log2FoldChange, with dark blue for upregulated genes, light blue for downregulated genes, dark purple for upregulated miRNAs, and light purple for downregulated miRNAs. Edges between the vertex were colored considering short 3′ UTRs as salmon (when r < 0) and long 3′ UTR as blue when r > 0. The network was visualized in the R environment through an interactive interface using the function tkplot from igraph (Csardi and Nepusz, 2006) to plot the graph object “g.”
2.7 Visualization of alignments
The alignment of the alternative transcripts and their respective target miRNAs was visualized in the Integrative Genomics Viewer (IGV) version 2.9.4 (Thorvaldsdóttir et al., 2013). First, the coordinates of the miRNA target site on the 3′ UTRs, obtained from the previous analysis with psRNATarget (Dai et al., 2018), were converted to a BED file in the R environment (R Core Team, 2018). They were uploaded for visualization in IGV, together with the alignment files of the samples and the genome annotation from Ensembl version hg38.
3 Results
3.1 Cardiomyogenic differentiation of the hESC is analyzed through polysome profiling and transcriptome sequencing
Previously, the hESC line hES-NKX2-5eGFP/w was differentiated into cardiomyocytes following a 5-time-point developmentally staged protocol that reaches the cardiac mesoderm stage at days 3 and 4 and the cardiomyocyte phenotype at day 15 (Pereira et al., 2018) (Supplementary Figure S1A). These days correspond to the pluripotency stage (D0), aggregation of embryoid bodies (D1), cardiac mesodermal stage (D4), cardiac progenitor (D9), and finally, cardiomyocytes (D15), respectively. We reanalyzed the RNA sequencing of the polysome profile previously published by our group (Pereira et al., 2018; Pereira et al., 2019), starting with the realignment of the sequenced transcriptomes in the recent version of the human genome GRCh38 v.103. (Supplementary Figure S1A, Supplementary Table S1). On average, 95% of the reads were aligned, out of which 72.95% were uniquely mapped to the reference (Supplementary Table S1). Counting of reads yielded a total of 30.821 genes with at least 10 read counts across the samples. After normalization by CPM, there were 19,784 genes detected with at least one CPM in at least three samples.
3.2 Polysome-recruited genes are differentially expressed throughout the cardiomyogenic differentiation
First, principal component analysis (PCA) was carried out to check the variability between the biological conditions in both experimental settings: the polysome-bound and ribosome-free fractions (Supplementary Figure S1B). Both PCAs show the expected clustering according to the different time points D0, D1, D4, D9, and D15. Additionally, the PCA already indicates a similarity of the expression profile between the initial developmental stages D0 and D1, the interesting distinction of D4, and the similarity between the end stages of D9 and D15 in accordance with the cardiomyogenic process.
Since we were interested in the genes that were recruited to the polysomes due to the possibility of translation control, we investigated the differential expression in the polysome-bound fractions, considering the pluripotent stage D0 as a control against all the other days of differentiation. The results were filtered to maintain only significantly expressed genes, considering the threshold of log2FoldChange ≥2, log2Foldchange ≤ −2, and adjusted p-value (padj) ≤ 0.05 and then separated by gene biotype (Supplementary Figures S1C,D).
3.3 Dynamic 3′ UTR length preference is associated to polysome recruitment throughout hESC cardiomyogenic differentiation
Alternative polyadenylated transcripts were detected in all the days of cardiomyogenic differentiation (Figure 1A). The preference for distal or proximal polyadenylation sites was assessed, and surprisingly, the preference for long or short 3′ UTRs was different between the days (Figures 1A, B). Alternative polyadenylated transcripts were preferably expressed with shorter 3′ UTR on D1P (D1 polysome-bound) and D15P, while preference for longer 3′ UTR expression was observed on D4P and D9P. The most significant preference difference is observed on D4P, with the lowest number of transcripts favoring short 3′ UTR lengths throughout cardiomyogenesis, totaling 147 transcripts, while simultaneously exhibiting the highest number of transcripts favoring longer 3′ UTR lengths, with 730 APA isoforms. From D4P onwards, the quantity of preferred short 3′ UTR transcripts increases, reaching its peak on D15P, with 1,246 isoforms with proximal APA sites. Interestingly, proportionally, D1P and D15P are similar in their preference for proximal and distal sites, with 67% short isoforms in D1P and 63% in D15P. Proportionally, D4P is also the time point where there is a bigger difference in preference for the APA site, with only a 17% preference for short 3′ UTR and 83% for long 3′ UTR (Figure 1C).
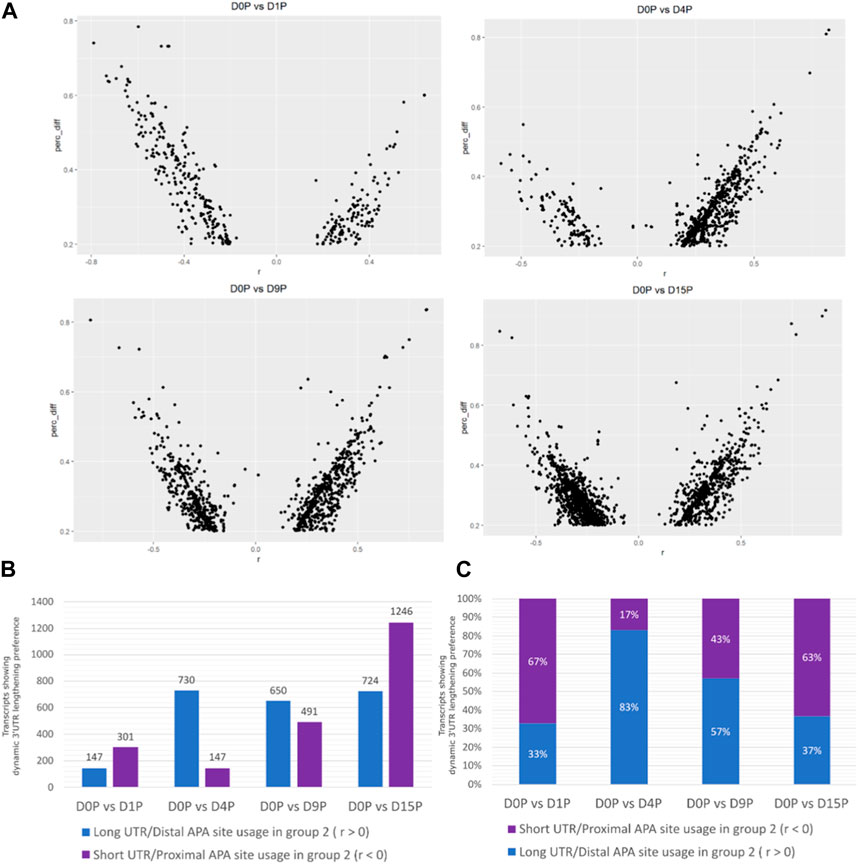
FIGURE 1. Dynamic changes of 3′ UTR lengthening and modulated APA site usage are seen during hESC differentiation to cardiomyocytes. (A) Transcripts with significant differential dynamic 3′ UTR length in polysomal fractions of D15. (B) Absolute quantity of transcripts. (C) Proportion of transcripts presenting dynamic 3′ UTR lengthening and shortening in polysomal fractions during cardiomyogenic differentiation, separated by day of differentiation and preference for 3′ UTR size.
We assessed which of these transcripts with dynamic 3′ UTR lengthening was also simultaneously differentially expressed. Curiously, the vast majority of transcripts that showed dynamic 3′ UTR lengthening were not simultaneously differentially expressed (Figure 2A). Interestingly, there is a steeper increase of dynamic 3′ UTR changes in comparison to the increase of the differential expression during cardiomyogenesis (Figure 2B). In D1P, only 2 out of 446 dynamic 3′ UTR transcripts were differentially expressed. Overall, the number of differentially expressed and dynamic 3′ UTR-lengthened transcripts increased with the ongoing cardiomyogenesis. In D4P, 877 genes showed significant dynamic 3′ UTR lengthening, out of which 9 were upregulated and 17 were downregulated, which leaves 851 transcripts showing only dynamic 3′ UTR length without differential expression. In D9P, of 1,136 genes with significant 3′ UTR lengthening, 16 were upregulated and 48 were downregulated, leaving 1,072 transcripts exclusively with dynamic 3′ UTR. Last, D15P showed 1,971 genes with significant 3′ UTR lengthening, out of which only 45 were upregulated and 75 were downregulated. Nonetheless, most genes that showed changes of 3′ UTR length were downregulated in all the differentiation days: 17 in D4P, 48 in D9P, and 75 in D15P, except for D1P, with no alternative polyadenylated and downregulated transcripts (Table 1).
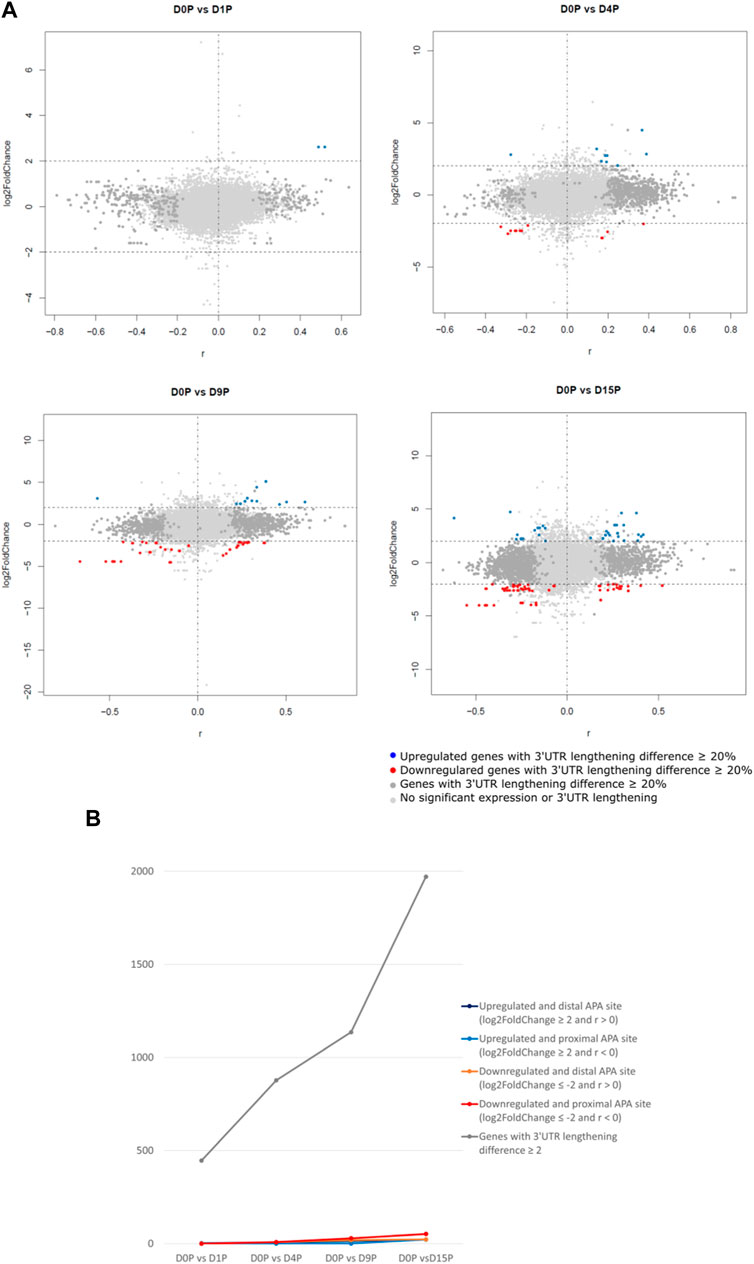
FIGURE 2. Differential expression is weakly associated with dynamic 3′ UTR length throughout hESC cardiomyogenic differentiation. (A) Differentially expressed polysome-bound transcripts show dynamic 3′ UTR lengthening during hESC differentiation to cardiomyocytes. (B) Quantification of the differentially expressed polysome-bound transcripts with dynamic 3′ UTR lengthening during hESC differentiation to cardiomyocytes.
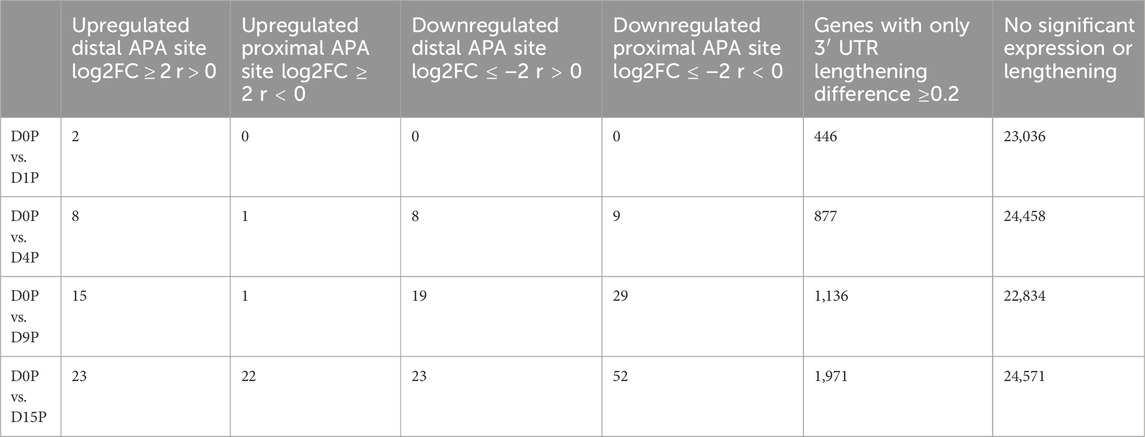
TABLE 1. Number of differentially expressed and dynamic 3’ UTR lengthening transcripts in each comparison during cardiomyogenic differentiation, separated by the preference of the proximal or distal APA site.
Since most of the genes that showed dynamic 3′ UTR lengthening were not differentially expressed, we assessed whether the dynamic 3′ UTR lengths were associated with the recruitment of these transcripts to the polysomal complexes. For this, we calculated the RF of polysomal fraction recruitment for each time point and the RR of polysomal recruitment in relation to D0, considering the changes in dynamic APA for each day of differentiation (see Materials and methods). The distribution of the RR of the recruitment of transcripts to polysomal fractions looks homogenous between the distal and proximal APA sites in each day of differentiation compared to D0P, except on D4P, where there is a higher concentration of transcripts highly recruited to polysomes and with a preference for distal APA sites (Figure 3A). When we look at the number of transcripts that are recruited and have a preference for distal/proximal APA sites, the differences are clearer (Figures 3B, C; Table 2). Compared to D0, on D1P, there is a slightly higher concentration of transcripts that show RR > 1 of being recruited to polysomes simultaneously with a preference for short 3′ UTR. Significantly, on D4P, there is a much higher concentration of transcripts with RR > 1 being recruited to polysomes concomitant to the preference for long 3′ UTR. Even though the RR being recruited to polysomes on D15P (with respect to D0P) is higher than 1, with some genes even surpassing RR > 2 (two times the risk of being recruited to D15P), there are more genes that show low RF recruitment to polysomal fraction. In addition, on D15P, there is the highest number of transcripts that are preferably recruited to polysomes in D0P, coinciding with the preference for short 3′ UTR or proximal APA sites (Figures 3B, C; Table 2). Last, we observed that recruitment to polysomes with a preference for proximal APA sites increases together throughout cardiomyogenesis. Nonetheless, transcripts recruited to polysomes with a preference for distal APA sites reach their peak on D4P and stabilize after D9P. A similar pattern of stabilization after D9P is seen in the transcripts that are recruited less to polysomes and prefer distal APA sites. It is possible to notice these two trends of recruitment of short 3′ UTR transcripts to polysomes increasing during differentiation, while recruitment of long 3′ UTR transcripts decreases and stabilizes during differentiation.
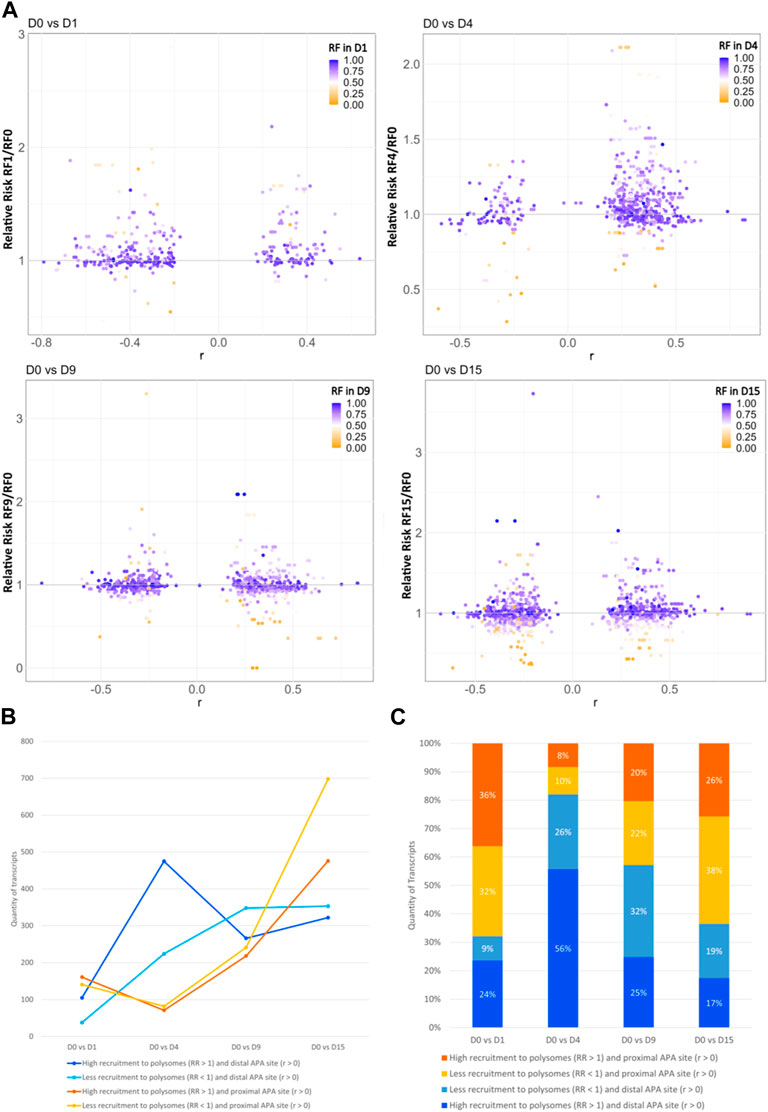
FIGURE 3. Dynamic 3′ UTR changes are associated with the recruitment of polysomes during hESC differentiation to cardiomyocytes. (A) Distribution of the RR of polysome recruitment according to the Pearson correlation coefficient (r) for the preference of 3′ UTR length; color maps of the RF of polysomal recruitment on each day of differentiation. (B) Number and (C) proportion of transcripts according to the RR of greater recruitment to polysomes in the day of differentiation (>1) or lower recruitment (<1) and the preference for distal APA site (r > 0) or proximal APA site (r < 0).
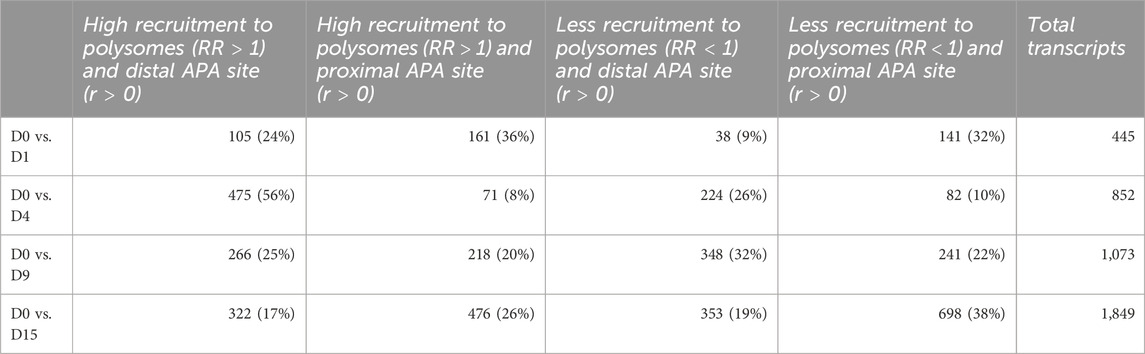
TABLE 2. Quantity of transcripts with dynamic 3′ UTR lengthening that are recruited into the polysomes on the day of differentiation or recruited to D0P.
These findings collectively suggest that the preferences for specific 3′ UTR lengths are associated with the recruitment of these transcripts from polysomes. This implies that post-transcriptional regulatory processes during cardiomyogenic differentiation may be influenced by alterations in APA site selection and 3′ UTR length preference, irrespective of any differential gene expression.
Finally, we assessed whether there were any common genes throughout all the days of the cardiomyogenesis process that were changing their preference of 3′ UTR length and fold change of expression depending on the day of differentiation. To investigate this, we created a Venn diagram with all the transcripts that showed dynamic 3′ UTR lengthening and were simultaneously differentially expressed in all time-point comparisons (Figure 4; Table 3). We set up a log2FoldChange cutoff of |2| to find more common genes that might have a lower expression. Then, we plotted the transcripts together with both their Pearson correlation coefficient for the preference of 3′ UTR length and their log2FoldChange, which were interconnected through the different time points. The result showed that many genes behave differently during the cardiomyogenesis process in terms of varied changes of 3′ UTR length and expression. Interestingly, two different trends were observed: one group of genes increased their expression throughout cardiomyogenesis, and another group decreased their expression until the final stages of differentiation. Examples of genes that increased expression were IGFBP7 and MYL9, whereas genes that decreased their expression were MAD2L2, SEPHS1, and AASS. Concomitantly, changes in the preference of APA sites were also observed. The increased-expression group of genes also tended to show a preference for longer 3′ UTRs, while the decreasing-expression group tended to show a preference for shorter 3′ UTRs (Figure 4; Table 3). The gene SEPHS1 was upregulated in D1P and changed to being downregulated in the subsequent days D4P, D9P, and D15P, while its APA isoforms showed a preference for short 3′ UTR during all time points. Similarly, MAD2L2 also had the same differential expression pattern, upregulated only in D1P and downregulated in the other days, but with the contrary preference of long 3′ UTR during all time points. IGFBP7 was only differentially expressed on D9 and D15, being preferable with short 3′ UTR on both days. MYL9 showed a preference for long 3′ UTR in all time points, as well as AASS (Figure 4; Table 3).
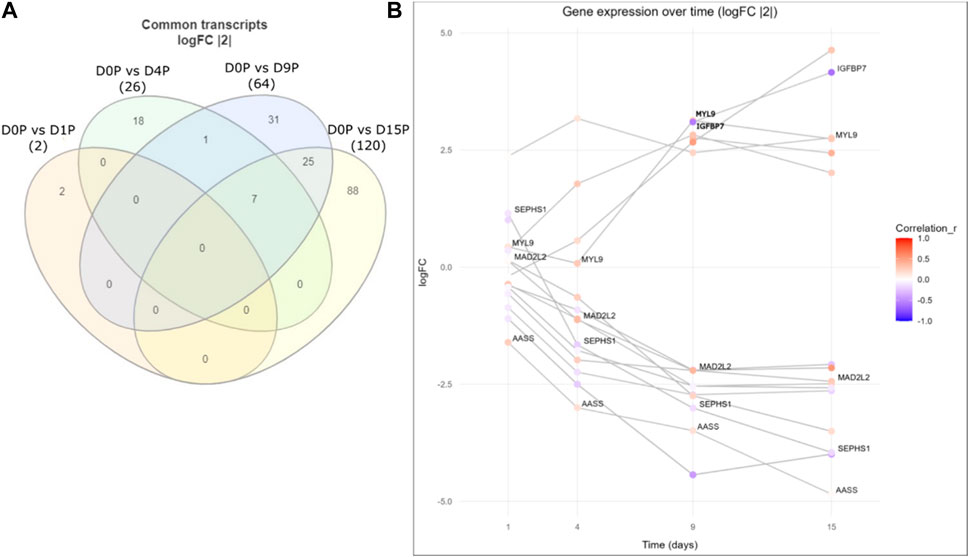
FIGURE 4. Common differentially expressed genes with dynamic 3′ UTR changes throughout the cardiomyogenesis of hESCs. (A) Venn diagram of common dynamic 3′ UTR lengthened transcripts and simultaneously differentially expressed genes with log2FoldChange |2|. (B) Gene expression over time of the same common differentially expressed genes with dynamic 3′ UTR length changes along with log2FoldChange values of |2|. Preference for 3′ UTR lengths is shown through the Pearson coefficient (r).
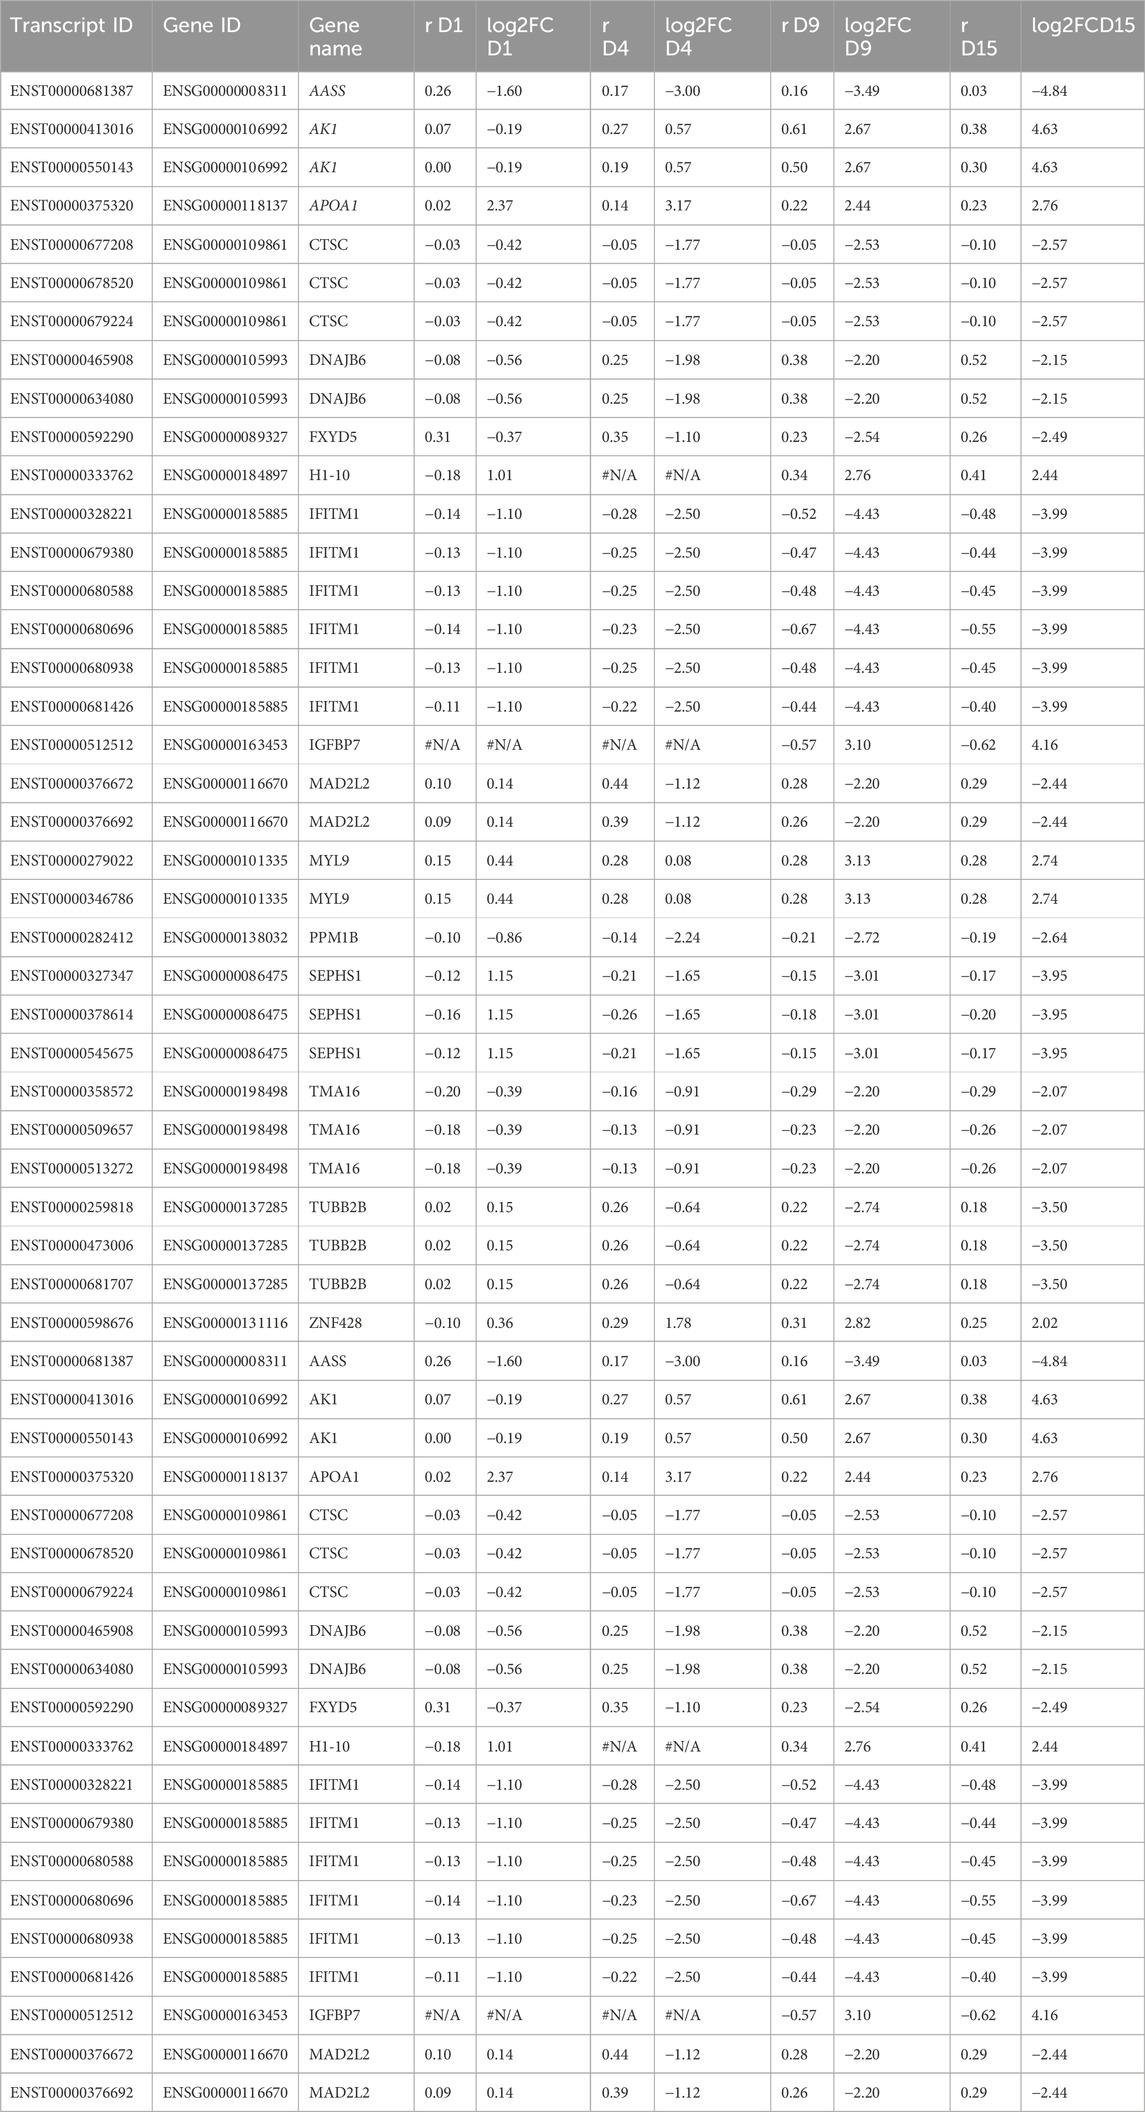
TABLE 3. Values of log2FoldChange and Pearson correlation coefficient (r) of the common differentially expressed genes with dynamic 3′ UTR lengthening throughout all the days of cardiomyogenesis from hESCs.
In summary, these findings demonstrate the dynamic nature of the cardiomyogenesis process. In terms of the expression of genes and their alternative APA isoforms, the same set of genes can show different outcomes throughout the differentiation process. The dynamic regulation of 3′ UTR lengths and the expression of isoforms is relevant and unique for each time point individually and does not reflect only the differentiated cardiomyocyte state since the beginning of the differentiation process.
3.4 Lengthened and shortened 3′ UTRs are the targets of miRNAs expressed during the cardiomyogenic differentiation of hESCs
To assess whether the alternative polyadenylated transcripts and differentially expressed genes were being regulated by microRNAs targeting their modulated 3′ UTR regions, we first selected the expressed miRNAs during hESC cardiomyogenic differentiation (Garate et al., 2018). Since we were interested in discovering if additional miRNA target sites were appearing due to the lengthening of the 3′ UTRs and considering that miRNAs preferably connected to the 3′ UTR position of the transcripts, mostly leading to their inactivation (Krol et al., 2010), we predicted miRNA targeting specifically on the sequences of the expressed 3′ UTRs of our data. We found the following four possible modulations of miRNA and gene expression: coordinated (upregulated miRNA and target gene; downregulated miRNA and target gene) and uncoordinated (upregulated miRNA and downregulated target gene; downregulated miRNA and upregulated target genes) (Supplementary Figure S2A). Most miRNA–gene target pairs were coordinated downregulated, with 106 miRNA–gene pairs in D4, 229 in D9, and 330 in D15. The lowest number of miRNA–gene pairs was coordinated upregulated, accounting for 12 miRNA–gene pairs in D4, 42 in D9, and 56 in D15. The uncoordinated modulation of downregulated miRNA and the upregulated gene target obtained 19 miRNA–gene pairs in D4, 60 in D9, and 174 in D15. Last, upregulated miRNAs and downregulated gene targets accounted for 75 miRNA–gene pairs in D4, 115 in D9, and 186 in D15. As mentioned, most targeted genes were coordinated downregulated. Since miRNA regulation can target more than one gene, and accordingly, one gene can be targeted by more than one miRNA, we focused on the uncoordinated results with upregulated miRNAs and downregulated targets.
Validation of the gene–miRNA target pairs was corroborated using different in silico sources, investigating the relevance of these targets for hESC differentiation and the confirmation of the miRNA-binding site on the 3′ UTR of the target. Some genes from cardiomyocyte differentiation day 15 were selected due to their relevant connection through miRNA targets, which are FGFR1, SEPHS1, and ALKBH5. All are differentially expressed in D15, with FGFR1 showing downregulation with a log2FoldChange of −2.06, SEPHS1 also being downregulated with a log2FoldChange of −3.95, and ALKBH5 being upregulated with a log2FoldChange of 2.03. On the database miRWalk (Sticht et al., 2018), the prediction coincides with our own, as it suggests that the miRNA hsa-let-7e-5p is expected to target the gene SEPHS1, specifically within the 3′ UTR position. In our results, this miRNA is upregulated with a log2FoldChange of 5.34 (Table 4, Supplementary Figure S2B). The genes FGFR1 and ALKBH5 shared a low-expressed miRNA target, namely, hsa-mir-197-3p. Even though this miRNA is upregulated in D15 with a log2FoldChange of 1.97, lower than the threshold of |2| (Table 4), an additional in silico analysis on the experimentally supported database ENCORI showed that both genes share the same miRNA in a competing endogenous RNA (ceRNA) regulation manner (Supplementary Figure S2C).
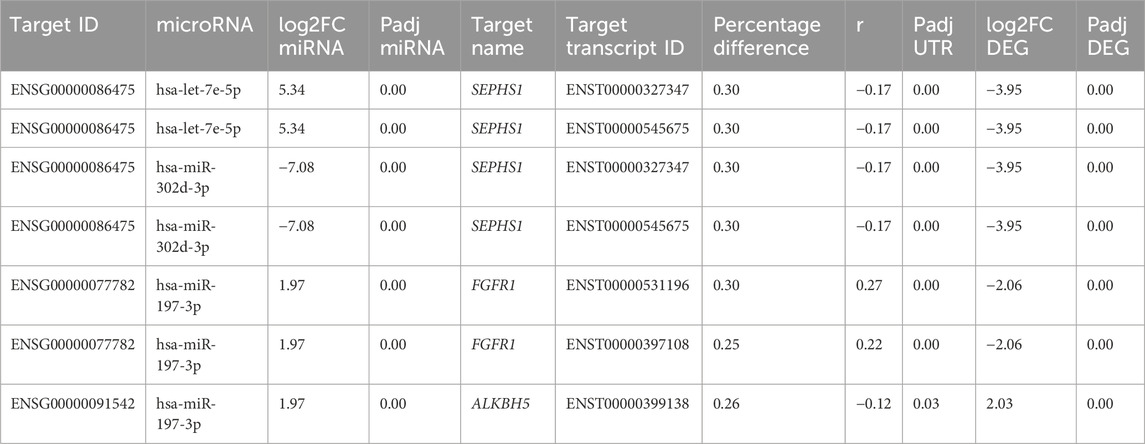
TABLE 4. Differentially expressed genes SEPHS1, FGFR1, and ALKBH5 with alternative polyadenylated transcripts targeted on the 3’ UTR position by differentially expressed miRNAs on day 15 of differentiation of hESCs to cardiomyocytes.
3.5 Dynamic 3′ UTR lengthening is involved in the gene regulatory networks during the cardiomyogenic differentiation of hESCs
Utilizing the miRNA target information on the 3′ UTR sites, we systematically constructed individual gene regulatory networks for the days D4, D9, and D15 of the cardiomyogenic differentiation process from hESCs (Supplementary Figure S3, Figures 5A–C). At the second time point, D1, there were insufficient genes available to construct a gene regulatory network, as already shown (Figure 1; Figure 2; Table 1). This approach allowed us to visualize the specific interactions between differentially expressed miRNAs and genes and how they interplay with alternative APA isoforms. Additionally, we could simultaneously examine the preference of the APA transcripts for longer or shorter 3′ UTRs, providing a comprehensive understanding of the regulatory landscape.
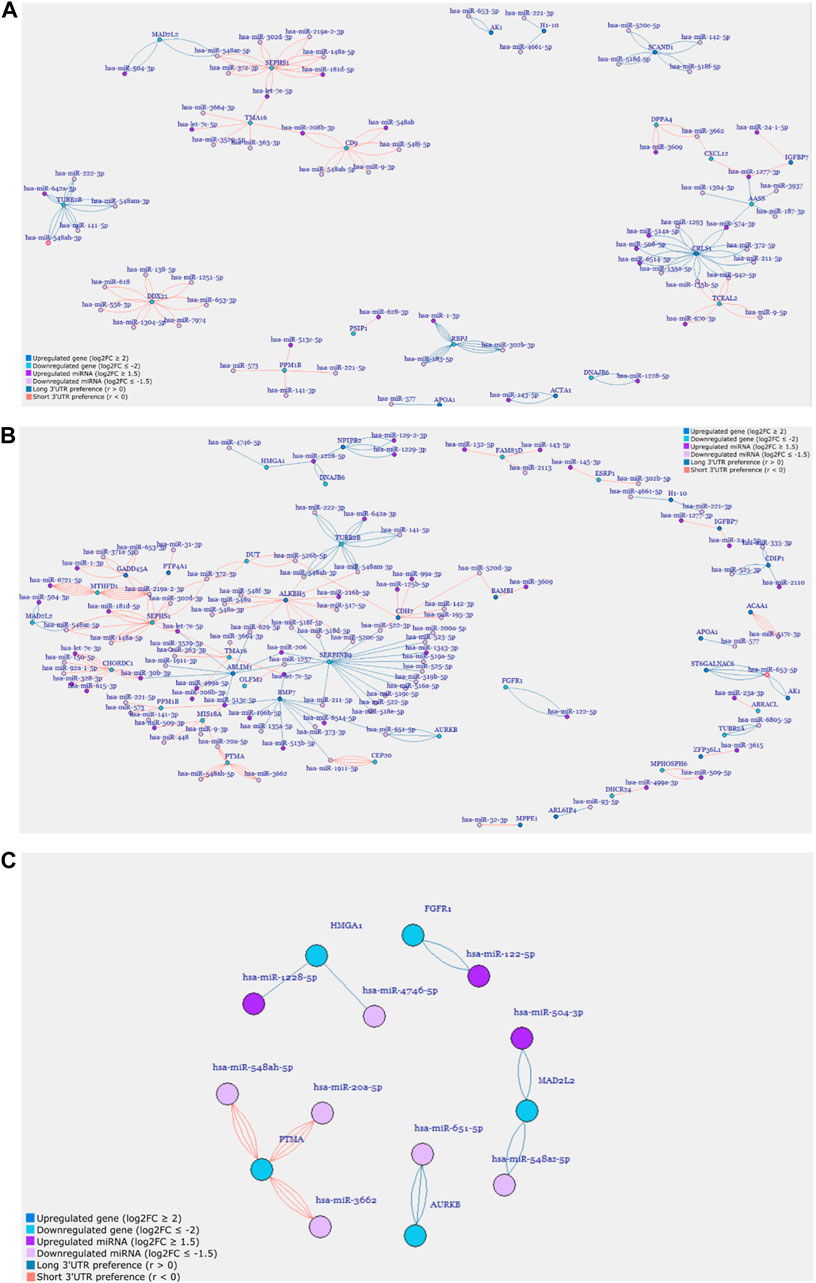
FIGURE 5. Gene regulatory networks of (A) D9P, (B) D15P, and (C) selected cell-cycle-related genes from the cardiomyogenic differentiation of hESC. Genes and miRNA are the vertices, and the transcripts are the edges.
In the first network generated, D4P did not show any connections between genes (Supplementary Figure S3). Some genes showed many miRNA targets, such as CNTNAP2, which was targeted by six different miRNAs, but no other gene shared these miRNAs to make any connection. The gene AASS was targeted by only two other miRNAs; however, they were targeting six different APA isoforms each. Out of these six genes, only two genes had transcripts that showed a preference for short 3′ UTR, which are SPP1 and PMAIP1, while the other four genes had transcripts that showed a preference for long 3′ UTR.
The network for D9P was bigger than that for the previous time point, with 105 miRNA and gene targets and 182 edges (Figure 5A, Supplementary Table S2). Interestingly, two subnetworks appeared, in which the genes are interconnected through their shared miRNA targets. One cluster is composed of SEPHS1, MAD2L2, CD9, TMA16, and ACTA1. The other cluster is composed of IGFBP7, AASS, CXCL12, CRLS1, TCEAL2, TUBB2B, and DPPA4. The gene AASS is present in the network D4P, and here, it shares miRNAs with two other genes in the cluster. Both clusters have genes whose APA isoforms show preferences for both short and long 3′ UTRs. These clusters connected by shared miRNAs are the first piece of evidence of competing endogenous RNA starting on D9 of the cardiomyogenic process.
When we look at the network for D15P, not only did the number of gene targets and miRNA increase but also the edges connecting them, which were 175 and 280, respectively (Supplementary Table S2; Figure 5B). We could visually notice that the second subnetwork seen in D9P is lost, whereas the first subnetwork increases the number of genes interconnected through shared miRNAs, forming a big regulatory network for D15P (Figure 5B). This is demonstrated by a gene that was present in the previously disassembled subnetwork and is now incorporated into the big network of D15P, which is TUBB2B. The gene IGFBP7 also participated in the disassembled cluster; however, it was not incorporated into the network of D15P. There are still some genes that share miRNAs outside the big network, such as HMGA1, DNAJB6, NPIPB2, AK1, and ST6GALNAC6, but they do not form a second significant cluster such as the others seen in D9P (Figure 5A).
After analyzing the regulatory network of D15P, some downregulated genes caught our attention regarding their known relationship to the cell cycle, including FGFR1, MAD2L2, AURKB, HMGA1, and PTMA (Figure 5C). The gene CDC20 (cell division cycle 20) is related to the cell cycle, is downregulated, and shows dynamic 3′ UTR lengthening, but it did not appear in the regulatory network since it was not targeted by any expressed miRNA in our analysis (data not shown). Although they share miRNAs with other genes in the D15P network, such as BMP7 and ABLIM1, they do not share common miRNAs between them. All of them show a preference for longer 3′ UTR, except PTMA, which shows a preference for short 3′ UTR. Visualization of the alignments in D15P for the gene BMP7 in IGV made possible the identification of the dynamic 3′ UTR lengthening, the specific target miRNA on the isoform, and the coverage of reads that indicates the preference for long 3′ UTR usage in D15P (Figure 6).
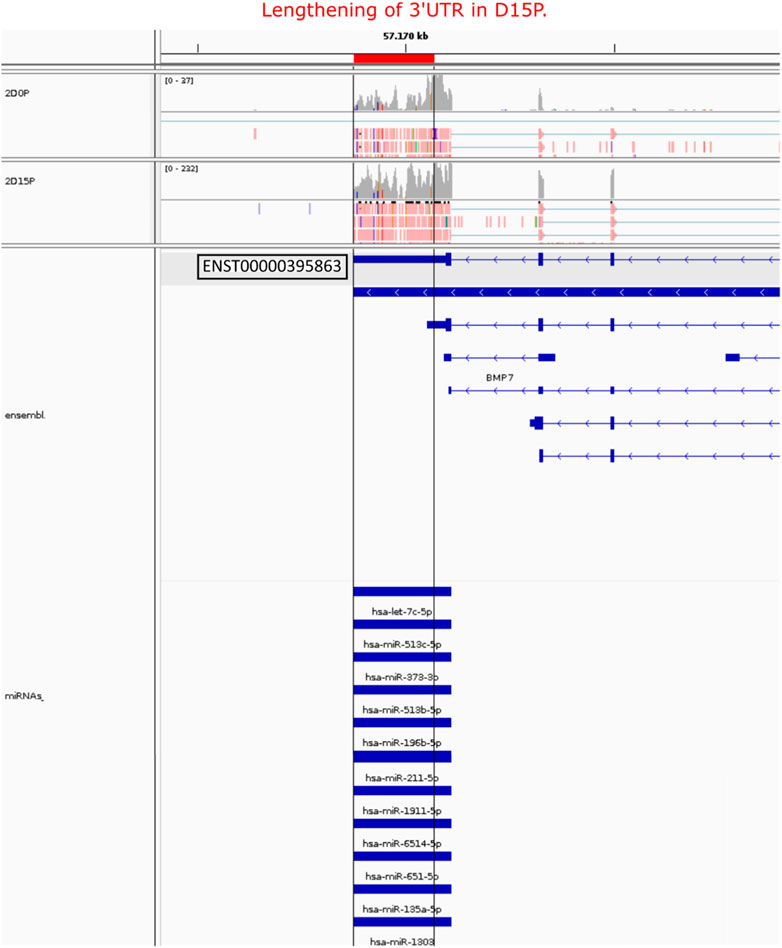
FIGURE 6. Visualization of the alignment of the BMP7 APA isoform, its 3′ UTR length, and its respective miRNA targets. Only the highlighted transcript ENST00000395863 was detected showing lengthening of 3′ UTR length in D15P compared to D0P. All miRNAs listed were targeting the lengthened 3′ UTR isoform on D15P. Gray vertical lines guide the lengthening difference of 3′ UTR length on D15P compared to D0P. At the bottom, the annotation of the transcript is represented in blue, in which boxes indicate exons and lines with arrows indicate introns and orientation in the genome. On the top, reads are represented in red with the read coverage on top. Only two replicates are exemplified in this figure, the second replicate of D0P and the second replicate of D15P.
These results suggest a possible multilayer regulatory interplay between differentially expressed genes, miRNAs, and the dynamics of 3′ UTR lengthening during cardiomyogenesis. Considering that these transcripts were identified and recruited by polysomes, altogether, these results suggest a complex post-transcriptional translational control during the differentiation of hESCs to cardiomyocytes.
4 Discussion
In this work, we analyzed hESC cardiomyogenic differentiation through a post-transcriptional perspective, investigating the dynamic 3′ UTR length change and possible regulation consequences in the polysomal transcriptome. Our results indicate that dynamic 3′ UTR length can influence post-transcriptional regulation through the availability of miRNA target sites during the differentiation of hESCs to cardiomyocytes.
During cardiomyogenesis, each time point of cardiomyogenesis shows a preference for either short or long 3′ UTR length, as compared to the pluripotent stage, reaching differentiated cardiomyocytes with a preference for short 3′ UTRs on D15P. Changes in 3′ UTR length have already been seen before during T-cell and hematopoietic differentiation (Sandberg et al., 2008; Gruber et al., 2014; Sommerkamp et al., 2020). In contrast with other works that show that pluripotent stem cells prefer longer 3′ UTRs in their differentiated state (Sommerkamp et al., 2021), our data indicate that cardiomyocytes in D15 of differentiation appear to preferably express short 3′ UTRs in comparison to the pluripotent stage in D0 of hESCs. Interestingly, the preference for short 3′ UTR is not a steady pattern seen throughout the whole differentiation process. Fluctuation of the preference of APA sites was seen from D1 of differentiation to the other, with the biggest change in cardiac mesodermal commitment on day 4, especially those transcripts that are simultaneously being recruited to polysomal complexes (D4P). The fourth day of differentiation is a crucial time point during hESC differentiation due to its commitment to cardiomyogenesis instead of other cell types (Loh et al., 2016).
Concomitantly, these transcripts are being regulated not only by differential expression but also by the recruitment to polysomal complexes. It was already seen that the cardiac stage of cardiomyogenesis shows regulatory aspects through the recruitment of polysomes (Pereira et al., 2019), but here, we see that it is also associated with the dynamic 3′ UTR changes.
Changes in 3′ UTR length can impact transcript regulation by the gain or loss of regulatory target sites and consequently affect the processes in the cell and, eventually, the proteomic outcome (Gruber et al., 2014; Turner et al., 2018; Mayr, 2019; Sommerkamp et al., 2021). Even though we did not investigate the proteome outcome, the post-transcriptional regulation through polysome recruitment indicates translation control (Schwanhüusser et al., 2011; Tebaldi et al., 2012) throughout the stem cell differentiation process (SPANGENBERG et al., 2013; PEREIRA et al., 2018; ROBERT et al., 2020).
Moreover, APA regulation can change the 3′ UTR landscape of the cell (Mitschka and Mayr, 2022). Therefore, it is expected that hESC cardiomyogenesis differentiation is complexly orchestrated by various layers of regulation that include polysome recruitment as well as 3′ UTR lengthening or shortening. This confirms the importance of investigating the post-transcriptional aspects of the differentiation process instead of stopping at gene expression.
For the miRNA target analysis, we guaranteed that both miRNA and their gene target were expressed in the respective differentiation days, which is an essential step to ensure that the regulation found can indeed occur (van Dam et al., 2018). By thoroughly analyzing some of the differentially expressed genes that were targeted by miRNAs expressed during cardiomyogenic differentiation, we corroborated our target predictions on the position of the 3′ UTR of those transcripts on experimentally validated databases, such as miRWalk and ENCORI (J. H. Li et al., 2014; Sticht et al., 2018). In this manner, the gene SEPHS1 was found downregulated on day 15 of cardiomyogenic differentiation, and it was targeted on the 3′ UTR by the upregulated microRNA hsa-let-7e-5p. The family of let-7 microRNAs is essential for cardiomyocytes derived from stem cells, as it is required for their correct maturation (Kuppusamy et al., 2015; Kumar et al., 2019). These miRNAs are also found highly expressed in hESCs, possibly playing a role in their self-renewal properties (Koh et al., 2010). In addition, SEPHS1 was found to be targeted by miRNA hsa-mir-302d-3p, which is well known for playing a key role in the proliferation of human pluripotent stem cells, including the ones that derive from cardiomyocytes (H.-L. Li et al., 2016; Xu et al., 2019). The gene SEPHS1 itself is essential for cardiomyogenesis derived from mouse ESC (Qiao et al., 2022), which also supports our findings. The interconnection of genes through the share of common miRNAs was evidenced by the pair of downregulated FGFR1 and upregulated ALKBH5 genes, both of which were targeted by the upregulated hsa-mir-197-3p of a log2FoldChange of 1.97. Even though this miRNA did not make the threshold of a log2FoldChange of |2| by 0.03, such a relationship between both genes was corroborated in the experimentally validated ENCORI database as a ceRNA regulatory relationship. The competing endogenous RNA is a unifying hypothesis, which suggests that the transcripts compete for the same pool of miRNAs due to shared target sites (Salmena et al., 2011). Supporting this hypothesis are the subnetworks that appear first in D9 and then in D15 through the connection of common miRNAs.
Since the downregulation of FGFR1 is known to play an essential role in maintaining cardiomyocytes in their mature form and preventing entry into the cell cycle (Valussi et al., 2021), we investigated if there were more downregulated genes related to the cell cycle in our gene regulatory networks. It is known that differentiated cells and cardiomyocytes show low proliferation capability due to their inability to reenter the cell cycle (Mohamed et al., 2018; Gladka et al., 2023). Suppressed cell cycle genes were identified on the 15th day of cardiomyogenesis, which corresponds to the differentiated cardiomyocyte time points: MAD2L2, AURKB, FGFR1, HMGA1, PTMA, and CDC20 (cell division cycle 20). Gene expression over time showed that MAD2L2 and PTMA decreased expression over time. The activation of CDC20 plays a role in cell cycle progression inclusive in cardiomyocytes (Yamada et al., 2011), and its low level of expression is related to the binucleation of cardiomyocytes (Milliron et al., 2019). Together with MAD2L2 (mitotic arrest deficient 2-like), they are known to interact to modulate mitosis prior to anaphase and chromosome separation (Pfleger et al., 2001; Listovsky and Sale, 2013). Moreover, MAD2L2 is necessary for maintaining pluripotency in embryonic stem cells (Pirouz et al., 2015; Rahjouei et al., 2017). As for the gene AURKB (also known as Aurora B), it is also a key regulator of mitosis, playing a role in cell division by aligning and segregating the chromosomes (Nigg, 2001; Honda et al., 2003). Apart from being an indicator of cell division, inclusive of cardiomyocytes (Wang et al., 2020), its marker is used to demonstrate cardiac regeneration (Fu et al., 2020).
The gene HMGA1 encodes a key protein that permits the access of small binding proteins to the DNA, which consequently impacts gene expression regulation (Vignali and Marracci, 2020). Although abundantly expressed during embryogenesis and important to maintain stemness, it is found downregulated in adult differentiated tissues (Vignali and Marracci, 2020). In our gene regulatory network, HMGA1 transcripts showed a preference for longer 3′ UTRs. Other works have already shown that an increase in mRNA of HMGA1 is not correlated to increased protein, demonstrating post-transcriptional regulation due to the binding of regulatory elements within the 3′ UTR (Borrmann et al., 2001). A shortage of 3′ UTR of HMGA1 increased its expression, which corroborates with our regulatory network finding where downregulated HMGA1 transcripts showed a preference for longer 3′ UTR. Similarly, prothymosin alpha (PTMA) is important for the binding of transcription factors to DNA and is required for cell division (Piñeiro et al., 2000; Samara et al., 2017). The overexpression of PTMA in cardiomyocytes stimulated their proliferation through the increased expression of the cell cycle genes and improved cardiac regeneration; thus, it is a relevant gene for the treatment of myocardial diseases (Gladka et al., 2023). Finally, FGFR1 plays an important role in hESC differentiation when the suppression of FGFR1 and activation of BMP7, also seen in our D15 network, help the switch to the differentiation state during cardiomyogenesis (Parikh et al., 2015). In summary, these results align with previous studies that indicate that cardiomyocytes derived from various sources tend to be predominantly quiescent and experience cell cycle arrest (Karbassi et al., 2020).
While certain aspects of post-transcriptional gene expression regulation were not addressed in this study, it is important to note that APA regulation can exert an influence beyond the inhibitory actions of miRNAs. In addition to miRNAs, the involvement of RNA-binding proteins (RBPs), transcription factors (TFs), and other factors plays a crucial role in the post-transcriptional regulation and can, therefore, be affected by the 3′ UTR lengthening and shortening (CORBETT, 2018). The analysis of the isoform networks could be further refined by considering aspects such as RNA half-life (Furlan et al., 2021) and the inhibitory potential of individual miRNA molecules, which unfortunately could not be incorporated into the present work. Moreover, the exclusion of long noncoding RNAs (lncRNAs) from the gene regulation network means that we did not account for their potential role as miRNA sponges (Thomson and Dinger, 2016), which could significantly impact the inhibitory capabilities of miRNAs and further affect the post-transcriptional regulatory network of cardiomyogenic differentiation.
5 Conclusion
Our prior research has highlighted the significance of post-transcriptional regulation, emphasizing the role of both coding and non-coding transcripts bound to polysomes in the cardiomyogenic differentiation process (Pereira et al., 2018; Pereira et al., 2019). Building on this foundation, we now explored how APA-induced alterations in 3′ UTR length impact the post-transcriptional landscape in each of the cardiomyogenesis stages. Usage of APA sites can change based on cellular conditions and cell type (Sommerkamp et al., 2021), and here, we highlight that each stage has its own post-transcriptional APA modifications that are also associated with the recruitment of polysomes. Even though gene-regulatory networks are usually constructed with elements such as differentially expressed genes, transcription factors, and binding proteins (Parikh et al., 2015), here, we showed that a network based on dynamic 3′ UTR lengthening changes might support the discovery of miRNA target regulation. Hence, we look at another layer of post-transcriptional regulation during hESC differentiation to cardiomyocytes, one that is dependent on alternative isoforms even though it expresses the same number of genes.
Cardiomyogenic differentiation is a complex process involving the activation and repression of specific genes at different stages. Investigation of transcriptional regulation coupled to polysomal recruitment during the stem cell differentiation process is crucial for understanding the translational dynamics of gene expression in cardiomyogenesis. Together with the changing 3′ UTR lengthening landscape, we were able to observe the temporal dynamics of translation and identify the key genes involved in the differentiation process that are actively recruited into the translational machinery. Other studies also confirmed that APA can regulate stem cell behavior and function directly (Sommerkamp et al., 2021). Therefore, our work provides novel insights into the intricate post-transcriptional regulatory processes during cardiomyogenesis, where differentially expressed genes, differentially expressed miRNAs, and the dynamic lengthening of 3′ UTRs through APA all play a significant role.
This investigation holds promise for advancing our understanding of the post-transcriptional regulatory processes governing stem cell fate commitment, with implications for regenerative medicine and therapeutic strategies for cardiovascular diseases. Understanding the translation control of specific genes can guide the development of strategies to enhance or manipulate the differentiation process for therapeutic purposes.
While this work successfully identified 3′ UTR lengthening patterns in the RNA-seq data, it is crucial to acknowledge certain limitations. Specifically, the utilization of polyadenylation site sequencing (PAS-Seq) or RNA-seq with 3′ end enrichment techniques could offer a more refined and detailed understanding of the 3′ UTR landscape. Incorporating these methodologies in future investigations would enhance the precision and depth of the regulatory network analysis.
Data availability statement
The datasets presented in this study can be found in online repositories. The names of the repository/repositories and accession number(s) can be found at: https://www.ncbi.nlm.nih.gov/, SRP150416.
Ethics statement
Ethical approval was not required for the studies on humans in accordance with the local legislation and institutional requirements because only commercially available established cell lines were used.
Author contributions
AH-F: data curation, formal analysis, funding acquisition, investigation, methodology, validation, visualization, writing–original draft, and writing–review and editing. JA: data curation, investigation, methodology, software, supervision, validation, and writing–review and editing. MF: data curation and writing–review and editing. HS: data curation, methodology, supervision, and writing–review and editing. BD: conceptualization, data curation, funding acquisition, investigation, methodology, project administration, supervision, validation, writing–original draft, and writing–review and editing. LS: conceptualization, data curation, formal analysis, investigation, methodology, project administration, software, supervision, validation, visualization, writing–original draft, and writing–review and editing.
Funding
The authors declare that financial support was received for the research, authorship, and/or publication of this article. This study was financed in part by the Coordination for the Improvement of Higher Education Personnel (CAPES)—Brazil, financial code 001.
Acknowledgments
The authors thank Prof Dr. Ralf Hofestädt for receiving and hosting AF-H. in his group at the Bioinformatics and Medical Informatics Department of the University of Bielefeld during her Sandwich Doctorate stay from 2022 to 2023.
Conflict of interest
The authors declare that the research was conducted in the absence of any commercial or financial relationships that could be construed as a potential conflict of interest.
Supplementary material
The Supplementary Material for this article can be found online at: https://www.frontiersin.org/articles/10.3389/fmolb.2024.1336336/full#supplementary-material
References
Anders, S., Pyl, P. T., and Huber, W. (2015). HTSeq--a Python framework to work with high-throughput sequencing data. Bioinforma. Oxf. Engl. 31 (2), 166–169. doi:10.1093/bioinformatics/btu638
Andrews, S. (2015). FASTQC A quality control tool for high throughput sequence data. Babraham Institute Available at: http://www.bioinformatics.babraham.ac.uk/projects/fastqc.
Beqqali, A., Kloots, J., Ward-van Oostwaard, D., Mummery, C., and Passier, R. (2006). Genome-wide transcriptional profiling of human embryonic stem cells differentiating to cardiomyocytes. Stem Cells 24 (8), 1956–1967. doi:10.1634/stemcells.2006-0054
Bhagavati, S. (2015). Stem cell therapy: challenges ahead. Indian J. Pediatr. 82 (3), 286–291. doi:10.1007/s12098-014-1521-5
Borrmann, L., Wilkening, S., and Bullerdiek, J. (2001). The expression of HMGA genes is regulated by their 3’UTR. Oncogene 20, 4537–4541. doi:10.1038/sj.onc.1204577
Brade, T., Pane, L. S., Moretti, A., Chien, K. R., and Laugwitz, K. L. (2013). Embryonic heart progenitors and cardiogenesis. Cold Spring Harb. Perspect. Med. 3 (10), a013847. doi:10.1101/cshperspect.a013847
Corbett, A. H. (2018). Post-transcriptional regulation of gene expression and human disease. Curr. Opin. Cell Biol. 52, 96–104. doi:10.1016/j.ceb.2018.02.011
Csardi, G., and Nepusz, T. (2006). The igraph software package for complex network research. InterJournal Complex Systems 1695, 1–9.
Dai, X., Zhuang, Z., and Zhao, P. X. (2018). PsRNATarget: a plant small RNA target analysis server (2017 release). Nucleic Acids Res. 46 (W1), W49–W54. doi:10.1093/nar/gky316
Fu, W., Liao, Q., Li, L., Shi, Y., Zeng, A., Zeng, C., et al. (2020). An Aurora kinase B–based mouse system to efficiently identify and analyze proliferating cardiomyocytes. Front. Cell Dev. Biol. 8, 570252. doi:10.3389/fcell.2020.570252
Furlan, M., De Pretis, S., and Pelizzola, M. (2021). Dynamics of transcriptional and post-transcriptional regulation. Briefings Bioinforma. 22, bbaa389. doi:10.1093/bib/bbaa389
Garate, X., La Greca, A., Neiman, G., Blüguermann, C., Santín Velazque, N. L., Moro, L. N., et al. (2018). Identification of the miRNAome of early mesoderm progenitor cells and cardiomyocytes derived from human pluripotent stem cells. Sci. Rep. 8 (1), 8072. doi:10.1038/s41598-018-26156-3
Gladka, M. M., Johansen, A. K. Z., van Kampen, S. J., Peters, M. M. C., Molenaar, B., Versteeg, D., et al. (2023). Thymosin β4 and prothymosin α promote cardiac regeneration post-ischaemic injury in mice. Cardiovasc. Res. 119 (3), 802–812. doi:10.1093/cvr/cvac155
Gruber, A. R., Martin, G., Müller, P., Schmidt, A., Gruber, A. J., Gumienny, R., et al. (2014). Global 3′ UTR shortening has a limited effect on protein abundance in proliferating T cells. Nat. Commun. 5, 5465. doi:10.1038/ncomms6465
Gruber, A. J., and Zavolan, M. (2019). Alternative cleavage and polyadenylation in health and disease. Nat Rev Genet 20, 599–614. doi:10.1038/s41576-019-0145-z
Heberle, H., Meirelles, V. G., da Silva, F. R., Telles, G. P., and Minghim, R. (2015). InteractiVenn: a web-based tool for the analysis of sets through Venn diagrams. BMC Bioinforma. 16 (1), 169. doi:10.1186/s12859-015-0611-3
Honda, R., Körner, R., and Nigg, E. A. (2003). Exploring the functional interactions between Aurora B, INCENP, and survivin in mitosis. Mol. Biol. Cell 14 (8), 3325–3341. doi:10.1091/mbc.E02-11-0769
Karbassi, E., Fenix, A., Marchiano, S., Muraoka, N., Nakamura, K., Yang, X., et al. (2020). Cardiomyocyte maturation: advances in knowledge and implications for regenerative medicine. Nat. Rev. Cardiol. 17 (6), 341–359. doi:10.1038/s41569-019-0331-x
Kim, D., Langmead, B., and Salzberg, S. L. (2015). HISAT: a fast spliced aligner with low memory requirements. Nat. Methods 12 (4), 357–360. doi:10.1038/nmeth.3317
Koh, W., Tian Sheng, C., Tan, B., Yi Lee, Q., Kuznetsov, V., Sai Kiang, L., et al. (2010). Analysis of deep sequencing microRNA expression profile from human embryonic stem cells derived mesenchymal stem cells reveals possible role of let-7 microRNA family in downstream targeting of Hepatic Nuclear Factor 4 Alpha. BMC Genomics 11 (1), 6. doi:10.1186/1471-2164-11-S1-S6
Krol, J., Loedige, I., and Filipowicz, W. (2010). The widespread regulation of microRNA biogenesis, function and decay. Nat. Rev. Genet. 11 (9), 597–610. doi:10.1038/nrg2843
Krueger, F. (2015). Trim Galore!: a wrapper tool around Cutadapt and FastQC to consistently apply quality and adapter trimming to FastQ files. Babraham Institute Available at: https://www.bioinformatics.babraham.ac.uk/projects/trim_galore/.
Kumar, N., Dougherty, J. A., Manring, H. R., Elmadbouh, I., Mergaye, M., Czirok, A., et al. (2019). Assessment of temporal functional changes and miRnA profiling of human iPSC-derived cardiomyocytes. Sci. Rep. 9, 13188. doi:10.1038/s41598-019-49653-5
Kuppusamy, K. T., Jones, D. C., Sperber, H., Madan, A., Fischer, K. A., Rodriguez, M. L., et al. (2015). Let-7 family of microRNA is required for maturation and adult-like metabolism in stem cell-derived cardiomyocytes. Proc. Natl. Acad. Sci. U. S. A. 112 (21), E2785–E2794. doi:10.1073/pnas.1424042112
Leitolis, A., Robert, A. W., Pereira, I. T., Correa, A., and Stimamiglio, M. A. (2019). Cardiomyogenesis modeling using pluripotent stem cells: the role of microenvironmental signaling. Front. Cell Dev. Biol. 7, 164. doi:10.3389/fcell.2019.00164
Li, H.-L., Wei, J.-F., Fan, L.-Y., Wang, S.-H., Zhu, L., Li, T.-P., et al. (2016). miR-302 regulates pluripotency, teratoma formation and differentiation in stem cells via an AKT1/OCT4-dependent manner. Cell Death Dis. 7, e2078. doi:10.1038/cddis.2015.383
Li, J. H., Liu, S., Zhou, H., Qu, L. H., and Yang, J. H. (2014). StarBase v2.0: decoding miRNA-ceRNA, miRNA-ncRNA and protein-RNA interaction networks from large-scale CLIP-Seq data. Nucleic Acids Res. 42 (D1), 92–97. doi:10.1093/nar/gkt1248
Listovsky, T., and Sale, J. E. (2013). Sequestration of cdh1 by mad2l2 prevents premature apc/c activation prior to anaphase onset. J. Cell Biol. 203 (1), 87–100. doi:10.1083/jcb.201302060
Loh, K. M., Chen, A., Koh, W., Beachy, P. A., Ang, L. T., Weissman, I. L., et al. (2016). Mapping the pairwise choices leading from pluripotency to human bone, heart, and other mesoderm cell types. Cell 166, 451–467. doi:10.1016/j.cell.2016.06.011
Love, M. I., Huber, W., and Anders, S. (2014). Moderated estimation of fold change and dispersion for RNA-seq data with DESeq2. Genome Biol. 15 (12), 550. doi:10.1186/s13059-014-0550-8
MacDonald, C. C. (2019). Tissue-specific mechanisms of alternative polyadenylation: Testis, brain, and beyond (2018 update). Wiley Interdiscip Rev RNA 10 (4), e1526. doi:10.1002/wrna.1526
Mayr, C. (2019). What are 3′ utrs doing? Cold Spring Harb. Perspect. Biol. 11 (10), a034728. doi:10.1101/cshperspect.a034728
Milliron, H. Y. Y., Weiland, M. J., Kort, E. J., and Jovinge, S. (2019). Isolation of cardiomyocytes undergoing mitosis with complete cytokinesis. Circulation Res. 125 (12), 1070–1086. doi:10.1161/CIRCRESAHA.119.314908
Mitschka, S., and Mayr, C. (2022). Context-specific regulation and function of mRNA alternative polyadenylation. Nat. Rev. Mol. Cell Biol. 23 (12), 779–796. doi:10.1038/s41580-022-00507-5
Mohamed, T. M. A., Ang, Y. S., Radzinsky, E., Zhou, P., Huang, Y., Elfenbein, A., et al. (2018). Regulation of cell cycle to stimulate adult cardiomyocyte proliferation and cardiac regeneration. Cell 173 (1), 104–116. doi:10.1016/j.cell.2018.02.014
Nigg, E. A. (2001). Mitotic kinases as regulators of cell division and its checkpoints. Nat. Rev. Mol. Cell Biol. 2 (1), 21–32. doi:10.1038/35048096
Parikh, A., Wu, J., Blanton, R. M., and Tzanakakis, E. S. (2015). Signaling pathways and gene regulatory networks in cardiomyocyte differentiation. Tissue Eng. - Part B Rev. 21 (4), 377–392. doi:10.1089/ten.teb.2014.0662
Pereira, I. T., Spangenberg, L., Cabrera, G., and Dallagiovanna, B. (2020). Polysome-associated lncRNAs during cardiomyogenesis of hESCs. Mol. Cell. Biochem. 468 (1–2), 35–45. doi:10.1007/s11010-020-03709-7
Pereira, I. T., Spangenberg, L., Robert, A. W., Amorín, R., Stimamiglio, M. A., Naya, H., et al. (2018). Polysome profiling followed by rna-seq of cardiac differentiation stages in hescs. Sci. Data 5, 180287. doi:10.1038/sdata.2018.287
Pereira, I. T., Spangenberg, L., Robert, A. W., Amorín, R., Stimamiglio, M. A., Naya, H., et al. (2019). Cardiomyogenic differentiation is fine-tuned by differential mRNA association with polysomes. BMC Genomics 20 (1), 219. doi:10.1186/s12864-019-5550-3
Pfleger, C. M., Salic, A., Lee, E., and Kirschner, M. W. (2001). Inhibition of Cdh1-APC by the MAD2-related protein MAD2L2: a novel mechanism for regulating Cdh1. Genes Dev. 15 (14), 1759–1764. doi:10.1101/gad.897901
Piñeiro, A., Cordero, O. J., and Nogueira, M. (2000). Fifteen years of prothymosin alpha: contradictory past and new horizons. Peptides 21, 1433–1446. doi:10.1016/s0196-9781(00)00288-6
Pirouz, M., Rahjouei, A., Shamsi, F., Eckermann, K. N., Salinas-Riester, G., Pommerenke, C., et al. (2015). Destabilization of pluripotency in the absence of Mad2l2. Cell Cycle 14 (10), 1596–1610. doi:10.1080/15384101.2015.1026485
Qiao, L., Dho, S. H., Kim, J. Y., and Kim, L. K. (2022). SEPHS1 is dispensable for pluripotency maintenance but indispensable for cardiac differentiation in mouse embryonic stem cells. Biochem. Biophysical Res. Commun. 590, 125–131. doi:10.1016/j.bbrc.2021.12.091
Quinlan, A. R., and Hall, I. M. (2010). BEDTools: a flexible suite of utilities for comparing genomic features. Bioinforma. Oxf. Engl. 26 (6), 841–842. doi:10.1093/bioinformatics/btq033
Rahjouei, A., Pirouz, M., Di Virgilio, M., Kamin, D., and Kessel, M. (2017). MAD2L2 promotes open chromatin in embryonic stem cells and derepresses the Dppa3 locus. Stem Cell Rep. 8 (4), 813–821. doi:10.1016/j.stemcr.2017.02.011
R Core Team (2018). R: a language and environment for statistical computing. R Foundation for Statistical Computing. Available at: https://www.r-project.org/.
Robert, A. W., Marcon, B. H., Dallagiovanna, B., and Shigunov, P. (2020). Adipogenesis, osteogenesis, and chondrogenesis of human mesenchymal stem/stromal cells: a comparative transcriptome approach. Front. Cell Dev. Biol. 8, 561. doi:10.3389/fcell.2020.00561
Salmena, L., Poliseno, L., Tay, Y., Kats, L., and Pandolfi, P. P. (2011). A ceRNA hypothesis: the rosetta stone of a hidden RNA language? Cell 146 (3), 353–358. doi:10.1016/j.cell.2011.07.014
Samara, P., Karachaliou, C. E., Ioannou, K., Papaioannou, E., Voutsas, N. F., Zikos, C., et al. (2017). Prothymosin alpha: an alarmin and more. Curr. Med. Chem. 24 (17), 1747–1760. doi:10.2174/0929867324666170518110033
Sandberg, R., Neilson, R., Sarma, A., Sharp, A., and Burge, B. (2008). Proliferating cells express mRNAs with shortened 3′Untranslated regions and fewer MicroRNA target sites. Science 320 (5883), 1643–1647. doi:10.1126/science.1155390
Schwanhüusser, B., Busse, D., Li, N., Dittmar, G., Schuchhardt, J., Wolf, J., et al. (2011). Global quantification of mammalian gene expression control. Nature 473 (7347), 337–342. doi:10.1038/nature10098
Sommerkamp, P., Altamura, S., Renders, S., Narr, A., Ladel, L., Zeisberger, P., et al. (2020). Differential alternative polyadenylation landscapes mediate hematopoietic stem cell activation and regulate glutamine metabolism. Cell Stem Cell 26 (5), 722–738. doi:10.1016/j.stem.2020.03.003
Sommerkamp, P., Cabezas-Wallscheid, N., and Trumpp, A. (2021). Alternative polyadenylation in stem cell self-renewal and differentiation. Trends Mol. Med. 27 (7), 660–672. doi:10.1016/j.molmed.2021.04.006
Spangenberg, L., Correa, A., Dallagiovanna, B., and Naya, H. (2013). Role of alternative polyadenylation during adipogenic differentiation: an in silico approach. PLoS ONE 8 (10), e75578. doi:10.1371/journal.pone.0075578
Sticht, C., De La Torre, C., Parveen, A., and Gretz, N. (2018). Mirwalk: an online resource for prediction of microrna binding sites. PLoS ONE 13 (10), e0206239. doi:10.1371/journal.pone.0206239
Tebaldi, T., Re, A., Viero, G., Pegoretti, I., Passerini, A., Blanzieri, E., et al. (2012). Widespread uncoupling between transcriptome and translatome variations after a stimulus in mammalian cells. BMC Genomics 13 (220), 220. doi:10.1186/1471-2164-13-220
Thomson, D. W., and Dinger, M. E. (2016). Endogenous microRNA sponges: evidence and controversy. Nat. Rev. Genet. 17 (5), 272–283. doi:10.1038/nrg.2016.20
Thorvaldsdóttir, H., Robinson, J. T., and Mesirov, J. P. (2013). Integrative Genomics Viewer (IGV): high-performance genomics data visualization and exploration. Briefings Bioinforma. 14 (2), 178–192. doi:10.1093/bib/bbs017
Trounson, A., and McDonald, C. (2015). Stem cell therapies in clinical trials: progress and challenges. Cell Stem Cell 17 (1), 11–22. doi:10.1016/j.stem.2015.06.007
Turner, R. E., Pattison, A. D., and Beilharz, T. H. (2018). Alternative polyadenylation in the regulation and dysregulation of gene expression. Seminars Cell & Dev. Biol. 75, 61–69. doi:10.1016/J.SEMCDB.2017.08.056
Valussi, M., Besser, J., Wystub-Lis, K., Zukunft, S., Richter, M., Kubin, T., et al. (2021). Repression of Osmr and Fgfr1 by miR-1/133a prevents cardiomyocyte dedifferentiation and cell cycle entry in the adult heart. Sci. Adv. 7, eabi6648. doi:10.1126/sciadv.abi6648
van Dam, S., Võsa, U., van der Graaf, A., Franke, L., and de Magalhães, J. P. (2018). Gene co-expression analysis for functional classification and gene-disease predictions. Briefings Bioinforma. 19 (4), 575–592. doi:10.1093/bib/bbw139
Vignali, R., and Marracci, S. (2020). HMGA genes and proteins in development and evolution. Int. J. Mol. Sci. 21 (2), 654. doi:10.3390/ijms21020654
Wang, F., Liu, S., Pei, J., Cai, L., Liu, N., Liang, T., et al. (2020). LPA3-mediated lysophosphatidic acid signaling promotes postnatal heart regeneration in mice. Theranostics 10 (24), 10892–10907. doi:10.7150/thno.47913
Xu, F., Yang, J., Shang, J., Lan, F., Li, M., Shi, L., et al. (2019). MicroRNA-302d promotes the proliferation of human pluripotent stem cell-derived cardiomyocytes by inhibiting LATS2 in the Hippo pathway. Clin. Sci. 133 (13), 1387–1399. doi:10.1042/CS20190099
Yamada, K., Tamamori-Adachi, M., Goto, I., Iizuka, M., Yasukawa, T., Aso, T., et al. (2011). Degradation of p21 Cip1 through anaphase-promoting complex/cyclosome and its activator Cdc20 (APC/C Cdc20) ubiquitin ligase complex-mediated ubiquitylation is inhibited by cyclin-dependent kinase 2 in cardiomyocytes. J. Biol. Chem. 286 (51), 44057–44066. doi:10.1074/jbc.M111.236711
Ye, C., Long, Y., Ji, G., Li, Q. Q., and Wu, X. (2018). APAtrap: identification and quantification of alternative polyadenylation sites from RNA-seq data. Bioinformatics 34 (11), 1841–1849. doi:10.1093/bioinformatics/bty029
Keywords: human embryonic stem cells, miRNA, polysome profiling, gene regulatory network, cardiomyocytes, cardiomyogenesis
Citation: Hansel-Frose AFF, Allmer J, Friedrichs M, dos Santos HG, Dallagiovanna B and Spangenberg L (2024) Alternative polyadenylation and dynamic 3′ UTR length is associated with polysome recruitment throughout the cardiomyogenic differentiation of hESCs. Front. Mol. Biosci. 11:1336336. doi: 10.3389/fmolb.2024.1336336
Received: 10 November 2023; Accepted: 11 January 2024;
Published: 06 February 2024.
Edited by:
Xiao-Min Liu, China Pharmaceutical University, ChinaReviewed by:
Yiota Kafasla, Alexander Fleming Biomedical Sciences Research Center, GreeceArijita Sarkar, University of Southern California, United States
Copyright © 2024 Hansel-Frose, Allmer, Friedrichs, dos Santos, Dallagiovanna and Spangenberg. This is an open-access article distributed under the terms of the Creative Commons Attribution License (CC BY). The use, distribution or reproduction in other forums is permitted, provided the original author(s) and the copyright owner(s) are credited and that the original publication in this journal is cited, in accordance with accepted academic practice. No use, distribution or reproduction is permitted which does not comply with these terms.
*Correspondence: Lucía Spangenberg, bHVjaWFAcGFzdGV1ci5lZHUudXk=