Abstract
Objective:
Colorectal cancer (CRC) is the third most common tumor worldwide and the second leading cause of cancer-related deaths. Colorectal cancer progresses slowly, and patients have to endure pain for a long time, both before and after surgery. The incidence rate has been increasing year by year in recent years, and the survival rate of patients is low. The number of new cases and deaths is expected to grow to 3.2 million and 1.6 million, respectively, by 2040. Currently, limited treatment (including surgical resection and radiotherapy) and systemic treatment (including chemotherapy and immune-targeted therapy) are the mainstays of colorectal cancer treatment, but the delay in treatment is still caused by untimely detection. In addition, some colorectal cancers are due to diet and lifestyle habits, but some are still due to heredity. Therefore, it is of great importance to analyze the genomic profiles of colorectal cancer and its paraneoplastic tissues, explore the disease-causing risk genes, and search for the potential novel therapeutic targets to improve the therapeutic efficacy of colorectal cancer.
Methods:
Tumor and adjacent tissue samples were harvested from 26 colorectal cancer patients and divided into tumor and paraneoplastic tissues. Whole genome sequencing was performed on these two groups of samples to obtain somatic and germ line mutation data of the two groups of samples, and then based on the data of the two groups, we screened and analyzed the mutation spectra and mutation characteristics, high-frequency copy number variations, and high-frequency mutated genes of tumor and paraneoplastic samples, thus mapping the genomic map of tumor and cancer susceptibility genes of paraneoplastic samples. The genomic profiles of the tumor and paraneoplastic samples were subsequently mapped. Finally, we performed pan-cancer expression analysis of SH3BP1, a susceptibility gene with a high mutation frequency. We also performed differential analysis of SH3BP1 gene expression. We verified its expression level and function by protein blotting, immunohistochemistry, and cell scratch and cell viability assays. These assays further confirmed the validity and reliability of the sequence genome profiles and explored new therapeutic targets for colorectal cancer.
Results:
Significant gene mutation differences were observed between the tumor and adjacent normal tissue by whole genome sequencing. Gene spectral analysis of the tumors revealed that the tumors were characterized by C>T mutation types, and most of the samples were dominated by signature A mutation characteristics. High-frequency copy number analysis showed that most samples had increased copy numbers of gene fragments on chromosomes 7, 13, and 20. In addition, one high-frequency mutated gene (ATAD3B) and six candidate susceptibility genes were screened from the mutation data results, in which the probabilities of susceptibility genes mutated in normal tissues next to cancer were CPA6 (3.85%), ZNF888 (46.15%), SH3BP1 (76.92%), ANKRD16 (30.77%), ATN1 (11.54%), and C4orf54 (80.77%); based on which we roughly came up with more ideal cancer susceptibility genes, i.e., SH3BP1 and C4orf54. Then, using SH3BP1 as a target gene, we demonstrated increased SH3BP1 expression in numerous cancers, particularly COAD and READ, through pan-cancer and differential gene expression analyses. We also verified differential SH3BP1 expression in tumor and precancerous tissues using immunohistochemistry and protein blotting. After breaking down SH3BP1 expression in cells, we performed a cell scratch assay. The cell scratch assay showed that tumor cell migration was reduced in cells with low SH3BP1 expression. The CCK8 assay showed that tumor cell proliferation slowed down in cells with low SH3BP1 expression compared to cells with high SH3BP1 expression. This suggests that SH3BP1 may promote tumor proliferation and migration in colorectal cancer and offers the opportunity to be used as a therapeutic target.
Conclusion:
The large differences between single nucleotide mutations and insertion-deletion mutations in somatic cells and germ line cells indicate the large changes in the genome, especially in the non-coding region genome, during the transformation of normal tissue adjacent to cancer into cancerous tissue. In addition, the susceptibility gene SH3BP1 found in this study has the role of promoting colorectal cancer, which has good research value and is expected to be a new target for colorectal cancer treatment.
1 Introduction
Colorectal cancer (CRC) is a common malignancy and a major global public health problem. (Abedizadeh et al., 2024). Colorectal cancer is known to be influenced by environmental and genetic factors, as well as unique molecular alterations, genomic manifestations, and pathogenesis. It shows obvious heterogeneity as well as genomic instability and molecular alterations, and this instability includes chromosomal instability and microsatellite instability, which can be categorized into four molecular types based on clinical and pathological features, including MSI (immune-type), CMS2 (classic-type), CMS3 (metabolic-type), and CMS4 (mesenchymal-type), and the different types have different clinical manifestations and different types have different clinical manifestations and prognostic relevance, requiring the development of targeted treatments (Guinney et al., 2015; Li J. et al., 2021; Golas et al., 2022; Dunne and Arends, 2024). Colorectal cancer can be divided into early-onset and late-onset; the probability of early-onset colorectal cancer in younger patients is increasing every year, and by around 2030, patients with early-onset colorectal cancer will account for 11% of the total number of colon cancers and 23% of the total number of rectal cancers, respectively (Akimoto et al., 2021; Spaander et al., 2023), and early-onset colorectal cancer has a higher mutation frequency and lower survival rate than other types (Ionescu et al., 2023). Therefore, mapping the colorectal cancer genome and searching for new potential therapeutic targets are of significant importance for clinical diagnosis and treatment.
Whole genome sequencing (WGS) can map a large number of genomic variants without the need for. Sequential genetic testing and has become an important tool for molecular genetic diagnosis of many diseases (Bagger et al., 2024). Whole genome sequencing has obvious advantages over other sequencing methods, as whole exome sequencing (WEG) is unable to sequence the non-coding regions, while whole genome sequencing is not only able to detect genes with variants in the non-coding regions but also able to target enough genes in the coding regions for better coverage (Kim et al., 2023). Whole genome sequencing is widely used, especially for the study of tumor genome can provide incomparable help (Meggendorfer et al., 2022). Whole genome sequencing is used in colorectal tumors and paracancerous tissues to analyze their genetic profiles, which can open a new direction for tumor treatment.
SH3 structural domain binding protein-1 (SH3BP1) is a member of the RhoGAP family (Schlam et al., 2015), which regulates the GTP-activating protein (GAP) activity of Rac1 by binding to the exocytic complex, thereby modulating cellular motility and migration functions (Parrini et al., 2011). In addition, SH3BP1 acts as a GTPase-activating protein of Cdc42 and forms a complex with filamentous protein plus capsid protein (CapZ) to restrict Cdc42 signaling to regulate actin-driven cell membrane remodeling and intercellular junctions, maintains the morphology, stability, and connectivity of epithelial cells, and may be involved in epithelial-mesenchymal transition (EMT) (Elbediwy et al., 2012; Kang et al., 2020), and is thus considered an important regulator of cancer cell metastasis, which may promote the value-added migration of tumor cells. However, the expression and related roles of SH3BP1 in colorectal cancer (CRC) have not been investigated. Therefore, as a susceptibility-pathogenicity gene screened in the genomic map of CRC, its role in CRC is worth exploring.
In this study, we used a combination of whole genome sequencing and basic experiments to map the genomic profiles of colorectal tumors and parasites tissues. We also explored the expression and function of the cancer susceptibility gene SH3BP1 in colorectal cancer. Our results demonstrated significant differences in gene mutations, mutation frequency, mutation features, and copy number mutations between tumor and paraneoplastic tissues. We also screened the corresponding high-frequency mutated and susceptibility genes. First, pan-cancer expression analysis revealed that SH3BP1 is highly expressed in many cancers. Gene expression difference analysis immediately followed and proved that SH3BP1 showed high expression in COAD and READ. Finally, experimental results showed that SH3BP1 was differentially expressed between colorectal tumors and normal tissues adjacent to cancer. SH3BP1 also promoted tumor proliferation and migration. Thus, SH3BP1 has the potential to be utilized as a therapeutic target for colorectal cancer and can provide new ideas for its treatment.
2 Materials and methods
2.1 Patient and tissue samples
Tumor specimens and corresponding precancerous normal tissues were collected from 26 colorectal cancer patients from October 2023 to January 2024, excluding patients with advanced disease, active malignancies, or those who had received radiotherapy or chemotherapy. All tissue specimens were available from patients diagnosed with colorectal cancer by histopathological examination at Wuxi People’s Hospital, and all specimens were frozen in liquid nitrogen and transferred to the specimen bank of the Clinical Research Center. 26 patients were identified by their sample name, sample type, sampling time, sex, age, height, weight, differentiation grade, TNM staging, pathology, clinical staging, immunohistochemistry, tumor size, vascular invasion, and nerve invasion, as described in the following table. Invasion, and nerve invasion, as detailed in Supplementary Table S1. This study was conducted in accordance with the ethical standards of Helsinki, and the Medical Ethics Committee of Wuxi People’s Hospital approved the study.
2.2 DNA extraction and quality control
Sample DNA was extracted using the TIANNamp Genomic DNA Kit (Tiangen Biotech, China), and DNA quality control was performed using the following two methods: Nanodrop for DNA concentration and Agilent 4150/5400 for DNA integrity.
2.3 Library building and sequencing
Using the IGT Enzyme Plus Library Prep Kit V3 (iGeneTech, China), the DNA was cut into fragments of approximately 350 bp, end repaired, “A” tailed, and annealed to the sequencing junctions, and then the products were purified by magnetic beads. Then the product was purified by magnetic beads, and the original library with moderate fragment length was selected for the next step of PCR amplification. The amplified product was purified by magnetic beads, and the small fragment library for sequencing was obtained.
After the library construction was completed, Qubit was used for quantification, followed by Agilent 4150/Qseq400 to test the insert size of the library to ensure its quality. Sequencing was performed on an Illumina Noveaseq 6000 (Kokuryo et al., 2025). The sequencing mode was PE150, which means that in the constructed DNA small fragment library, each insert fragment was sequenced at both ends, 150 bp at each end (Li X. et al., 2021).
2.4 Data quality control
Data filtering primarily eliminates the following three situations: the length after truncation of the splice sequence is less than 50 bpm; the number of bases at one end of a single piece of data is more than 5% of the total base ratio of that piece of data; and the number of inferior bases at one end of a single piece of data is more than 50% of the total bases of that piece of data.
2.5 Compare data
The filtered data were compared to the human reference genome using the Burrows-Wheeler alignment tool (BWA) (Li and Durbin, 2009). The initial results in BAM format were obtained after BMA processing, and the final comparison results in BAM format were obtained by further using Picard software for processing, such as labeling repetitive sequences. These aligned results were used to perform statistics on sequencing depth and coverage.
2.6 Somatic and germline mutations
GATK-Mutect2 was used to detect somatic single nucleotide mutations, insertion and deletion mutations (Pei et al., 2021), and these sequences were compared and corrected with paracancerous samples to filter out normal tissue information. The tested somatic mutation data were annotated using ANNOVAR software. Detection of germline single nucleotide mutations and insertion and deletion mutations was performed using GATK.
2.7 Mutation spectrum and mutation characterization, high-frequency mutant gene analysis, high-frequency single nucleotide variant analysis
Single nucleotide mutations based on somatic cells were analyzed from multiple perspectives, and the mutation spectrum and mutation characteristics of the derived tumor samples were plotted using R language software. Fisher’s exact test method was used to screen for high-frequency mutated genes in the somatic cell mutation data (Mateo et al., 2020). The distribution of copy number mutations in the samples as well as on the chromosomes was analyzed using GISTIC software along with somatic single nucleotide mutation analysis.
2.8 Susceptibility screening
This genetic screen is based on the screening of paraneoplastic normal tissue germline variation data to derive susceptibility genes in paraneoplastic normal tissues that may lead to the transformation of carcinoma into cancer. The screening methods include (1) removing variants with sequencing depth less than 10X; (2) removing variant loci with a high frequency of Yubo 0.0014 in the Thousands, ExAc, and esp6500 databases, directly removing loci in the dbSNP database, and retaining loci in the COSMIC database; (3) deleting variant loci in intergenic, non-coding, and intronic regions; (4) filtering out synonymous mutations as well as phase duplication genes; and (5) removing harmless mutations according to the results of the ljb23-sift, ljb23-pp2hvar, ljb23-pp2hdiv, and ljb23-mt databases.
2.9 Data acquisition
Gene expression data were available from The Cancer Genome Atlas (TCGA) and the Genotype-Tissue Expression Project (GTEx) databases. This included RNA-seq data of SH3BP1 from 33 types of cancer, as well as normal colorectal tissue. The data was normalized using the log2 (TPM+1) method and then employed to subsequent analysis. The results of the analyses were visualized using public R package.
2.10 Pan-cancer expression analysis
Duplicate and missing RNA-seq data from the GTEx and TCGA databases were exempted. The expression levels of SH3BP1 in various cancer types were tested and visualized in R Studio (version 4.2.3). Statistical comparisons were carried out using the “stats” (version 4.2.1) and “car” (version 3.1.0) packages. We chose analysis of variance (ANOVA) as the statistical method for assessing differential expression of SH3BP1. The analysis primarily examined differences in SH3BP1 expression between various cancer and normal tissues.
2.11 Differential expression analysis
We assessed the expression levels of SH3BP1 mRNA in colon (COAD) and rectal (READ) adenocarcinomas during gene expression comparisons between cancerous and normal tissues. Box plots were subsequently generated. Meanwhile, the expression levels of cancer susceptibility genes obtained from sequencing were compared in COAD and READ, and heat maps were created.
2.12 Cell lines and cell culture
Two human colorectal cancer cell lines (HCT116, RKO) and one normal human intestinal epithelial cell line (NCM460) were employed in this experiment. All cells were available from the Clinical Research Center of Wuxi Medical Center, Nanjing Medical University. All cells were grown in DMEM medium (Gibco, United States) containing fetal bovine serum (Biological Industries, Israel) and double antibody (NCM Biotech, China). They were cultured at 37°C in a constant temperature incubator containing 5% carbon dioxide.
2.13 Western blot
RIPA lysis buffer (CWBIO, China) was mixed with EDTA, protease inhibitor, and phosphatase inhibitor (Beyotime, China) at a ratio of 1:100 (1000µlRIPA, 10µlEDTA, 10 µL protease inhibitor, 10 µL phosphatase inhibitor) to lose the cells and allowed to stand on ice for 20 min. The cells were centrifuged at 12,000 rpm for 10 min, and the supernatant was combined with loading buffer (CWBIO, China) at a ratio of 4:1. The mixture was boiled for 5 min, removed, and permitted to stand at room temperature before sodium dodecyl sulfate-polyacrylamide gel electrophoresis (SDS-PAGE). The protein was then transferred to a polypropylene fluoride membrane (PVDF, Millipore, United States) by membrane transfer, followed by rapid sealing with sealing solution (Beyotime, China) for 30 min, and then placed in the box with diluted primary antibodies SH3BP1 (1:5000, Proteintech, China) and GAPDH (1:2000, Affinity Biosciences, United States) overnight at 4°C in a refrigerator shaker. The next day, the antibody was retrieved, washed three times with TBS (Tris-HCl buffered saline) and Tween (TBST, CWBIO, China), diluted with secondary antibody (1:2000, Proteintech, China), and shaken for 1 h, and then washed three times with TBST. The 1:1 developer (ThermoFisher, United States) was exposed. Data quantification was conducted using the Fiji software (ImageJ, United States). GAPDH served as a control in this study.
2.14 Immunohistochemistry
Tissue was trimmed, fixed in 10% paraformaldehyde for 24 h, dehydrated, cleared, embedded in wax, embedded, and cut into 4-μm thick sections. The sections were baked, delayed, hydrated, antigen retrieved, and blocked with endogenous peroxidase. The sections were subsequently incubated with 4% rabbit serum for 15 min at room temperature to reduce specific staining. The sections were subsequently incubated with primary antibody (1:500, Proteintech, China) for 2 h. This was accompanied by incubation with secondary antibody at room temperature for 30 min. Next, DAB was added dropwise for color development, monitored by staining with hematoxylin for 30 s, differentiation with 0.1% hydrochloric acid, rinsing with tap water for 3 min, blueing with ammonia, and further rinsing with tap water for 3 min. Finally, the slides were dehydrated, made transparent, and sealed. The slides were celebrated under a fluorescence microscope (ZEISS, Germany).
2.15 Transient transfection of cells
Cellular SH3BP1 expression was silenced by small interfering RNA (RIBOBIO, China). The sequences of shRNAs are the following.
siSH3BP1-1:5′-CCAGCAACATCGCCATAGT-3';
siSH3BP1-2:5′-GTCACAGCCATACGACCAT-3′
siSH3BP1-3:5′TGCCAGCCATCCTCAAACA-3'.
Opti-MEM medium (Gibco, United States) 125 µL was used to add to tubes containing 10 µL siRNA and lipo3000 (ThermoFisher, United States), respectively; then siRNA dilution was added to lipo3000 dilution, mixed well, and allowed to stand for 15 min. Transfection reagent was prepared for transfection.
2.16 Scratch test
Before the cells were passaged into the six-well plate, the scratch film (Beyotime, China) was placed in the plate, and UV light irradiation was applied for 20 min to start the passage and spreading of the plate, and the length was up to 90%. On the back of the six-well plate, two horizontal lines were drawn along the ruler as a marking line to observe the cells; the original culture medium was discarded, the film was gently torn off, and the scratch film intersected with the marking line perpendicularly, and the intersection point was used as a fixed detection point. Immediately after serum-free DMEM medium (Gibco, United States) was added, the cell photographs were observed with a microscope (Nikon, Japan) as a control and then placed in an incubator, and the growth of cells near the scratches was recorded at different times: 0 h, 24 h, and 48 h.
2.17 Cell viability assay (CCK-8)
RKO and HCT116 colorectal cancer cells, which were transformed with either si-NC or si-SH3BP1, were inoculated into 96-well plates at a density of 2,000 cells per well. Three groups were established: experimental, control, and blank, with six replicates in each group. At 0, 1, 2, 3, 4and 5days, 10 µL of CCK-8 reagent was in addition to each well. The wells were not subject to light and incubated for 2 hours in an incubator. Measure the optical density (OD) at 450 nm using a spectrophotometer. Generate a growth curve.
2.18 Statistical analysis
All data are expressed as mean ± SEM (±SD). Analytical plotting for this postgraduate letter section was performed by R4.2.3. Descriptive statistics were utilized to summarize sample data characteristics as well as mutation frequencies, while Fisher’s exact test was applied. All raw p values for the above tests were adapted by a very conservative Bonferroni correction. Images were analyzed and processed in the experimental part using Fiji software (ImageJ, United States) and GraphPad Prism 10.1.2 (GraphPad Software, United States). All p-values <0.05 were examined statistically significant.
3 Result
3.1 Samples and clinical data
We performed whole-genome sequencing of colorectal tumors and their paracancerous normal tissues, and collected samples of tumors and their paracancerous normal tissues from 26 patients diagnosed with colorectal cancer; all samples were collected with the approval of the institutional ethical review board. Supplementary Tables S1 and Table 1 show the relevant clinical characteristics of the group. At the time of diagnosis, 42.31% of the patients were females and another 57.69% were male. Overall, 65.38% of patients in this cohort had adenocarcinoma, 7.69% and 3.85% had mucinous and tubular adenocarcinoma, respectively, and 19.23% had specific types of adenocarcinoma, including adenocarcinoma with mucinous adenocarcinoma and tubular-papillary adenocarcinoma. Vascular invasion and nerve invasion were found in 34.62% and 38.46% of patients, respectively. The percentages of patients classified as having clinical stage I, II, III, and IV disease were 7.69%, 30.77%, 61.54%, and 0%, respectively. In addition, 76.92% of the tumors had grade 2 differentiation, 19.23% had grade 2–3 as well as 3.85% had grade 3.
TABLE 1
| Features | Total (N = 26) |
|---|---|
| Cancer type, n (%) | |
| Adenocarcinoma | 17 (65.38%) |
| Mucinous adenocarcinoma | 2 (7.69%) |
| tubular adenocarcinoma | 1 (3.85%) |
| Special types of adenocarcinoma | 5 (19.23%) |
| Gender, n (%) | |
| Female | 11 (42.31%) |
| male | 15 (57.69%) |
| Height (mean ± SD) | 159 ± 4.69 |
| Weight (mean ± SD) | 60.5 ± 3.70 |
| Clinical staging, n (%) | |
| I | 2 (7.69%) |
| II | 8 (30.77%) |
| III | 16 (61.54%) |
| IV | 0 (0%) |
| pathological differentiation grade, n (%) | |
| Level 2 | 20 (76.92%) |
| Level 2–3 Level 3 |
5 (19.23%) 1 (3.85%) |
| Invasion of the vascular vessels, n (%) | |
| Ture | 9 (34.62%) |
| false | 17 (65.38%) |
| Nerve invasion, n (%) | |
| Ture | 10 (38.46%) |
| false | 16 (61.54%) |
Clinical characteristics of patients with colorectal cancer.
3.2 Genomic landscape of tumor samples
3.2.1 Single nucleotide somatic mutation
Single nucleotide variants (SNVs) are caused by single nucleotide changes in the genome and are also known as point mutations. We performed whole genome sequencing on 26 colorectal cancer tumor samples and used GATK-Mutect2 to detect single nucleotide variants. As shown in Table 2, a total of 19,314 coding region exonic mutations, 7,102 synonymous mutations, 11,539 non-synonymous mutations, 105,9953 intergenic mutations, 63,4314 intronic mutations, and 188,7502 total mutations were detected. In colorectal cancer patients, the number of mutations occurring in exons outside the coding region accounts for approximately 10% or less of the total number of mutations, but there are three samples (E1, R1, and AF1) with particularly high numbers of mutations (1947, 7144, and 1467, respectively), which is also the case for synonymous mutations, coding region intronic mutations, and nonsynonymous mutations (Table 2). Single nucleotide mutations in CRC occur mainly in the intergenic region, followed by the intron region. Among the non-coding regions, there were a total of 8,406 exon mutations, while there were as many as 119,281 intron mutations, showing that intron mutations still predominate in the non-coding regions of CRC (Supplementary Table S2). The mutation rates of E1, R1, and AF1 in the non-coding regions remain high.
TABLE 2
| Samples | Exonic | synonymous_SNV | nonsynonymous_SNV | Stopgain | Intronic | Total | Intergenic |
|---|---|---|---|---|---|---|---|
| A1 | 227 | 68 | 152 | 7 | 6252 | 21,306 | 12,920 |
| G1 | 249 | 72 | 158 | 15 | 6019 | 20,090 | 11,927 |
| B1 | 414 | 132 | 258 | 22 | 7832 | 24,640 | 14,052 |
| D1 | 533 | 247 | 262 | 23 | 8719 | 27,061 | 15,300 |
| F1 | 619 | 179 | 409 | 25 | 12,160 | 35,752 | 19,487 |
| I1 | 545 | 173 | 336 | 31 | 11,315 | 36,516 | 21,284 |
| K1 | 386 | 106 | 261 | 14 | 9870 | 33,730 | 20,316 |
| L1 | 433 | 120 | 288 | 23 | 9793 | 37,074 | 18,094 |
| E1 | 1947 | 558 | 1,318 | 61 | 41,822 | 113,951 | 59,500 |
| M1 | 376 | 105 | 255 | 12 | 8755 | 29,232 | 17,438 |
| N1 | 228 | 72 | 139 | 14 | 5785 | 19,622 | 11,757 |
| O1 | 535 | 137 | 382 | 12 | 5162 | 16,082 | 8691 |
| P1 | 279 | 80 | 186 | 10 | 6911 | 22,208 | 12,907 |
| Q1 | 248 | 69 | 159 | 18 | 6352 | 22,205 | 13,498 |
| R1 | 7,144 | 3507 | 3,521 | 54 | 376,249 | 1,072,787 | 591,740 |
| S1 | 406 | 133 | 270 | 20 | 10,539 | 35,962 | 21,713 |
| V1 | 290 | 76 | 197 | 15 | 6,581 | 20,391 | 11,633 |
| X1 | 264 | 98 | 160 | 3 | 6,760 | 21,771 | 12,673 |
| Y1 | 380 | 114 | 248 | 17 | 10,885 | 33,840 | 19,551 |
| Z1 | 452 | 119 | 300 | 13 | 12,378 | 39,770 | 23,283 |
| AA1 | 438 | 109 | 298 | 19 | 9,534 | 31,315 | 18,500 |
| AB1 | 309 | 139 | 187 | 7 | 8,615 | 30,038 | 18,289 |
| AC1 | 473 | 111 | 318 | 13 | 12,009 | 38,136 | 22,047 |
| AD1 | 325 | 104 | 196 | 14 | 7,742 | 25,855 | 15,368 |
| AE1 | 347 | 142 | 219 | 20 | 9,293 | 30,350 | 17,967 |
| AF1 | 1,467 | 362 | 1,060 | 27 | 16,982 | 53,818 | 30,044 |
Single nucleotide mutation statistics in the coding region of somatic cells.
Exonic: The number of mutations that occur in the exon coding region; synonymous_SNV: number of synonymous mutations; nonsynonymous_SNV, Number of non-synonymous mutations; stopgain:The number of nonsense mutations that result in the production of a new stop codon; intronic: The number of mutations that occur in a gene’s intron; intergenic: The number of mutations occurring in the intergenic region; total: Total number of single nucleotide mutations (SNV).
3.2.2 Somatic insertion and deletion mutations
Based on somatic mutations, we continued to use GATK-Mutect2 to detect insertion and deletion (Indel) mutations. Insertion and deletion mutations in CRC occur in coding regions at the same site as single nucleotide mutations, mainly in intergenic regions and to a lesser extent in intronic regions (Tables 2, 3). Insertions and deletions that occur in the coding region or splice site of the genome are more likely to be dramatically alter the translation of the protein. This is called a frameshift mutation, and the length of the base pairs of the insertion (frameshift_insertion) and deletion (frameshift_deletion) is usually a non-integral multiple of 3, which can lead to a change in the entire reading frame, which in turn affects protein synthesis. Compared to non-frameshift mutations, frameshift mutations have a greater impact on gene function. As can be seen in Table 3, the number of mutations that have occurred in the E1 and R1 samples is the most obvious, with the E1 having more insertion mutations, about 0.0147% of the total, and the other having more deletion mutations, about 0.036% of the total. This implies that the proteins in these three cancer tissue samples have undergone fundamental changes. Insertion and deletion mutations in non-coding regions There were 1164 exon mutations, 28,980 intron mutations, and 9 mutations at cleavage sites, which was the same as single nucleotide mutations, with intron mutations being the main type (Supplementary Table S2; Supplementary Table S3). Among the few cleavage site mutations, E1 and R1 account for 33.33% each. As mentioned above, cleavage site mutations can change the reading frame of protein translation, which means that gene mutations in E1 and R1, whether in the coding or non-coding region, can profoundly affect the expression of tissue proteins (Supplementary Table S3).
TABLE 3
| Samples | Exonic | frameshift_deletion | frameshift_insertion | Intronic | Intergenic | Total |
|---|---|---|---|---|---|---|
| A1 | 18 | 13 | 1 | 2,772 | 3,371 | 6,783 |
| G1 | 13 | 2 | 2 | 2,117 | 2,660 | 5,260 |
| B1 | 15 | 8 | 4 | 1,892 | 2,345 | 4,692 |
| D1 | 17 | 9 | 3 | 2,374 | 3,005 | 5,916 |
| F1 | 9 | 6 | 0 | 3,048 | 3,703 | 7,453 |
| I1 | 23 | 21 | 0 | 3,213 | 4,210 | 8,183 |
| K1 | 9 | 7 | 2 | 2,350 | 3,076 | 5,972 |
| L1 | 16 | 6 | 3 | 2,676 | 3,756 | 7,048 |
| E1 | 366 | 25 | 73 | 73,444 | 80,699 | 169,616 |
| M1 | 27 | 18 | 3 | 3,089 | 4,134 | 7,962 |
| N1 | 13 | 9 | 2 | 3,054 | 3,619 | 7,315 |
| O1 | 21 | 18 | 1 | 1,540 | 1,813 | 3,775 |
| P1 | 9 | 8 | 0 | 3,274 | 3,922 | 7,875 |
| Q1 | 15 | 8 | 3 | 2,375 | 3,055 | 5,975 |
| R1 | 184 | 44 | 21 | 45,941 | 65,547 | 123,671 |
| S1 | 19 | 11 | 4 | 4,610 | 3,710 | 12,466 |
| V1 | 14 | 11 | 0 | 2,772 | 3,102 | 6,469 |
| X1 | 5 | 2 | 0 | 2,641 | 3,179 | 6,400 |
| Y1 | 21 | 14 | 2 | 3,515 | 4,436 | 8,771 |
| Z1 | 15 | 7 | 4 | 4,173 | 5,993 | 11,125 |
| AA1 | 21 | 14 | 3 | 2,827 | 3,556 | 7,033 |
| AB1 | 21 | 15 | 3 | 3,027 | 4,112 | 7,800 |
| AC1 | 26 | 18 | 2 | 3,692 | 4,818 | 9,361 |
| AD1 | 20 | 16 | 2 | 2,804 | 3,375 | 6,785 |
| AE1 | 13 | 8 | 2 | 3,167 | 3,922 | 7,768 |
| AF1 | 41 | 22 | 2 | 2,679 | 3,637 | 6,937 |
Statistical table of insertions and deletions of coding regions in somatic cells.
Exonic: The number of mutations that occur in the exon coding region; frameshift_deletion: The number of frameshift deletions, an integer multiple of the deletion length of 3, resulting in a change in the reading frame of the encoded protein; frameshift_insertion: The number of frameshift insertions, an integer multiple of the insertion length of 3, resulting in a change in the reading frame of the encoded protein; intronic: The number of mutations that occur in a gene’s intron; intergenic: The number of mutations occurring in the intergenic region; total: Total number of mutations.
3.3 Genomic landscape of samples adjacent to cancer
3.3.1 Single nucleotide mutation in germline
Germline mutations are mutations carried during embryonic development. They are highly heritable and make up the genetic diversity between people. All cells in the human body carry the same germline mutations. To obtain information about germline single nucleotide variants, the GATK software was used to detect germline mutations in the tissue adjacent to the cancer. In the coding region, we found 554,590 exonic mutations, 285,765 synonymous mutations, 260,333 non-synonymous mutations, 329,132,950 intronic mutations, 541,376,470 intergenic mutations, and a total of 961,379 52 (Table 4). Unlike somatic single nucleotide mutations in coding regions, germline single nucleotide mutations did not differ significantly between samples. However, the similarity is that single nucleotide mutations are still mainly distributed in the intergenic region, followed by the intronic region (Tables 2 and 4). In addition, as indicated in Supplementary Table S4, we detected 370,442 exon mutations, 5,956,492 intron mutations, and 1,925 cleavage site mutations in non-coding regions. Compared to the mutation situation in the non-coding region of somatic single nucleotide mutations, the mutation distribution is relatively balanced (Supplementary Table S2; Supplementary Table S4).
TABLE 4
| Samples | Exonic | synonymous_SNV | nonsynonymous_SNV | Intronic | Intergenic | Total |
|---|---|---|---|---|---|---|
| A2 | 21,330 | 10,965 | 10,062 | 1,236,460 | 1,995,044 | 3,571,762 |
| G2 | 20,760 | 10,795 | 9,714 | 1,204,640 | 1,954,451 | 3,489,991 |
| B2 | 21,492 | 10,999 | 10,128 | 1,279,819 | 2,092,707 | 3,724,867 |
| D2 | 21,420 | 10,962 | 10,086 | 1,270,916 | 2,102,319 | 3,733,156 |
| F2 | 21,249 | 10,972 | 9,929 | 1,268,598 | 2,092,974 | 3,712,288 |
| I2 | 21,418 | 10,998 | 10,072 | 1,264,252 | 2,091,372 | 3,706,014 |
| K2 | 21,218 | 10,928 | 9,956 | 1,270,104 | 2,102,216 | 3,724,556 |
| L2 | 21,436 | 10,991 | 10,114 | 1,247,137 | 2,084,863 | 3,712,818 |
| E2 | 21,036 | 10,875 | 9,861 | 1,268,017 | 2,080,251 | 3696616 |
| M2 | 21,042 | 11,073 | 10,013 | 1,270,706 | 2,116,131 | 3736293 |
| N2 | 21,348 | 10,944 | 10,015 | 1,277,324 | 2,113,961 | 3,744,350 |
| O2 | 21,283 | 10,961 | 10,058 | 1,269,724 | 2,111,857 | 3,734,106 |
| P2 | 21,368 | 11,002 | 9,844 | 1,265,521 | 2,087,451 | 3,703,209 |
| Q2 | 21,185 | 10,963 | 9,986 | 1,261,794 | 2,080,751 | 3,690,318 |
| R2 | 21,289 | 11,000 | 10,062 | 1,274,074 | 2,103,933 | 3,731,153 |
| S2 | 21,380 | 11,115 | 10,129 | 1,271,932 | 2,107,524 | 3,731,078 |
| V2 | 21,578 | 10,682 | 9,703 | 1,250,046 | 1,952,921 | 3,545,933 |
| X2 | 20,709 | 11,186 | 10,118 | 1,281,237 | 2,093,248 | 3,727,021 |
| Y2 | 21,640 | 11,047 | 9,991 | 1,276,007 | 2,089,311 | 3,715,939 |
| Z2 | 21,372 | 11,054 | 10,066 | 1,274,270 | 2,096,588 | 3,721,788 |
| AA2 | 21,450 | 11,164 | 10,071 | 1,268,904 | 2,094,797 | 3,714,931 |
| AB2 | 21,608 | 10,974 | 10,054 | 1,268,904 | 2,098,742 | 3,714,117 |
| AC2 | 21,392 | 10,989 | 10,050 | 1,267,919 | 2,092,248 | 3,707,441 |
| AD2 | 21,357 | 11,192 | 10,274 | 1,265,748 | 2,104,546 | 3,730,655 |
| AE2 | 21,696 | 10,960 | 10,029 | 1,274,676 | 2,104,325 | 3,716,033 |
| AF2 | 21,280 | 10,974 | 9,948 | 1,262,132 | 2,089,116 | 3,701,519 |
Statistics of single nucleotide mutations in coding regions of germline cells.
Exonic: The number of mutations that occur in the exon coding region; synonymous_SNV: number of synonymous mutations; nonsynonymous_SNV, Number of non-synonymous mutations; intronic: The number of mutations that occur in a gene’s intron; intergenic: The number of mutations occurring in the intergenic region; total: Total number of single nucleotide mutations (SNV).
3.3.2 Germline mutations insertions and deletions
Immediately above, while using the GATK software to detect germ line mutations in normal tissue adjacent to cancer, we also obtained data on germ line insertion and deletion mutations. A total of 14,588 coding region exon mutations, 2,468 synonymous mutations, 1,629 non-synonymous mutations, 99,223,250 coding region intron mutations, 131,253,980 intergenic mutations, 57,200 non-coding region exon mutations, 15,803,140 non-coding region intron mutations, 425 non-coding region breakpoints, and 25,373,089 total mutations (Table 5; Supplementary Table S5). Comparing the single nucleotide mutations and insertions and deletions in germ line cells (Table 4; Table 5; Supplementary Table S4; Supplementary Table S5) with the somatic mutations (Table 2; Table 3; Supplementary Table S2; Supplementary Table S3), it was found that the number of germ line mutations was always higher than that of somatic mutations, and the mutation changes were mainly concentrated in non-coding regions, with individual samples showing a change of nearly 100-fold. In addition, there was no variation in germ line mutations between samples as there was in somatic cells. This implies that during the transformation of normal cells adjacent to cancer cells into cancer cells, there are significant changes in the genome in both coding and non-coding regions, with particularly drastic changes occurring in non-coding regions.
TABLE 5
| Samples | Exonic | Frameshiftdeletion | Frameshiftinsertion | Intronic | Intergenic | Total |
|---|---|---|---|---|---|---|
| A2 | 565 | 99 | 59 | 355,446 | 460,273 | 898,904 |
| G2 | 523 | 106 | 57 | 356,572 | 458,147 | 896,558 |
| B2 | 572 | 89 | 65 | 399,575 | 528,756 | 1021744 |
| D2 | 561 | 94 | 60 | 400,081 | 532,223 | 1026546 |
| F2 | 577 | 96 | 66 | 394,956 | 525,037 | 1012445 |
| I2 | 527 | 92 | 68 | 384,517 | 511,058 | 985,970 |
| K2 | 535 | 91 | 56 | 386,048 | 515,689 | 992,875 |
| L2 | 544 | 93 | 64 | 388,004 | 513,220 | 992,320 |
| E2 | 571 | 98 | 60 | 371,785 | 493,067 | 952,055 |
| M2 | 587 | 100 | 74 | 385,958 | 510,992 | 987,349 |
| N2 | 581 | 106 | 61 | 378,004 | 504,409 | 971,206 |
| O2 | 572 | 100 | 64 | 392,786 | 521,801 | 100,6409 |
| P2 | 523 | 78 | 50 | 368,616 | 492,902 | 948,192 |
| Q2 | 563 | 101 | 60 | 375,047 | 496,754 | 959,325 |
| R2 | 561 | 86 | 63 | 383,477 | 507,169 | 980,824 |
| S2 | 582 | 97 | 71 | 379,755 | 506,167 | 975,154 |
| V2 | 512 | 82 | 56 | 373,290 | 480,130 | 941,224 |
| X2 | 541 | 78 | 64 | 383,130 | 504,031 | 976,614 |
| Y2 | 561 | 86 | 61 | 398,658 | 524,861 | 1016640 |
| Z2 | 564 | 93 | 59 | 385,988 | 511,170 | 987,518 |
| AA2 | 578 | 92 | 67 | 381,971 | 504,687 | 976,361 |
| AB2 | 563 | 102 | 65 | 373,469 | 497,559 | 958,528 |
| AC2 | 566 | 103 | 65 | 380,856 | 505,078 | 975,331 |
| AD2 | 591 | 105 | 65 | 380,984 | 505,687 | 975,705 |
| AE2 | 580 | 103 | 63 | 381,219 | 509,810 | 980,485 |
| AF2 | 588 | 98 | 66 | 382,133 | 504,721 | 976,807 |
Insertion and deletion statistics in coding regions of germline cells.
Exonic: The number of mutations that occur in the exon coding region; frameshift_deletion: The number of frameshift deletions, an integer multiple of the deletion length of 3, resulting in a change in the reading frame of the encoded protein; frameshift_insertion: The number of frameshift insertions, an integer multiple of the insertion length of 3, resulting in a change in the reading frame of the encoded protein; intronic: The number of mutations that occur in a gene’s intron; intergenic: The number of mutations occurring in the intergenic region; total: Total number of mutations.
3.4 Mutation spectrum and mutation signature
Multidimensional analysis of somatic single nucleotide mutations (point mutations), including mutation spectrum and mutation signature. From these results, we can clearly understand the characteristics of cancer mutations at the point mutation level, i.e., at the base level.
3.4.1 Mutation spectrum analysis
There are six types of variation in single base substitutions: C>A/G>T, C>G/G>C, C>T/G>A, T>A/A>T, T>C/A>G, and T>G/A>C (for simplicity, we will use C>A, C>G, C>T, T>A, T>C, and T>G, respectively). And can be divided into two categories according to the type of base that is replaced: a transversion occurs when a purine is replaced by a pyrimidine; a transition occurs when a purine is replaced by a purine or a pyrimidine is replaced by a pyrimidine. In each sample, the C>T mutation type is predominant, mainly base transitions between genomes, followed by T>C, C>A, T>A, T>G, and C>G in decreasing order (Figure 1A). In addition, the probability of base substitution in tumor samples is relatively low (Figure 1A). The mutation spectrum heat map also shows that the C>T mutation type accounts for a high proportion of each sample, especially B1, D1, E1, F1, and I1 (Figure 1B).
FIGURE 1

A bar chart and heat map of the mutation spectrum of somatic single nucleotide mutations. (A) A bar chart of the mutation spectrum, where the abscissa represents different samples and the ordinate represents the proportion of mutation types, and different colors represent different mutation types. (B) A heat map of the mutation spectrum, where the abscissa represents different samples and the ordinate represents the mutation type, and the redder the color, the higher the proportion of the corresponding mutation type in the sample, and the bluer the color, the lower the proportion.
3.4.2 Mutation signature analysis
In the process of DNA replication, mismatches, induction by endogenous or exogenous mutagens, and defects in DNA repair mechanisms inevitably lead to somatic mutations; different mutation processes result in specific combinations of mutation types, referred to as mutation characteristics. By considering the base types at 1 bp upstream and 1 bp downstream of a single point mutation site, we have classified point mutations into 96 mutation types characterized by two combinations of bases, e.g., A-A, A-G, A-C, A-T, C-A, C-G, C-C, C-T, and so on. Tumor point mutation types were still found to be predominantly C>T, but specific mutation types were considered to be predominantly C-G, C-T, G-A, G-C, and G-G (Figure 2). Based on the mutation distribution of the 96 mutation types in each sample (Figure 2), the mutation characteristics of all samples were categorized into signature A and B. As shown in Figure 3A, the biggest difference between signature A and B is whether the difference between the specific 96 point mutation types of C>T and T>A is obvious. In signature A, the mutation types are dominated by G-A, G-G, G-C, and G-T. In signature B, the mutation types shift to be most significant in A-G, and C-G. In the mutation feature contribution graph, we can see that most samples are dominated by signature A mutation features, i.e., dominated by G-A, G-G, G-C, and G-T, and only individual samples such as R1 and AF1 are dominated by signature B mutation features (Figure 3B). At this point, we derived information about the mutation spectrum and mutation features of the complete tumor samples.
FIGURE 2

Shows a histogram of the frequencies of the 96 mutation types found in each sample. The horizontal axis represents the 96 mutation types, and the vertical axis represents the frequency of each mutation type in a sample. The higher the frequency, the more common the mutation type is in the sample. Different colors represent different mutation types.
FIGURE 3

Histogram of mutation feature frequencies and contributions. (A) Shows the histogram of mutation feature frequencies. The horizontal coordinates represent the 96 mutation types, and the vertical coordinates represent the frequencies of the different mutation feature types. The higher the frequency, the higher the mutation frequency in the sample. (B) A plot showing the proportion of each mutation feature in different samples. The horizontal axis represents the samples, and the vertical axis represents the proportion of each mutation feature. The larger the proportion, the more prevalent the mutation feature is in the sample. Different colors represent different mutation features.
3.5 High-frequency copy number mutation analysis
Copy number variation (CNV) is an important part of genomic structural variation (SV), which can be categorized into two types: deletions and duplications. In the distribution map of copy number mutations in tumor samples, most of the samples showed copy number gains on chromosomes 7, 13, and 20, and mainly copy number losses on chromosomes 4, 6, 17, and 18 (Figure 4A). Meanwhile, in the high-frequency copy number mutation distribution map, we used the GISTIC software to score the high-frequency copy number mutation region; the higher the score, the higher the frequency of copy number mutation in this region, and we found that the copy number increase was mainly shown on chromosomes 1, 2, 3, 6, 7, 13, and 20, and the copy number decrease was mainly shown on chromosomes 4, 6, 17, 18, and 21 (Figure 4B). This indicates that the genomes of tumor samples show different alterations of gene fragments on different chromosomes, which is more favorable evidence that tumors are caused by a series of mutations or aberrations accumulated at the level of somatic genome, and that genomic alterations are crucial in the process of tumorigenesis and development.
FIGURE 4

Somatic high-frequency copy number mutation analysis includes the distribution of copy number mutations in tumor samples and the distribution of high-frequency copy number mutations. (A) The distribution of copy number mutations in tumor samples is shown in the figure. The abscissa is chromosomes 1–22, and the ordinate is different samples. The red and blue parts of the figure are somatic copy number mutations in individuals, where red represents an increase in copy number and blue represents a decrease in copy number. The darker the color, the greater the copy number change. (B) A distribution map of high-frequency copy number mutations, with chromosomes 1–22 on the horizontal axis (sex chromosomes not considered) and the GISTIC software score for high-frequency copy number mutation segments on the vertical axis. A higher score indicates that the copy number mutation is more common in that segment. Red indicates copy number gain and blue indicates copy number loss.
3.6 Significantly mutated gene analysis
Significantly mutated genes (SMGs) include somatic single nucleotide mutations and insertion/deletion mutations. They are genes with a mutation frequency significantly higher than the background mutation rate (BMR). We used Fisher’s exact test to screen for SMGs. The genes with more mutations are NUDT4B, HRNR, OBSCN, ATAD3B, and NBPF20. In combination with Fisher’s test, a P value of <0.05 is examined statistically significant. Therefore, we finally selected the ATAD3B gene (Table 6). As a gene with a high mutation frequency in tumor samples, it can serve as a target for gene therapy of CRC for further research and verification.
TABLE 6
| Gene | Muts | Total_Muts | Sample_affected | Sample_percent (%) | Pvalue |
|---|---|---|---|---|---|
| ATAD3B | 2 | 4,038 | 2 | 7.69% | 0.02098 |
| CCDC27 | 1 | 4,038 | 1 | 3.85% | 0.19955 |
| AJAP1 | 1 | 4,038 | 1 | 3.85% | 0.13003 |
| STPG1 | 1 | 4,038 | 1 | 3.85% | 0.13626 |
| INPP5B | 1 | 4,038 | 1 | 3.85% | 0.30121 |
| CYP4X1 | 1 | 4,038 | 1 | 3.85% | 0.15893 |
| LRRC8C | 1 | 4,038 | 1 | 3.85% | 0.24077 |
| EXTL2 | 1 | 4,038 | 1 | 3.85% | 0.10838 |
| NBPF20 | 2 | 4,038 | 2 | 7.69% | 0.57100 |
| PPIAL4H | 1 | 4,038 | 1 | 3.85% | 0.05415 |
| NUDT4B | 5 | 4,038 | 5 | 19.23% | 0.32450 |
| HRNR | 3 | 4,038 | 3 | 11.54% | 0.07315 |
| THBS3 | 2 | 4,038 | 1 | 3.85% | 0.04261 |
| FCRL5 | 1 | 4,038 | 1 | 3.85% | 0.29308 |
| ASTN1 | 1 | 4,038 | 1 | 3.85% | 0.35835 |
| KIF21B | 1 | 4,038 | 1 | 3.85% | 0.43000 |
| ADIPOR1 | 1 | 4,038 | 1 | 3.85% | 0.11962 |
| PIK3C2B | 1 | 4,038 | 1 | 3.85% | 0.45588 |
| OBSCN | 4 | 4,038 | 4 | 15.38% | 0.40588 |
High frequency mutation gene.
Muts: The number of mutations in the gene; Total_Muts: The total number of mutation sites in the region was effectively analyzed; Sample_affected: The number of samples with mutations on the gene; Sample_percent: The proportion of the samples with mutations in this gene to the total sample number; Pvalue: The P-value calculated by Fisher’s Exact Test method.
3.7 Susceptibility gene screening
Cancer-predisposing genes (CPGs) are genes that may encode genetic diseases or acquired susceptibility to disease under environmental stimuli. Mutations that occur in an individual’s germ cells do not necessarily lead directly to cancer, but they can significantly increase an individual’s risk of developing cancer. We screened primarily for germ line mutations derived from sequencing 26 cases of normal tissue adjacent to cancer to screen for possible cancer predisposition genes. We screened for six candidate cancer susceptibility genes, where hom_ref indicates no mutation, het indicates a heterozygous mutation, and hom_alt indicates a homozygous mutation. The probability of these six genes to be mutated in normal tissue adjacent to cancer is CPA6 (3.85%), ZNF888 (46.15%), SH3BP1 (76.92%), ANKRD16 (30.77%), ATN1 (11.54%), and C4orf54 (80.77%). Take into account this, we roughly concluded that the more ideal cancer susceptibility genes are SH3BP1 and C4orf54 (Table 7). Since the probability of mutations in these two genes in normal tissues adjacent to cancer is relatively high, these two genes may be potential genetic targets for colorectal cancer and can be further verified.
TABLE 7
| Samples/genes | CPA6 | ZNF888 | SH3BP1 | ANKRD16 | ATN1 | C4orf54 |
|---|---|---|---|---|---|---|
| A2 | het | het | hom_ref | hom_ref | het | hom_ref |
| G2 | hom_ref | hom_ref | het | het | hom_ref | het |
| B2 | hom_ref | het | het | hom_ref | hom_ref | het |
| D2 | hom_ref | hom_ref | hom_ref | hom_ref | hom_ref | het |
| F2 | hom_ref | hom_ref | het | hom_ref | hom_ref | het |
| I2 | hom_ref | het | hom_ref | hom_ref | hom_ref | het |
| K2 | hom_ref | het | hom_ref | het | hom_ref | het |
| L2 | hom_ref | het | het | hom_ref | hom_ref | het |
| E2 | hom_ref | hom_ref | hom_alt | hom_ref | hom_ref | hom_alt |
| M2 | hom_ref | hom_ref | het | hom_ref | hom_ref | hom_alt |
| N2 | hom_ref | het | het | het | hom_ref | hom_alt |
| O2 | hom_ref | het | hom_alt | hom_alt | hom_ref | het |
| P2 | hom_ref | hom_ref | het | hom_ref | hom_ref | hom_alt |
| Q2 | hom_ref | hom_ref | het | hom_ref | hom_ref | hom_ref |
| R2 | hom_ref | hom_ref | het | hom_ref | hom_ref | het |
| S2 | hom_ref | hom_ref | hom_alt | hom_alt | hom_ref | het |
| V2 | hom_ref | het | hom_ref | hom_ref | hom_ref | het |
| X2 | hom_ref | het | het | hom_ref | het | het |
| Y2 | hom_ref | hom_alt | het | hom_ref | hom_ref | hom_ref |
| Z2 | hom_ref | hom_ref | het | het | hom_ref | hom_ref |
| AA2 | hom_ref | het | het | het | hom_ref | het |
| AB2 | hom_ref | hom_ref | hom_alt | hom_ref | hom_ref | het |
| AC2 | hom_ref | hom_ref | hom_ref | hom_ref | hom_alt | hom_ref |
| AD2 | hom_ref | hom_ref | hom_alt | hom_ref | hom_ref | het |
| AE2 | hom_ref | hom_ref | hom_alt | hom_ref | hom_ref | hom_alt |
| AF2 | hom_ref | hom_alt | hom_alt | het | hom_ref | het |
Susceptibility gene screening.
hom_ref means no mutation, het means heterozygous mutation, and hom_alt means pure and mutation.
3.8 Expression of SH3BP1 in pan-cancer, COAD, and READ
A pan-cancer expression analysis revealed that SH3BP1 is highly expressed in ten cancer types: Cervical Squamous Cell Carcinoma and Intracervical Adenocarcinoma (CESC), Colon Adenocarcinoma (COAD), Renal Clear Cell Carcinoma (KIRC), Lung Squamous Cell Carcinoma (LUSC), Ovarian plasma cystadenocarcinoma (OV), pancreatic adenocarcinoma (PAAD), rectal adenocarcinoma (READ), gastric adenocarcinoma (STAD), testicular germ cell tumor (TGCT), and uterine sarcoma (UCS). Two other cancers, adrenocortical carcinoma (ACC) and prostate adenocarcinoma (PRAD), showed reduced expression. Two other cancers, adrenocortical carcinoma (ACC) and prostate adenocarcinoma (PRAD), showed decreased expression (Figure 5A). Comparing the expression of SH3BP1, CPA6, ZNF888, and NKRD16 in COAD and READ tumor and normal tissues revealed that SH3BP1 expression increased in COAD and READ and was more prevalent in tumor tissues than in the other susceptibility genes obtained by whole-genome sequencing (Figures 5B,C). These findings suggest that SH3BP1 is upregulated in various tumor tissues, including COAD and READ.
FIGURE 5
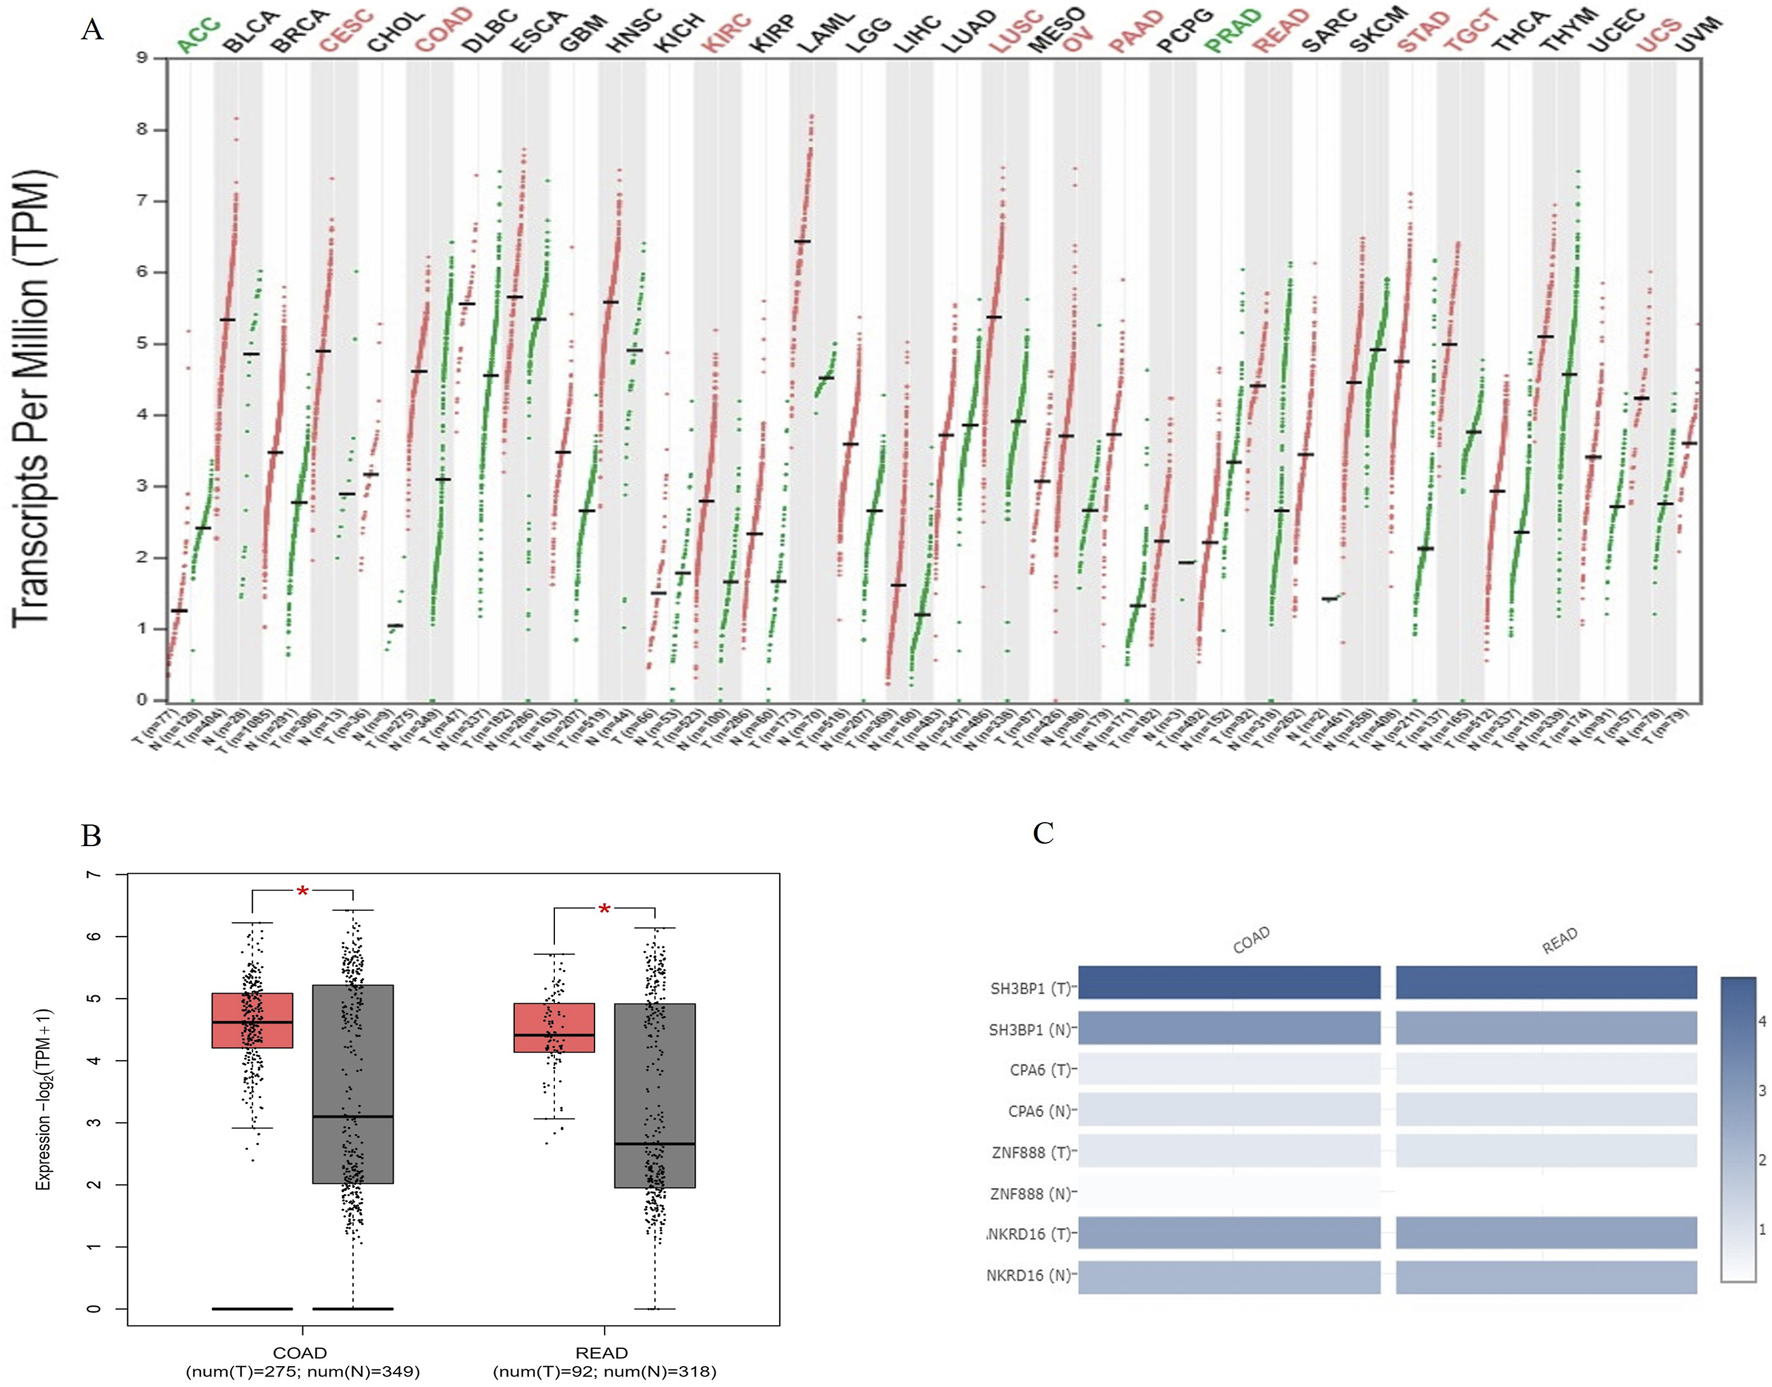
SH3BP1 expression in pan-cancer, colon adenocarcinoma, and rectal adenocarcinoma. (A) A comparison of SH3BP1 expression in 33 tumor (including COAD and READ) and normal tissues, based on data from the TCGA and GTEx databases. Red indicates tumor tissues and green indicates normal tissues. The cancer species name marked in red or green indicates that SH3BP1 is highly expressed in the corresponding tissue of that cancer species with P < 0.05. (B) Box plots showing differences in SH3BP1 expression between COAD and READ tumor and normal tissues based on TCGA and GTEx databases. (C) A multi-gene comparison of SH3BP1, CPA6, ZNF888, and NKRD16 expression levels in COAD and READ tumor and normal tissues based on whole-genome sequencing results and TCGA and GTEx databases.
3.9 Differential expression of the SH3BP1 gene between tumor and normal tissues and verification of its associated function
Built on the genetic information obtained from susceptibility screening, we selected SH3BP1 as the target gene for experimental verification. To investigate whether SH3BP1 is differentially expressed in cancer and adjacent normal tissues, we performed protein blotting (WB) and immunohistochemistry (IHC) experiments. Our immunohistochemical analysis of pathological tissues from two patient groups revealed that SH3BP1 expression was consistently higher in cancer tissues than in normal tissues (Figures 6A,C). Conversely, SH3BP1 expression was negligible in normal human intestinal epithelial cells (NCM460) but significantly increased in RKO and HCT116 colorectal cancer cells (Figure 6B). These results imply that SH3BP1 is differentially expressed in tumors and normal tissues adjacent to cancer. To further explore SH3BP1’s potential role in tumors, we downregulated the SH3BP1 gene in HCT116 and RKO colorectal cancer cells by transfecting them with si-NC and si-SH3BP1, respectively. As shown in Figure 7A, the proliferative capacity of the colorectal cancer cells (HCT116 and RKO) was significantly reduced in the SH3BP1 knockdown group (si-SH3BP1-1, si-SH3BP1-2) compared to the si-NC group, as demonstrated by a cell viability assay (CCK8). Additionally, the migratory effect of SH3BP1 on colorectal cancer cells was evaluated using a scratch wound healing assay. This assay showed that the migratory ability of colorectal cancer cells in the si-SH3BP1 group decreased, while the migratory ability of colorectal cancer cells in the si-NC group did not differ significantly from that of the CON group (Figures 7B,C). Thus, SH3BP1 may promote tumor proliferation and migration in colorectal cancer and has the potential to be a new gene therapy target.
FIGURE 6

SH3BP1 Expression Differs Between Cancerous and Normal Para-Cancerous Tissues. (A,C) Immunohistochemical staining of colorectal cancer patient tumors and para-cancerous specimens shows a clear difference in SH3BP1 expression between the two. (B) Western blot analysis shows that SH3BP1 is expressed at higher levels in colorectal cancer cells RKO and HCT116 than in normal intestinal epithelial cells NCM460.
FIGURE 7

SH3BP1 cell viability and scratch assays. (A) Cell proliferation ability was assessed using a cell viability assay (CCK8). SH3BP1 knockdown cells proliferated at a slower rate than the si-NC group. (B,C) The scratch wound healing assay was used to determine the lateral migration ability of cells. This assay used si-NC and si-SH3BP1-transfected HCT116 and RKO cells, as well as untreated HCT116 and RKO cells from the CON group. There was a more significant difference in the migration rate of SH3BP1 knockdown cells compared to the CON and si-NC groups.
4 Discussion
Colorectal cancer is currently one of the tumors with high morbidity and mortality. Although colorectal cancer mortality can be reduced through screening, and surgical removal of the tumor can reduce the incidence of the disease (Gupta, 2022), the prevalence of early-onset colorectal cancer, which tends to develop in young people, will increase every year over the next decade. Approximately 30% of patients with early-onset CRC carry mutations that result in hereditary cancer susceptibility syndromes, and another 20% of patients have familial CRC (Mauri et al., 2019). Therefore, it is particularly important to discover and identify CRC genomes and susceptibility genes. To explore the genome of colorectal cancer, this study applied whole genome sequencing to the genome of colorectal cancer. Whole genome sequencing is widely used in human (Glanzmann et al., 2021), plasma (Wan et al., 2022), viruses (Thabet et al., 2023), microorganisms (Purushothaman et al., 2022), and so on. Whole genome sequencing can also detect the whole genome of tumors, such as gallbladder cancer (Okawa et al., 2023), prostate cancer (Liang et al., 2020), etc. Whole genome sequencing can also be used to sequence colorectal cancer, which can identify oncogenic mutated genes and signaling pathways, including oncogenes such as APC, tumor protein P53 (Tp53), and KRAS proto-oncogenes, and oncogenic pathways such as Wnt, P53, and phosphoinositide 3-kinase (Teng et al., 2018). This is the theoretical basis for its use in mapping the colorectal cancer genome.
This study included a total of 52 samples from colorectal cancer patients, of which 26 were colorectal cancer tissue samples and the other 26 were normal tissues adjacent to the cancer. These samples were subjected to whole genome sequencing (WGS) to comprehensively analyze the genome. Somatic and germline single nucleotide mutations, insertions, and deletions were detected, and it was determined that there is a significant difference in genomic bases between normal adjacent tissue and cancer tissue. This revealed the base mutations that may occur during the transformation of adjacent tissue into cancerous tissue, laying the foundation for further understanding in the future. On this basis, the mutation spectrum and mutation characteristics of tumor samples and high-frequency copy number mutation analysis were further obtained, and the tumor genome was further mined. As a result, we constructed the genomic landscape of colorectal cancer from base sequences to gene fragments through whole genome sequencing. Previous whole genome sequencing of colorectal cancer mostly focused on one of the colorectal cancer genomes, or did not have experimental verification, or only described the genome map of colorectal cancer or normal tissues. For example, Brannon et al. (2014) investigated the genomic differences between primary and metastatic colorectal cancer, while Schubert et al. (2020) focused on the significance of MSH6 and MUTYH genes in familial colorectal cancer, and Lee-Six et al. (2019) detailed the mutations in the epithelial cells of normal colorectal cancer. In contrast, this study not only provides a more comprehensive account of the major contents of the colorectal cancer genome but also shows the genome of the normal tissue adjacent to the cancer, thus clarifying the changes in the genome during the development of the cancer adjacent to the tumor. High-frequency mutated genes and disease susceptibility genes were identified in colorectal cancer tumors and adjacent normal tissues. Based on the susceptibility-to-disease genes, related genes were identified and experimentally verified, providing a theoretical and practical basis for the search of potential therapeutic targets for colorectal cancer.
We used whole genome sequencing to capture information on gene targets that have mutations in the genomes of colorectal cancer and adjacent cancers and analyzed and screened high-frequency mutated genes (ATAD3B) and susceptibility genes (SH3BP1, C4orf54). Whole genome sequencing revealed that ATAD3B has a mutation frequency of 7.69% in tumor samples (Table 5). Previous studies have found that when the expression of the tumor suppressor gene circ_ATAD3B is increased, it promotes the expression of miR-570-3p and inhibits the expression of MX2, thereby inhibiting the proliferation of breast cancer (Song et al., 2023). In addition, the higher the expression level of ATAD3B in hepatocellular carcinoma compared with normal liver tissue, the lower the survival rate of patients (Liu et al., 2019). This indicates that the gene has different expression levels in cancerous and normal tissues, which is consistent with our research results. It is also worth noting that the role of this gene may be different in different cancers, and there are currently no reports of ATAD3B gene research in colorectal cancer, so this gene can be used as a target gene for further research. The gene involved in this study, SH3BP1, has been found to be closely associated with various cancers in previous research reports. For example, in melanoma, overexpression of SH3BP1 promotes the expression of Rac1 and Wave2, which promotes melanoma proliferation, invasion, and migration through the SH3BP1/Rac1/Wave2 pathway (Sun et al., 2023). In leukemia, the Cobbl1/SH3BP1/PACSIN2 axis promotes drug resistance and progression of chronic myeloid leukemia by regulating Rac1 activity, while the expression level of SH3BP1 is inversely correlated with the prognosis of acute myeloid leukemia (Park et al., 2022; Yang et al., 2024). Notably, the function of SH3BP1 in colorectal cancer remains unknown. Based on previous studies, we hypothesized that SH3BP1 plays a tumor-promoting role in colorectal cancer. Consistent with our hypothesis, we first used pan-cancer species expression analysis and gene expression difference analysis in this study to verify differences in SH3BP1 expression between tumor and normal tissues in various cancers, including COAD and READ. We then demonstrated differences in SH3BP1 expression between colorectal cancer and normal tissues using protein blotting and immunohistochemistry experiments. Cell scratch and CCK8 experiments revealed that SH3BP1 knockdown slows tumor proliferation and migration, suggesting that SH3BP1 promotes proliferation and migration in colorectal cancer. As for C4orf54, it has only been found to be downregulated in recurrent inflammatory breast cancer (Qin et al., 2024) and may be associated with obstructive portal vein disease (Besmond et al., 2018). There is a relative lack of research on the rest of the gene, and it remains to be explored further. In conclusion, by performing whole genome sequencing of colorectal tumors and adjacent normal tissues, we have constructed a relatively complete genomic map, discovered genomic alterations from adjacent normal tissues to tumors, and screened potential targets for gene therapy. Our results provide a deeper and more reliable basis for genetic research and precision treatment of colorectal cancer.
There are also shortcomings in this article. First, the experimental verification is too simple, and there is still room for improvement. Wang (Wang et al., 2018) and others found that SH3BP1 promotes the proliferation, migration, and chemoresistance of cervical cancer by affecting its downstream signaling pathway Rac-Wave2. In addition, Tao (Tao et al., 2016) and others also found that SH3BP1/Rac/Wave2 can promote the production of vascular endothelial growth factor (VEGF) in hepatoma cells and induce the metastasis of liver cancer cells; Cicchetti (Cicchetti et al., 1995) and others also found that SH3BP1 resists cell folding by acting on the downstream target Rac. Therefore, the experiment can further improve the validation of SH3BP1/Rac/Wave2 pathway, whether it can also play the role of promoting proliferation, migration, metastasis, and chemotherapy resistance in colorectal cancer. Secondly, the validation of the functional mechanism is relatively immature. Xu et al. (2024) firstly found that tsRNA-GlyGCC was highly expressed in colorectal cancer by using biosignature analysis, which in combination with experimental validation indicated that tsRNA-GlyGCC could promote tumor progression and drug resistance; and Chen et al. (2024) also found that vitamin D receptor (VDR) expression was downregulated in colitis-associated colon carcinoma (CAC) tissues by using biosignature analysis. Another study by Chen et al. also used biosignature analysis to show that the expression of vitamin D receptor (VDR) was downregulated in colitis-associated colon cancer (CAC) tissues, and then it was verified that inhibition of VDR could delay the progression of CAC through ex vivo experiments. Thus, the functional mechanism study can be actively combined with the bioconfidence analysis to complete the chain of evidence, which can further support the experimental conclusions. Furthermore, the whole genome sequencing data of colorectal cancer is too single. Mendelaar et al. (2021) used whole genome sequencing to analyze the prognostic effect of metastatic colorectal cancer; Mendis et al. (2020) studied the combination of whole genome sequencing and circulating tumor DNA to detect the heterogeneity of colorectal cancer. Therefore, whole genome sequencing can continue to be used in the future to evaluate the prognosis or clinical treatment effect of colorectal cancer, which will help to improve the diagnosis and treatment of colorectal cancer in the clinic.
5 Conclusion
This study revealed significant differences in single nucleotide and insertion/deletion mutations between somatic and germ line cells, indicating substantial changes in paraneoplastic normal tissue genomes during cancerous transformation, particularly in non-coding regions. At the same time, analysis of copy number variations showed that samples exhibited different gene fragment alterations at different chromosomal loci. This favors the idea that genomic alterations play an essential role in tumorigenesis and development. These findings serve as the basis for analyzing tumor gene targets using whole genome sequencing. Additionally, the study found that the samples were dominated primarily by C>T mutation types, followed by T>C. C>A, T>A, T>G, and C>G occurred in decreasing proportions. When the mutation types were categorized more carefully into 96 types, the specific mutation types were dominated by C-G, C-T, G-A, G-C, and G-G. According to the distribution of these 96 types of mutations in each sample, the mutation characteristics of all samples were classified as either feature A or signature B. signature A was characterized by predominantly G-A, G-G, G-C, and G-T mutations, while signature B was characterized by predominantly A-G and C-G mutations. Most samples were predominantly signature A. In this paper, we found that SH3BP1 gene expression increased in various cancers through pan-cancer analysis. In COAD and READ cancers, SH3BP1 expression was higher in tumor tissues than in normal tissues. A cell proliferation and migration assay verified that SH3BP1 has a role in promoting colorectal cancer. Further research is required to understand its role and mechanism in colorectal cancer.
Statements
Data availability statement
The data presented in the study are deposited in the NCBI SRA repository, accession number PRJNA1279985.
Ethics statement
The studies involving humans were approved by Research Ethics Committee, Wuxi People’s Hospital Affiliated to Nanjing Medical University. The studies were conducted in accordance with the local legislation and institutional requirements. The participants provided their written informed consent to participate in this study. Written informed consent was obtained from the individual(s) for the publication of any potentially identifiable images or data included in this article.
Author contributions
YS: Writing – original draft, Conceptualization, Methodology, Resources, Software, Visualization. SN: Data curation, Formal Analysis, Writing – original draft. DL: Data curation, Formal Analysis, Writing – original draft. CM: Writing – review and editing, Validation. TW: Writing – review and editing, Funding acquisition, Validation.
Funding
The author(s) declare that financial support was received for the research and/or publication of this article. This study was supported by a grant from the 2021 Taihu Talent Program Top Medical Experts Team (2021THRC-TD-PWK-2024).
Conflict of interest
The authors declare that the research was conducted in the absence of any commercial or financial relationships that could be construed as a potential conflict of interest.
Generative AI statement
The author(s) declare that no Generative AI was used in the creation of this manuscript.
Publisher’s note
All claims expressed in this article are solely those of the authors and do not necessarily represent those of their affiliated organizations, or those of the publisher, the editors and the reviewers. Any product that may be evaluated in this article, or claim that may be made by its manufacturer, is not guaranteed or endorsed by the publisher.
Supplementary material
The Supplementary Material for this article can be found online at: https://www.frontiersin.org/articles/10.3389/fmolb.2025.1605117/full#supplementary-material
References
1
Abedizadeh R. Majidi F. Khorasani H. R. Abedi H. Sabour D. (2024). Colorectal cancer: a comprehensive review of carcinogenesis, diagnosis, and novel strategies for classified treatments. Cancer Metastasis Rev.43, 729–753. 10.1007/s10555-023-10158-3
2
Akimoto N. Ugai T. Zhong R. Hamada T. Fujiyoshi K. Giannakis M. et al (2021). Rising incidence of early-onset colorectal cancer — a call to action. Nat. Rev. Clin. Oncol.18, 230–243. 10.1038/s41571-020-00445-1
3
Bagger F. O. Borgwardt L. Jespersen A. S. Hansen A. R. Bertelsen B. Kodama M. et al (2024). Whole genome sequencing in clinical practice. BMC Med. Genomics17, 39. 10.1186/s12920-024-01795-w
4
Besmond C. Valla D. Hubert L. Poirier K. Grosse B. Guettier C. et al (2018). Mutations in the novel gene FOPV are associated with familial autosomal dominant and non‐familial obliterative portal venopathy. Liver Int.38, 358–364. 10.1111/liv.13547
5
Brannon A. R. Vakiani E. Sylvester B. E. Scott S. N. McDermott G. Shah R. H. et al (2014). Comparative sequencing analysis reveals high genomic concordance between matched primary and metastatic colorectal cancer lesions. Genome Biol.15, 454. 10.1186/s13059-014-0454-7
6
Chen Y. Liang J. Chen S. Lin N. Xu S. Miao J. et al (2024). Discovery of vitexin as a novel VDR agonist that mitigates the transition from chronic intestinal inflammation to colorectal cancer. Mol. Cancer23, 196. 10.1186/s12943-024-02108-6
7
Cicchetti P. Ridley A. J. Zheng Y. Cerione R. A. Baltimore D. (1995). 3BP-1, an SH3 domain binding protein, has GAP activity for Rac and inhibits growth factor-induced membrane ruffling in fibroblasts. EMBO J.14, 3127–3135. 10.1002/j.1460-2075.1995.tb07315.x
8
Dunne P. D. Arends M. J. (2024). Molecular pathological classification of colorectal cancer—an update. Virchows Arch.484, 273–285. 10.1007/s00428-024-03746-3
9
Elbediwy A. Zihni C. Terry S. J. Clark P. Matter K. Balda M. S. (2012). Epithelial junction formation requires confinement of Cdc42 activity by a novel SH3BP1 complex. J. Cell Biol.198, 677–693. 10.1083/jcb.201202094
10
Glanzmann B. Jooste T. Ghoor S. Gordon R. Mia R. Mao J. et al (2021). Human whole genome sequencing in South Africa. Sci. Rep.11, 606. 10.1038/s41598-020-79794-x
11
Golas M. M. Gunawan B. Cakir M. Cameron S. Enders C. Liersch T. et al (2022). Evolutionary patterns of chromosomal instability and mismatch repair deficiency in proximal and distal colorectal cancer. Colorectal Dis.24, 157–176. 10.1111/codi.15946
12
Guinney J. Dienstmann R. Wang X. De Reyniès A. Schlicker A. Soneson C. et al (2015). The consensus molecular subtypes of colorectal cancer. Nat. Med.21, 1350–1356. 10.1038/nm.3967
13
Gupta S. (2022). Screening for colorectal cancer. Hematol. Oncol. Clin. North Am.36, 393–414. 10.1016/j.hoc.2022.02.001
14
Ionescu V. A. Gheorghe G. Bacalbasa N. Chiotoroiu A. L. Diaconu C. (2023). Colorectal cancer: from risk factors to oncogenesis. Med. (Mex.)59, 1646. 10.3390/medicina59091646
15
Kang N. Matsui T. S. Liu S. Fujiwara S. Deguchi S. (2020). Comprehensive analysis on the whole Rho-GAP family reveals that ARHGAP4 suppresses EMT in epithelial cells under negative regulation by Septin9. FASEB J.34, 8326–8340. 10.1096/fj.201902750RR
16
Kim Y. Kwon H. Park J. Nam S. H. Ha C. Shin S. et al (2023). Whole-genome sequencing in clinically diagnosed Charcot–Marie–Tooth disease undiagnosed by whole-exome sequencing. Brain Commun.5, fcad139. 10.1093/braincomms/fcad139
17
Kokuryo T. Sunagawa M. Yamaguchi J. Baba T. Kawakatsu S. Watanabe N. et al (2025). Whole-genome sequencing analysis of bile tract cancer reveals mutation characteristics and potential biomarkers. Cancer Genomics - Proteomics22, 34–40. 10.21873/cgp.20484
18
Lee-Six H. Olafsson S. Ellis P. Osborne R. J. Sanders M. A. Moore L. et al (2019). The landscape of somatic mutation in normal colorectal epithelial cells. Nature574, 532–537. 10.1038/s41586-019-1672-7
19
Li H. Durbin R. (2009). Fast and accurate short read alignment with Burrows–Wheeler transform. Bioinformatics25, 1754–1760. 10.1093/bioinformatics/btp324
20
Li J. Ma X. Chakravarti D. Shalapour S. DePinho R. A. (2021a). Genetic and biological hallmarks of colorectal cancer. Genes Dev.35, 787–820. 10.1101/gad.348226.120
21
Li X. Kumar S. Harmanci A. Li S. Kitchen R. R. Zhang Y. et al (2021b). Whole-genome sequencing of phenotypically distinct inflammatory breast cancers reveals similar genomic alterations to non-inflammatory breast cancers. Genome Med.13, 70. 10.1186/s13073-021-00879-x
22
Liang C. Niu L. Xiao Z. Zheng C. Shen Y. Shi Y. et al (2020). Whole-genome sequencing of prostate cancer reveals novel mutation-driven processes and molecular subgroups. Life Sci.254, 117218. 10.1016/j.lfs.2019.117218
23
Liu X. Li G. Ai L. Ye Q. Yu T. Yang B. (2019). Prognostic value of ATAD3 gene cluster expression in hepatocellular carcinoma. Oncol. Lett.18, 1304–1310. 10.3892/ol.2019.10454
24
Mateo J. Seed G. Bertan C. Rescigno P. Dolling D. Figueiredo I. et al (2020). Genomics of lethal prostate cancer at diagnosis and castration resistance. J. Clin. Invest.130, 1743–1751. 10.1172/JCI132031
25
Mauri G. Sartore‐Bianchi A. Russo A. Marsoni S. Bardelli A. Siena S. (2019). Early‐onset colorectal cancer in young individuals. Mol. Oncol.13, 109–131. 10.1002/1878-0261.12417
26
Meggendorfer M. Jobanputra V. Wrzeszczynski K. O. Roepman P. De Bruijn E. Cuppen E. et al (2022). Analytical demands to use whole-genome sequencing in precision oncology. Semin. Cancer Biol.84, 16–22. 10.1016/j.semcancer.2021.06.009
27
Mendelaar P. A. J. Smid M. Van Riet J. Angus L. Labots M. Steeghs N. et al (2021). Whole genome sequencing of metastatic colorectal cancer reveals prior treatment effects and specific metastasis features. Nat. Commun.12, 574. 10.1038/s41467-020-20887-6
28
Mendis S. Alcaide M. Topham J. T. Johnson B. Morin R. D. Chu J. et al (2020). Integration of whole-genome sequencing with circulating tumor DNA analysis captures clonal evolution and tumor heterogeneity in non-V600 BRAF mutant colorectal cancer. Clin. Colorectal Cancer19, 132–136.e3. 10.1016/j.clcc.2020.02.001
29
Okawa Y. Iwasaki Y. Johnson T. A. Ebata N. Inai C. Endo M. et al (2023). Hereditary cancer variants and homologous recombination deficiency in biliary tract cancer. J. Hepatol.78, 333–342. 10.1016/j.jhep.2022.09.025
30
Park K. Yoo H. Oh C. Lee J. R. Chung H. J. Kim H. et al (2022). Reciprocal interactions among Cobll1, PACSIN2, and SH3BP1 regulate drug resistance in chronic myeloid leukemia. Cancer Med.11, 4005–4020. 10.1002/cam4.4727
31
Parrini M. C. Sadou-Dubourgnoux A. Aoki K. Kunida K. Biondini M. Hatzoglou A. et al (2011). SH3BP1, an exocyst-associated RhoGAP, inactivates Rac1 at the front to drive cell motility. Mol. Cell42, 650–661. 10.1016/j.molcel.2011.03.032
32
Pei S. Liu T. Ren X. Li W. Chen C. Xie Z. (2021). Benchmarking variant callers in next-generation and third-generation sequencing analysis. Brief. Bioinform.22, bbaa148. 10.1093/bib/bbaa148
33
Purushothaman S. Meola M. Egli A. (2022). Combination of whole genome sequencing and metagenomics for microbiological diagnostics. Int. J. Mol. Sci.23, 9834. 10.3390/ijms23179834
34
Qin R. Wang X. Fan T. Wu T. Lu C. Shao X. et al (2024). Bilateral inflammatory recurrence of HER-2 positive breast cancer: a unique case report and literature review. Front. Oncol.14, 1276637. 10.3389/fonc.2024.1276637
35
Schlam D. Bagshaw R. D. Freeman S. A. Collins R. F. Pawson T. Fairn G. D. et al (2015). Phosphoinositide 3-kinase enables phagocytosis of large particles by terminating actin assembly through Rac/Cdc42 GTPase-activating proteins. Nat. Commun.6, 8623. 10.1038/ncomms9623
36
Schubert S. A. Ruano D. Tiersma Y. Drost M. De Wind N. Nielsen M. et al (2020). Digenic inheritance of MSH6 and MUTYH variants in familial colorectal cancer. Genes. Chromosom. Cancer59, 697–701. 10.1002/gcc.22883
37
Song B. Xu C. Zhang Y. Shan Y. (2023). Circ_ATAD3B inhibits cell proliferation of breast cancer via mediating the miR-570-3p/MX2 axis. Prev. Med.173, 107568. 10.1016/j.ypmed.2023.107568
38
Spaander M. C. W. Zauber A. G. Syngal S. Blaser M. J. Sung J. J. You Y. N. et al (2023). Young-onset colorectal cancer. Nat. Rev. Dis. Primer9, 21. 10.1038/s41572-023-00432-7
39
Sun T. Tong W. Pu J. Yu Z. Kang Z. (2023). SH3BP1 regulates melanoma progression through race1/wace2 signaling pathway. Clin. Med. Insights Oncol.17, 11795549231168075. 10.1177/11795549231168075
40
Tao Y. Hu K. Tan F. Zhang S. Zhou M. Luo J. et al (2016). SH3-domain binding protein 1 in the tumor microenvironment promotes hepatocellular carcinoma metastasis through WAVE2 pathway. Oncotarget7, 18356–18370. 10.18632/oncotarget.7786
41
Teng H. Gao R. Qin N. Jiang X. Ren M. Wang Y. et al (2018). Identification of recurrent and novel mutations by whole-genome sequencing of colorectal tumors from the Han population in Shanghai, eastern China. Mol. Med. Rep.18, 5361–5370. 10.3892/mmr.2018.9563
42
Thabet S. Sghaier S. Ben Hassine T. Slama D. Ben Osmane R. Ben Omrane R. et al (2023). Characterization of epizootic hemorrhagic disease virus serotype 8 in naturally infected barbary deer (Cervus elaphus barbarus) and culicoides (Diptera: Ceratopogonidae) in Tunisia. Viruses15, 1567. 10.3390/v15071567
43
Wan J. C. M. Stephens D. Luo L. White J. R. Stewart C. M. Rousseau B. et al (2022). Genome-wide mutational signatures in low-coverage whole genome sequencing of cell-free DNA. Nat. Commun.13, 4953. 10.1038/s41467-022-32598-1
44
Wang J. Feng Y. Chen X. Du Z. Jiang S. Ma S. et al (2018). SH3BP1‐induced Rac‐Wave2 pathway activation regulates cervical cancer cell migration, invasion, and chemoresistance to cisplatin. J. Cell. Biochem.119, 1733–1745. 10.1002/jcb.26334
45
Xu R. Du A. Deng X. Du W. Zhang K. Li J. et al (2024). tsRNA-GlyGCC promotes colorectal cancer progression and 5-FU resistance by regulating SPIB. J. Exp. Clin. Cancer Res.43, 230. 10.1186/s13046-024-03132-6
46
Yang L. Xu Q. Li J. (2024). Prognostic impact of ARHGAP43(SH3BP1) in acute myeloid leukemia. J. Formos. Med. Assoc.123, 992–1003. 10.1016/j.jfma.2024.04.002
Summary
Keywords
colorectal cancer, whole genome sequencing, somatic mutation, germline mutation, cancer susceptibility gene, SH3BP1
Citation
Sheng Y, Niu S, Li D, Meng C and Wang T (2025) Exploring potential therapeutic targets for colorectal tumors based on whole genome sequencing of colorectal tumors and paracancerous tissues. Front. Mol. Biosci. 12:1605117. doi: 10.3389/fmolb.2025.1605117
Received
02 April 2025
Accepted
12 May 2025
Published
04 July 2025
Volume
12 - 2025
Edited by
Xiang Li, Nanjing University of Chinese Medicine, China
Reviewed by
Hailin Tang, Sun Yat-sen University Cancer Center (SYSUCC), China
Sishen Sun, Ruijin Hospital North, China
Updates
Copyright
© 2025 Sheng, Niu, Li, Meng and Wang.
This is an open-access article distributed under the terms of the Creative Commons Attribution License (CC BY). The use, distribution or reproduction in other forums is permitted, provided the original author(s) and the copyright owner(s) are credited and that the original publication in this journal is cited, in accordance with accepted academic practice. No use, distribution or reproduction is permitted which does not comply with these terms.
*Correspondence: Chunyuan Meng, njmumcy@163.com; Tong Wang, aanti@163.com
†These authors have contributed equally to this work
Disclaimer
All claims expressed in this article are solely those of the authors and do not necessarily represent those of their affiliated organizations, or those of the publisher, the editors and the reviewers. Any product that may be evaluated in this article or claim that may be made by its manufacturer is not guaranteed or endorsed by the publisher.